Article

Chemical Composition and Spectroscopic Characteristics of Heat-Treated Rubies from Madagascar, Mozambique and Tanzania

1
School of Gemology, China University of Geosciences, Beijing 100083, China
2
Wuzhou Gemstone Vocational School, Wuzhou 543002, China
*
Author to whom correspondence should be addressed.
Crystals 2023, 13(7), 1051; https://doi.org/10.3390/cryst13071051
Submission received: 31 May 2023 / Revised: 28 June 2023 / Accepted: 29 June 2023 / Published: 2 July 2023
(This article belongs to the Topic In-Situ Study of Mineralogy, Gemology and Progress in Gemology)
(This article belongs to the Section Mineralogical Crystallography and Biomineralization)

Abstract

:
The chemical composition and spectra of rubies heat-treated with high temperatures (above 1200 °C) from Madagascar, Mozambique and Tanzania were analyzed by electron microprobe, LA-ICP-MS, Fourier transform infrared spectroscopy, Raman spectroscopy and UV-VIS spectroscopy. Compared with untreated rubies, the red hue of treated ruby intensifies while its blue tint diminishes, leading to increased cracks. The infrared spectra exhibit a distinct absorption peak at 3738 cm−1, attributed to water because of thermal treatment. After heat treatment, the absorption intensity decreases. Ultraviolet radiation reveals an enhancement in the electron transition of Cr3+ and ion transition of Fe3+ and Fe2+, with a shift towards shorter wavelengths observed in the absorption bandwidth. These can be utilized to indicate the basis of ruby identification through heat treatment.

1. Introduction

Ruby is a very precious gemstone and color is the most important factor in determining its quality and value. To enhance their color, rubies have long been treated with various methods such as laser treatment [1], ion implantation [2], and heat treatment. Heat treatment, in particular, is commonly used and accounts for most of the rubies on the market [3,4]. The heat treatments are divided into low (below 1200 °C) and high temperatures (above 1200 °C) [5].
Previous studies have demonstrated that low-temperature treatment can effectively eliminate the blue tone [6]. This treatment induces several characteristic shifts in the ruby spectra. For instance, in the IR spectra, the peaks at 3232 and 3185 cm−1 appear at 800 °C, which correspond to the stretching vibrations of the OH bond [7]. At 900 °C, the peaks at 3310 cm−1 significantly weaken. The peak at 2695 cm−1 is generally considered the fingerprint peak of the Ti-Mg solid solution in rubies, while that at 3909 cm−1 is associated with the Fe-Mg solid solution. After low-temperature heat treatment, the structure and concentration of these solid solutions may change, leading to alterations in the position and strength of the peaks at 2695 cm−1 and 3909 cm−1. [8]. Moreover, the K absorption bands from 210 nm to 250 nm in UV-VIS-NIR are characteristic of the symmetric conjugate system and result from the ultraviolet absorption band caused by the electron transition of Cr3+ ions in rubies. Variations in peak and valley positions and intensities can determine the concentration and oxidation state of Cr3+ ions. [9]
At higher temperatures, the blue core of ruby fades and the concentrations of Fe and Fe3+/Cr3+ show a nearly linear increase [6]. The IR spectra reveal a strong absorption peak at around 800 cm−1 due to the solid solution of ferrous oxide (FeO) in the ruby. This indicates that part of the aluminum in the ruby has oxidized to form a solid solution of Al2O3 and Fe2O3. This peak is observed at 1400 °C. As the temperature further increases, this peak weakens while the 1420 cm−1 absorption peak becomes more prominent again at 1200 °C and 1400 °C. At a temperature of 1600 °C, both of these absorption peaks disappear. In the UV-VIS-NIR spectra, absorption bands of 400 nm and 550 nm are enhanced. The absorption peak at 400 nm is due to a strong transition of Cr3+ ions, whose location and strength depend on the concentration and oxidation state of Cr3+ in the ruby. Therefore, during the study, the absorption peak at 400 nm changed with the mixed melting process. The absorption peak near 550 nm is related to the iron content. Experimental results demonstrate that the ratio of Fe and Al on the surface of rubies changes after mixing and melting, leading to the alteration of the absorption peak at 550 nm [10].
Our research previously focused on studying the effects of low-temperature heat treatment on rubies from Mozambique and Madagascar [11]. Compared to natural rubies, we found that after heating at 900 °C the blue-purple decreased while the red saturation increased in rubies from both areas. Additionally, we observed a decrease in the content of Fe and Ti, as well as an increase in Cr in the heat-treated rubies from both areas.
Based on this previous work, we expanded our research to study rubies from Madagascar, Mozambique and Tanzania that were treated with high temperatures. Using microscopic observation, UV-visible spectra, Infrared spectra, Raman spectra and electron probe, we compared the changes in chemical composition and spectral characteristics between treated and untreated rubies, which is crucial for distinguishing between heat-treated and untreated rubies, providing a theoretical basis for identifying high-temperature heat-treated rubies.

2. Samples and Methods

2.1. Treatment Experiment and Analysis Method
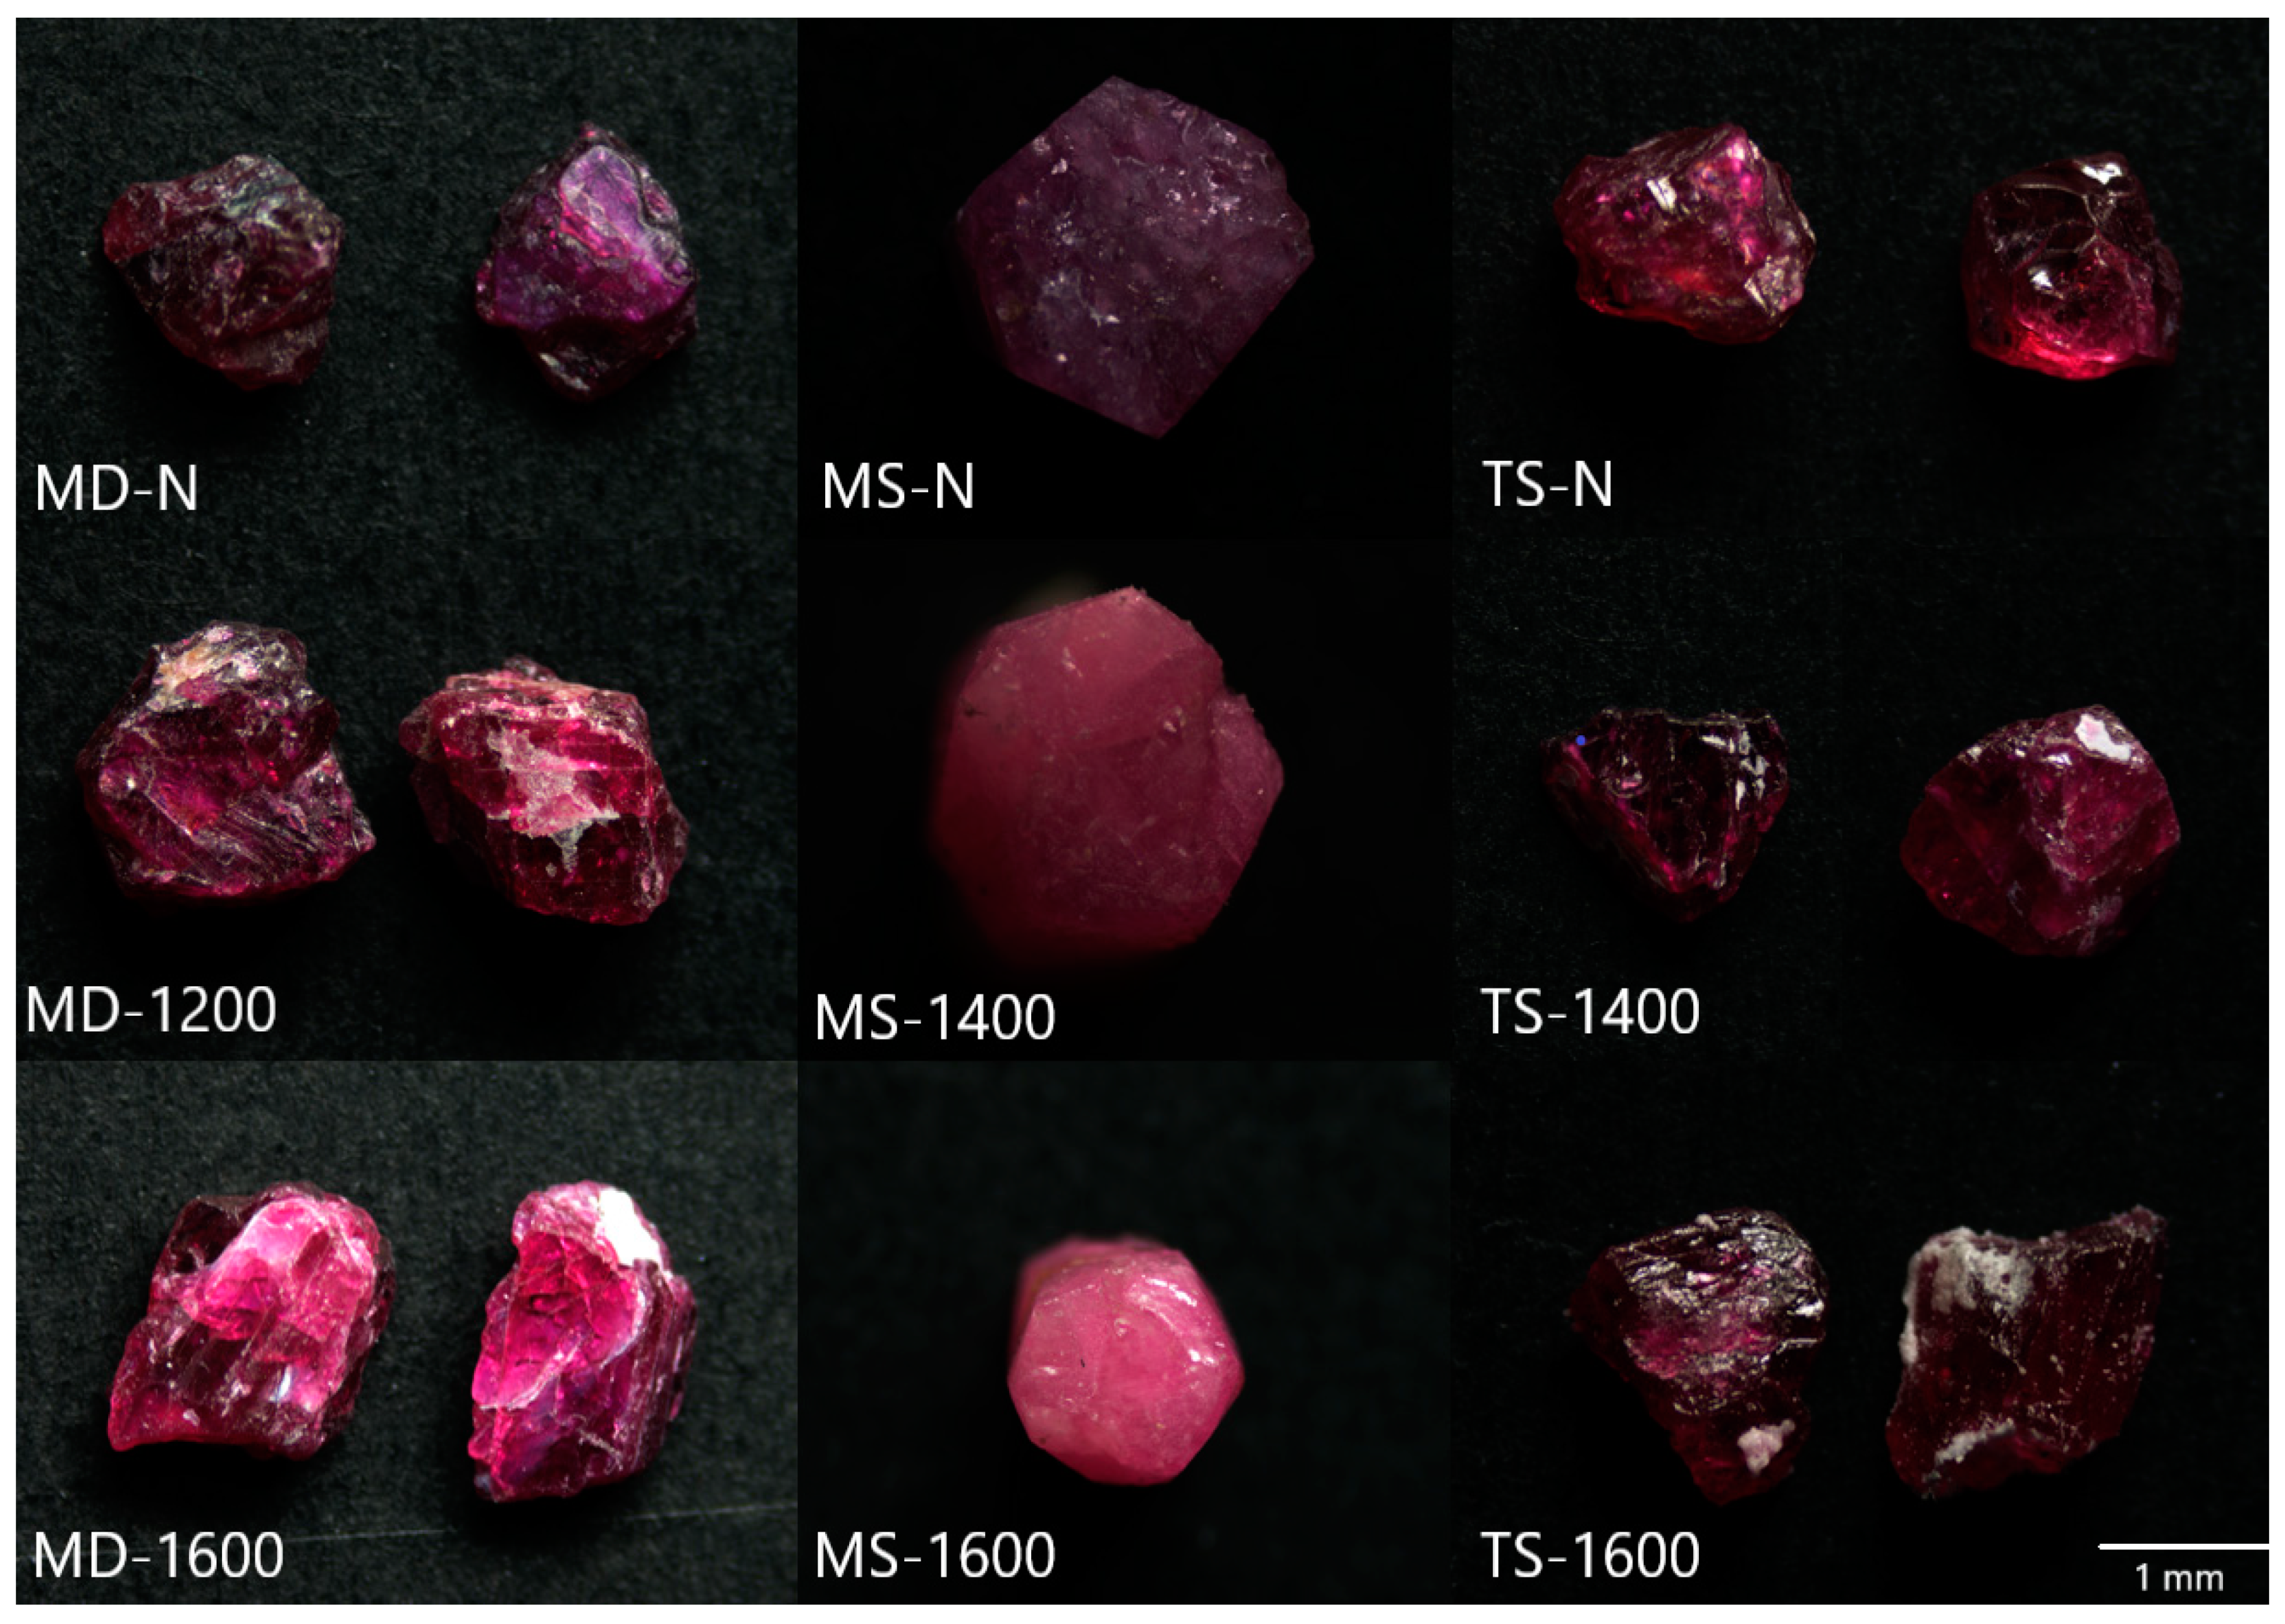
Due to the poor transparency of some parts of some samples, they were sliced and examined for surface and internal characteristics under polarized light. The polarizing observations were conducted at the Gemology Experimental Center of China University of Geosciences (Beijing, China) with an Olympus BX51 polarizing microscope.
The thermal experiments were carried out at the State Key Laboratory of Biogeography and Environmental Geology, China University of Geosciences (Beijing, China). Prior to the heat treatment, isopropanol was used to clean the original samples and remove any impurities or contaminants. Then, the samples were put into the muffle furnace (SX2-4-10, Tianjin Central Experimental Electric Furnace Co., LTD., Tianjin, China). The furnace was heated to the corresponding temperature (1200 °C, 1400 °C, 1600 °C) at a rate of 10 °C/min and maintained temperature for 12 h in an open crucible (oxidation atmosphere). The ruby samples were subsequently cooled in the air for further testing.
Color distribution and inclusion were examined through a GI-MP22 binocular microscope. Raman spectra were obtained with an HR-Evolution micro laser confocal Raman spectrometer. The laser wavelength was 532 nm, the pulse time ranged from 3 to 10 s, the scanning time ranged from 3 to 10 s, and the wave number ranged from 0 to 1500 cm−1. To account for the strong fluorescence in rubies, measured Raman spectra were calibrated against a certain baseline to ensure greater accuracy. The chemical composition of both the heat-treated and untreated samples were analyzed using a Shimadzu EMPA-1720, Japan. The test conditions were as follows: the temperature was 18.0 °C, humidity was 34.5% RH, acceleration voltage was 15 kV, beam spot diameter was 5 μm, beam current was 10.0 nA, peak value and background value counting time were 10 s, and the correction method was ZAF.
The ordinary Tensor 27 Fourier infrared spectrometer for the ruby sample, using the reflection method for the samples, took 16 s to perform 32 scans of both the background and sample, covering a range of 400 to 800 cm−1. The micro infrared spectrum testing instrument was a Brooker LUMOS micro infrared spectrometer. The samples were analyzed using the ATR crystal method with low pressure, a resolution of 4 cm−1, 32 scanning times, and a range of 1500–4000 cm−1. The ultraviolet-visible spectrum was obtained using a GEM-3000 jewelry detector with a wavelength range of 300~900 nm and a sampling interval of 1 s. Real-time monitoring and reflection testing were conducted at a frequency of 230 [11]. The trace elements were collected by laser-ablative inductively coupled plasma mass spectrometry (LA-ICP-MS), Angilent 7900. The test conditions were as follows: energy density 6.0 J/cm2, laser beam spot 32 μm, and denudation time 40 s. NIST610 and NIST612 were selected as the external standard samples, and Al was selected as the internal standard element based on the date from the electron probe. Through the analysis process, the detection limit varied slightly but was generally <10%. The detection limits of LA-ICP-MS for Mg, V, Ti, Ga, and Fe are 0.1–0.3 ppm, 0.03–0.2 ppm, 1–3 ppm, 3–5 ppm and 5–20 ppm, respectively [12,13].

2.2. Samples

Four rubies were selected from Madagascar (MD) and Tanzania (TS) and three rubies from Mozambique (MS). The samples were cut into parts, one for heat treatment and the other for the comparison test. The samples were named according to the abbreviation of origin, sample order and heated temperature. Due to the excessive heat treatment time, no further testing was conducted on the powdery sample of MS-1200. The gemological properties of ruby samples are summarized in Table 1.

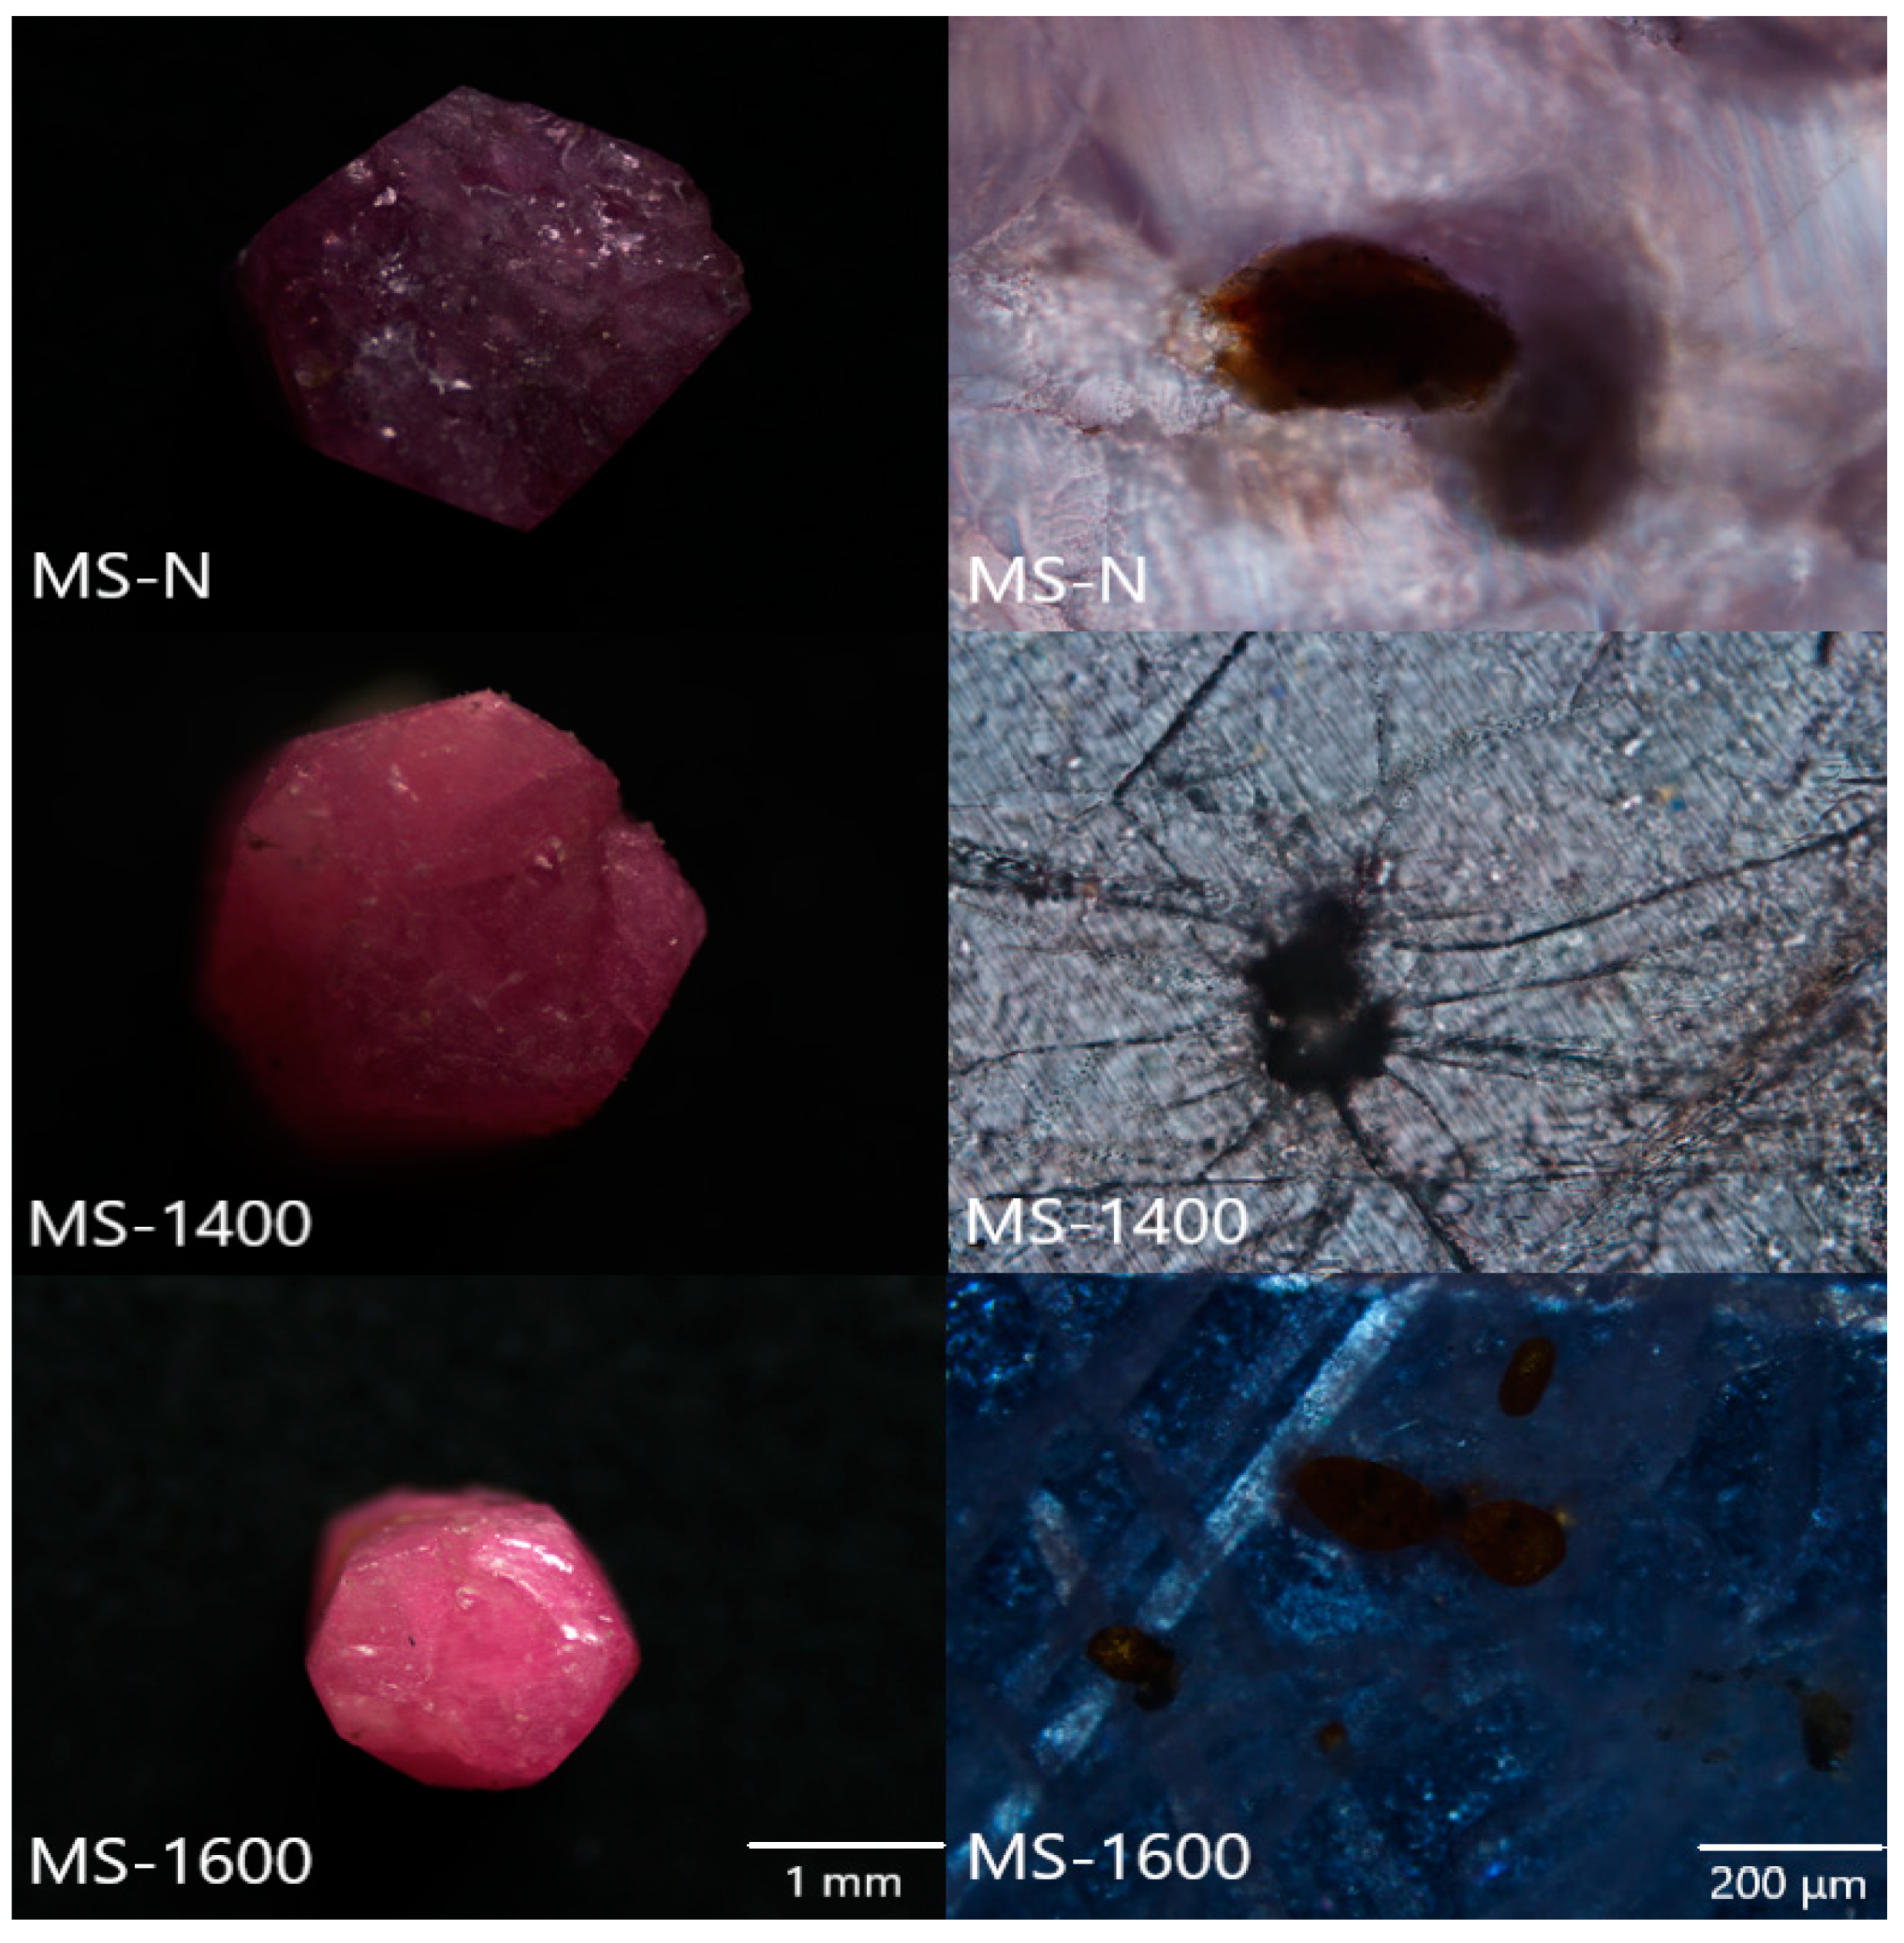
2.3. Surface and Interior Characteristics

The corundum of different origins investigated in this paper show different morphology, chemical composition, and inclusions. As the heat treatment temperature increases, the color of Madagascar rubies changes from purple to pink purplish. In particular, samples (MD-N) exhibit astigmatism caused by cracks. Ruby samples from Mozambique usually have hexagonal columns (MS-1400) or plates (MS-N). The color of the crystals varies, with the samples having a burgundy to dark orange-red tint. The Tanzania sample (TS-1400) shows three distinct groups of fracture (Figure 1).
The surface and internal characteristics of heat-treated rubies differ from those of natural ones. Heat treatment reduced the chaos and enhanced the red tone while causing the white cosolvent. Pardieu discovered that low-temperature heat treatment caused inclusions to melt, resulting in disk cracks and dissolved rutile spicules inside Mozambique samples [6].
The MS-N sample exhibits reddish-brown disk inclusions, which are also present in the MS-1400 (Figure 2 and Figure 3). However, stress cracks and healing cracks caused by thermal expansion are observed around it. Notably, a small negative crystal with growth structures visible at the edges was observed in TS-1600. Subsequent identification of inclusions can be further confirmed by Raman testing (Figure 4).

3. Results

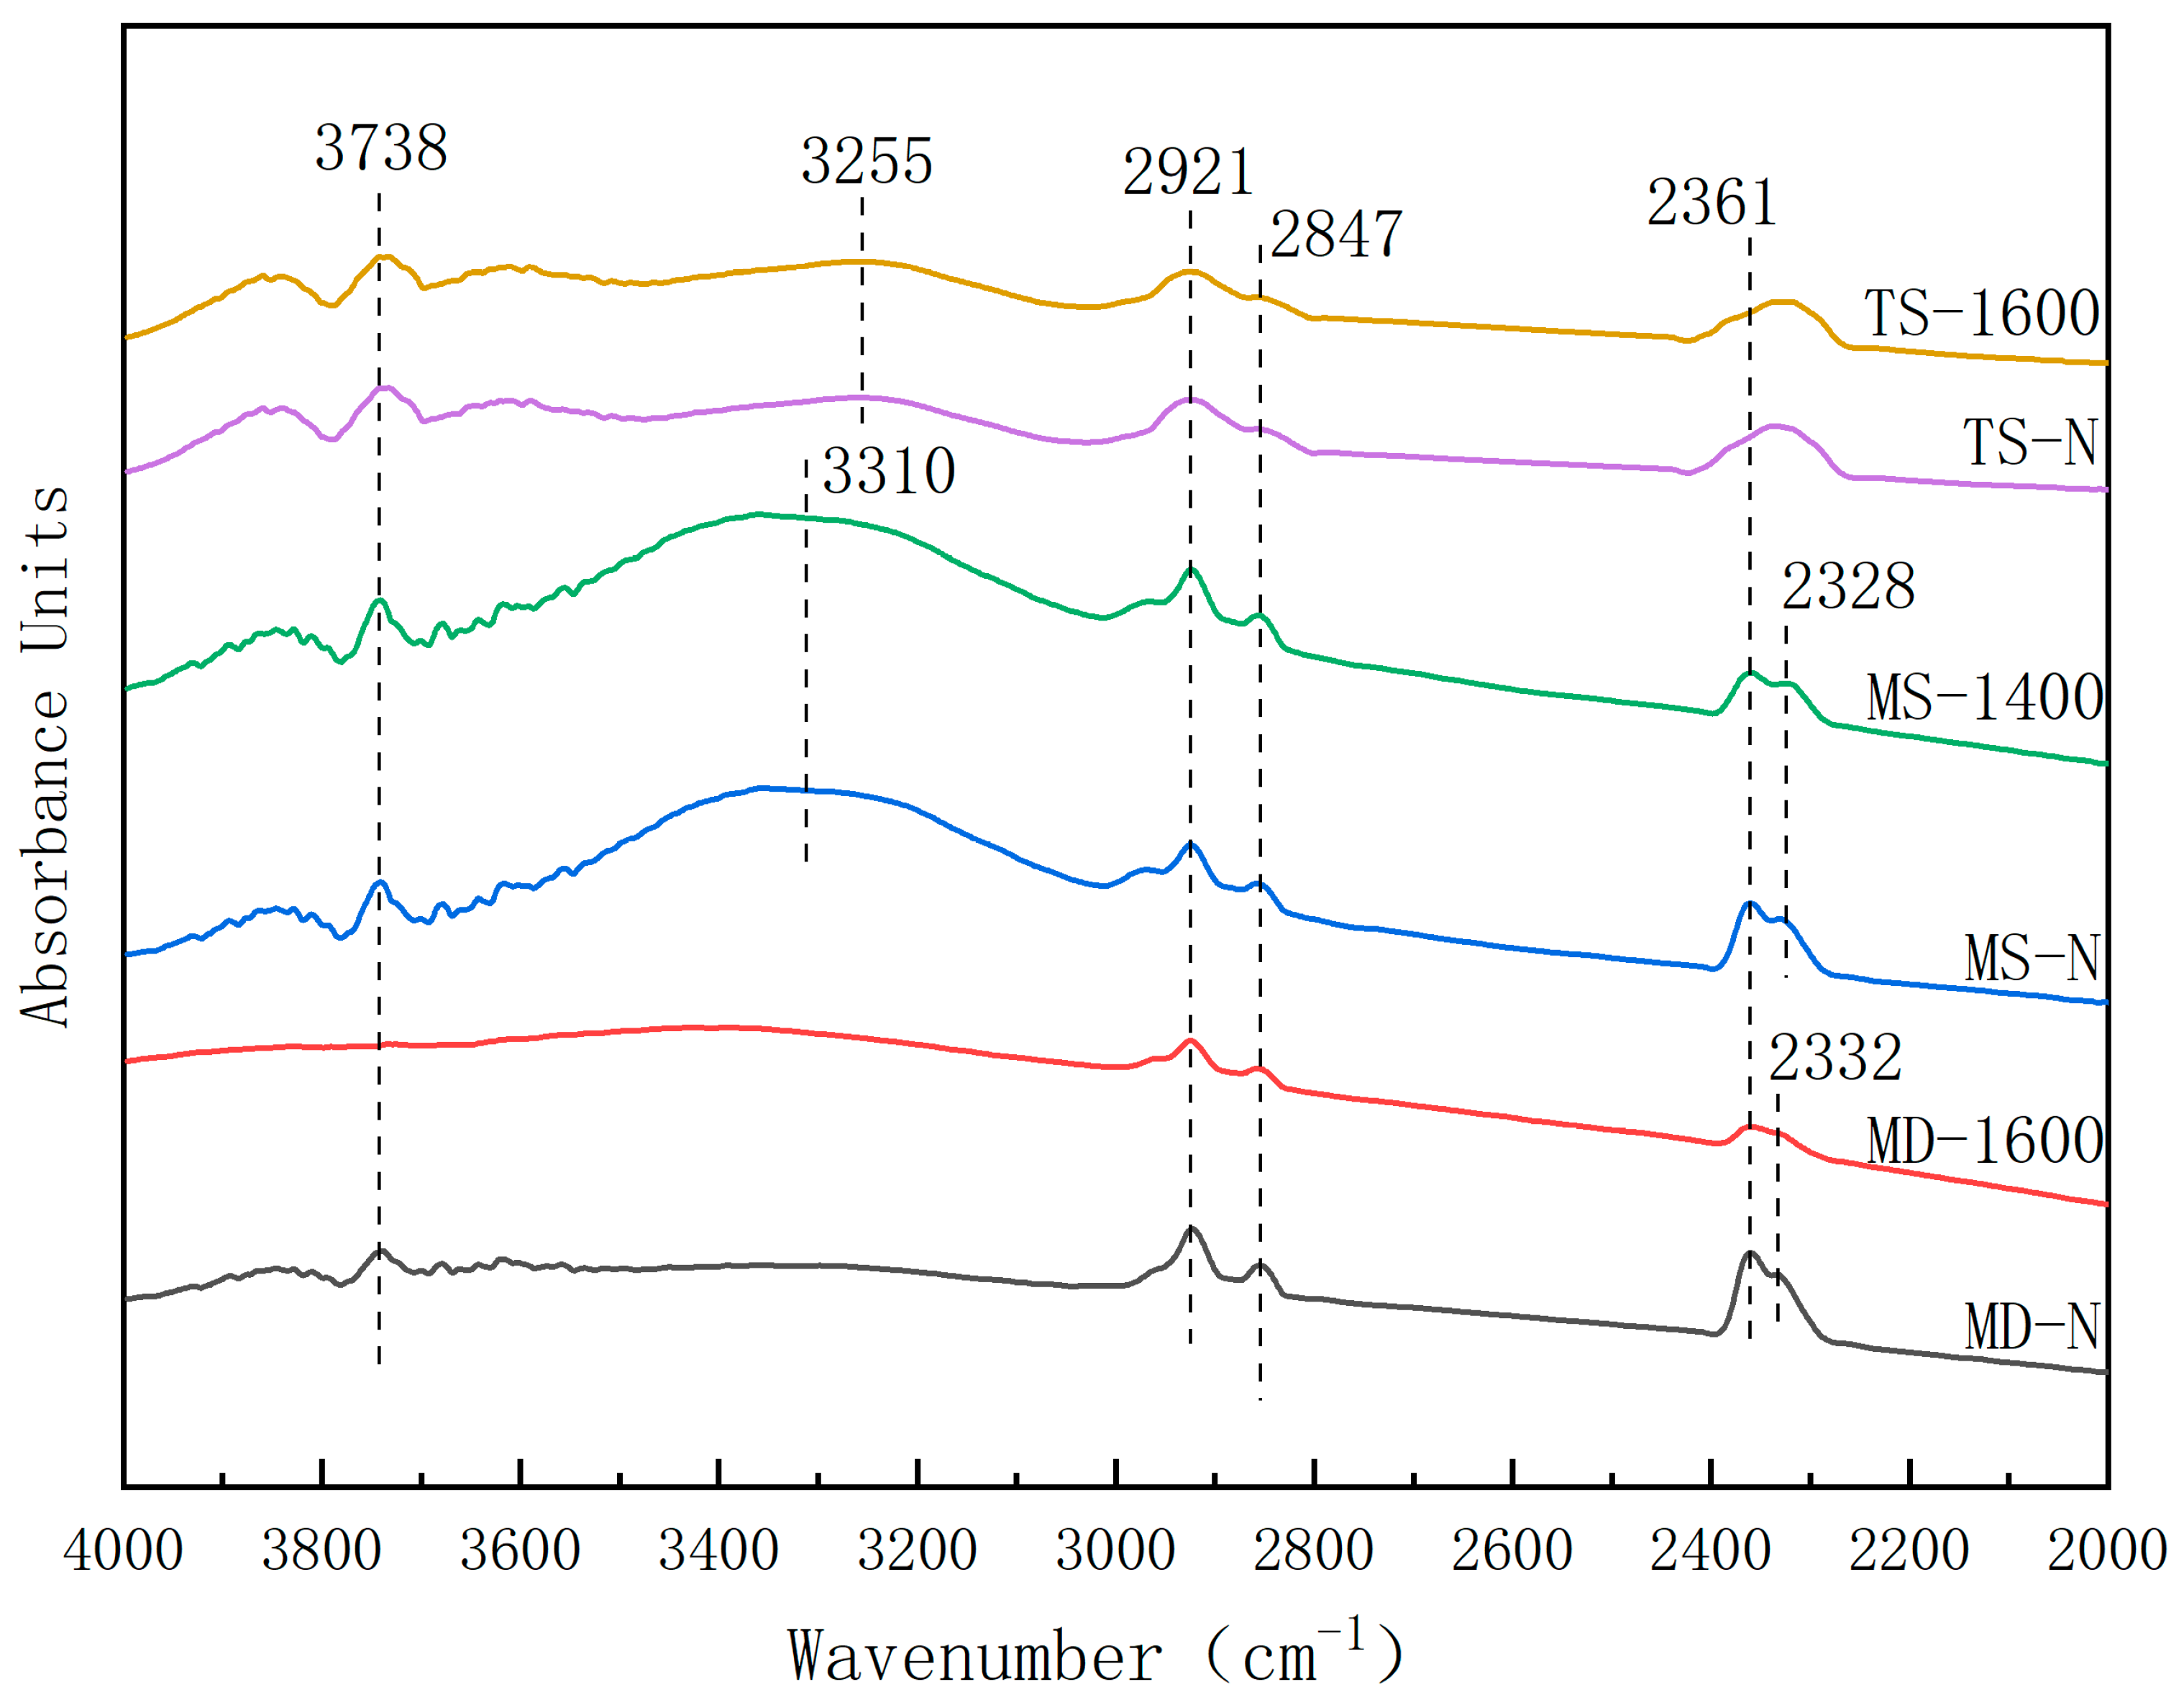
3.1. Infrared Spectra

The samples (MD-N, MD-1600, MS-N, MS-1400, TS-N, TS-1200, TS-1400 and TS-1600) were selected for infrared spectra analysis. The results are presented in Figure 5 and Figure 6. The spectral images of all samples within the 400–800 cm−1 range exhibit similarities. Therefore, we selected the most representative samples from Tanzania to include in this analysis (Figure 5).
There are five characteristic absorption peaks within the 400~800 cm−1 range, which exhibit slight deviations from the standard spectral peaks. The specific causes can be expressed as follows: the optical mode of rubies is typically expressed as:
Tg = 2A1g + 3A2g + 5Eg + 2A1u + 2A2u + 4Eu
where 2A2u + 4Eu denotes infrared activity. The coordination structure of chromium atoms in rubies was analyzed to obtain this result. Therefore, rubies have one vibration mode between 300 and 400 cm−1 and five vibration modes between 400 and 800 cm−1, theoretically [14]. They are intrinsic peaks of ruby, including weak absorption peaks at 428 cm−1 and 460 cm−1, medium absorption peaks at 484 cm−1 and 630 cm−1, and a strong absorption peak at 516 cm−1, which are associated with Al-O vibration. The legend shows that TS-1200 has the highest peak intensity. TS-1400 has medium intensity, while TS-1600 demonstrates a strength comparable to that of TS-N. Notably, there is a small absorption peak of about 500 cm−1 in TS-N, while the wave peak of heat-treated samples is discernably different and holds certain indicative significance.
Absorption peaks at 3738 cm−1 and 3500–3750 cm−1 were observed in the MD-N samples (Madagascar) which were not detected in the MD-1600 samples. It is speculated that the high temperature of 1600 °C leads to a decrease or even disappearance of free water molecules, resulting in the absence of the absorption peak at 3738 cm−1 [10]. The characteristic bimodal strength of 2332 cm−1, 2361 cm−1, 2847 cm−1 and 2921 cm−1 decreased in MD-1600, while the characteristic bimodal strength of 2328 cm−1 and 2361 cm−1 decreased in MS-1400, which may be due to the melting of inclusions at high temperatures (Figure 6). However, the declines of 2361cm−1, 2332cm−1 and 3738cm−1 peaks in Tanzanian and Mozambican samples were not significant.
After heating at 900 °C, the infrared spectrum of Madagascar ruby samples show a significant weakening of the weak absorption peak at 3310 cm−1 [8]. The appearance of new peaks at 3236 cm−1 is attributed to Si-H stretching vibrations from hydrogen ions in the optical absorption cavity. The heat treatment causes hydrogen atoms to diffuse into the optical absorption cavity [6]. The peaks at 3310 cm−1, 3236 cm−1 and 3186 cm−1 are commonly referred to as the 3309 cm−1 series, which provides evidence of OH stretching vibration [15].

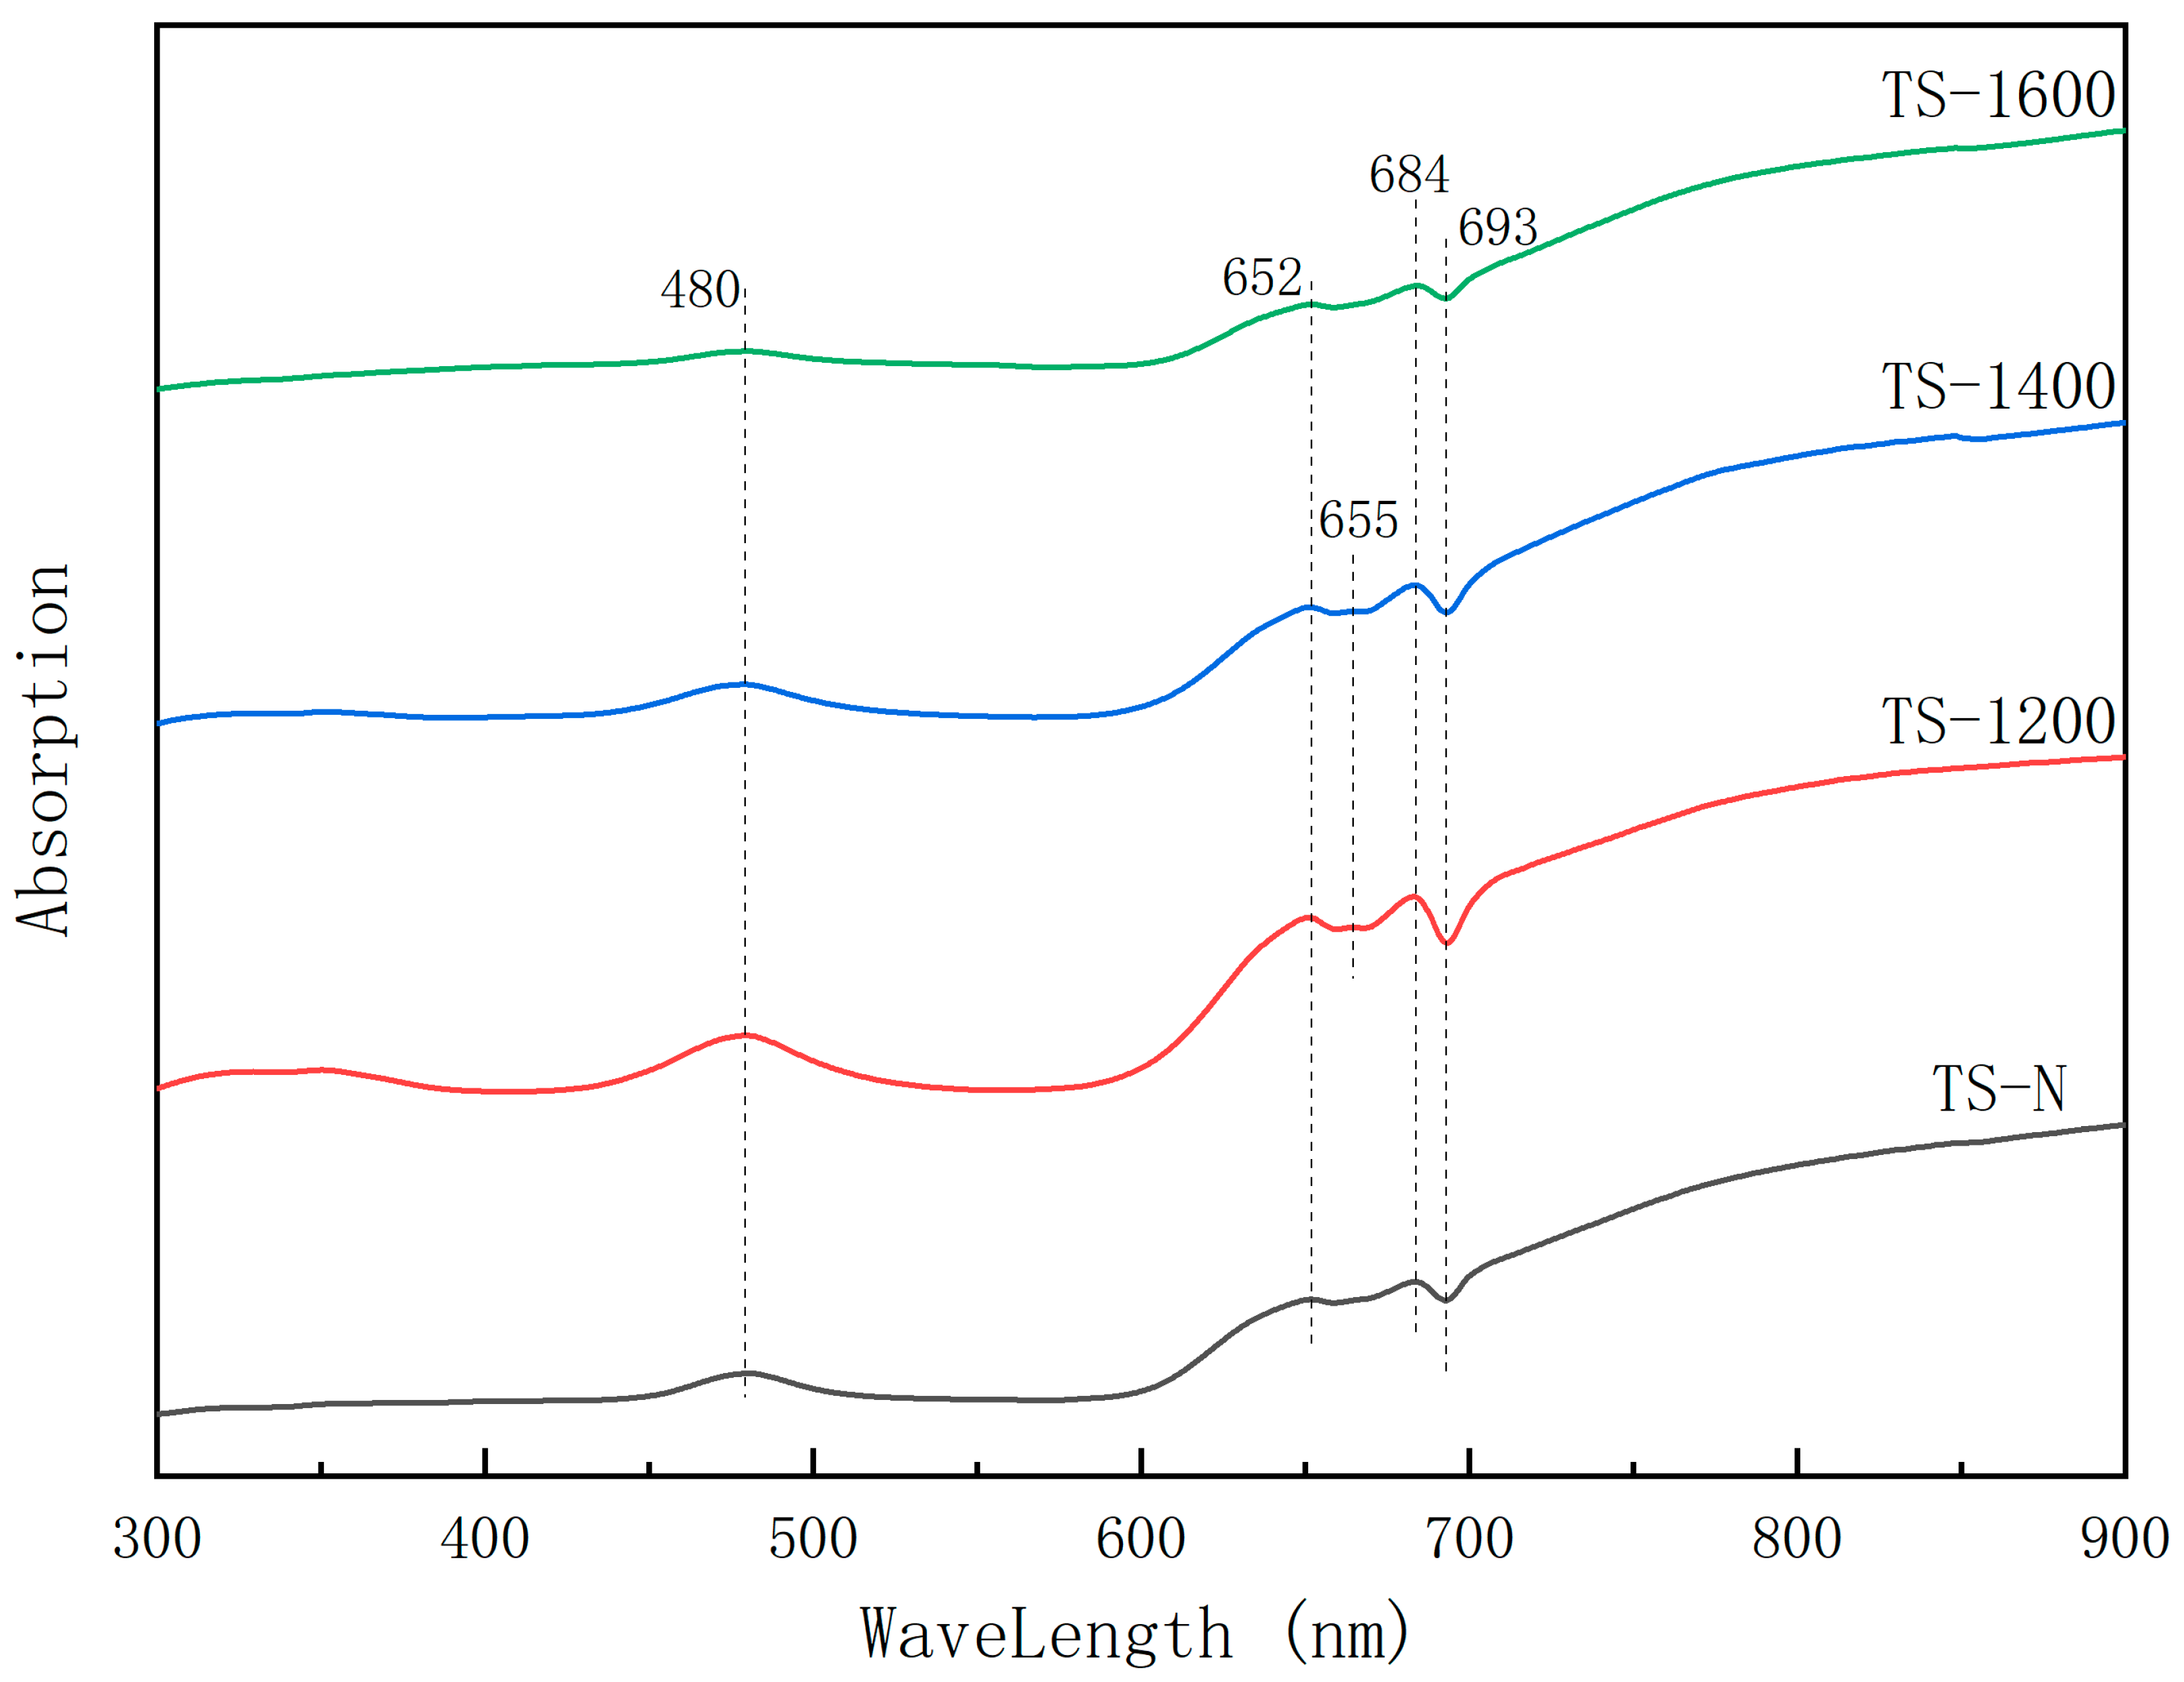
3.2. UV-Visible Spectra

The samples (MD-N, MD-1200, MD-1600, MS-N, MS-1400, MS-1600, TS-N, TS-1200, TS-1400 and TS-1600) were selected for ultraviolet-visible spectrum testing and plotted in Figure 7, Figure 8 and Figure 9 to compare the spectra of natural and heat-treated samples. According to the literature and our previous research, the absorption band of the sample treated at 900 °C is located at 555 nm due to the gradual movement of Cr3+ from a ground state to 4A2g→4T1g [16,17]. After heat treatment, a significant reduction in absorption was observed [6]. There is no obvious U-band center or Y-band center in these samples. The absorption spectrum line is smooth and broad, resulting in a darker mixed complementary [18] color and ultimately leading to a dark red hue [19]. It is speculated that, due to the high content of Cr3+, the absorption U and Y broad bands are combined, which is in agreement with the conclusions drawn from electron probe analysis and fluorescence testing indicating strong red fluorescence and good transmittance in most gemstones. The absorption peak of 843 nm was clearly observed in the MD-1200 and MD-1600 samples, indicating that this temperature can enhance the Ti4+-Fe2+ charge transfer, thus making the sample more bluish-green and brightening. In MS-N and MS-1600 samples (Figure 8), a wide absorption band of 305~308 and a wave crest of 375 nm can be observed, which are the 6A1-4E1 transition of Fe3+ and the ion transition of Fe2+-Fe3+ [20,21,22]. It is speculated that the absorption band of 370 nm overlaps with that of 400 nm, resulting in an absorption band that skews towards shorter wavelengths [21]. In the TS-1200 and TS-1400 samples, we clearly observe the absorption peak at 665 nm and the increases of the peaks at 652 and 684 nm, which highlights that the treatment at this temperature can increase both the d-d electronic transition and the spin-forbidden transition of Cr3+ ions [23]. Table 2 lists the primary absorption bands and the factors that cause them, which helps to understand the peaks in Figure 5, Figure 6 and Figure 7.

3.3. Raman Spectra Tests

Raman tests were utilized to identify the inclusion types, including zircon, Dias bauxite, rutile, and calcite rutile symbiotic inclusions (Figure 10a–d). We placed the Raman peak of the inclusion above that of the ruby matrix. The sample exhibits strong fluorescence, so specific bands are extracted from the Raman spectrum for analysis to avoid data clutter.
Zircon inclusions have a complete crystalline form and are typically short columnar, composed of tetragonal prism and tetragonal dipyramid. The boundaries appear round and melted with sharp spectral peaks at 361 and 1016 cm−1 and weak spectral peaks at 200, 223, 439 and 982 cm−1. The spectral peak of 1016 cm−1 is related to the antisymmetric stretching vibration of the [SiO4] group, while that at 982 cm−1 is attributed to its symmetric stretching vibration. The peak of the 439 cm−1 spectrum is related to the bending vibration of the [SiO4] group, and that at 356 cm−1 is associated with the translational vibration of Si-Zr. Peaks at 200 and 223 cm−1 are correlated with the translational vibration of Zr-[SiO4] [26,27,28].
Diaspore belongs to the rhombic system, and its outline in rubies is typically irregular. In the Raman spectra, there are spectral peaks at 156, 286, 330, 447, 792 and 1192 cm−1. Notably, sharp spectral peaks with small half-heights and widths were observed at 156, 339 and 447 cm−1, which highlight the good degree of crystallization of hard alumina in Tanzania rubies [29,30].
Rutile inclusions are widely distributed in rubies in the form of needles and double crystal growths. The monomorphism is a tetragonal prism or tetragonal dipyramid. The Raman spectra exhibit not only the characteristic displacement of rutile at 231, 445 and 610 cm−1 but also spectral peaks of the ruby matrix at 417 and 750 cm−1 [28].
Calcite, which is a common inclusion in rubies, exhibits a higher interference color sequence under orthogonal polarized light, and a typical rhombic cleavage [31,32]. Inclusions formed by the association of calcite and rutile are observed in the MS-N sample. The symbiosis inclusions of calcite and rutile are observed in the MS-N sample [33]. Raman spectra exhibit combined spectral peaks of ruby matrix, rutile and calcite. Among these, 416 and 446 cm−1 are the matrix spectral peaks, while 238a and 610 cm−1 are the rutile spectral peaks, and 153 and 1407 cm−1 are the spectral peaks of calcite [34], with the former being attributed to CO32- lattice vibration.
There are characteristic inclusions in different areas of the rubies. There are rutile needle and crystal inclusions in the rubies from Madagascar; zircon, rutile needle, rutile geniculate twin crystal, calcite-rutile symbiotic combination inclusions in those from Mozambique; and calcite, rutile needle, diaspore inclusions in those from Tanzania. Rutile is a common inclusion in rubies from all three regions; however, its distribution and morphology are variable. In the rubies from Mozambique, rutile inclusions consist of abundant geniculate biocrystals and rutile needles with varying shapes and lengths. Rutile needles are widely distributed in Tanzania rubies, while they are less abundant and of shorter length than those from Madagascar [2].

3.4. Scanning Electron Microprobe Analyses

The scanning electron microprobe data of natural and heat-treated rubies are shown in Table 3. Due to the higher accuracy of LA-ICP-MS, we only used electrical detection as a reference. Specific element analysis can be found in the LA-ICP-MS analysis. The following conclusions were obtained:
In Madagascar rubies (MD), the Cr content increases significantly with heat treatment at 1200 °C and then decreases slightly at 1600 °C, while Fe content increases significantly and progressively with increasing temperature. In the case of rubies from Mozambique (MS), as the temperature increases, the Cr content decreases while the Fe content initially increases and then, subsequently, reaches a steady state. In the case of Tanzania rubies (TS), as the temperature increases, the Cr content increases slightly and the content of Fe decreases. Presumably, heat treatment causes Fe ions to diffuse to the surface, then oxidize and deposit on the crystal surface and internally diffuse, resulting in changes in ion concentration [35,36,37]. And the Ti content increases obviously.

3.5. LA-ICP-MS Analysis

Samples (MD-N, MD-1200, MD-1600, MS-N, MS-1400, MS-1600, TS-N, TS-1200 and TS-1600) were analyzed by LA-ICP-MS. Three points per sample were tested and the average values of the main trace elements were calculated for comparison purposes (Table 4).
In the heat-treated samples from Madagascar, significant changes in the contents of most of the elements are observed. Cr content increased significantly, causing an enhancement in the red tone and saturation of the sample. The Fe content showed a slight increase. The Ti content initially increased and subsequently decreased, while the contents of Mg, Ga and V decreased. However, no apparent change was observed in the blue-purple tone upon naked-eye observation. The Cr content of the Mozambique sample increased after 1400 °C. The Cr content in the Mozambique sample is the highest at 1400 °C, while Fe content increased significantly after heating. Meanwhile, Ti, Mg, Ga and V content decreased correspondingly after heat treatment, but the difference between different temperature gradients is not significant. In the Tanzania sample, Cr is highest at 1600 °C and Fe is highest at 1400 °C; other elements are not significant.
During the process of heat treatment, some ions (such as Mg, Ga, V) tend to precipitate out due to their migration and diffusion towards the surface. Consequently, there is a decrease in ion concentration within the internal slice. The significant increase of Cr ions can be attributed to various factors, including lattice structure, oxidation state, and the presence of impurity elements and others that affect the diffusion of Cr elements.

4. Discussion

In this work, the thermal treatments on the rubies have been conducted in an open environment (oxidizing) and other types of gaseous environments have not been considered. For instance, Beryllium heat treatment causes rubies to take on a more vivid red color [38]. The mixed gas environment of hydrogen and oxygen causes the samples to turn from red to orange [39]. In a nitrogen environment, rubies appeared yellow. Therefore, further investigation can be conducted on diverse environments.
According to the electron probe analysis, heat treatment in an oxidizing environment can increase the Cr/Fe value while decreasing the Fe/Ti value at high temperatures. However, the variations in contents of Cr, Fe, Ti and other elements differ according to the chemical composition of the different areas of the gems and the temperature of the treatment. Particularly, although the heat treatment temperature of some samples was not high, severe dehydration and powdering occurred. We can hypothesize that the samples were subjected to an excessively long constant temperature time, resulting in poor treatment effectiveness. Therefore, the optimal heat treatment temperature of rubies depends on their quality and source, as well as the duration of constant temperature exposure [40].
The samples subjected to high temperature show conspicuous fissures and fingerprint inclusions. The melting, crushing and diffusion of some inclusions resulted in the reduction of gems’ clarity [5]. The quality of the rubies can be improved with the use of facilitated solvents to fill the cracks and enhance the color [41,42]. Many absorption peaks in the infrared spectra (e.g., 3236 cm−1 and 3186 cm−1) can indicate whether the sample has undergone heat treatment.
The ultraviolet-visible spectra can be used to determine the lattice field intensity and analyze the energy level of major chromic ions such as Cr3+. Through color software integration, the spectra can be quantized into chroma parameters for point maps, which can be a more objective evaluation of the degree of color improvement.

5. Conclusions

Ruby samples from Madagascar show increased red tones after heat treatment. In the case of these rubies, the Cr content increases significantly during the heat treatment at 1200 °C and decreases slightly after that at 1600 °C. Conversely, the Fe content increases significantly and progressively with increasing temperature. The samples show a yellow-brown tone due to the oxidation of Fe2+ to Fe3+, which precipitates along the cracks as hematite needles and crystal inclusions. Characteristic peaks at 3738 cm−1, 2332 cm−1 and 2361 cm−1 in the infrared spectra indicate changes in intensity due to heat treatment.
Ruby samples from Mozambique often have hexagonal plates and short columns, as well as zircon, hematite needles, hematite twin crystals, and calcite-hematite coexisting inclusion groups. The heat treatment of the ruby (MS-1400) causes a significant increase in the Cr content, with a consequent increase in red tone and saturation. As the temperature increases, the Cr and Fe contents increase. The UV-visible spectra indicate a poor intensity of ion transitions for the MS-1400 sample.
Ruby samples from Tanzania exhibit a darker color and higher Cr/Fe value than those from the other two areas. As the temperature rises, the Cr content slightly increases while the Fe content decreases significantly and the Ti content increases notably. The values of Cr/Fe increase while those of Fe/Ti decrease. The inclusion groups include calcite and hematite needles. There are five characteristic absorption peaks between 400 and 800 cm−1 in the infrared spectra of the sample, with small changes in position compared to the standard spectrum peaks. The peak intensity of TS-1200 is the highest, followed by TS-1400, while those of TS-1600 and TS-N are almost the same. Particularly, there is a small absorption peak at around 500 cm−1 in TS-N, which is difficult to observe in the heat-treated samples and therefore has an indicative meaning. The UV samples TS-1200 and TS-1400 show an obvious Cr3+ spin-forbidden transition at 652 nm.
The color saturation and hue of ruby increased significantly after heat treatment. From the test results, the higher the heat treatment temperature, the brighter the color of ruby, but more cracks will be generated on the surface of ruby. Therefore, it is necessary to select appropriate temperature of heat treatment according to the quality of ruby.

Author Contributions

Resources, B.Q.; writing—original draft preparation, L.Y., D.M., H.Z., R.H. and Z.S.; writing—review and editing, Q.L.; resources, B.Q. All authors have read and agreed to the published version of the manuscript.

Funding

This research was funded by the National Innovation Experiment Program for University Students (X202211415189).

Data Availability Statement

Data are contained within the article.

Acknowledgments

We thank the Academy of Science in China University of Geosciences (Beijing) for providing laboratory equipment. We are also grateful to all of the reviewers and editors for their constructive comments and efforts to improve the manuscript.

Conflicts of Interest

The authors declare no conflict of interest.

References

  1. Kim, J.K.; Kong, H.J.; Kim, J.H.; Han, S.K. Laser treatment of colorless natural and synthetic corundum. J. Gemmol. 2012, 33, 171–176. [Google Scholar]
  2. Rao, K.S.; Sahoo, R.K.; Dash, T.; Magudapathy, P.; Panigrahi, B.K.; Nayak, B.B.; Mishra, B.K. N and Cr ion implantation of natural ruby surfaces and their characterization. Nucl. Instrum. Methods Phys. Res. Sect. B 2016, 373, 70–75. [Google Scholar] [CrossRef]
  3. Eaton-Magaña, S.; Rondeau, B. The market for colored gemstones: Understanding supply chains, challenges and opportunities in the ruby market. Resour. Policy 2021, 71, 102123. [Google Scholar]
  4. Palke, A.C. The market for heat-treated rubies: The double-edged sword of transparency and consumer perceptions in the gem industry. Resour. Policy 2019, 64, 101496. [Google Scholar]
  5. Hughes, E.B.; Vertriest, W. A Canary In The Ruby Mine: Low-Temperature Heat Treatment Experiments On Burmese Ruby. Gems Gemol. 2022, 58, 400–423. [Google Scholar] [CrossRef]
  6. Paridieu, V.; Saeseaw, S.; Detroyat, S.; Raynaud, V.; Sangsawong, S.; Bhusrisom, T.; Engniwat, S.; Muyal, J. “Low Temperature” Heat Treatment of Mozambique Ruby—Results Report; GIA: Carlsbad, CA, USA, 2015; pp. 1–34. [Google Scholar]
  7. Phlayrahan, A.; Monarumit, N.; Satitkune, S.; Wathanakul, P. Detection of Heat Treatment in Ruby and Sapphire by Using Infrared Spectroscopy. Gems Gemmol. 2018, 201, 141–142. [Google Scholar]
  8. Saeseaw, S.; Kongsomart, B.; Atikarnsakul, U.; Khowpong, C.; Vertriest, W.; Soonthorntantikul, W. Update on “Low-Temperature” Heat Treatment of Mozambican Ruby: A Focus on Inclusions and FTIR Spectroscopy; GIA: Carlsbad, CA, USA, 2018; pp. 1–47. [Google Scholar]
  9. Müller, T.; Hofmeister, W.; Rauer, S.; Tucoulou, R. Heating-induced changes in UV–vis–NIR spectra of natural and synthetic ruby. Phys. Chem. Miner. 2019, 46, 597–610. [Google Scholar] [CrossRef]
  10. Sakthivel, R.; Pradhan, K.C.; Nayak, B.B.; Dash, T.; Sahu, R.K.; Mishra, B.K. Effect of fusion mixture treatment on the surface of low grade natural ruby. Appl. Surf. Sci. 2017, 403, 267–273. [Google Scholar] [CrossRef]
  11. Lu, Q.; Li, X.; Sun, L.; Qin, B. Chemical and Spectral Variations between Untreated and Heat-Treated Rubies from Mozambique and Madagascar. Minerals 2022, 12, 894. [Google Scholar] [CrossRef]
  12. Liu, Y.S.; Hu, Z.C.; Gao, S.; Günther, D.; Xu, J.; Gao, C.G.; Chen, H.H. In situ analysis of major and trace elements of anhydrous minerals by LA-ICP-MS without applying an internal standard. Chem. Geol. 2008, 257, 34–43. [Google Scholar] [CrossRef]
  13. Chen, L.; Liu, Y.; Hu, Z.; Gao, S.; Zong, K.; Chen, H. Accurate determinations of fifty-four major and trace elements in carbonate by LA-ICP-MS using normalization strategy of bulk components as 100%. Chem. Geol. 2011, 284, 283–295. [Google Scholar] [CrossRef]
  14. Vashishta, P.; Kalia, R.K.; Singh, R.K. Electronic structure and optical properties of Al2O3, Cr2O3 and ruby as studied by the first-principles calculations. J. Phys. Condens. Matter 2001, 13, 11133–11145. [Google Scholar]
  15. Pardiu, V.; Thanachakaphad, J. Rubies reportedly from Mozambique. Gems Gemol. 2012, 48, 149–150. [Google Scholar]
  16. Sinha, J.K.; Mishra, P.K. Spectroscopic and microstructural studies of ruby gemstones of Sinapalli, Odisha. J. Geol. Soc. India 2015, 86, 657–662. [Google Scholar] [CrossRef]
  17. Raghavan, S.; Imbrie, P.K.; Crossley, W.A. Spectral Analysis of R-lines and Vibronic Sidebands in the Emission Spectrum of Ruby Using Genetic Algorithms. Appl. Spectrosc. 2008, 62, 759. [Google Scholar] [CrossRef]
  18. Jackson, S.D.; King, T.A. Photophysics and lasing characteristics of chromium-doped colquiriite lasers. J. Opt. Soc. Am. B 2003, 20, 2637–2653. [Google Scholar]
  19. Iakoubovskii, K.; Tomilin, M. The UV-visible-NIR spectra of Cr-doped sapphire crystals. Opt. Mater. Express 2012, 2, 631–636. [Google Scholar]
  20. Duffy, J.A.; Keenan, M.R. The ultraviolet absorption spectra of natural and synthetic ruby. Spectrochim. Acta Part A Mol. Spectrosc. 1977, 33, 327–332. [Google Scholar]
  21. Sutherland, F.L.; Groat, L.A. The UV absorption spectrum of corundum from different worldwide localities. Can. Mineral. 2005, 43, 1835–1846. [Google Scholar]
  22. Johnson, M.L.; Hausladen, P. The absorption spectrum of ruby at low temperatures. J. Lumin. 1975, 11, 43–50. [Google Scholar]
  23. Wang, W.; Hu, Q.; Li, J. Study on ruby and sapphire using ultraviolet-visible-near infrared spectroscopy and two-dimensional correlation analysis. Spectrosc. Spectr. Anal. 2014, 34, 339–343. [Google Scholar]
  24. Drouin, M.A.; Fritsch, E. UV-vis-NIR spectroscopy applied to gem testing. Aust. Gemmol. 2007, 23, 451–461. [Google Scholar]
  25. Webster, R. Gem Testing; Butterworth-Heinemann: Oxford, UK, 2006. [Google Scholar]
  26. Wu, Z.; Zhang, J.; Liu, P.; Xu, H. Pressure-dependent Raman spectra of synthetic ruby. J. Appl. Phys. 2010, 107, 083509. [Google Scholar]
  27. Kim, N.; Yang, W. Raman spectroscopy and X-ray diffraction analyses of zirconia-doped ruby crystals. Opt. Mater. Express 2018, 8, 1337–1347. [Google Scholar]
  28. RRUFF Project. Rutile R050031. Available online: http://rruff.info/rutile (accessed on 1 January 2020).
  29. Zhang, M.; Li, Q.; Mao, J.; Wang, X. Mineralogical and geochemical characteristics of ruby and its host rocks from Mogok metamorphic belt, Burma. Ore Geol. Rev. 2016, 72, 957–970. [Google Scholar]
  30. RRUFF Project. Calcite R050048. Available online: http://rruff.info/calcite (accessed on 1 January 2020).
  31. Shatskiy, A.; Taran, M. Raman spectra of dolomite inclusions in ruby crystals: Evidence for a complex composition. J. Raman Spectrosc. 2016, 47, 428–434. [Google Scholar]
  32. Taran, M.N.; Polyakov, V.O.; Shatskiy, A.F. Spectroscopic features of ruby crystals containing Cr-rich spinel and dolomite inclusions with unusual composition. J. Appl. Spectrosc. 2016, 83, 250–257. [Google Scholar]
  33. Giuliani, G.; Ohnenstetter, D.; Fallick, A.E.; Garnier, V. Ruby and sapphire from Jegdalek (Afghanistan): Unusual trace-elements, fluid and mineral inclusions, and oxygen isotopic characteristics. J. Asian Earth Sci. 2007, 30, 240–252. [Google Scholar]
  34. Karampelas, S. Heat treatment of Fe-bearing corundum: A review. Gems Gemol. 2016, 52, 298–313. [Google Scholar]
  35. Emmett, J.L.; Scarratt, K. The effect of heat treatment on the Fe content and color of ruby from Winza, Tanzania. J. Gemmol. 2017, 36, 738–750. [Google Scholar]
  36. Kitawaki, H.; Shimizu, K.; Kuroda, D. Effect of Fe content and heat treatment on the color of ruby. J. Gemmol. 2019, 36, 598–604. [Google Scholar]
  37. Vodolazov, O.; Shorokhova, A. The relationship between Fe contents and colour changes in Mozambique rubies upon heat treatment. Mineral. Mag. 2021, 85, 1–11. [Google Scholar]
  38. Monarumit, N.; Lhuaamporn, T.; Satitkune, S.; Wongkokua, W. Effect of Beryllium Heat Treatment in Synthetic Ruby. J. Appl. Spectrosc. 2019, 86, 486–492. [Google Scholar] [CrossRef]
  39. Turchaninov, A.A.; Ivanov, S.A. Heat Treatment of Ruby in the Mixed Gas Environment of Hydrogen and Oxygen. Phys. Solid State 2017, 59, 1870–1876. [Google Scholar]
  40. Mehta, B.K. Thermally Induced Color Changes in Rubies: An X-ray Diffraction and Infrared Study. Thermochim. Acta 2018, 668, 60–66. [Google Scholar]
  41. Nassau, K. The early history of gemstone treatments. Gems Gemol. 1984, 20, 22–33. [Google Scholar] [CrossRef] [Green Version]
  42. Nassau, K. The Physics and Chemistry of Color. Am. J. Phys. 1985, 53, 1018–1019. [Google Scholar] [CrossRef]
Figure 1. Images of the natural and heated samples.
Crystals 13 01051 g001
Figure 2. Images of the surface and interior of the heat-treated rubies from Madagascar.
Crystals 13 01051 g002
Figure 3. Images of the surface and interior of the heat-treated rubies from Mozambique.
Crystals 13 01051 g003
Figure 4. Images of the surface and interior of the heat-treated rubies from Tanzania.
Crystals 13 01051 g004
Figure 5. Infrared Spectra Analysis of rubies from Tanzania (400–800 cm−1).
Crystals 13 01051 g005
Figure 6. Infrared Spectra of rubies from Mozambique (MS), Madagascar (MS) and Tanzania (TS) (2000–4000 cm−1).
Crystals 13 01051 g006
Figure 7. UV-visible spectra of rubies from Madagascar (sample MD).
Crystals 13 01051 g007
Figure 8. UV-visible spectra of rubies from Mozambique (sample MS).
Crystals 13 01051 g008
Figure 9. UV-visible spectra of rubies from Tanzania (sample TS).
Crystals 13 01051 g009
Figure 10. Raman spectra of the different types of inclusions in ruby samples: (a) Rutile from MS-N; (b) Disaspore from TS-N; (c) Zircon from MS-1400; (d) Calcite-rutile symbiosis from MS-N.
Crystals 13 01051 g010
Table 1. Gemological properties of ruby samples investigated in this work.
LabelSpecific Gravity (SG)FluorescenceAppearance
MD-N4.29NoneCleavage and the flash cleavage surface
MD-12003.87NoneCleavage and brown dip-dye
MD-14003.91LW:Intense red
SW:None
Hexagonal short columnar, white dip-dye and dark minerals
MD-16003.76LW:None
SW:Faint red
Cleavage and white dip-dye
MS-N3.90LW:Moderate red
SW:None
Hexagonal sheet and dark impurity mineral
MS-14003.79LW:Intense red
SW:Faint red
Hexagonal long columnar, dark minerals, white impurity and brown dip-dye
MS-16003.96LW:Intense red
SW:Faint red
Hexagonal long columnar, dark minerals and brown dip-dye
TS-N4.25LW:Intense red
SW:None
Fissure and Cleavage
TS-12004.00LW:Intense red
SW:None
dark minerals and white dip-dye
TS-14003.60LW:Intense red
SW:None
Cleavage and white dip-dye
TS-16003.63LW:Intense red
SW:None
Cleavage and white to pink impurity mineral
Table 2. UV-visible spectra absorption bands and their causes.
Document WavelengthMeasured WavelengthCauses
370–380375Fe3+ d-d electron transition and Fe2+-Fe3+ charge transfer
494480Ti3+ d-d electron transition [24]
560-Ti4+-Fe2+ and Ti3+-Fe3+ charge transfer [23]
659652Cr3+ spin forbidden transition [25]
666665Cr3+ d-d electron transition [23]
693684Cr3+ spin forbidden transition [25]
830843Ti4+-Fe2+ charge transfer [24]
Table 3. Chemical composition of natural and treated samples from the three different areas (%W/W).
LabelAl2O3Cr2O3FeOSiO2Na2OTiOMgONiOMnO
MD-N99.3831.0230.0010.5110.0980.0000.1730.0000.643
MD-120095.4902.5430.1790.4380.0020.010.0030.0000.000
MD-160096.7822.0680.2470.7550.0760.0010.0030.0000.019
MS-N98.8130.2510.2250.7660.0440.0190.0170.0000.036
MS-140099.2750.1850.3990.6270.1250.0000.0090.0460.022
MS-160099.9270.1640.3990.0770.0270.0370.0050.0000.039
TS-N99.3150.3380.2660.0960.0130.0350.0030.0670.000
TS-120099.1490.4050.1680.0660.0180.0470.0010.0000.012
TS-160096.7981.2490.1630.2070.0540.0560.0060.0500.013
Table 4. LA-ICP-MS Trace Element Content (ppm) of the rubies from the three different areas.
LabelCr (ppm)Fe (ppm)Ti (ppm)Mg (ppm)Ga (ppm)V (ppm)
MD-N3501.30.01.21036.32963.63290.5
MD-12008700.30.142.119.921.75.9
MD-16008673.40.213.413.023.05.2
MS-N733.9853.9158.845.2117.247.9
MS-1400905.52431.529.827.645.73.5
MS-1600734.82503.549.836.148.313.4
TS-N2828.31022.60.00.0122.864.1
TS-12002809.71513.30.00.016.75.0
TS-16006853.21240.823.316.229.78.5
Disclaimer/Publisher’s Note: The statements, opinions and data contained in all publications are solely those of the individual author(s) and contributor(s) and not of MDPI and/or the editor(s). MDPI and/or the editor(s) disclaim responsibility for any injury to people or property resulting from any ideas, methods, instructions or products referred to in the content.

