

First-Principles Investigation of the Diffusion of TM and the Nucleation and Growth of L12 Al3TM Particles in Al Alloys


Abstract
:1. Introduction
2. Computed Methods
3. Conclusion Description
3.1. Diffusion


| Element | Em | Eb | Q | Ds |
|---|---|---|---|---|
| Al | 0.68 0.55–0.70 [54] 0.57 [58] | 0.63 0.60–0.80 [54] 0.63 [58] | 1.31 1.15–1.50 [54] 1.20 [58] 1.31 [56] | 3.55 × 10⁻²⁸ 1.76 × 10⁻²⁷ [56] |
| Sc | 0.85 | 0.97 | 1.82 1.79 [55] | 2.05 × 10−37 |
| Ti | 1.43 | 0.84 | 2.27 | 6.04 × 10−45 |
| V | 1.90 | 0.42 | 2.32 | 1.09 × 10−45 |
| Cr | 2.14 | 0.09 | 2.23 | 3.36 × 10−44 |
| Mn | 2.11 | 0.49 | 2.60 | 2.43 × 10−50 |
| Fe | 1.90 | 0.63 | 2.53 | 3.10 × 10−49 |
| Co | 1.55 | 0.90 | 2.45 | 7.79 × 10−48 |
| Ni | 1.06 | 0.97 | 2.03 | 6.44 × 10−41 |
| Cu | 0.57 | 0.22 | 0.79 | 2.94 × 10⁻²⁰ |
| Zn | 0.40 | −0.04 | 0.35 | 3.09 × 10⁻¹³ |
| Y | 0.36 | 0.63 | 0.99 | 6.47 × 10⁻²⁴ |
| Zr | 1.19 | 0.98 | 2.17 | 2.16 × 10−43 |
| Nb | 1.88 | 0.75 | 2.63 | 4.94 × 10−51 |
| Mo | 2.46 | 0.75 | 3.22 | 7.40 × 10−61 |
| Tc | 2.54 | 1.27 | 3.82 | 7.25 × 10−71 |
| Ru | 2.25 | 1.69 | 3.94 | 6.77 × 10−73 |
| Rh | 1.68 | 2.16 | 3.84 | 2.81 × 10−71 |
| Pd | 0.98 | 1.71 | 2.68 | 5.51 × 10−52 |
| Ag | 0.51 | 0.06 | 0.56 | 9.17 × 10⁻¹⁷ |
| Cd | 0.35 | −0.46 | −0.12 | - |
| Hf | 1.41 | 0.80 | 2.21 | 2.79 × 10−44 |
| Ta | 2.10 | 0.41 | 2.51 | 2.90 × 10−49 |
| W | 2.85 | 0.17 | 3.02 | 9.43 × 10−58 |
| Re | 3.09 | 0.86 | 3.95 | 2.93 × 10−73 |
| Os | 2.77 | 1.36 | 4.14 | 1.96 × 10−76 |
| Ir | 2.15 | 2.11 | 4.26 | 1.60 × 10−78 |
| Pt | 1.27 | 2.15 | 3.42 | 1.77 × 10−64 |
| Au | 0.53 | 0.78 | 1.31 | 2.93 × 10⁻²⁹ |
| Hg | 0.21 | −0.50 | −0.30 | - |
3.2. Nucleation
- Li et al. [23] adopted the vacuum slab model for the calculation, resulting in the values of interface energies being affected by different terminal surfaces, and the interface energy of Al/Al3Ti of 61.85 mJ·m−2 calculated by the vacuum model is in a good agreement with that of Li et al. according to , where is the total energy of the vacuum slab model system, denotes the total energy of the fully relaxed surface slabs and and represent the surface energies of the α and β surface slabs, respectively. Meanwhile, the strain energy caused by lattice mismatch in the vacuum slab model was not taken into account in the above equation.
- Mao et al. [15] had investigated interface properties in a periodic supercell and, considering the strain energy of interface model, they calculated interface properties with less accuracy, performed on a 0.13 (1/Å) spacing Monkhorst–Pack k-point mesh and an energy cutoff of 300 eV.
3.3. Surface Energy
4. Conclusions
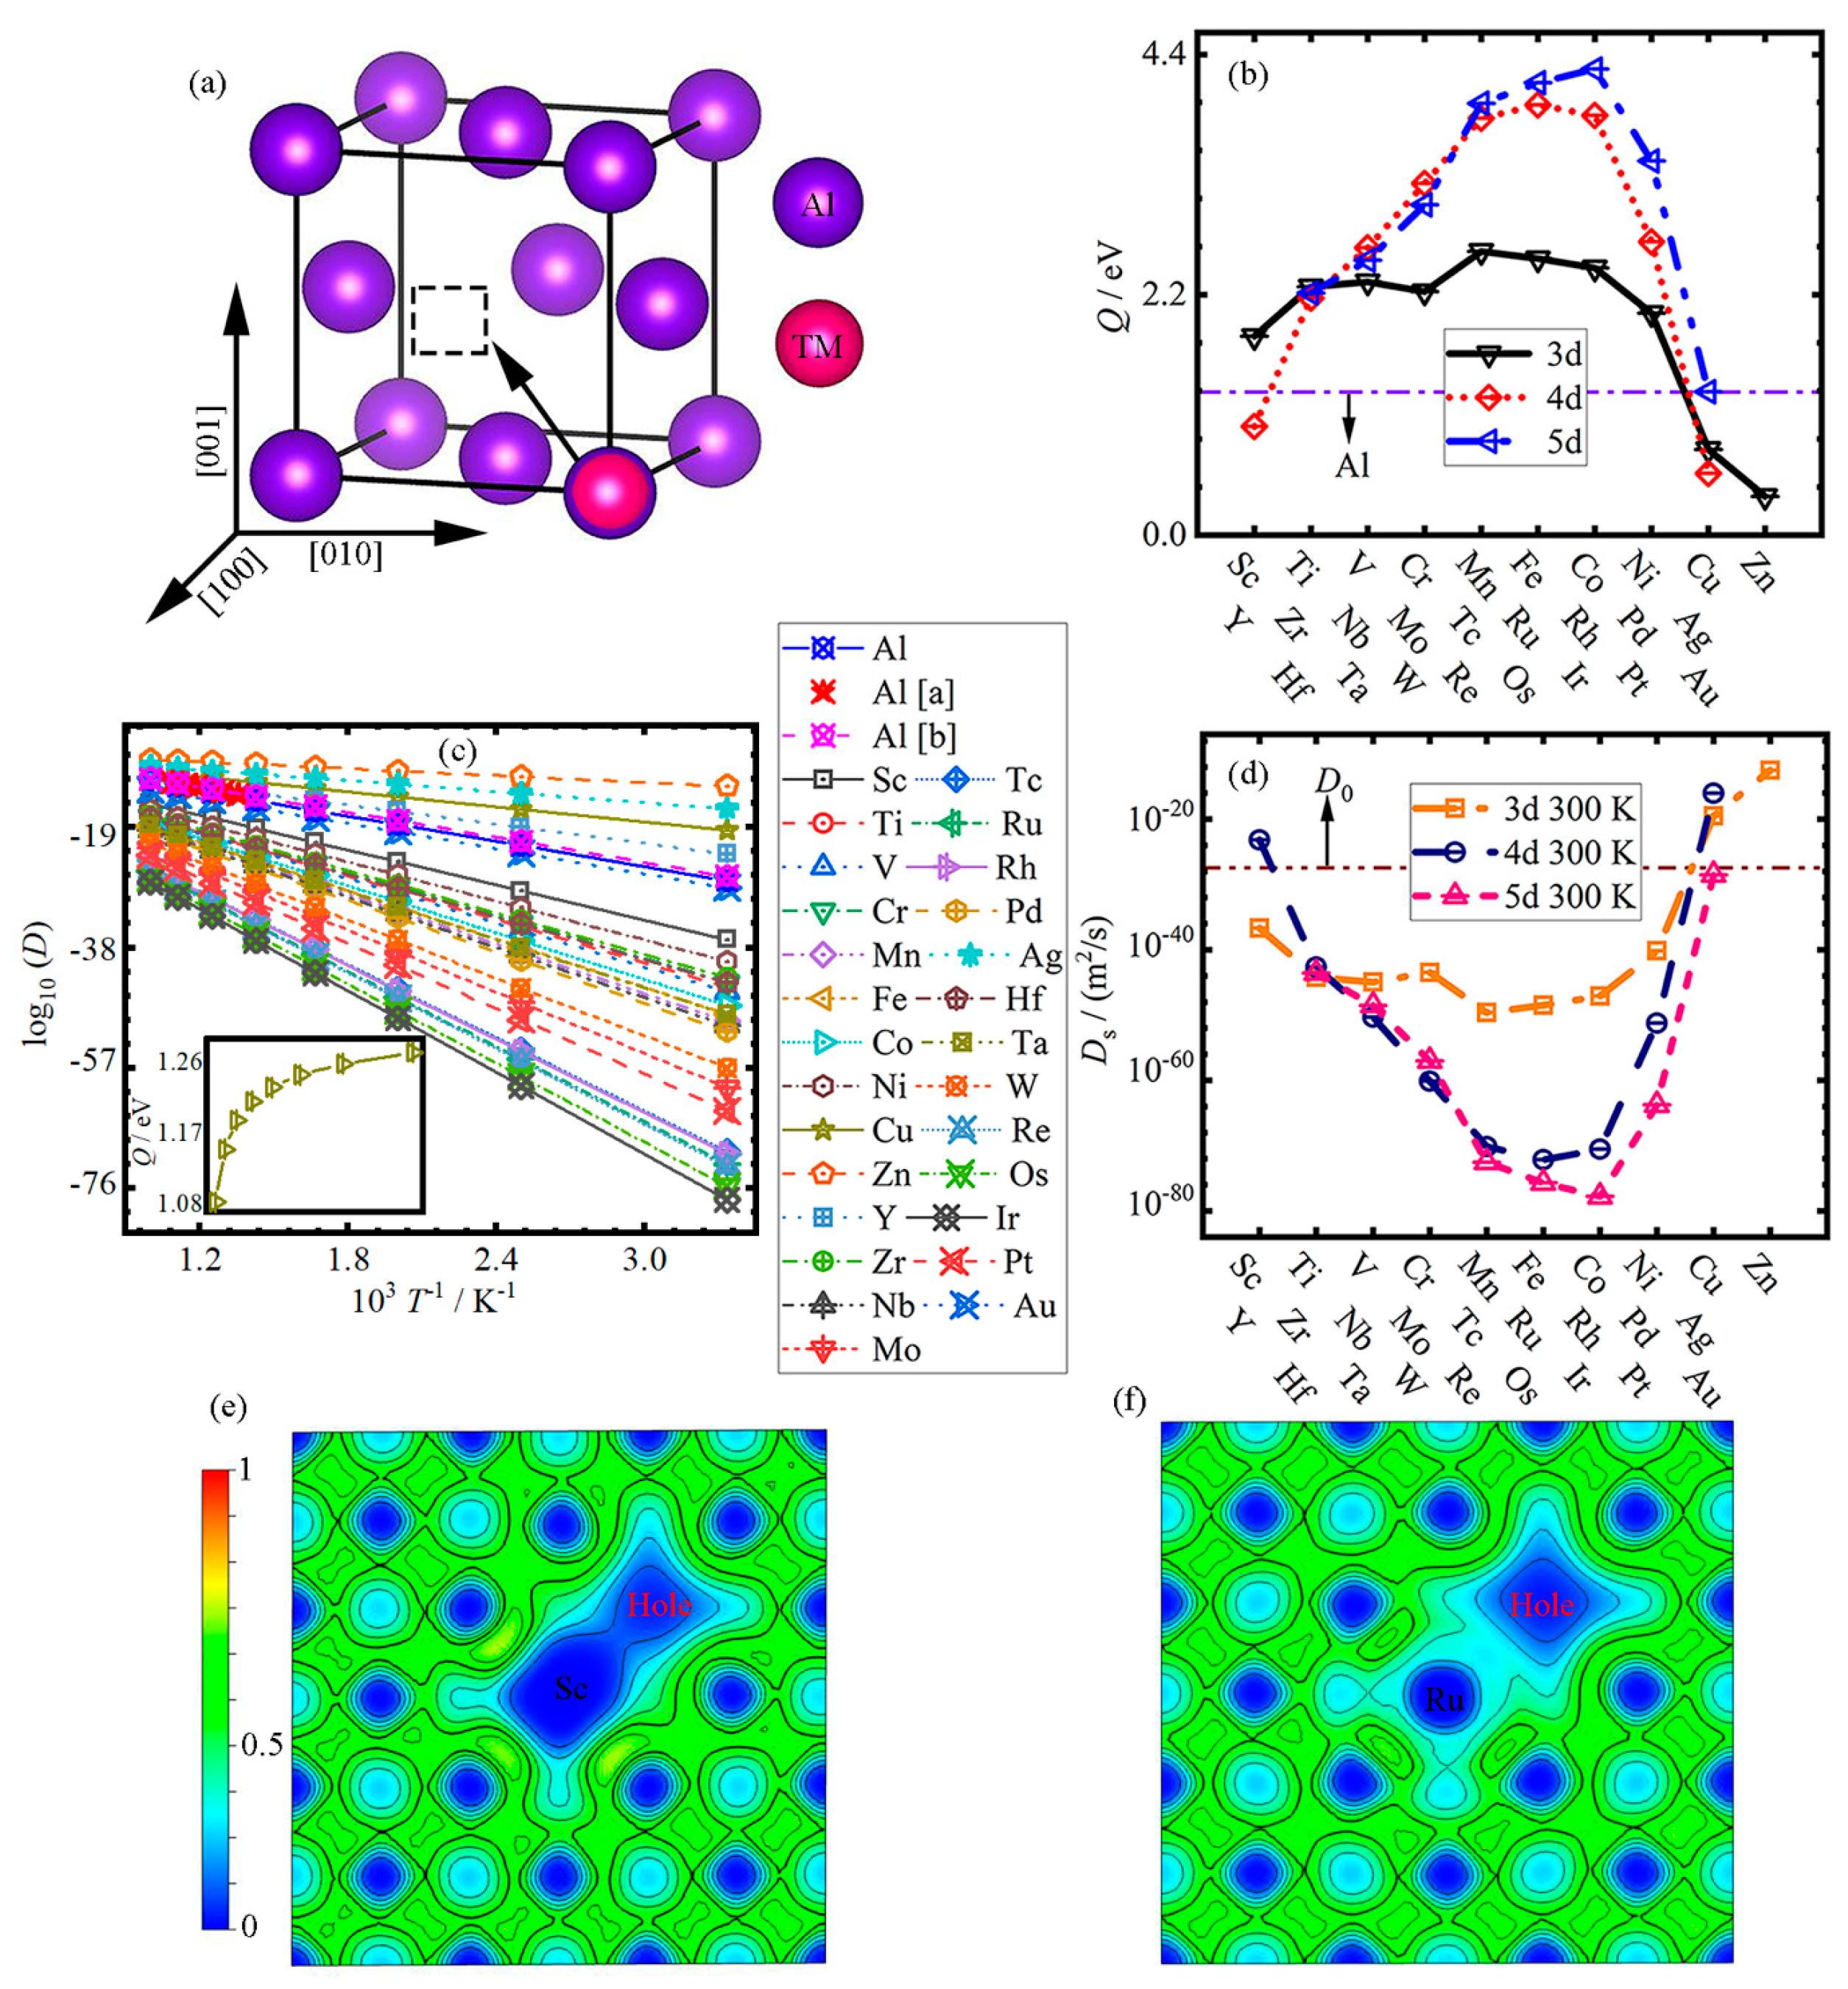
- In the vacancy–substitution model, the diffusion activation energy Q first increases, and then decreases with the increase in atomic number (Sc-Zn, Y-Ag and Hf-Au) in the Al matrix, except for Cr; the TM elements in the fourth cycle generally have lower Qs.
- Mn-Co, Tc-Rh and Re-Ir elements have larger activation energies Qs in the Al matrix, while Cu-Zn, Ag and Au have lower activation energies Qs; even Cd and Hg elements have negative activation energies. In the undoped-Al system, the self-diffusion activation energy Q0 is lower compared to all Qs in the doped system, except for the Qs of Cu, Zn, Y and Ag.
- The diffusion rate Ds of all impurity atoms increases logarithmically with the increase in temperature. With the increase in atomic number, the diffusion rate Ds first decreases linearly from Sc, Y and Hf to Mn, Ru and Ir, and then increases to Zn, Ag and Au for 3–5d TM elements, respectively.
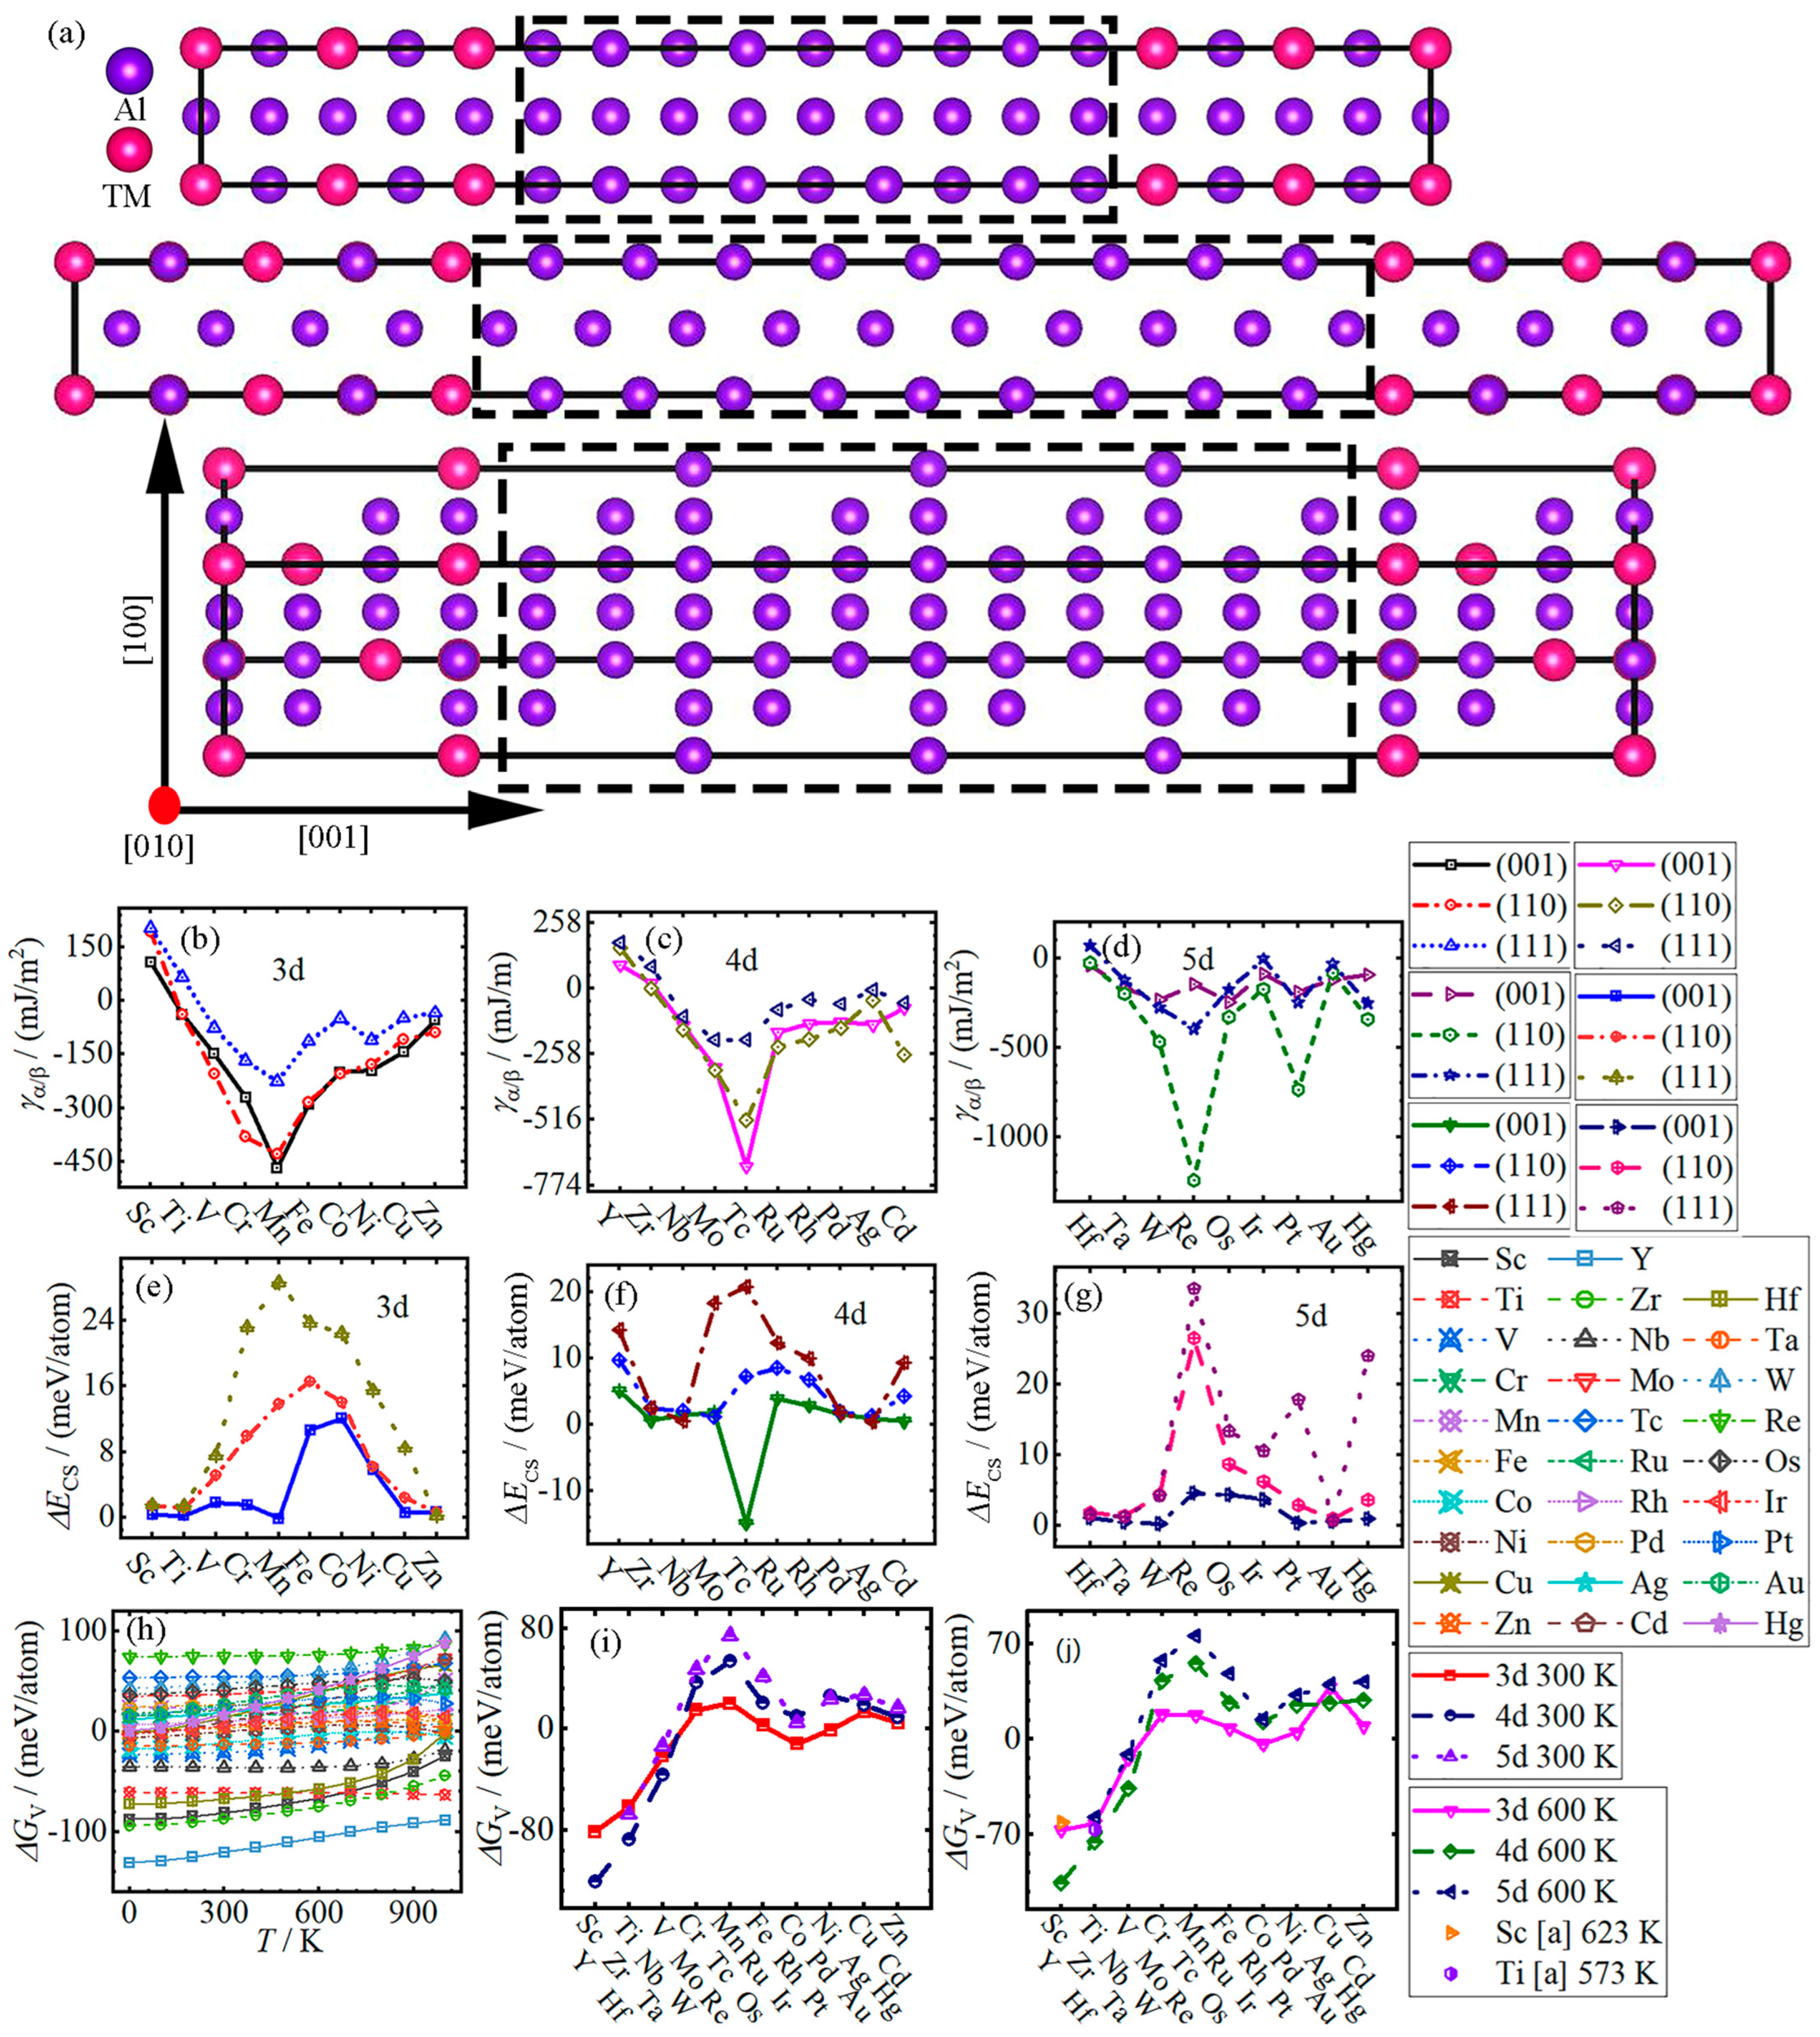
- With the increase in atomic number, the interface energy γα/β of Al/Al3TM (TM = (Sc-Zn, Y-Cd)) decreases from Sc and Y to Mn and Tc, and then increases to Zn and Cd, respectively, except for (001) in Al/Al3(Fe-Co), (111) in Al/Al3Pd and (110) and (111) in Al/Al3Cd. Meanwhile, the strain energy ΔEcs increases from Sc to Co in the (001) system, to Fe in the (110) system, and to Mn in the (111) system, respectively, and then they all decreases to Zn, except for Al/Al3Mn. The largest values of ΔEcs for (110) and (111) interface systems are all located at Al/Al3Re, while the (001) interface system of Al/Al3Tc has the lowest value.
- The variation in chemical formation energy ΔGV of all Al3TM changes slightly in the temperature range of 0~1000 K, except that the ΔGV of Al3Sc, Al3Cu, Al3(Y-Zr), Al3Cd, Al3Hf and Al3Hg increase nonlinearly. With the increase in atomic number at 300 K, the ΔGV increases from Sc, Y and Hf to Mn, Tc and Re at first, and then decreases to Co, Rh and Ir, respectively, and finally, it slightly changes. The variation trends of the ΔGV for 3–5d TMs are the same as those at 300 K.
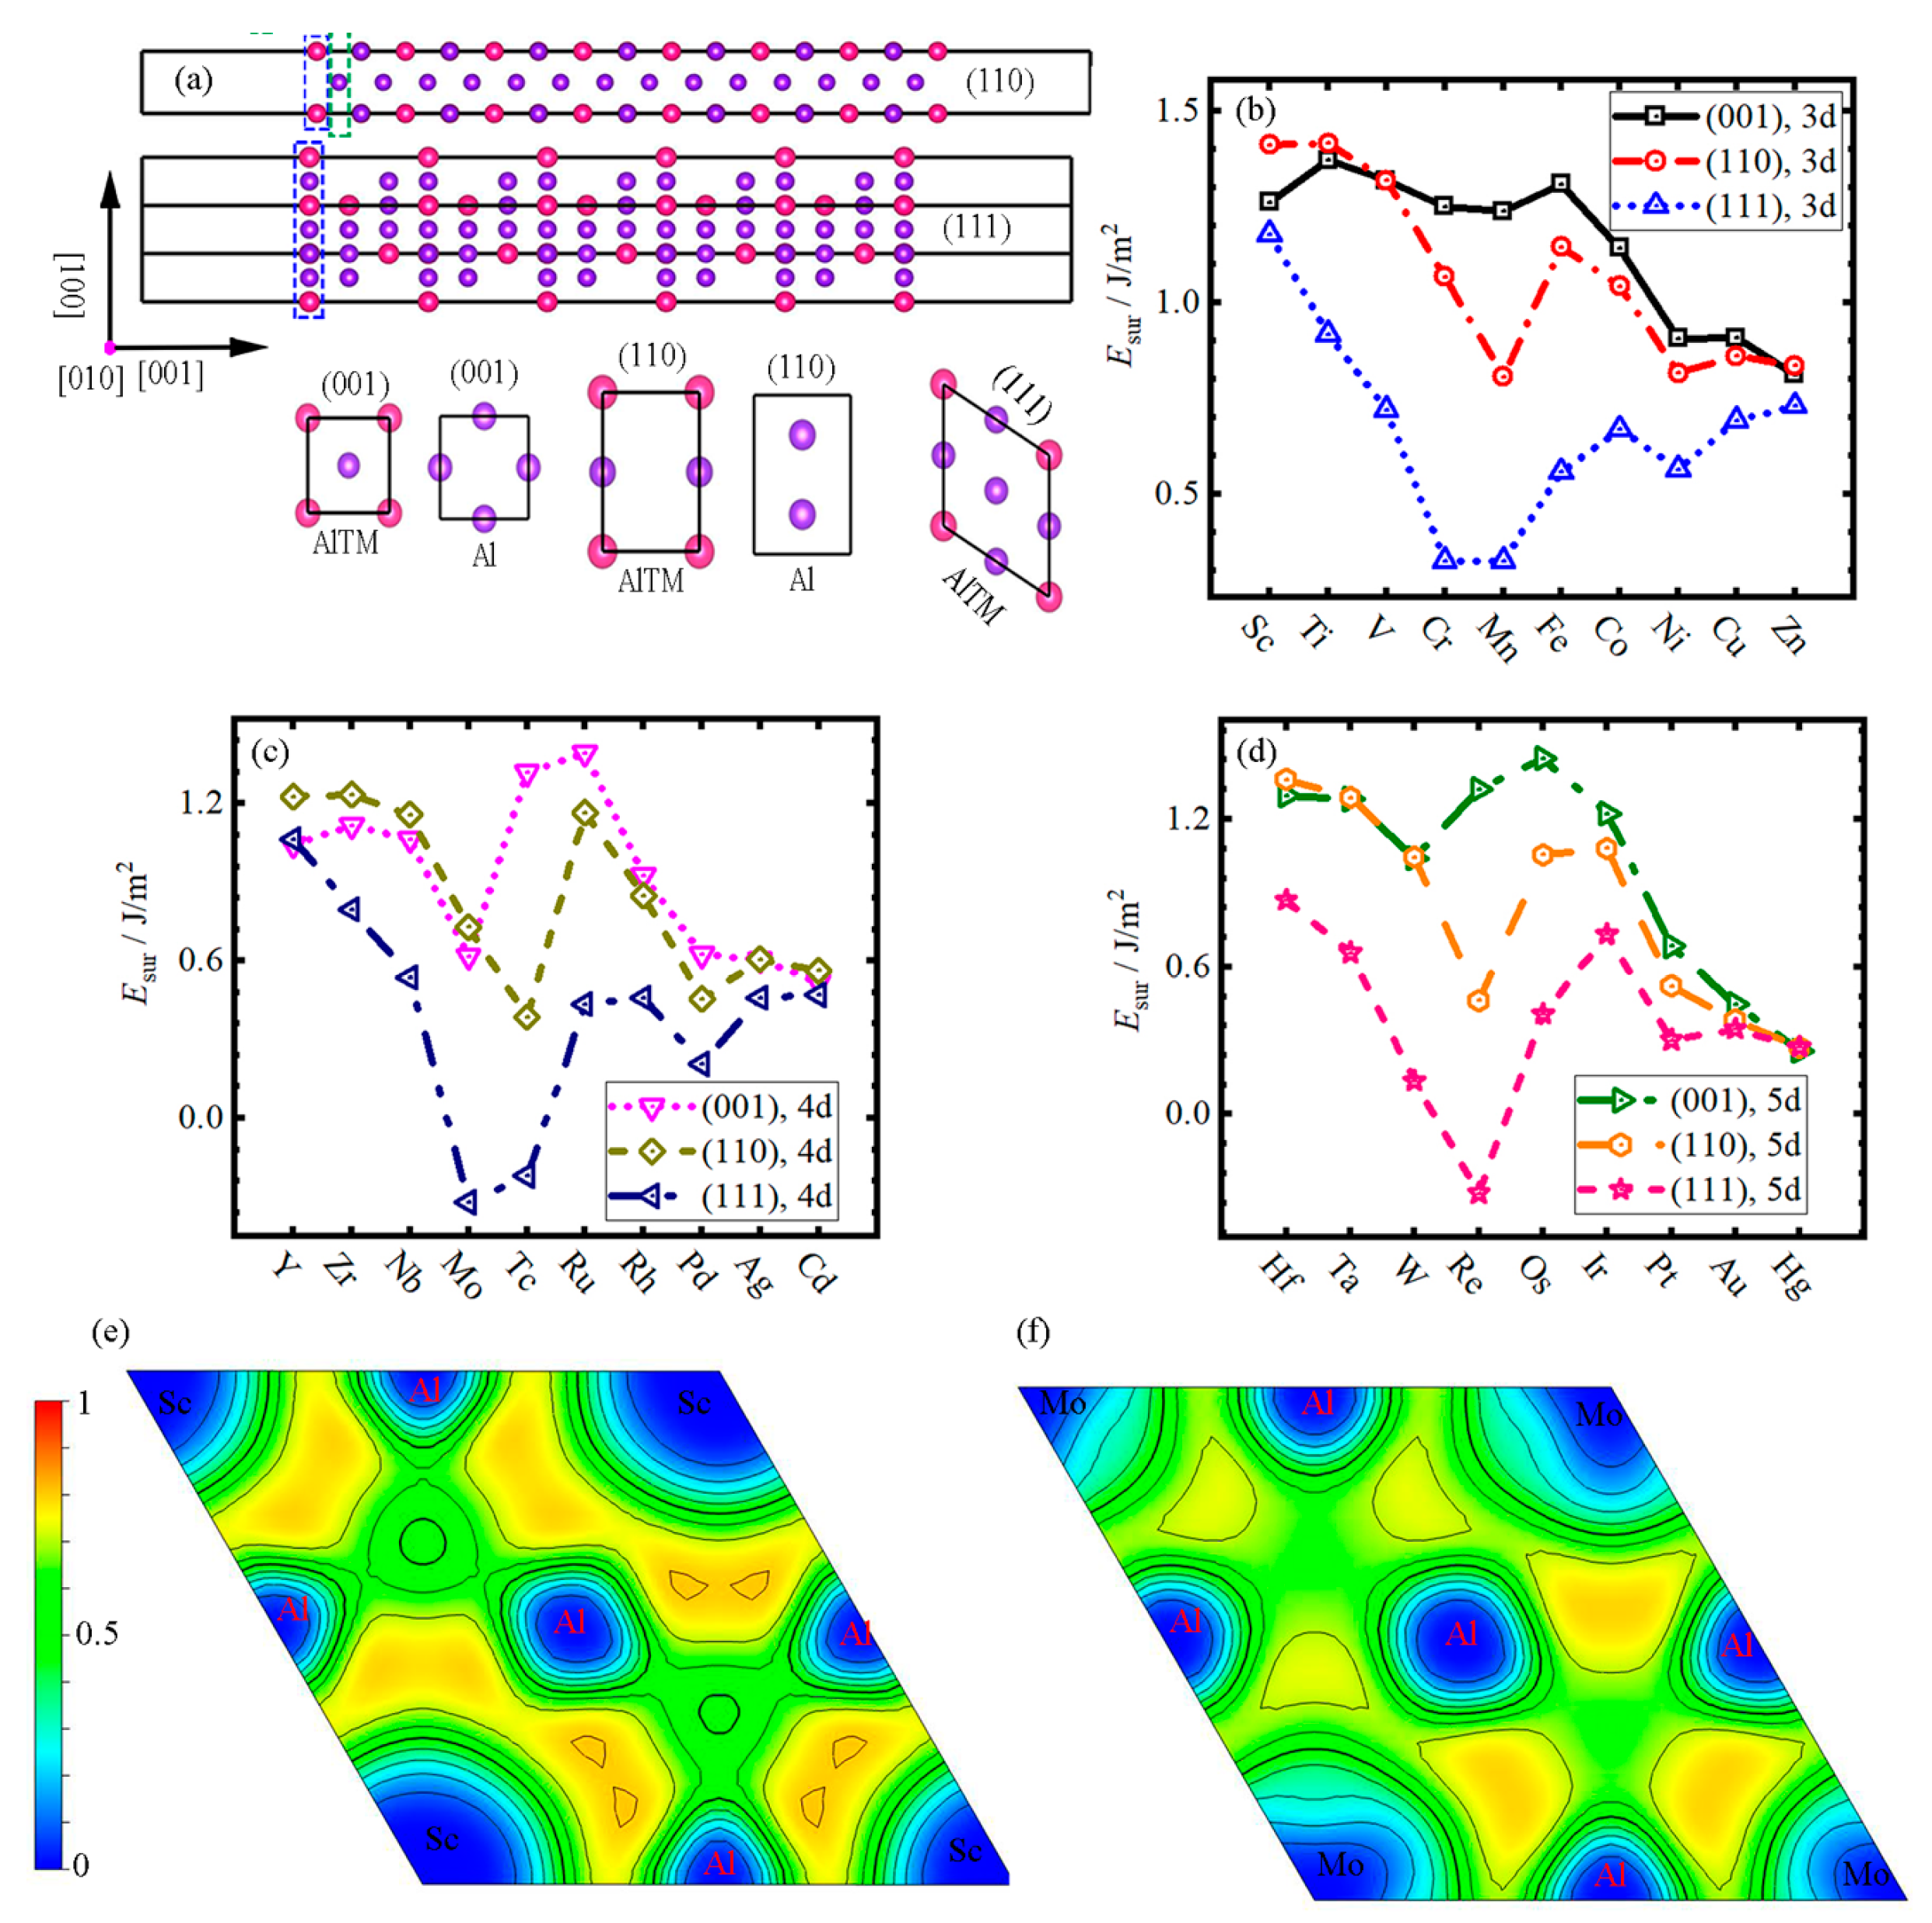
- With the increase in atomic number, the trend of of Al3TM intermetallic compounds presents a similar change in different cycles and the (111) surface always has the lowest surface energy in all surfaces of Al3TM particles.
Author Contributions
Funding
Data Availability Statement
Conflicts of Interest
References
- Schlapbach, L.; Züttel, A. Hydrogen-storage materials for mobile applications. Nature 2001, 414, 353–358. [Google Scholar] [CrossRef] [PubMed]
- Wen, K.; Xiong, B.-Q.; Fan, Y.-Q.; Zhang, Y.-A.; Li, Z.-H.; Li, X.-W.; Wang, F.; Liu, H.-W. Transformation and dissolution of second phases during solution treatment of an Al-Zn-Mg-Cu alloy containing high zinc. Rare Met. 2018, 37, 376–380. [Google Scholar] [CrossRef]
- Seidman, D.N.; Marquis, E.A.; Dunand, D.C. Precipitation strengthening at ambient and elevated temperatures of heat-treatable Al(Sc) alloys. Acta Mater. 2002, 50, 4021–4035. [Google Scholar] [CrossRef]
- Drits, M.E.; Kadaner, E.S.; Turkina, N.I.; Fedotov, S.G. The Mechanical Properties of Aluminum-Lithium Alloy. Transl. Splav. Tsvetn. Met. 1972, 14. [Google Scholar]
- Yang, Y.; Licavoli, J.J.; Hackney, S.A.; Sanders, P.G. Coarsening behavior of precipitate Al3(Sc, Zr) in supersaturated Al-Sc-Zr alloy via melt spinning and extrusion. J. Mater. Sci. 2021, 56, 11114–11136. [Google Scholar] [CrossRef]
- Yan, K.; Chen, Z.; Lu, W.J.; Zhao, Y.; Le, W.; Naseem, S. Nucleation and growth of Al3Sc precipitates during isothermal aging of Al-0.55wt% Sc alloy. Mater. Charact. 2021, 179, 111331. [Google Scholar] [CrossRef]
- Clemens, H.; Kestler, H. Processing and Applications of Intermetallic -TiAl-Based Alloys. Adv. Eng. Mater. 2010, 2, 551–570. [Google Scholar] [CrossRef]
- Ug, Ş.; Arıkan, N.; Soyalp, F.; Ug, G. Phonon and elastic properties of AlSc and MgSc from first-principles calculations. Comput. Mater. Sci. 2010, 48, 866–870. [Google Scholar]
- RMichi, A.; Toinin, J.P.; Farkoosh, A.R.; Seidman, D.N.; Dunand, D.C. Effects of Zn and Cr additions on precipitation and creep behavior of a dilute Al–Zr–Er–Si alloy. Acta Mater. 2019, 181, 249–261. [Google Scholar]
- Zedalis, M.S.; Fine, M.E. Precipitation and ostwald ripening in dilute AI Base-Zr-V alloys. Metall. Trans. A 1986, 17, 2187–2198. [Google Scholar] [CrossRef]
- Parameswaran, V.R.; Weertman, J.R.; Fine, M.E. Coarsening behavior of L12 phase in an Al-Zr-Ti alloy. Scr. Metall. 1989, 23, 147–150. [Google Scholar] [CrossRef]
- Chen, Z.; Zhang, P.; Chen, D.; Wu, Y.; Wang, M.; Ma, N.; Wang, H. First-principles investigation of thermodynamic, elastic and electronic properties of Al3V and Al3Nb intermetallics under pressures. J. Appl. Phys. 2015, 117, 085904. [Google Scholar] [CrossRef]
- Li, R.-Y.; Duan, Y.-H. Electronic structures and thermodynamic properties of HfAl3 in L12, D022 and D023 structures. Trans. Nonferrous Met. Soc. China 2016, 26, 2404–2412. [Google Scholar] [CrossRef]
- Czerwinski, F. Thermal Stability of Aluminum Alloys. Materials 2020, 13, 3441. [Google Scholar] [CrossRef] [PubMed]
- Mao, Z.; Chen, W.; Seidman, D.N.; Wolverton, C. First-principles study of the nucleation and stability of ordered precipitates in ternary Al–Sc–Li alloys. Acta Mater. 2011, 59, 3012–3023. [Google Scholar] [CrossRef]
- Zhang, X.; Huang, Y.; Liu, Y.; Ren, X. A comprehensive DFT study on the thermodynamic and mechanical properties of L12-Al3Ti/Al interface. Vacuum 2021, 183, 109858. [Google Scholar] [CrossRef]
- Wang, Y.; Wang, J.; Zhang, C.; Huang, H. Mechanical properties of defective L12-Al3X (X= Sc, Lu) phase: A first-principles study. J. Rare Earths 2021, 39, 217–224. [Google Scholar] [CrossRef]
- Dorin, T.; Babaniaris, S.; Jiang, L.; Cassel, A.; Robson, J.D. Stability and stoichiometry of L12 Al3(Sc,Zr) dispersoids in Al-(Si)-Sc-Zr alloys. Acta Mater. 2021, 216, 117117. [Google Scholar] [CrossRef]
- Liu, T.; Ma, T.; Li, Y.; Ren, Y.; Liu, W. Stable mechanical and thermodynamic properties of Al-RE intermetallics: A First-principles study. J. Rare Earths 2022, 40, 345–352. [Google Scholar] [CrossRef]
- Nakai, M.; Eto, T. New aspect of development of high strength aluminum alloys for aerospace applications. Mater. Sci. Eng. A 2000, 285, 62–68. [Google Scholar] [CrossRef]
- Saha, S.; Todorova, T.Z.; Zwanziger, J.W. Temperature dependent lattice misfit and coherency of Al3X (X=Sc, Zr, Ti and Nb) particles in an Al matrix. Acta Mater. 2015, 89, 109–115. [Google Scholar] [CrossRef]
- Shi, T.T.; Wang, J.N.; Wang, Y.P.; Wang, H.C.; Tang, B.Y. Atomic diffusion mediated by vacancy defects in pure and transition element (TM)-doped (TM=Ti, Y, Zr or Hf) L12 Al3Sc. Mater. Des. 2016, 108, 529–537. [Google Scholar] [CrossRef]
- Li, S.-S.; Li, L.; Han, J.; Wang, C.-T.; Xiao, Y.-Q.; Jian, X.-D.; Qian, P.; Su, Y.-J. First-Principles study on the nucleation of precipitates in ternary Al alloys doped with Sc, Li, Zr, and Ti elements. Appl. Surf. Sci. 2020, 526, 146455. [Google Scholar] [CrossRef]
- Sun, S.P.; Li, X.P.; Wang, H.J.; Jiang, H.F.; Lei, W.N.; Jiang, Y.; Yi, D.Q. First-principles investigations on the electronic properties and stabilities of low-index surfaces of L12–Al3Sc intermetallic. Appl. Surf. Sci. 2014, 288, 609–618. [Google Scholar] [CrossRef]
- Hood, G.M. The diffusion of iron in aluminium. Philos. Mag. 1970, 21, 305–328. [Google Scholar] [CrossRef]
- Mantl, S.; Petry, W.; Schroeder, K.; Vogl, G. Diffusion of iron in aluminum studied by Mössbauer spectroscopy. Phys. Rev. B 1983, 27, 5313–5331. [Google Scholar] [CrossRef]
- Yan, K.; Chen, Z.W.; Zhao, Y.N.; Ren, C.C.; Aldeen, A.W. Morphological characteristics of Al3Sc particles and crystallographic orientation relationships of Al3Sc/Al interface in cast Al-Sc alloy. J. Alloys Compd. 2020, 861, 158491. [Google Scholar] [CrossRef]
- Mandal, P.K.; Kumar, R.J.F.; Varkey, J.M. Effect of artificial ageing treatment and precipitation on mechanical properties and fracture mechanism of friction stir processed MgZn2 and Al3Sc phases in aluminium alloy. Mater. Today Proc. 2021, 46, 4982–4987. [Google Scholar] [CrossRef]
- Alexander, W.B.; Slifkin, L.M. Diffusion of Solutes in Aluminum and Dilute Aluminum Alloys. Phys. Rev. B 1970, 1, 3274–3282. [Google Scholar] [CrossRef]
- Zhao, X.; Chen, H.; Wilson, N.; Liu, Q.; Nie, J.-F. Direct observation and impact of co-segregated atoms in magnesium having multiple alloying elements. Nat. Commun. 2019, 10, 3243. [Google Scholar] [CrossRef] [Green Version]
- Maruhn, J.A.; Reinhard, P.G.; Suraud, E. Density Functional Theory; Springer: Berlin/Heidelberg, Germany, 2010. [Google Scholar]
- Finnis, M.W. The theory of metal-ceramic interfaces. J. Phys. Condens. Matter 1996, 8, 5811–5836. [Google Scholar] [CrossRef]
- Zhou, W.F.; Ren, X.D.; Ren, Y.P.; Yuan, S.Q.; Ren, N.F.; Yang, X.Q.; Adu-Gyamfi, S. Initial dislocation density effect on strain hardening in FCC aluminium alloy under laser shock peening. Philos. Mag. 2017, 97, 917–929. [Google Scholar] [CrossRef]
- Zhao, S.J.; Stocks, G.M.; Zhang, Y.W. Stacking fault energies of face-centered cubic concentrated solid solution alloys. Acta Mater. 2017, 134, 334–345. [Google Scholar] [CrossRef]
- Mardirossian, N.; Head-Gordon, M. Thirty years of density functional theory in computational chemistry: An overview and extensive assessment of 200 density functionals. Mol. Phys. 2017, 115, 2315–2372. [Google Scholar] [CrossRef] [Green Version]
- Kresse, G.; Joubert, D. From ultrasoft pseudopotentials to the projector augmented-wave method. Phys. Rev. B 1999, 59, 1758–1775. [Google Scholar] [CrossRef]
- Hafner, J. Ab-initio simulations of materials using VASP: Density-functional theory and beyond. J. Comput. Chem. 2008, 29, 2044–2078. [Google Scholar] [CrossRef]
- TFischer, H.; Almlof, J. General methods for geometry and wave function optimization. J. Phys. Chem. 1992, 96, 9768–9774. [Google Scholar] [CrossRef]
- Liu, Y.; Wen, J.C.; Zhang, X.Y.; Huang, Y.C. A comparative study on heterogeneous nucleation and mechanical properties of the fcc-Al/L12-Al3M (M = Sc, Ti, V, Y, Zr, Nb) interface from first-principles calculations. Phys. Chem. Chem. Phys. 2021, 23, 4718–4727. [Google Scholar] [CrossRef]
- Henkelman, G.; Uberuaga, B.P.; Jónsson, H. A climbing image nudged elastic band method for finding saddle points and minimum energy paths. J. Chem. Phys. 2000, 113, 9901–9904. [Google Scholar] [CrossRef] [Green Version]
- Lifshitz, I.M.; Slyozov, V.V. The kinetics of precipitation from supersaturated solid solutions. J. Phys. Chem. Solids 1961, 19, 35–50. [Google Scholar] [CrossRef]
- Wagner, C. Zeitschrift für Elektrochemie. Berichte der Bunsengesellschaft für physikalische Chemie. 1961, 65, 7–8. [Google Scholar]
- Mantina, M.; Wang, Y.; Arroyave, R. First-Principles Calculation of Self-Diffusion Coefficients. Phys. Rev. Lett. 2008, 100, 215901. [Google Scholar] [CrossRef] [Green Version]
- Mantina, M.; Wang, Y.; Chen, L.Q.; Liu, Z.K.; Wolverton, C. First principles impurity diffusion coefficients. Acta Mater. 2009, 57, 4102–4108. [Google Scholar] [CrossRef]
- Evangelakis, G.; Papanicolaou, N. Adatom self-diffusion processes on (001) copper surface by molecular dynamics. Surf. Sci. 1996, 347, 376–386. [Google Scholar] [CrossRef]
- Gomer, R. Diffusion of adsorbates on metal surfaces. Rep. Prog. Phys. 1990, 53, 917. [Google Scholar] [CrossRef] [Green Version]
- Bennett, C.H. Exact defect calculations in model substances. Diffus. Solids Recent Dev. 1975, 1, 73–113. [Google Scholar]
- Vineyard, G.H. Frequency factors and isotope effects in solid state rate processes. J. Phys. Chem. Solids 1957, 3, 121–127. [Google Scholar] [CrossRef]
- Yang, B.; Wang, L.-G.; Yi, Y.; Wang, E.-Z.; Peng, L.-X. First-principles calculations of the diffusion behaviors of C, N and O atoms in V metal. Acta Phys. Sin. 2015, 64, 026602. [Google Scholar] [CrossRef]
- Chen, L.; Li, Y.; Xiao, B.; Gao, Y.; Zhao, S. Chemical bonding, thermodynamic stability and mechanical strength of Ni3Ti/α-Al2O3 interfaces by first-principles study. Scr. Mater. 2021, 190, 57–62. [Google Scholar] [CrossRef]
- Wert, C. Diffusion coefficient of C in α-iron. Phys. Rev. 1950, 79, 601. [Google Scholar] [CrossRef]
- Wert, C.; Zener, C. Interstitial atomic diffusion coefficients. Phys. Rev. 1949, 76, 1169. [Google Scholar] [CrossRef]
- Liu, P.; Wang, S.; Li, D.; Li, Y.; Chen, X.-Q. Fast and Huge Anisotropic Diffusion of Cu (Ag) and Its Resistance on the Sn Self-diffusivity in Solid β–Sn. J. Mater. Sci. Technol. 2016, 32, 121–128. [Google Scholar] [CrossRef]
- Ehrhart, P. Atomic Defects in Metals; Springer: Berlin/Heidelberg, Germany, 1991. [Google Scholar]
- Fujikawa, S.I. Impurity Diffusion of Scandium in Aluminium. Defect Diffus. Forum 1997, 143, 115–120. [Google Scholar] [CrossRef]
- Volin, T.E.; Balluffi, R.W. Annealing kinetics of voids and the Self-diffusion coefficient in aluminum. Phys. Status Solidi 2010, 25, 163–173. [Google Scholar] [CrossRef]
- Murphy, J.B. Interdiffusion in dilute aluminium-copper solid solutions. Acta Metall. 1961, 9, 563–569. [Google Scholar] [CrossRef]
- Feng, Y.; Liu, M.; Shi, Y.; Ma, H.; Li, D.; Li, Y.; Lu, L.; Chen, X.Q. High-throughput modeling of atomic diffusion migration energy barrier of fcc metals. Prog. Nat. Sci. Mater. Int. 2019, 29, 341–348. [Google Scholar] [CrossRef]
- Pareige, C.; Soisson, F.; Martin, G.; Blavette, D. Ordering and phase separation in Ni–Cr–Al: Monte Carlo simulations vs. three-dimensional atom probe. Acta Mater. 1999, 47, 1889–1899. [Google Scholar] [CrossRef]
- Marder, M. Correlations and Ostwald ripening. Phys. Rev. A 1987, 36, 858. [Google Scholar] [CrossRef]
- Hirth, J.P.; Lothe, J. Theory of Dislocations, 2nd ed.; Wiley: New York, NY, USA, 1982. [Google Scholar]
- Hutchinson, J.W. Singular behavior at the end of a tensile crack in a hardening material. J. Mech. Phys. Solids 1968, 16, 13–31. [Google Scholar] [CrossRef]
- Rice, J.R.; Rosengren, G.F. Plane strain deformation near a crack tip in a power-law hardening material. J. Mech. Phys. Solids 1968, 16, 1–12. [Google Scholar] [CrossRef]
- Zhang, X.; Ren, X.; Li, H.; Zhao, Y.; Huang, Y.; Liu, Y.; Xiao, Z. Interfacial properties and fracture behavior of the L12-Al3Sc || Al interface: Insights from a first-principles study. Appl. Surf. Sci. 2020, 515, 146017. [Google Scholar] [CrossRef]
- Wang, Y.X.; Arai, M.; Sasaki, T.; Wang, C.L. First-principles study of the (001) surface of cubic CaTiO3. Phys. Rev. B 2006, 73, 035411. [Google Scholar] [CrossRef]
- Vitos, L.; Ruban, A.V.; Skriver, H.L.; Kollár, J. The surface energy of metals. Surf. Sci. 1998, 411, 186–202. [Google Scholar] [CrossRef]


| Dir. | (001) | (110) | (111) | |||
|---|---|---|---|---|---|---|
| Systems | γα/β | ΔECS | γα/β | ΔECS | γα/β | ΔECS |
| Al/Al3Sc | 108.65 108.00 [15] 165.00 [23] 176.00 [23] | 0.32 0.60 [23] - - | 194.41 159.00 [15] 178.00 [15] 193.00 [23] | 1.50 | 204.81 191.00 [23] 189.00 [15] 203.00 [15] | 1.52 |
| Al/Al3Ti | −38.48 61.85 * 52.00 [23] | 0.20 0.30 [15] | −38.90 61.00 | 1.12 | 66.67 79.00 [15] | 1.36 |
| Al/Al3V | −147.83 | 1.77 | −203.77 | 5.10 | −75.76 | 7.56 |
| Al/Al3Cr | −270.04 | 1.52 | −379.95 | 9.92 | −167.43 | 23.16 |
| Al/Al3Mn | −468.86 | −0.14 | −429.65 | 13.80 | −225.66 | 28.62 |
| Al/Al3Fe | −291.22 | 10.64 | −283.37 | 16.58 | −113.54 | 23.69 |
| Al/Al3Co | −200.04 | 12.06 | −205.31 | 14.01 | −49.49 | 22.43 |
| Al/Al3Ni | −195.59 | 5.83 | −176.89 | 6.20 | −109.50 | 15.46 |
| Al/Al3Cu | −143.59 | 0.59 | −108.27 | 2.40 | −48.53 | 8.43 |
| Al/Al3Zn | −53.81 | 0.64 | −88.33 | 0.67 | −33.48 | 0.24 |
| Al/Al3Y | 93.37 | 5.13 | 159.60 | 9.72 | 181.29 | 14.30 |
| Al/Al3Zr | 20.15 | 0.65 | 1.39 | 2.43 | 86.32 | 2.48 |
| Al/Al3Nb | −143.96 | 1.48 | −160.59 | 2.07 | −109.57 | 0.56 |
| Al/Al3Mo | −309.65 | 1.87 | −319.59 | 1.20 | −201.04 | 18.33 |
| Al/Al3Tc | −699.48 | −14.84 | −516.46 | 7.24 | −201.10 | 20.79 |
| Al/Al3Ru | −173.70 | 3.92 | −228.40 | 8.52 | −82.71 | 12.26 |
| Al/Al3Rh | −138.07 | 2.92 | −197.66 | 6.71 | −42.72 | 9.98 |
| Al/Al3Pd | −132.75 | 1.53 | −153.88 | 1.94 | −60.52 | 1.79 |
| Al/Al3Ag | −142.47 | 0.86 | −46.85 | 1.31 | −5.67 | 0.40 |
| Al/Al3Cd | −75.68 | 0.51 | −261.59 | 4.33 | −55.69 | 9.33 |
| Al/Al3Hf | −37.53 | 1.14 | −25.31 | 1.79 | 69.41 | 1.59 |
| Al/Al3Ta | −169.68 | 0.50 | −198.59 | 1.36 | −124.38 | 1.26 |
| Al/Al3W | −232.18 | 0.29 | −467.97 | 4.35 | −276.16 | 4.24 |
| Al/Al3Re | −146.35 | 4.59 | −1242.00 | 26.49 | −396.57 | 33.54 |
| Al/Al3Os | −243.80 | 4.34 | −328.80 | 8.72 | −174.06 | 13.36 |
| Al/Al3Ir | −87.86 | 3.71 | −173.40 | 6.26 | −3.44 | 10.60 |
| Al/Al3Pt | −190.37 | 0.38 | −734.31 | 2.90 | −246.39 | 17.81 |
| Al/Al3Au | −118.52 | 0.58 | −80.77 | 1.02 | −33.30 | 0.67 |
| Al/Al3Hg | −93.95 | 0.94 | −341.48 | 3.64 | −251.40 | 24.04 |
| Systems | (001) | (110) | ||||||
|---|---|---|---|---|---|---|---|---|
| Al-Ter. | AlTM-Ter. | Al-Ter. | AlTM-Ter. | |||||
| Al3Sc | 1.10 | 1.69 | 1.42 | 0.84 | 1.19 | 1.61 | 1.63 | 1.22 |
| Al3Ti | 1.04 | 1.53 | 1.70 | 1.21 | 0.99 | 1.34 | 1.84 | 1.49 |
| Al3V | 1.03 | 1.24 | 1.61 | 1.40 | 0.86 | 1.01 | 1.77 | 1.63 |
| Al3Cr | 0.97 | 0.92 | 1.54 | 1.59 | 0.63 | 0.60 | 1.50 | 1.53 |
| Al3Mn | 0.93 | 0.99 | 1.55 | 1.49 | 0.42 | 0.47 | 1.19 | 1.14 |
| Al3Fe | 1.06 | 1.23 | 1.57 | 1.39 | 0.78 | 0.90 | 1.51 | 1.39 |
| Al3Co | 0.97 | 1.29 | 1.32 | 0.99 | 0.77 | 0.99 | 1.32 | 1.09 |
| Al3Ni | 0.78 | 1.10 | 1.03 | 0.71 | 0.73 | 0.96 | 0.90 | 0.68 |
| Al3Cu | 0.83 | 0.89 | 0.99 | 0.92 | 0.87 | 0.92 | 0.85 | 0.80 |
| Al3Zn | 0.84 | 0.82 | 0.78 | 0.80 | 0.93 | 0.91 | 0.75 | 0.77 |
| Al3Y | 1.13 | 1.63 | 0.96 | 0.46 | 1.12 | 1.47 | 1.34 | 0.98 |
| Al3Zr | 0.88 | 1.46 | 1.36 | 0.77 | 0.88 | 1.29 | 1.59 | 1.18 |
| Al3Nb | 0.81 | 1.16 | 1.32 | 0.97 | 0.70 | 0.95 | 1.61 | 1.37 |
| Al3Mo | 0.36 | 0.51 | 0.88 | 0.73 | 0.26 | 0.36 | 1.17 | 1.08 |
| Al3Tc | 1.02 | 1.29 | 1.62 | 1.35 | 0.00 | 0.18 | 0.77 | 0.59 |
| Al3Ru | 1.17 | 1.67 | 1.62 | 1.11 | 0.80 | 1.15 | 1.53 | 1.18 |
| Al3Rh | 0.85 | 1.54 | 1.01 | 0.31 | 0.66 | 1.15 | 1.04 | 0.55 |
| Al3Pd | 0.58 | 1.05 | 0.67 | 0.20 | 0.44 | 0.80 | 0.47 | 0.12 |
| Al3Ag | 0.68 | 0.63 | 0.53 | 0.58 | 0.72 | 0.68 | 0.50 | 0.53 |
| Al3Cd | 0.81 | 0.63 | 0.23 | 0.41 | 0.72 | 0.60 | 0.40 | 0.53 |
| Al3Hf | 0.96 | 1.45 | 1.63 | 1.14 | 0.94 | 1.29 | 1.78 | 1.43 |
| Al3Ta | 0.91 | 1.10 | 1.66 | 1.46 | 0.75 | 0.89 | 1.82 | 1.68 |
| Al3W | 0.64 | 0.54 | 1.45 | 1.54 | 0.57 | 0.50 | 1.50 | 1.56 |
| Al3Re | 0.90 | 0.95 | 1.76 | 1.70 | 0.00 | 0.04 | 0.93 | 0.89 |
| Al3Os | 1.08 | 1.40 | 1.81 | 1.49 | 0.59 | 0.82 | 1.52 | 1.29 |
| Al3Ir | 1.07 | 1.75 | 1.38 | 0.69 | 0.77 | 1.26 | 1.39 | 0.91 |
| Al3Pt | 0.66 | 1.30 | 0.71 | 0.07 | 0.49 | 0.97 | 0.55 | 0.08 |
| Al3Au | 0.55 | 0.70 | 0.35 | 0.20 | 0.46 | 0.57 | 0.31 | 0.20 |
| Al3Hg | 0.67 | 0.45 | −0.15 | 0.07 | 0.35 | 0.20 | 0.19 | 0.34 |
| Systems | (001) | (110) | (111) |
|---|---|---|---|
| Al | 0.79; 0.93 [23] | 0.87; 0.98 [23] | 0.68; 0.73 [39] 0.81 [23] |
| Al3Sc | 1.26; 1.32 [24] | 1.41; 1.45 [24] | 1.18; 1.22 [24]; 1.17 [39] |
| Al3Ti | 1.37 | 1.42 | 0.92; 0.93 [39] |
| Al3V | 1.32 | 1.32 | 0.72; 0.65 [39] |
| Al3Cr | 1.25 | 1.07 | 0.33 |
| Al3Mn | 1.24 | 0.81 | 0.33 |
| Al3Fe | 1.31 | 1.15 | 0.56 |
| Al3Co | 1.14 | 1.04 | 0.67 |
| Al3Ni | 0.91 | 0.82 | 0.57 |
| Al3Cu | 0.91 | 0.86 | 0.69 |
| Al3Zn | 0.81 | 0.84 | 0.73 |
| Al3Y | 1.05 | 1.23 | 1.06; 1.11 [39] |
| Al3Zr | 1.12 | 1.23 | 0.80; 0.94 [39] |
| Al3Nb | 1.06 | 1.16 | 0.54; 0.59 [39] |
| Al3Mo | 0.62 | 0.73 | −0.32 |
| Al3Tc | 1.32 | 0.39 | −0.22 |
| Al3Ru | 1.39 | 1.17 | 0.44 |
| Al3Rh | 0.93 | 0.85 | 0.46 |
| Al3Pd | 0.62 | 0.46 | 0.21 |
| Al3Ag | 0.61 | 0.61 | 0.46 |
| Al3Cd | 0.52 | 0.56 | 0.47 |
| Al3Hf | 1.30 | 1.36 | 0.87 |
| Al3Ta | 1.28 | 1.29 | 0.66 |
| Al3W | 1.04 | 1.05 | 0.13 |
| Al3Re | 1.32 | 0.46 | −0.32 |
| Al3Os | 1.45 | 1.06 | 0.41 |
| Al3Ir | 1.22 | 1.08 | 0.73 |
| Al3Pt | 0.69 | 0.52 | 0.30 |
| Al3Au | 0.45 | 0.38 | 0.35 |
| Al3Hg | 0.26 | 0.27 | 0.27 |
Disclaimer/Publisher’s Note: The statements, opinions and data contained in all publications are solely those of the individual author(s) and contributor(s) and not of MDPI and/or the editor(s). MDPI and/or the editor(s) disclaim responsibility for any injury to people or property resulting from any ideas, methods, instructions or products referred to in the content. |
© 2023 by the authors. Licensee MDPI, Basel, Switzerland. This article is an open access article distributed under the terms and conditions of the Creative Commons Attribution (CC BY) license (https://creativecommons.org/licenses/by/4.0/).
Share and Cite
Hu, T.; Ruan, Z.; Fan, T.; Wang, K.; He, K.; Wu, Y. First-Principles Investigation of the Diffusion of TM and the Nucleation and Growth of L12 Al3TM Particles in Al Alloys. Crystals 2023, 13, 1032. https://doi.org/10.3390/cryst13071032
Hu T, Ruan Z, Fan T, Wang K, He K, Wu Y. First-Principles Investigation of the Diffusion of TM and the Nucleation and Growth of L12 Al3TM Particles in Al Alloys. Crystals. 2023; 13(7):1032. https://doi.org/10.3390/cryst13071032
Chicago/Turabian StyleHu, Te, Zixiong Ruan, Touwen Fan, Kai Wang, Kuanfang He, and Yuanzhi Wu. 2023. "First-Principles Investigation of the Diffusion of TM and the Nucleation and Growth of L12 Al3TM Particles in Al Alloys" Crystals 13, no. 7: 1032. https://doi.org/10.3390/cryst13071032