Article

Sodium Intercalation in Nitrogen-Doped Graphene-Based Anode: A First-Principles Study

1
Department of Physics and Astronomy, California State University Northridge, Northridge, CA 91330, USA
2
Choate Rosemary Hall, Wallingford, CT 06492, USA
*
Author to whom correspondence should be addressed.
Crystals 2023, 13(7), 1011; https://doi.org/10.3390/cryst13071011
Submission received: 17 May 2023 / Revised: 30 May 2023 / Accepted: 23 June 2023 / Published: 25 June 2023
(This article belongs to the Special Issue Graphene Mechanics Volume III)

Abstract

:
Density functional theory (DFT) and Monte Carlo (MC) simulations were performed to study the adsorption and distribution of Na ions on nitrogen-doped graphenes (NGs). DFT simulations revealed that both pyridinic and pyrrolic NGs enhanced Na adsorption even at higher Na concentrations by introducing electron-deficient vacancies. While Na ions tend to cluster on a pristine graphene, they separate when absorbed on pyridinic NGs due to stronger Na adsorption and Na-Na repulsion. Based on DFT energies, MC simulations were performed to study the distribution of Na on a pyridinic NG as a function of the pyridinic defect concentration and Na concentration. The average size of Na clusters decreases with increasing pyridinic defect concentration. The theoretical specific capacity increases monotonically as the pyridinic defect concentration is increased and reaches a maximum value at a concentration of ~7.5%. This theoretical study suggests that the pyridinic NGs hold promise as anode materials for sodium-ion batteries capable of enhancing Na adsorption, preventing Na clustering, and increasing the anode’s specific capacity.

1. Introduction

Rechargeable batteries with fast charge rates and prolonged lifetimes are critical to modern energy systems such as portable electronic devices, electrical vehicles, etc. Lithium-ion batteries (LIBs) have been used predominantly due to their high energy density and working voltage [1,2,3,4]. However, limited supplies of raw materials for lithium complicate large-scale integration of LIBs [5]. Sodium-ion batteries (SIBs) have emerged as promising candidates for next-generation energy storage devices due to their low cost and the abundance of sodium reserves [6,7,8,9,10].
Both LIBs and SIBs involve Na ion storage by either intercalation into anode layers or surface adsorption [11]. As a result, many successful LIB materials can be adopted for use in SIBs. However, traditional graphite or graphene anodes are ineffective for Na ion storage, resulting in low capacities and poor cycling stability [12,13]. One issue is that the Na ion has a larger radius of 1.16 Å than the Li ion’s radius of 0.90 Å [14], which leads to ineffective Na ion intercalation into the traditional graphite anodes [15]. Another possibility is the weaker adsorption of Na ions on the high-surface-area anodes such as graphene. Density functional theory (DFT) simulations have shown that Na ion adsorption onto graphene is thermodynamically unstable, preventing significant Na ion storage in graphene anodes and leading to excessive cluster formation that reduces charge/discharge rates [16]. In addition, the Na-Na interactions also play a significant role in weakening the Na ion adsorption onto graphene at desirable high Na concentrations [16].
Recently, nitrogen-doped graphene materials (NGs) [17,18,19] have been used as SIB anode materials for their potential to enhance Na ion storage by surface adsorption and expand interlayer distances for improved Na ion intercalation [20,21,22]. For example, Qiao et al. synthesized nitrogen-rich few-layer graphenes which significantly expand the interlayer distance to a range of 4.5 Å to 5.1 Å for Na ion intercalation, resulting in a high rate capability of 56.6 mAh/g at 40 A/g and impressive cycling stability at 211.3 mAh/g after 2000 cycles [23]. Since Na ion adsorption on the NGs underlies the rate capability and specific capacity of SIBs, the elucidation of N-defect–Na and Na-Na interactions is of crucial importance to understand the performance of NG-based anodes. While several DFT studies have studied the effects of N-defect–Na interactions on Na ion adsorption and diffusion [24,25], the effects of N-defects on Na-Na interactions and Na ions have not been explored to the best of our knowledge.
In this study, DFT calculations were performed to compute the adsorption energy of Na ions on pristine graphene and pyrrolic and pyridinic NGs. The Na-Na repulsive interaction energies on pristine graphene and pyridinic NG were estimated. Based on these energies, we employed a Metropolis–Hastings Monte Carlo (MC) model to study the Na distribution in a sheet of pyridinic NG as a function of defect concentration and Na concentration. It is found that pyridinic defects improve the performance of NG-based anodes by reducing Na cluster formation and increasing the specific capacity.

2. Computational Methods and Models

DFT calculations were carried out using the Vienna Ab Initial Simulation Package (VASP) [26] with projector-augmented wave pseudopotentials [27] and the Perdew–Burke–Ernzerhof generalized gradient approximation [28]. An energy cutoff of 400 eV was used for the plane-wave basis set. The Brillouin zone was sampled by k-points generated from the Monkhorst–Pack scheme [29]. The van der Waals (vdW) interaction was described by the semiempirical DFT-D2 scheme of Grimme [30]. The energy convergence criterion was 0.1 meV per atom. All atoms were fully relaxed with a force convergence criterion of 0.01 eV/Å.
We considered NGs with two bonding configurations, namely, pyrrolic and pyridinic NGs, whose atomic structures are shown in Figure 1a,c, respectively. The pyrrolic structure consists of two C vacancies and a N atom centered at the mid-point of these vacancies. The pyridinic structure contains two C vacancies and a N atom located on one vacancy. Because the interaction between a Na ion and N-defect involves significant charge transfer, much weaker interlayer interactions between anode layers were not considered. For single Na adsorption, single-layer NGs were modeled by a 5 × 5 × 1 supercell with a vacuum thickness of 23 Å perpendicular to the plane. A dense k-point mesh of 11 × 11 × 1 is used, which yields the converged total energy. We find that the hollow sites are energetically favorable for Na adsorption. As shown in Figure 1, all possible adsorption sites are labeled by (x, y) where x and y are the indices along the lattice vectors, respectively. For double Na adsorption, single layer NGs are modeled by a 9 × 9 × 1 supercell with a vacuum thickness of 23 Å. Due to the larger supercell, a less dense k-point mesh of 5 × 5 × 1 could yield the converged results. To study Na-Na interactions in the presence of the N-defect, one Na atom was placed in the energetically most stable site, and another Na atom was placed in hollow sites with varying distances from the N-defect. We also calculated the Na-Na interaction energy as a function of Na-Na distance in the pristine graphene for comparison.
Using the DFT-determined energies, MC simulations were performed on a NG sheet of 50 × 50 × 1 unit cells in size. More specifically, the total energy of the system was calculated as a sum of single-body Na adsorption energy and two-body Na-Na interaction energy. For calculations of the interaction energy, all Na atoms were assumed to reside in the center of the lattice hollow site. For pairs of Na atoms within one unit cell of separation, the interaction energy was directly extracted from DFT energies. For pairs of Na atoms with separations greater than 1 unit cell, the interaction energy was fitted according to a 1/r Coulomb potential energy based on DFT results. The Metropolis–Hastings algorithm was employed to simulate the canonical (NVT) ensemble [31,32]. The temperature of the system was kept at 300 K. Since the pyrrolic defect can reconstruct into a pyridinic defect in the presence of Na adsorption, only the pyridinic defect was modeled in the MC simulations. Considering that the concentration of the pyridinic defect was around 7.6% in the experimental samples [23], the NG sheet was populated with pyridinic defects at concentrations varying from 3% to 10% at 1% intervals. There exists a threshold of Na concentration above which the total energy will become positive (the adsorption of Na on NG is energetically unfavorable) considering the repulsive Na-Na interaction. The Na concentration varied from 1.5% to the threshold value with 0.5% intervals. At each defect and Na concentration, 150,000 MC simulation steps were performed in which the first 50,000 MC steps were discarded for thermal relaxation. The total system energy was found to approach a steady value after around 50,000 MC steps.

3. Results and Discussion

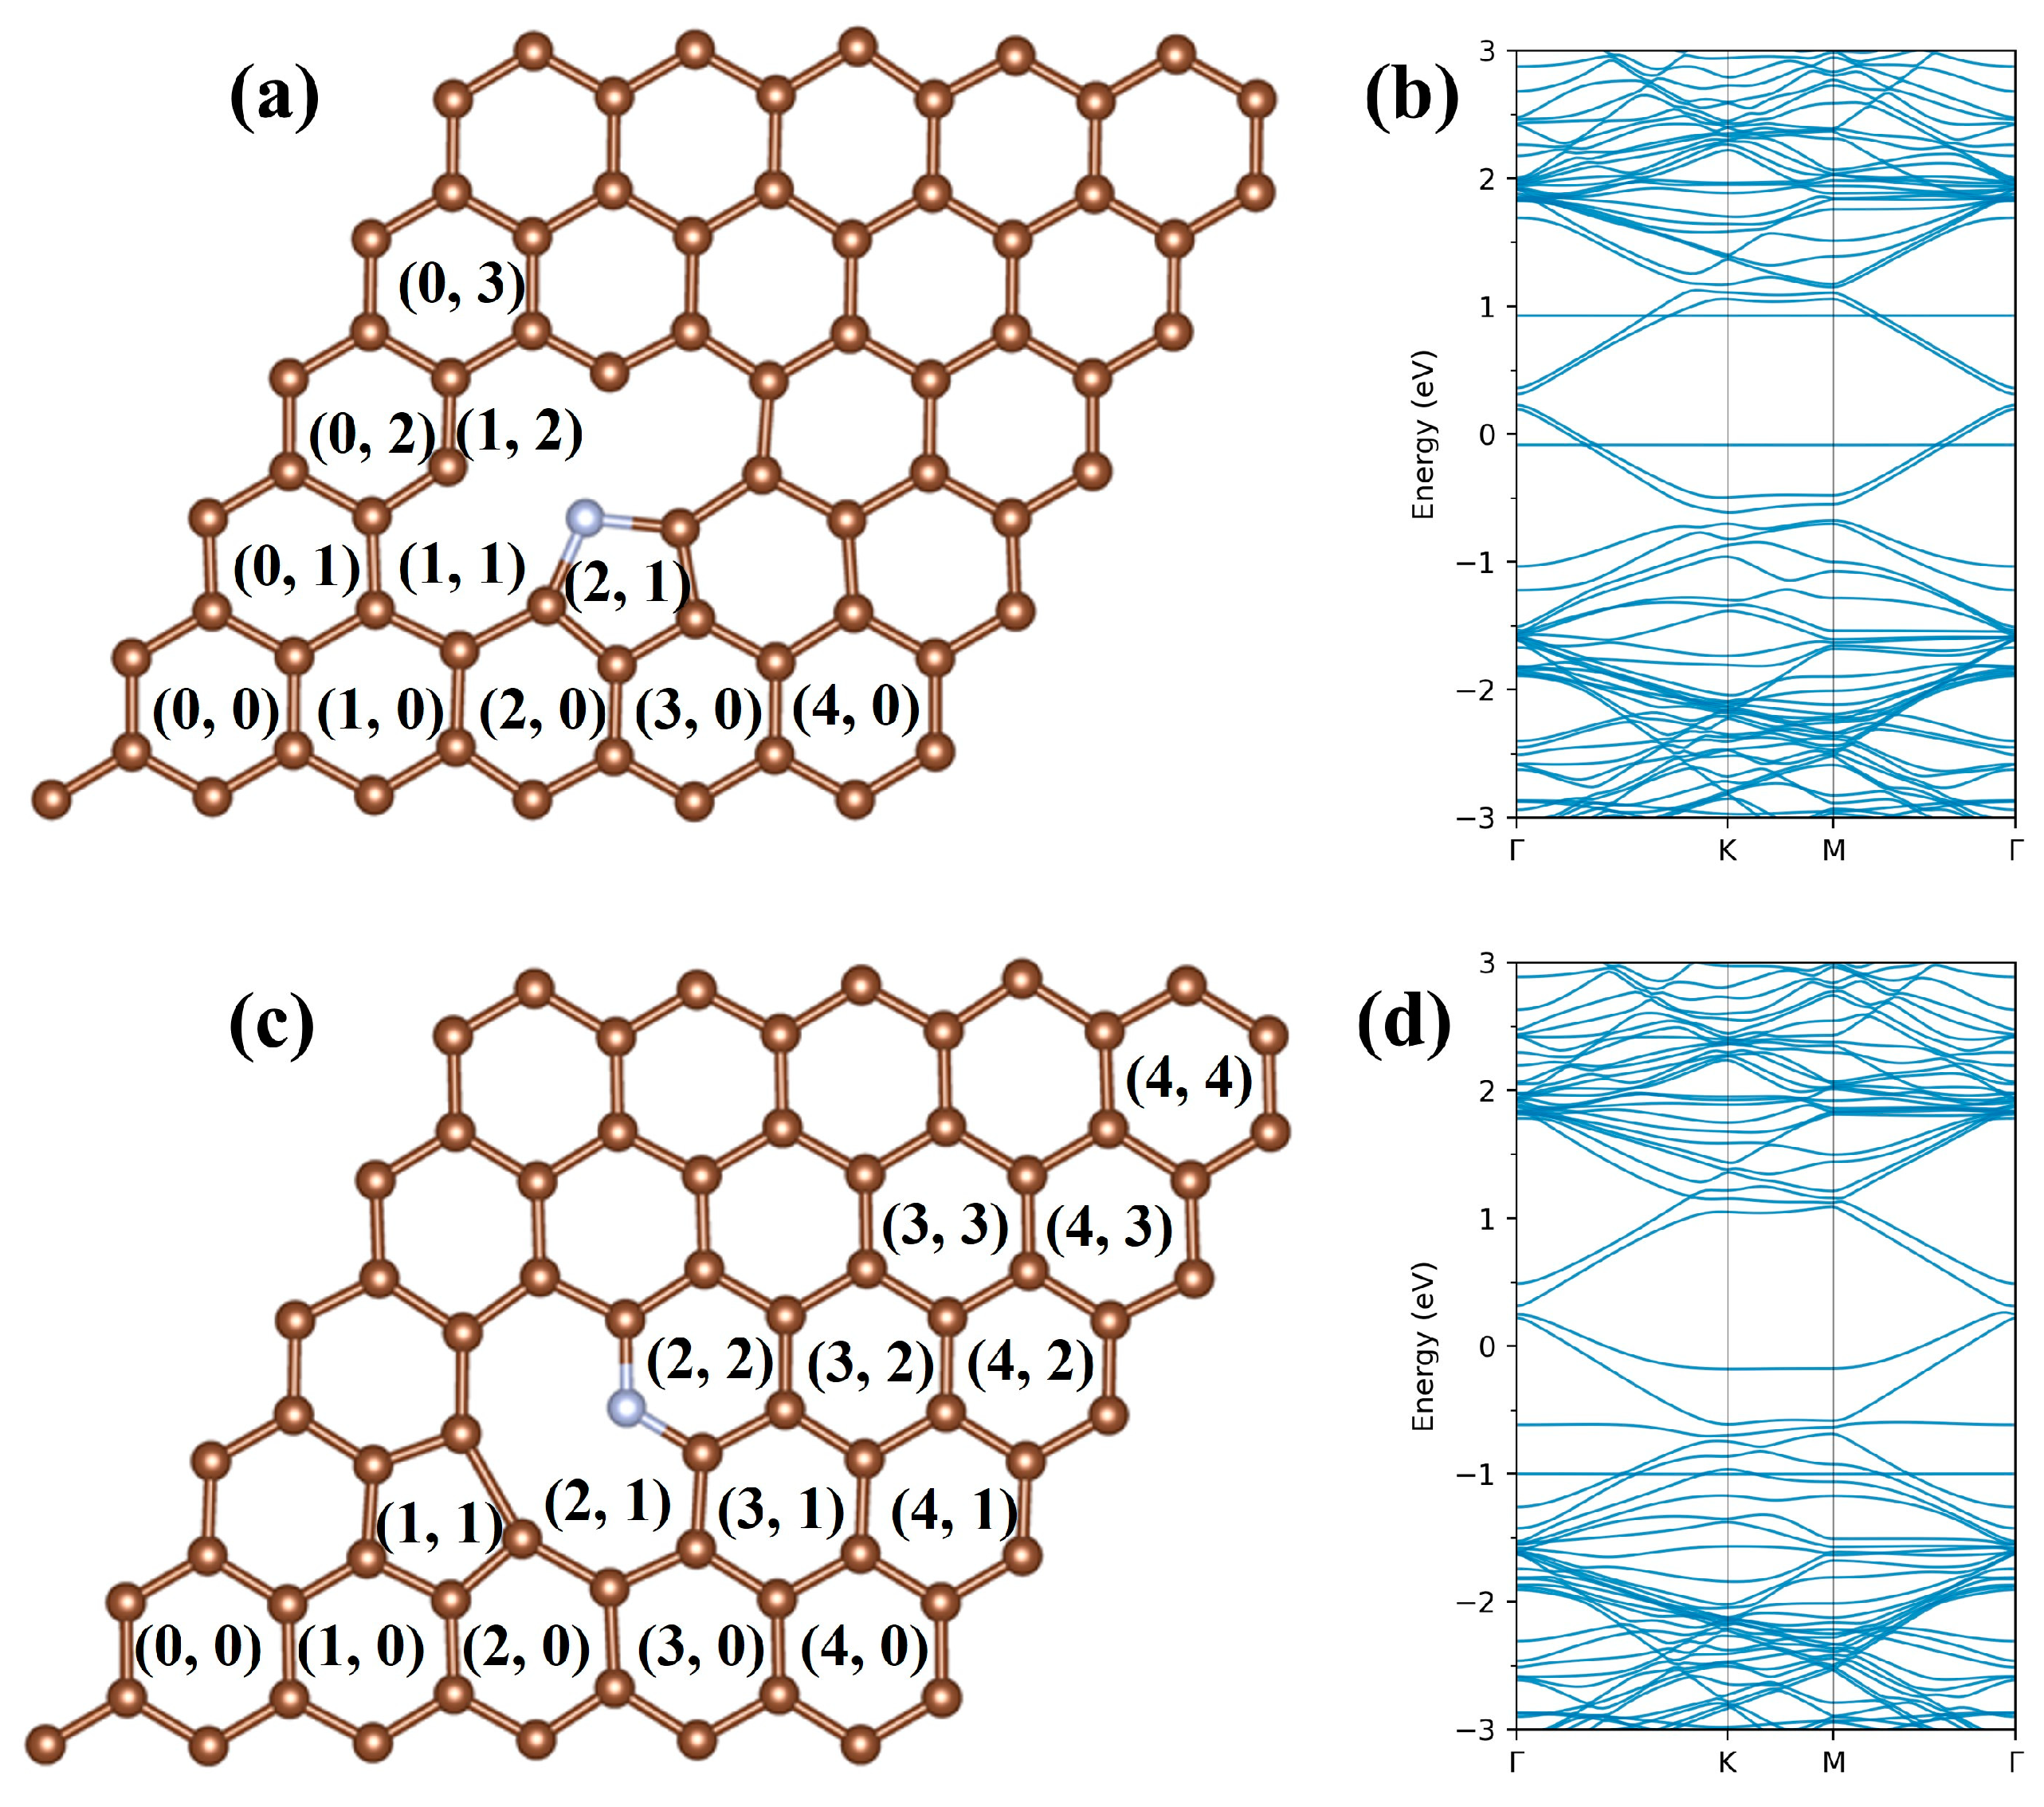
3.1. Single Na Adsorption

We first simulated the adsorption of a single Na atom on the pyrrolic and pyridinic NGs. The adsorption energy was employed to quantify the interaction between Na and the NGs, which is defined as
E a d s , 1 = E N G + N a E N G E [ N a ]
where E N G + N a and E N G are the energies of the NG with and without the adsorption of a single Na atom, respectively. E [ N a ] is the energy of an isolated Na atom in the gas phase. Negative E a d s , 1 implies that Na adsorption onto the NG is energetically more favorable than in the vacuum. The lower the E a d s , 1 , the stronger the interaction between the adsorbed Na and NG. More specifically, if E a d s , 1 is higher than the chemical potential of Na in bulk ( 1.3 eV), clustering of Na occurs in the anode and significantly reduces anode charge/discharge rates. The calculated adsorption energies are summarized in Table 1.
In contrast to the adsorption of Na on the pristine graphene [16], NGs enhance Na adsorption since the values of E a d s , 1 are lower than the chemical potential of Na in bulk. For both pyrrolic and pyridinic NGs, the most stable adsorption site is located at the vacancy center of the N-defect, consistent with previous DFT studies [24]. As shown in Figure 1b,d, the Fermi level shifts by about 0.3 eV below the Dirac point, resulting in a p-type doping for both NGs due to their electron-deficient character. Thus, the electron-deficient vacancy provides a more energetically favorable region for charge transfer from Na to the defect. Bader charge analysis [33] shows 0.99e charge on the adsorbed Na, indicating that the Na atom has lost nearly all of its 3s electron.
We also plotted the differential charge density shown in Figure 2, defined as
Δ ρ = ρ N G + N a ρ N G ρ N a
where ρ N G + N a and ρ N G are the charge densities of the NG with and without the adsorbed Na, respectively. ρ [ N a ] is the charge density of an isolated Na atom. The plot of differential charge density also confirms charge transfer from Na to the vacancy, which strengthens the ionic bonding between Na and N-defect and results in lower adsorption energy. Lower adsorption energy on other sites near the N-defect, when compared with pristine graphene, might originate from disrupted π -bonds from the presence of the N-defect. This lowers the structural stability and enhances the Na adsorption [34]. On one hand, the enhanced adsorption of Na on NGs could increase Na ion storage and reduce the formation of Na clusters in the anode. On the other hand, stronger interactions between Na and the N-defect when Na is absorbed at the lowest energy site trap the Na ion, hindering further mobility.
For the pyrrolic NG, there exists a metastable state for Na adsorption. When Na is adsorbed on the (1, 1) site, as shown in Figure 1, the pyrrolic configuration is reconstructed into a pyridinic configuration with Na adsorbed onto the pyridinic vacancy center. This structural reconstruction occurs instantaneously without overcoming any energy barriers. Considering that pyrrolic defects primarily contribute to increased interlayer distance in NG-based anodes for improved intercalation [23], the structural reconstruction from pyrrolic to pyridinic might suggest an aging problem with reduced cycling stability for the NG anode materials, as the concentration of pyrrolic defects lowers over time under Na adsorption. However, the reconstruction could be alleviated when the most stable (1, 2) site has already been occupied by a Na ion, due to the repulsive Na-Na interaction reducing the possibility of an additional Na ion occupying the (1, 1) site.

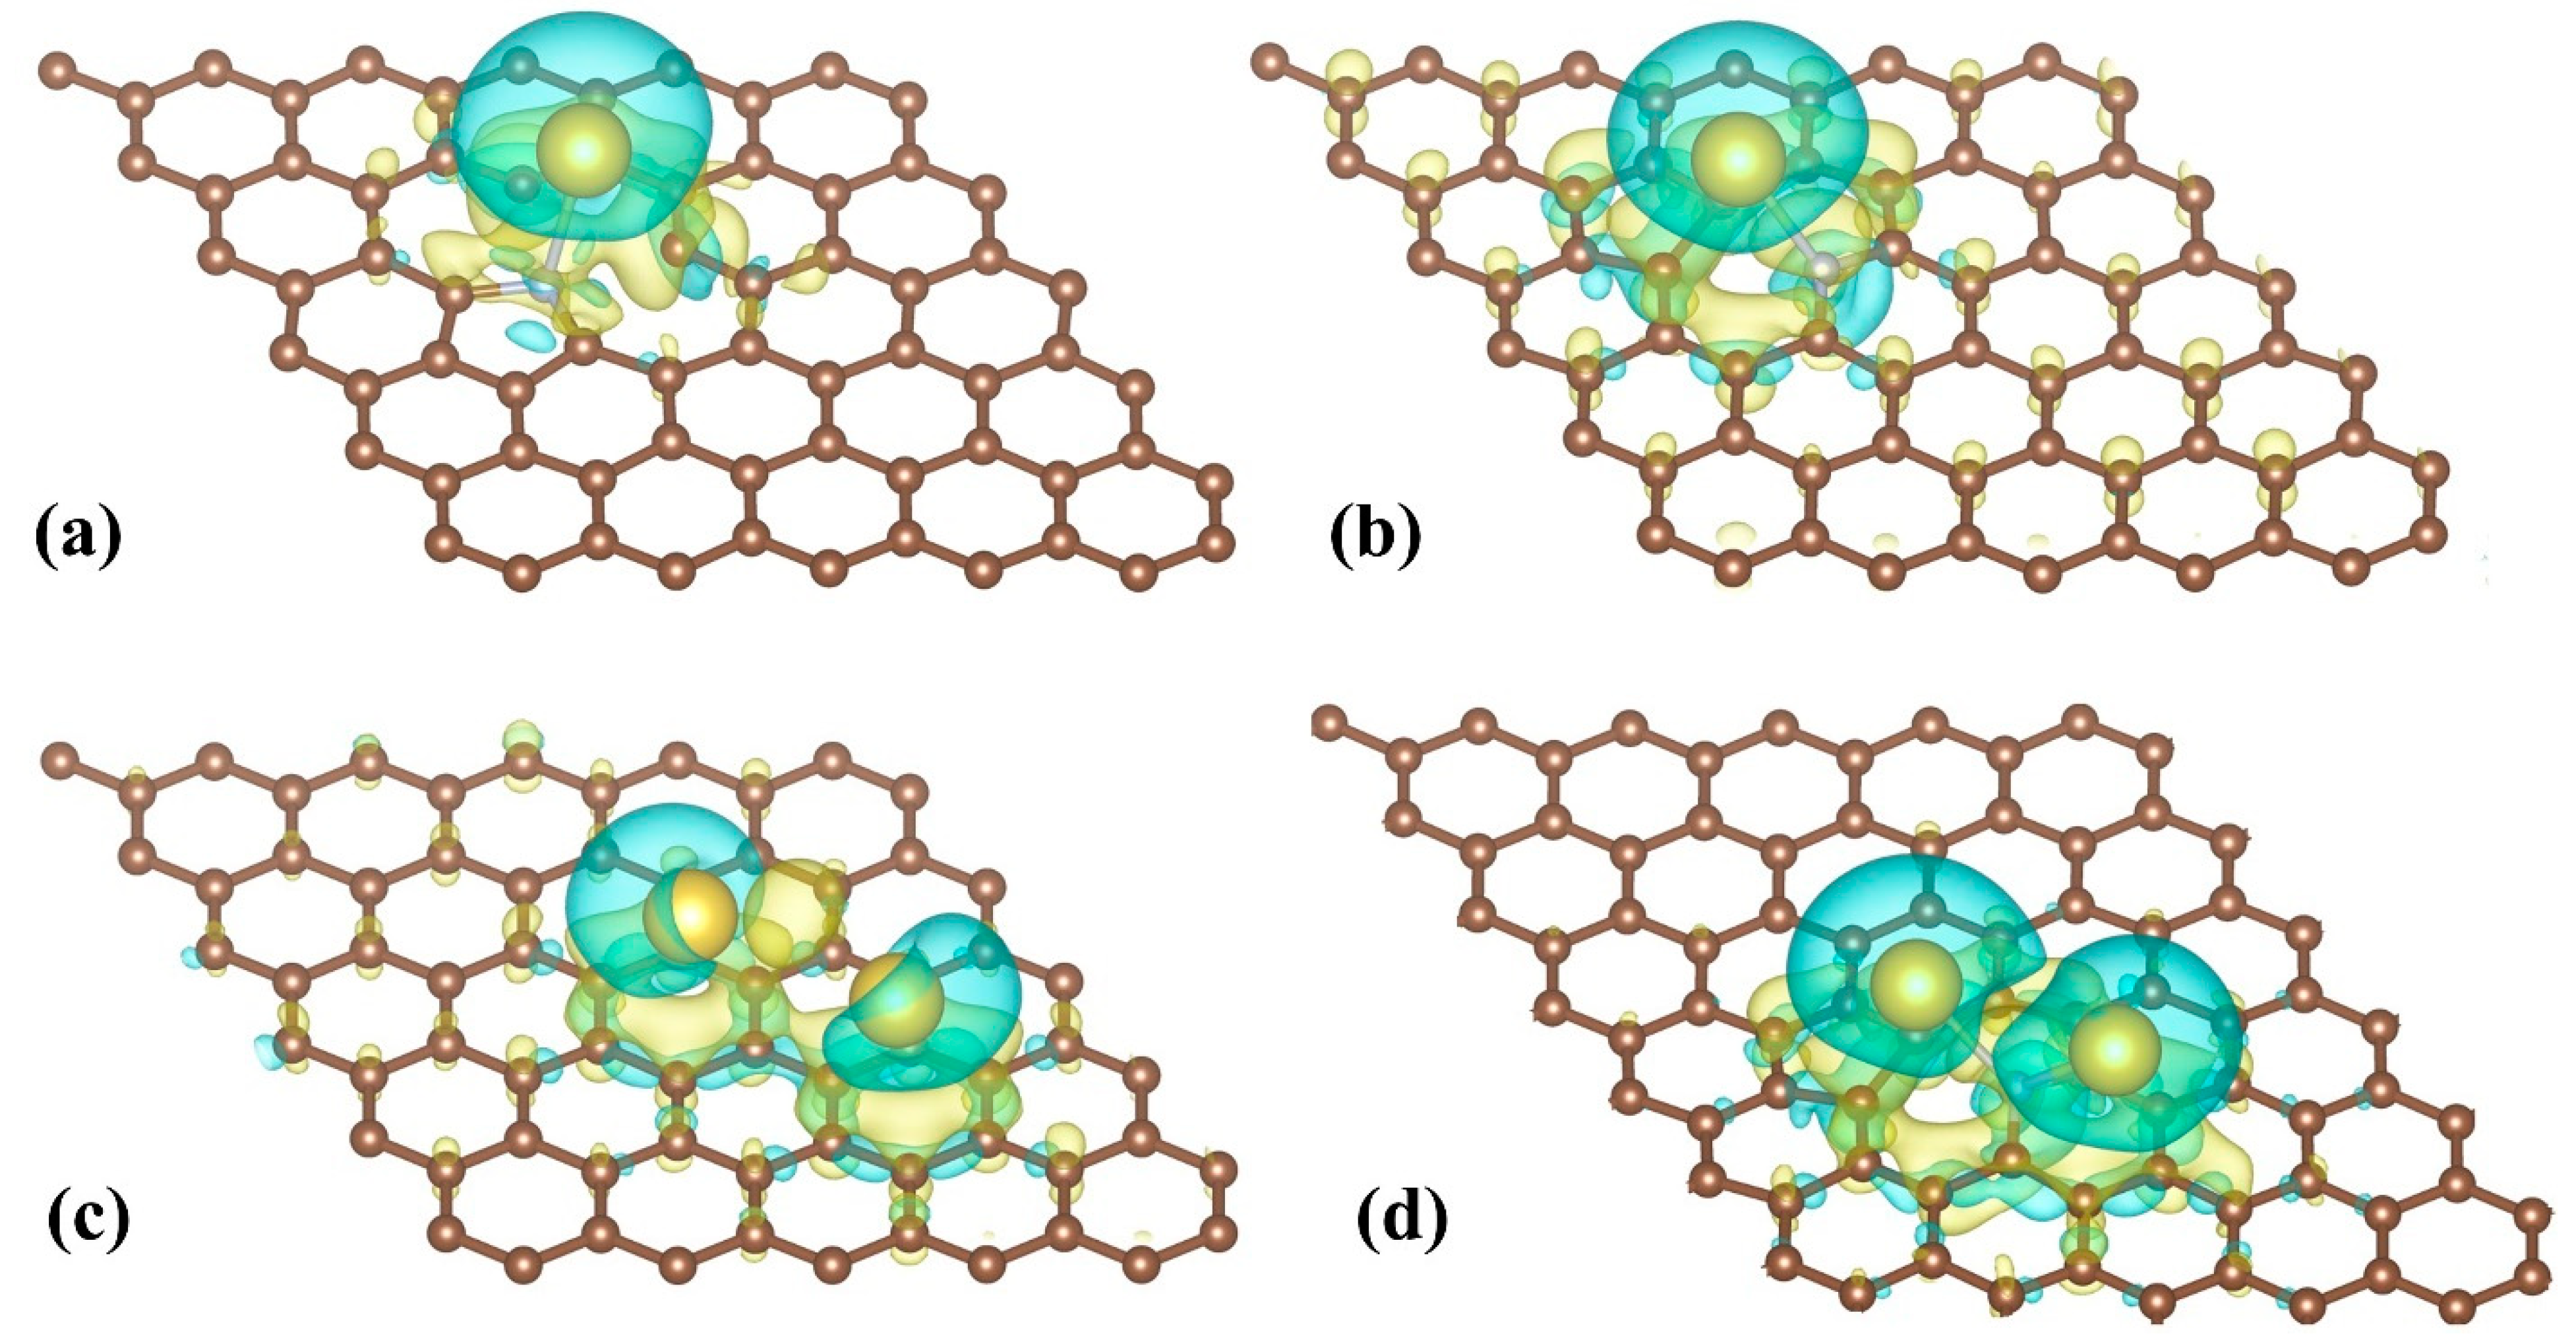
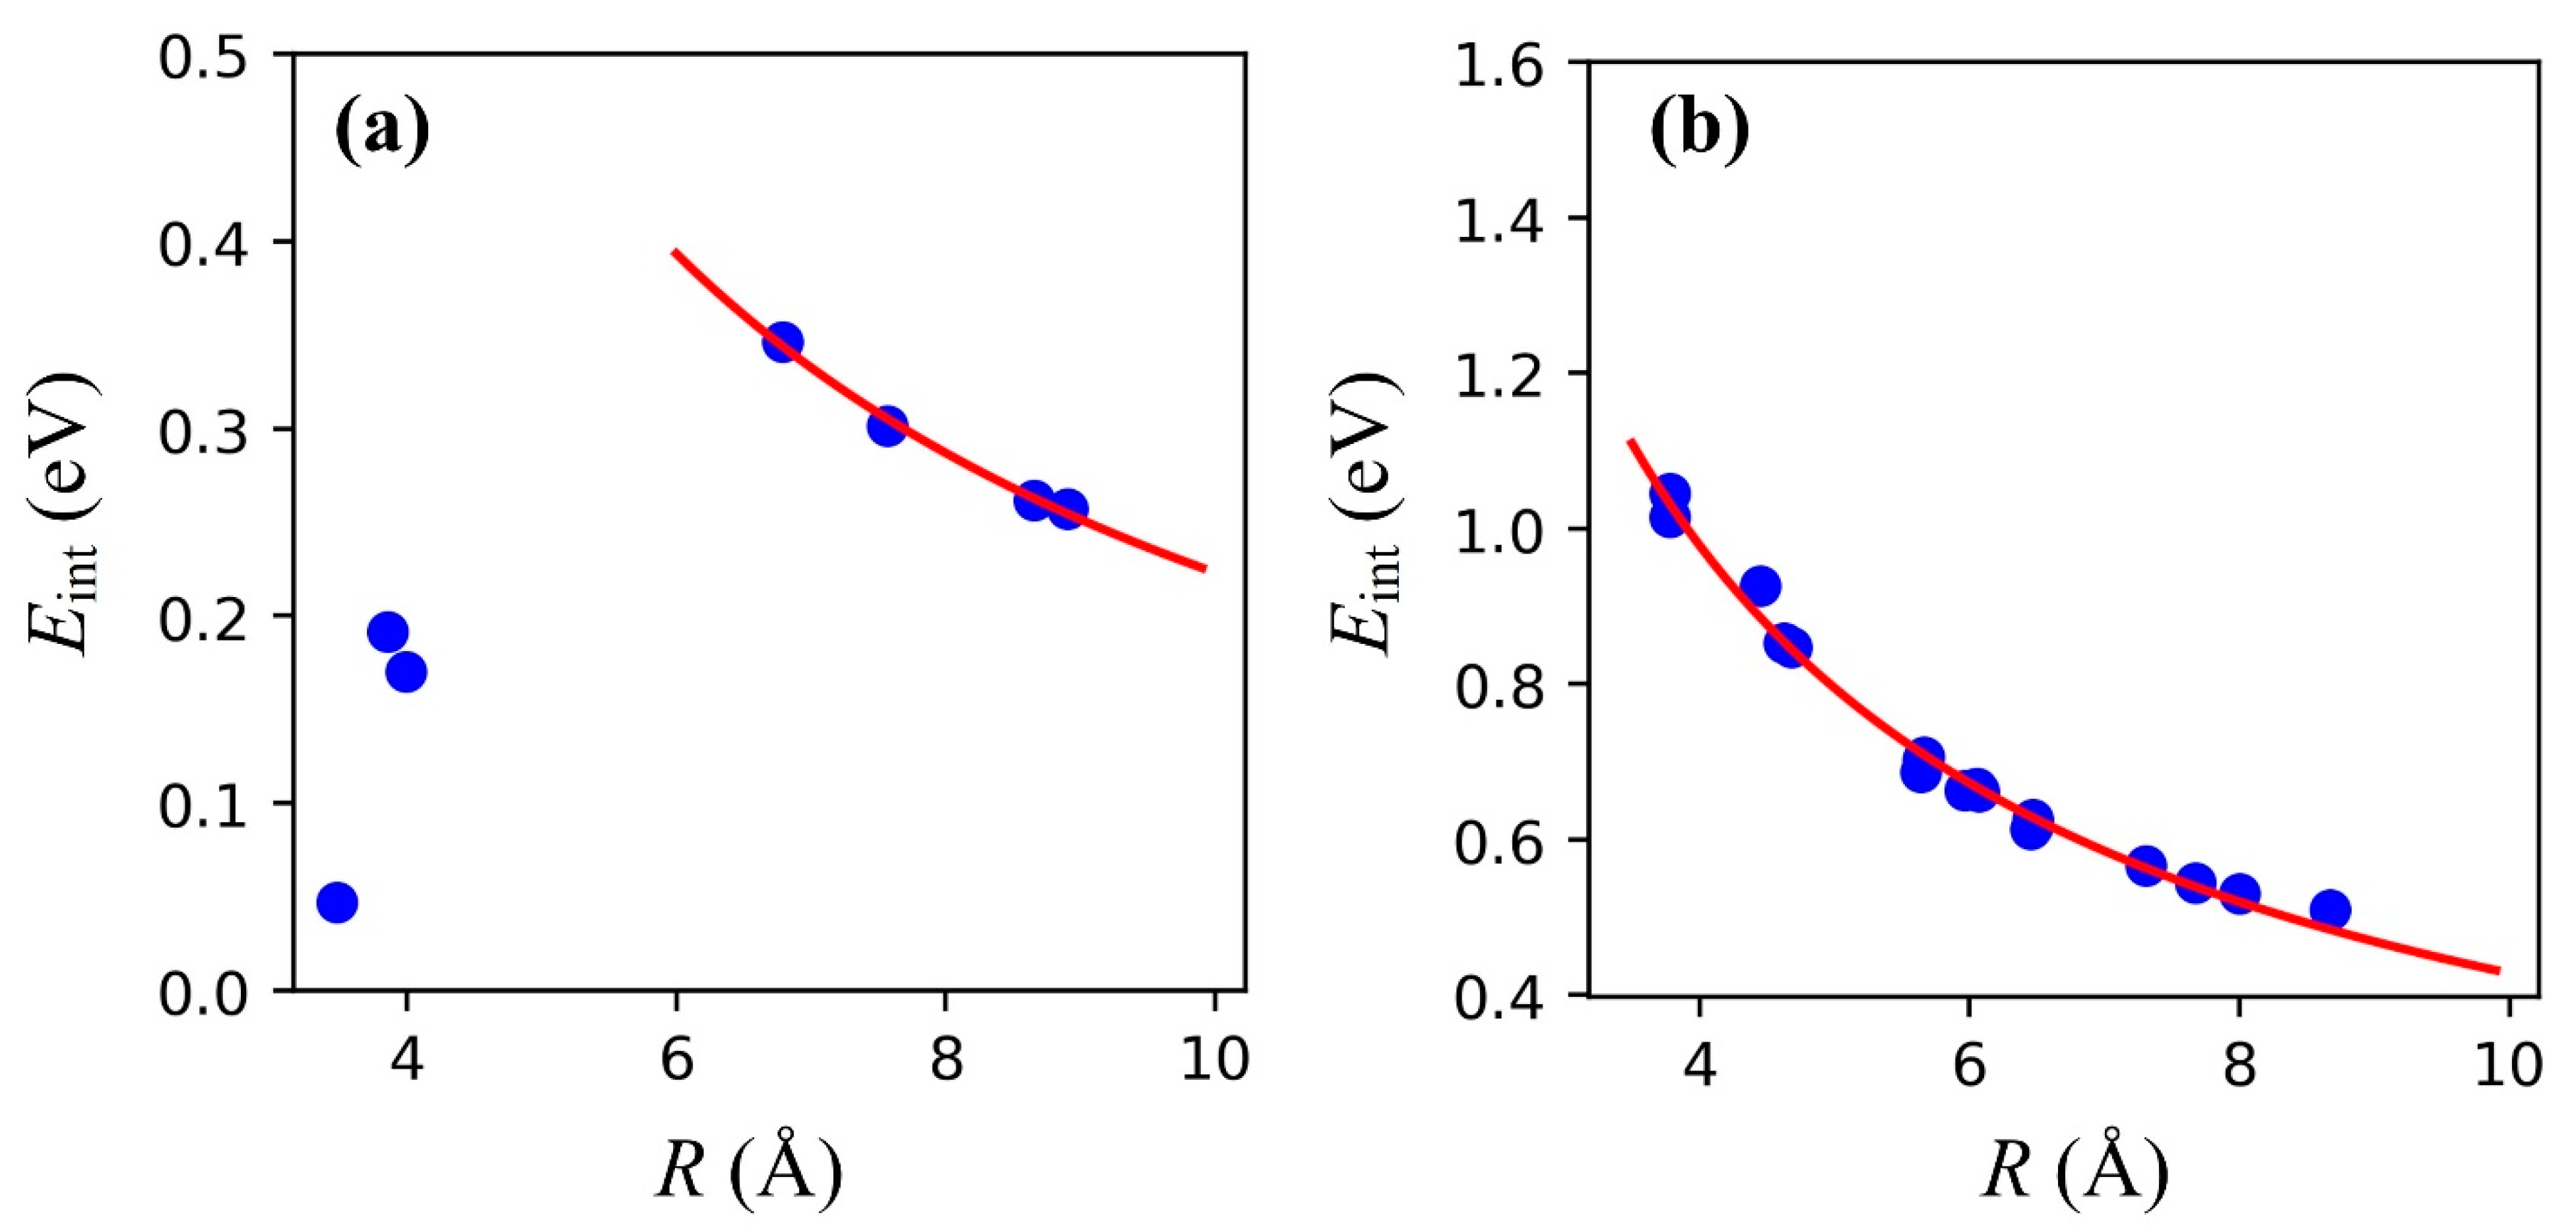
3.2. Double Na Adsorption and Na-Na Interactions

Multiple Na adsorptions and Na-Na interactions play an important role for Na ion adsorption onto the anode. In this subsection, we focus on double Na adsorptions on NGs and the effect of N-defects on Na-Na interactions. Considering that the pyrrolic NGs may reconstruct to pyridinic NGs in the presence of Na adsorption, only the pyridinic NG was studied here. The adsorption energy for the second Na adsorption when the first Na is adsorbed on the most stable site is defined as
E a d s , 2 = E N G + 2 N a E N G + N a E [ N a ]
where E N G + 2 N a and E N G + N a are the energies of a single-Na-adsorbed pyridinic NG at the (2, 1) site with and without the adsorption of the second Na, respectively. Like E a d s , 1 , a negative value of E a d s , 2 implies that double Na adsorption onto the NG is energetically favorable over Na in a vacuum. A lower E a d s , 2 compared with the chemical potential of Na in bulk is favorable, since it indicates reduced clustering of Na. The Na-Na interaction energy is determined by
E i n t = E N G + 2 N a + E N G E N G + N a 1 E N G + N a 2
where E N G + N a 1 and E N G + N a 2 are the energies of the NG with only the first and second Na adsorbed, respectively. Positive E i n t indicates Na-Na repulsion while negative E i n t indicates Na-Na attraction. A greater magnitude of E i n t corresponds to a stronger Na-Na interaction.
Table 2 shows the values of E a d s , 2 and E i n t when the second Na atom is placed on the adsorption site ranging from the first to the fourth nearest neighbor of the pyridinic vacancy center. The results of E a d s , 2 and E i n t for pristine graphene are shown in Table 3 for comparison. For pristine graphene, E a d s , 2 is about 0.1 eV higher than E a d s , 1 , indicating less energetic stability for multiple Na adsorption, consistent with previous theoretical results [16]. In addition, E a d s , 2 is higher than the chemical potential of Na in bulk, potentially resulting in Na clustering for a graphene-based anode. However, in the pyridinic NGs, E a d s , 2 is about 0.1 eV lower than E a d s , 1 , suggesting that the pyridinic defect slightly increases the favorability of multiple Na adsorption. In addition, the lower E a d s , 2 in the pyridinic NGs compared with the chemical potential of Na in bulk prevents the clustering of Na. Thus, in contrast to graphene, the pyridinic NGs effectively enhance the Na storage capability even at high Na concentrations.
Next, we analyzed Na-Na interactions for both pristine graphene and the pyridinic NG. As shown in Figure 3, for the pristine graphene, E i n t as a function of interatomic distance R follows 1 / R when R is larger than 6 Å (corresponding to the third nearest neighbor), suggesting that the Na-Na interaction is dominated by the electrostatic repulsion. More specifically, E i n t is about 0.4 eV at R = 6 Å, which is in line with the screened Coulomb repulsive energy considering the dielectric constant of graphene. However, when R is smaller than 4 Å, E i n t decreases with decreasing R, indicating a weakened Na-Na repulsion due to the following 2 factors. Firstly, the Bader charge analysis shows 0.6 e charge on the Na when R < 4 Å compared with 0.99e charge when R > 6 Å. Thus, less positively charged Na ions result in a weakened Coulomb repulsion. Secondly, the differential charge density plot in Figure 2c shows accumulated charge lying in between the two Na atoms when R < 4 Å. The accumulated charge serves as a Na-Na “bond” to attract the two Na atoms, weakening the repulsion. On the other hand, the variation in E i n t is found to closely match 1 / R for all studied configurations ranging from the first to fourth nearest neighbor in the pyridinic NG. The Bader charge analysis shows 0.99 e charge on the Na ions, while the differential charge density in Figure 2d indicates no charge accumulation between the Na atoms. Thus, electrostatic repulsion dominates the Na-Na repulsion throughout a wide range of R for pyridinic NGs. The Na-Na interaction for Na absorbed onto pyridinic NGs is stronger than that for pristine graphene, which might be induced by less screening due to disrupted π -bonds in the NG.

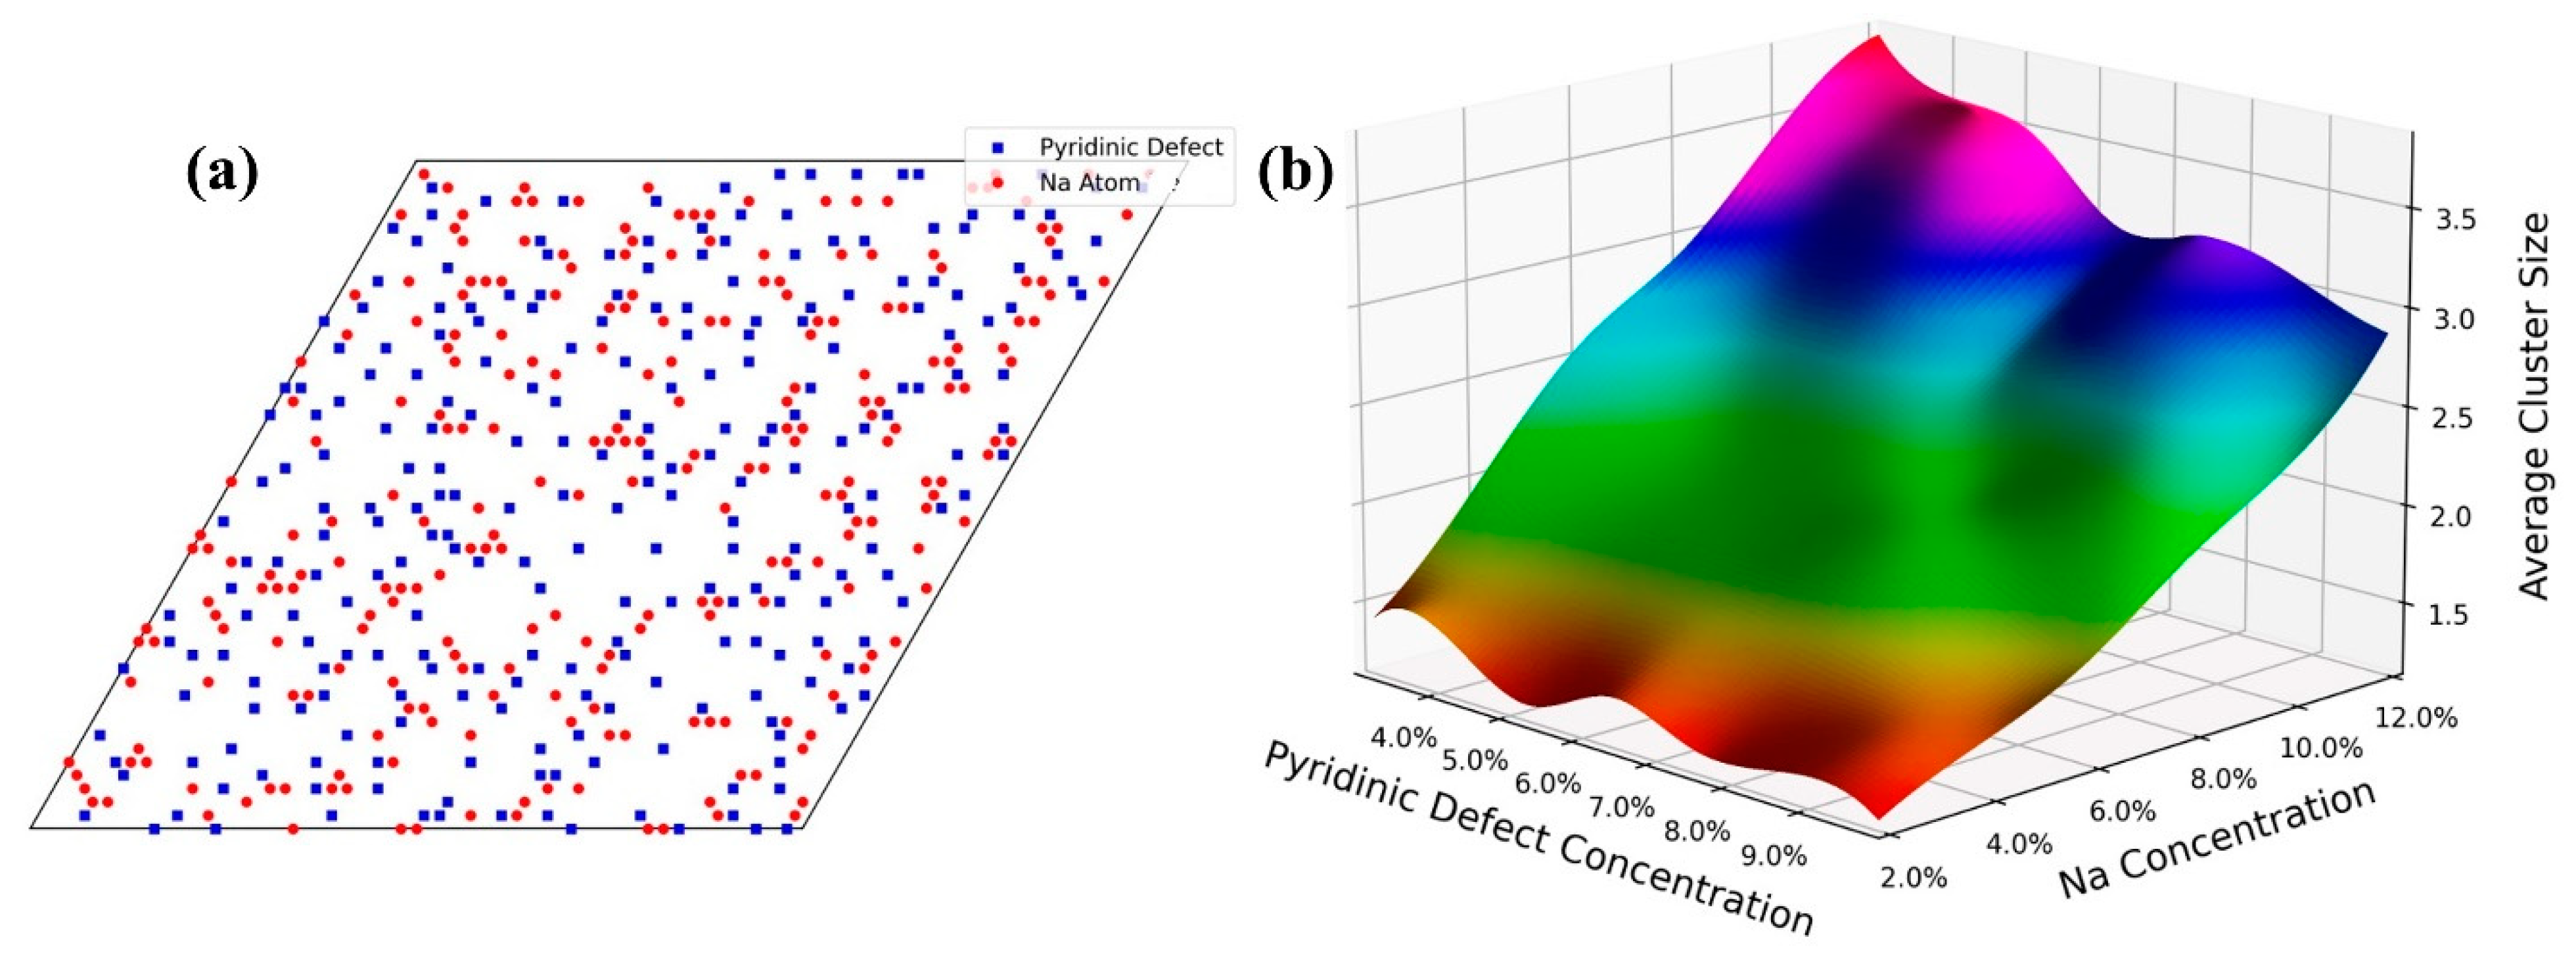
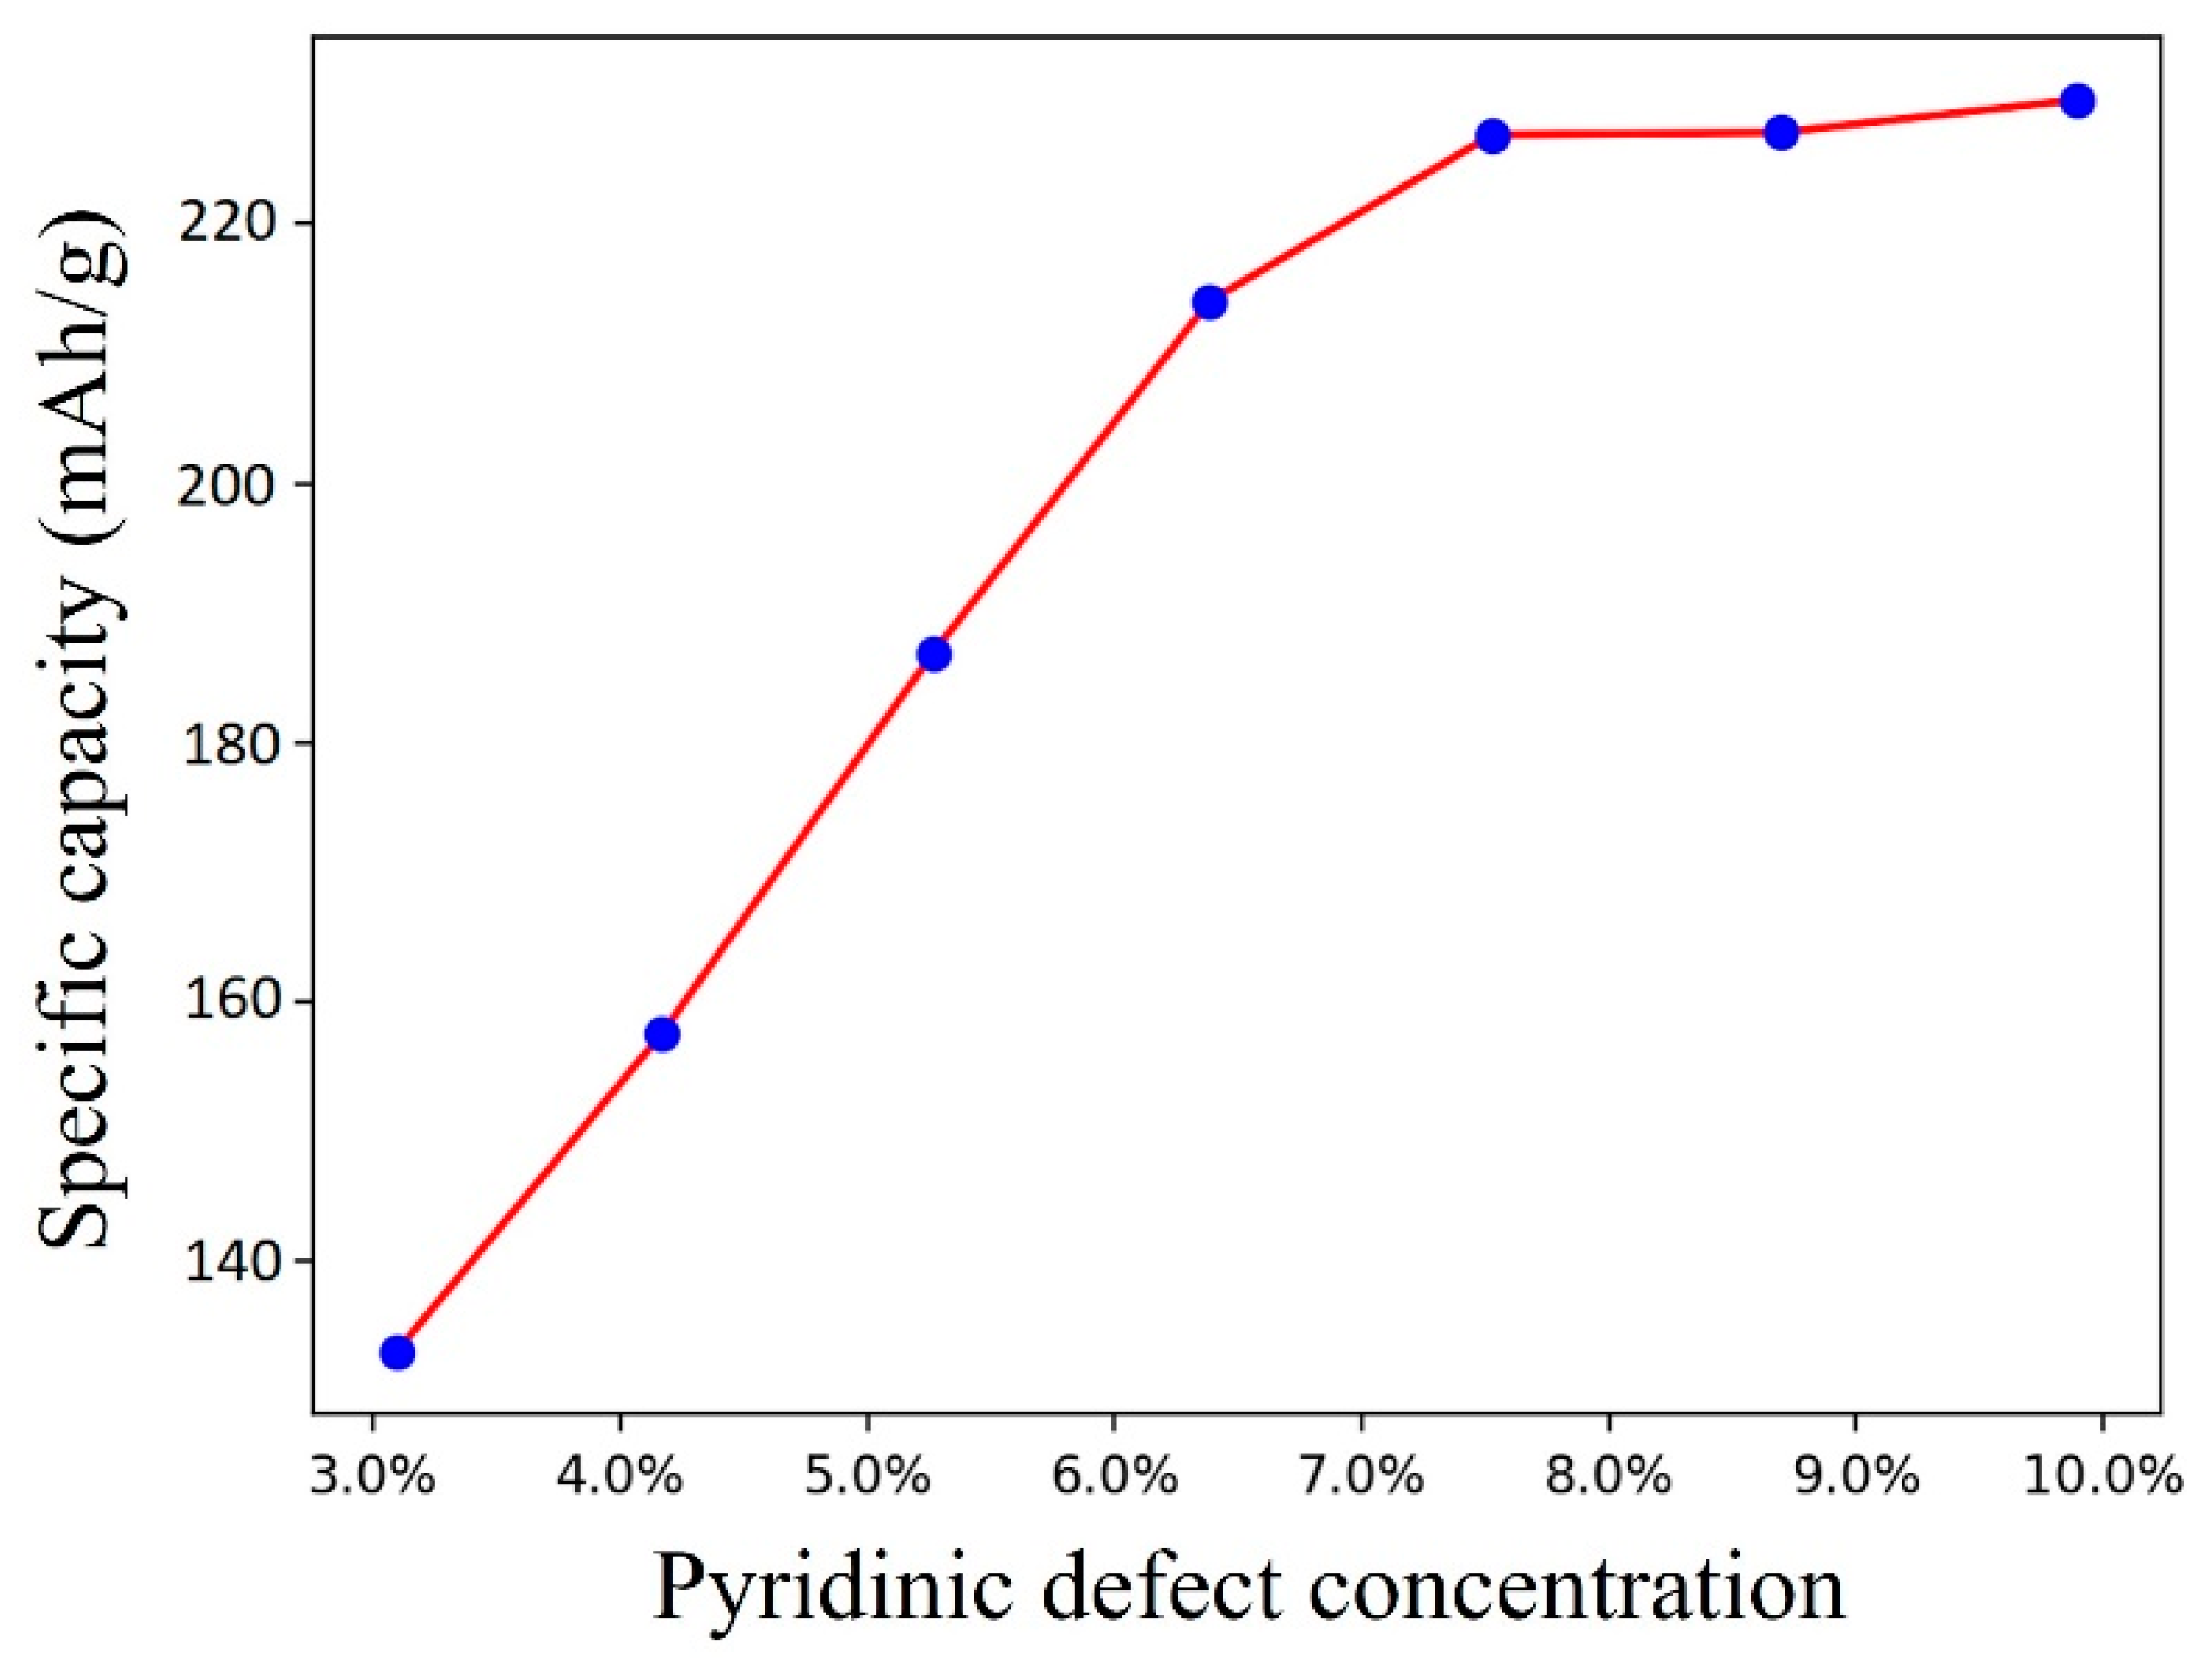
3.3. Na Distributions and Specific Capacity

With DFT-determined values for E a d s , 1 , E a d s , 2 , and E i n t , MC simulations were performed to characterize the distribution of Na ions on the pyridinic-NG-based anode as a function of Na ion and defect concentrations. Based on the above DFT results, we found that Na ions tend to segregate when absorbed on sites far away from the pyridinic defect due to weaker adsorption and smaller Na-Na repulsive interactions for pristine graphene. However, the adsorption sites near the pyridinic defects attract the Na ions because of lower adsorption energies. These sites tend to separate Na ions because of stronger Na-Na repulsion. Thus, the competition between the one-body adsorption energy and the two-body Na-Na repulsive interaction energy plays an important role for the Na distribution in the pyridinic NG sheet. Figure 4a depicts a highly possible Na distribution on the pyridinic NG sheet at a defect concentration of 5% and Na concentration of 5% from the MC simulations. One can see that the Na ions occupy the sites around the pyridinic defects without noticeable cluster formation. Na clustering is important to the performance of the anode since excessive cluster formation can significantly reduce charge/discharge rates. To determine the size of the Na clusters, the average cluster size was defined as the number of Na ions in a group such that any Na ion is at most a second nearest neighbor from at least one other Na ion in the group. The average cluster size as a function of the pyridinic defect concentration and the Na concentration is shown in Figure 4b. The average cluster size increases with increasing Na concentration. More importantly, the average cluster size generally decreases as the pyridinic defect concentration increases. More sites with enhanced adsorption near defects are available at higher defect concentrations, separating Na ions to reduce their interaction energies. This suggests that a higher concentration of pyridinic defect benefits the SIB by effectively reducing Na clustering.
The specific capacity of the anode is directly proportional to the maximum Na concentration at which Na adsorption remains energetically favorable. More specifically, the theoretical specific capacity can be determined by
C = N N a N A e r M N G
where N N a is the maximum adsorbed Na ions per mole of unit cells in the pyridinic NG substrate, N A is the Avogadro constant, e is the electron charge, r = 3.6 is the conversion factor from mAh to Coulombs, and M N G is the mass of 1 mole of the pyridinic NG. N N a is calculated as two times the upper limit of the Na concentration, considering that absorption can occur on both sides of the NG sheet. The total energy as a function of the Na concentration was obtained from the MC simulations, and N N a was determined as the Na concentration when the total energy is zero. Figure 5 displays the theoretical specific capacity as a function of pyridinic defect concentration. The specific capacity initially increases for higher pyridinic defect concentrations as more pyridinic sites with enhanced absorption become available. The graphs become almost flat for defect concentrations higher than 7.5%. The predicted maximum specific capacity is about 230 mAh/g, which is close to the experimental value of 211 mAh/g at the pyridinic defect concentration of 7.6% [23]. Thus, a higher concentration of pyridinic defect benefits the SIB by increasing the specific capacity. Note that our predicted specific capacity is lower than the highest specific capacity of 384 mAh/g from previous DFT simulations [23]. This might be caused by overestimating the Na-Na repulsive interaction in the MC model and the neglect of three-body (and higher) interactions that could lower the interaction energy.

4. Conclusions

In summary, we performed DFT simulations to study Na adsorption onto a single-layer NG sheet. The Na adsorption on the pristine graphene was determined for comparison. Both pyrrolic and pyridinic NGs have lower single and double Na adsorption energies than the pristine graphene by introducing the electron-deficient vacancy. More specifically, the adsorption energy on the pyrrolic and pyridinic NGs is below the chemical potential of bulk sodium, which suggests that the pyrrolic and pyridinic NGs can effectively increase the Na ion storage. In the presence of Na adsorption, the pyrrolic defect could simultaneously transform to the pyridinic defect without any energy barriers. The Na-Na repulsion is much lower on the pristine graphene when the separation of 2 Na ions is less than 5 Å due to the formation of a Na-Na “bond”. However, the Na-Na repulsion in the pyridinic NG is a pure electrostatic interaction. In contrast to the tendency of Na clustering on the pristine graphene, the pyridinic NG has a stronger Na adsorption and Na-Na repulsive interaction which tend to separate the Na ions and prevent Na clustering.
Using DFT energies as input parameters, MC simulations were performed to study the Na distribution on the pyridinic NG sheet. We found that the competition between the one-body Na adsorption and the two-body Na-Na repulsive interaction plays an important role for the Na distribution. More importantly, the average size of the Na cluster decreases with the increasing pyridinic defect concentration, suggesting that a higher concentration of pyridinic defect benefits the NG-based anode by effectively reducing the Na clustering. The theoretical specific capacity increases monotonically with the increasing pyridinic defect concentration and then becomes flat when the defect concentration is higher than 7.5%. The predicted maximum specific capacity and optimal value of the pyridinic defect concentration are consistent with experimental observations. Our study shows that the pyridinic NGs are promising candidates for anode materials for SIBs, thanks to the effectively modulated Na adsorptions and Na-Na interactions.

Author Contributions

Conceptualization, X.Z.; methodology, X.Z.; software, H.D.; validation, H.D.; formal analysis, H.D.; investigation, H.D.; resources, X.Z.; data curation, H.D.; writing—original draft preparation, H.D.; writing—review and editing, H.D. and X.Z.; visualization, H.D.; supervision, X.Z.; project administration, X.Z.; funding acquisition, X.Z. All authors have read and agreed to the published version of the manuscript.

Funding

The work was supported by the US National Science Foundation (DMR-1828019) and ACS-PRF 61326-UNI5.

Institutional Review Board Statement

Not applicable.

Informed Consent Statement

Not applicable.

Data Availability Statement

The data presented in this study are available on request.

Conflicts of Interest

The authors declare no conflict of interest.

References

  1. Tarascon, J.M.; Armand, M. Issues and Challenges Facing Rechargeable Lithium Batteries. Nature 2001, 414, 359–367. [Google Scholar] [CrossRef]
  2. Etacheri, V.; Marom, R.; Elazari, R.; Salitra, G.; Aurbach, D. Challenges in the Development of Advanced Li-Ion Batteries: A Review. Energy Environ. Sci. 2011, 4, 3243–3262. [Google Scholar] [CrossRef]
  3. Choi, J.W.; Aurbach, D. Promise and reality of post-lithium-ion batteries with high energy densities. Nat. Rev. Mater. 2016, 1, 16013. [Google Scholar] [CrossRef] [Green Version]
  4. Dunn, B.; Kamath, H.; Tarascon, J.M. Electrical energy storage for the grid: A battery of choices. Science 2011, 334, 928–935. [Google Scholar] [CrossRef] [Green Version]
  5. Vaalma, C.; Buchholz, D.; Weil, M.; Passerini, S. A cost and resource analysis of sodium-ion batteries. Nat. Rev. Mater. 2018, 3, 18013. [Google Scholar] [CrossRef]
  6. Kim, S.W.; Seo, D.H.; Ma, X.; Ceder, G.; Kang, K. Electrode Materials for Rechargeable Sodium-Ion Batteries: Potential Alternatives to Current Lithium-Ion Batteries. Adv. Energy Mater. 2012, 2, 710. [Google Scholar] [CrossRef]
  7. Slater, M.D.; Kim, D.; Lee, E.; Johnson, C.S. Sodium-Ion Batteries. Adv. Funct. Mater. 2013, 23, 947. [Google Scholar] [CrossRef]
  8. Yabuuchi, N.; Kubota, K.; Dahbi, M.; Komaba, S. Research Development on Sodium-Ion Batteries. Chem. Rev. 2014, 114, 11636. [Google Scholar] [CrossRef]
  9. Kundu, D.; Talaie, E.; Duffort, V.; Nazar, L.F. The Emerging Chemistry of Sodium Ion Batteries for Electrochemical Energy Storage. Angew. Chem. Int. Ed. 2015, 54, 3431. [Google Scholar] [CrossRef] [PubMed]
  10. Abraham, K.M. How Comparable Are Sodium-Ion Batteries to Lithium-Ion Counterparts? ACS Energy Lett. 2020, 5, 3544–3547. [Google Scholar] [CrossRef]
  11. Zhang, L.; Wang, W.; Lu, S.; Xiang, Y. Carbon Anode Materials: A Detailed Comparison between Na-ion and K-ion Batteries. Adv. Energy Mater. 2021, 11, 2003640. [Google Scholar] [CrossRef]
  12. Palomares, V.; Serras, P.; Villaluenga, I.; Hueso, K.B.; Carretero-Gonzalez, J.; Rojo, T. Na-ion batteries, recent advances and present challenges to become low cost energy storage systems. Energy Environ. Sci. 2012, 5, 5884–5901. [Google Scholar] [CrossRef]
  13. Hong, S.Y.; Kim, Y.; Park, Y.; Choi, A.; Choi, N.S.; Lee, K.T. Charge carriers in rechargeable batteries: Na ions vs. Li ions. Energy Environ. Sci. 2013, 6, 2067–2081. [Google Scholar] [CrossRef]
  14. Shannon, R.D. Revised effective ionic radii and systematic studies of interatomic distances in halides and chalcogenides. Acta Crystallogr. A 1976, 32, 751–767. [Google Scholar] [CrossRef]
  15. Luo, W.; Shen, F.; Bommier, C.; Zhu, H.; Ji, X.; Hu, L. Na-Ion Battery Anodes: Materials and Electrochemistry. Acc. Chem. Res. 2016, 49, 231–240. [Google Scholar] [CrossRef] [PubMed]
  16. Malyi, O.I.; Kostiantyn, S.; Kulish, V.V.; Tan, T.L.; Manzhos, S.; Persson, C. A computational study of Na behavior on graphene. Appl. Surf. Sci. 2015, 333, 235–243. [Google Scholar] [CrossRef]
  17. Wei, D.; Liu, Y.; Wang, Y.; Zhang, H.; Huang, L.; Yu, G. Synthesis of N-Doped Graphene by Chemical Vapor Deposition and Its Electrical Properties. Nano Lett. 2009, 9, 1752–1758. [Google Scholar] [CrossRef]
  18. Fan, M.; Feng, Z.Q.; Zhu, C.; Chen, X.; Chen, C.; Yang, J.; Sun, D. Recent progress in 2D or 3D N-doped graphene synthesis and the characterizations, properties, and modulations of N species. J. Mater. Sci. 2016, 51, 10323–10349. [Google Scholar] [CrossRef]
  19. Xu, H.; Ma, L. Nitrogen-doped graphene: Synthesis, characterizations and energy applications. J. Energy Chem. 2018, 27, 146–160. [Google Scholar] [CrossRef] [Green Version]
  20. Xu, C.; Yang, W.; Ma, G.; Che, S.; Li, Y.; Jia, Y.; Chen, N.; Huang, G.; Li, Y. Edge-Nitrogen Enriched Porous Carbon Nanosheets Anodes with Enlarged Interlayer Distance for Fast Charging Sodium-Ion Batteries. Small 2022, 18, 2204375. [Google Scholar] [CrossRef]
  21. Ma, G.; Huang, K.; Zhuang, Q.; Ju, Z. Superior cycle stability of nitrogen-doped graphene nanosheets for Na-ion batteries. Mater. Lett. 2016, 174, 221–225. [Google Scholar] [CrossRef]
  22. Liu, H.; Jia, M.; Cao, B.; Chen, R.; Lv, X.; Tang, R.; Wu, F.; Xu, B. Nitrogen-doped carbon/graphene hybrid anode material for sodium-ion batteries with excellent rate capability. J. Power Sources 2016, 319, 195–201. [Google Scholar] [CrossRef]
  23. Liu, J.; Zhang, Y.; Zhang, L.; Xie, F.; Vasileff, A.; Qiao, S.Z. Graphitic Carbon Nitride (g-C3N4)-Derived N-Rich Graphene with Tuneable Interlayer Distance as a High-Rate Anode for Sodium-Ion Batteries. Adv. Mater. 2019, 31, 1901261. [Google Scholar] [CrossRef] [PubMed]
  24. Wasalathilake, K.C.; Ayoko, G.A.; Yan, C. Effects of heteroatom doping on the performance of graphene in sodium-ion batteries: A density functional theory investigation. Carbon 2018, 140, 276–285. [Google Scholar] [CrossRef]
  25. Lee, H.W.; Moon, H.S.; Hur, J.; Kim, I.T.; Park, M.S.; Yun, J.M.; Kim, K.H.; Lee, S.G. Mechanism of sodium adsorption on N-doped graphene nanoribbons for sodium ion battery applications: A density functional theory approach. Carbon 2017, 119, 492–501. [Google Scholar] [CrossRef]
  26. Kresse, G.; Furthmüller, J. Efficient iterative schemes for ab initio total-energy calculations using a plane-wave basis set. Phys. Rev. B 1996, 54, 11169–11186. [Google Scholar] [CrossRef] [PubMed]
  27. Blöchl, P.E. Projector augmented-wave method. Phys. Rev. B 1994, 50, 17953–17979. [Google Scholar] [CrossRef] [Green Version]
  28. Perdew, J.P.; Burke, K.; Ernzerhof, M. Generalized Gradient Approximation Made Simple. Phys. Rev. Lett. 1996, 77, 3865–3868. [Google Scholar] [CrossRef] [Green Version]
  29. Monkhorst, H.J.; Pack, J.D. Special Points for Brillouin-Zone Integrations. Phys. Rev. B 1976, 13, 5188. [Google Scholar] [CrossRef]
  30. Grimme, S. Semiempirical GGA-type density functional constructed with a long-range dispersion correction. J. Comput. Chem. 2006, 27, 1787–1799. [Google Scholar] [CrossRef]
  31. Huang, K. Statistic Mechanics, 2nd ed.; John Wiley & Sons, Inc.: Hoboken, NJ, USA, 1991. [Google Scholar]
  32. Mackay, D. Introduction to Monte Carlo Method. In Learning in Graphical Models; Jordan, M., Ed.; Kluwer Academic Press: Amsterdam, The Netherlands, 1998; pp. 175–204. [Google Scholar]
  33. Yu, M.; Trinkle, D.R. Accurate and efficient algorithm for bader charge integration. J. Chem. Phys. 2011, 134, 064111. [Google Scholar] [CrossRef] [PubMed] [Green Version]
  34. Reda, M.; Hansen, H.A.; Vegge, T. DFT study of stabilization effects on n-doped graphene for ORR catalysis. Catal. Today 2018, 312, 118–125. [Google Scholar] [CrossRef]
Figure 1. Top view of the optimized structure of (a) pyrrolic and (c) pyridinic NGs. The brown and white spheres represent C and N atoms, respectively. The (x, y) labels the hollow site for Na adsorption. Band structure of (b) pyrrolic and (d) pyridinic 9 × 9 × 1 supercells.
Crystals 13 01011 g001
Figure 2. Differential charge density of a single Na atom adsorbed on the (a) pyrrolic and (b) pyridinic NGs. Differential charge density of double Na atoms adsorbed on the (c) pristine graphene and (d) pyridinic NG. Yellow and blue regions denote the charge accumulation and depletion, respectively. The iso-surface value is set at 1 × 10⁻³ Å−3.
Crystals 13 01011 g002
Figure 3. The Na-Na interaction energy E i n t as a function of the distance R in the (a) pristine graphene and (b) pyridinic NG.
Crystals 13 01011 g003
Figure 4. (a) Na distributions in the pyridinic NG sheet at a defect concentration of 5% and Na concentration of 5% in one converged MC step. Blue squares and red dots represent the pyridinic defects and Na ions, respectively. (b) Average cluster size of Na as a function of the Na concentrations (ranging from 2% to 12%) and the pyridinic defect concentrations (ranging from 3% to 10%).
Crystals 13 01011 g004
Figure 5. Theoretical specific capacity as a function of the pyridinic defect concentration.
Crystals 13 01011 g005
Table 1. The adsorption energy, E a d s , 1 (eV) at various adsorption sites in the pyrrolic and pyridinic NGs. The sites are defined in Figure 1.
Pyrrolic site(0, 0)(0, 1)(0, 2)(0, 3)(1, 0)(1, 2)(−1, 4)(2, 0)(2, 1)(3, 0)
E a d s , 1 −1.91−1.99−2.12−2.03−1.99−2.70−1.89−2.05−2.71−1.97
Pyridinic site(0, 0)(1, 0)(1, 1)(2, 0)(2, 1)(2, 2)(3, 0)(3, 1)(3, 2)(3, 3)
E a d s , 1 −2.02−2.14−2.81−2.27−2.81−2.80−2.14−2.04−1.95−1.97
Pyridinic site(4, 0)(4, 1)(4, 2)(4, 3)(4, 4)
E a d s , 1 −2.03−2.00−2.02−2.04−2.04
Table 2. The adsorption energy E a d s , 2 (eV) and interaction energy E i n t (eV) at various adsorption sites for the second Na atom in the pyridinic NG. The sites are defined in Figure 1.
Site(3, 3)(4, 2)(5, 2)(5, 3)(4, 4)(3, 2)(5, 1)(6, 2)(5, 4)(2, 2)
E a d s , 2 −2.09−1.98−2.02−2.01−1.99−2.00−2.06−2.05−2.03−2.06
E i n t 0.661.040.850.851.020.930.700.660.690.67
Site(7, 0)(4, 1)(6, 1)(6, 3)(3, 1)(5, 0)(6, 0)(7, 1)
E a d s , 1 −2.08−2.06−2.08−2.06−2.07−2.08−2.09−2.09
E i n t 0.510.710.620.610.630.570.540.53
Table 3. The adsorption energy E a d s , 2 (eV) and interaction energy E i n t (eV) for various neighbor types of two Na atoms in the pristine graphene. “1”, “2”, “3”, and “4” denote the first, second, third, and fourth nearest neighbor, respectively. “A” and “B” represent two symmetrically nonequivalent configurations with the same nearest neighbor number.
Neighbor Type1A2A2B3A3B4A4B
E a d s , 2 −1.14−1.12−1.10−1.07−1.12−1.16−1.17
E i n t 0.040.190.170.340.300.260.25
Disclaimer/Publisher’s Note: The statements, opinions and data contained in all publications are solely those of the individual author(s) and contributor(s) and not of MDPI and/or the editor(s). MDPI and/or the editor(s) disclaim responsibility for any injury to people or property resulting from any ideas, methods, instructions or products referred to in the content.

