Article

Two Conformational Polymorphs of a Bioactive Pyrazolo[3,4-d]pyrimidine

1
Research Centre for Crystalline Materials, School of Medical and Life Sciences, Sunway University, Bandar Sunway 47500, Selangor Darul Ehsan, Malaysia
2
School of Pharmacy, Monash University Malaysia, Jalan Lagoon Selatan, Bandar Sunway 47500, Selangor Darul Ehsan, Malaysia
3
Curtin Medical School, Curtin Health Innovation Research Institute, Faculty of Health Sciences, Curtin University, GPO Box U1987, Perth, WA 6845, Australia
*
Author to whom correspondence should be addressed.
Crystals 2023, 13(6), 974; https://doi.org/10.3390/cryst13060974
Submission received: 8 June 2023 / Revised: 15 June 2023 / Accepted: 17 June 2023 / Published: 19 June 2023
(This article belongs to the Special Issue Crystalline Materials: Polymorphism)

Abstract

:
Two monoclinic (P21/c; Z′ = 1) polymorphs, α (from methanol) and β (from ethanol, n-propanol and iso-propanol), of a bioactive pyrazolo[3,4-d]pyrimidine derivative have been isolated and characterised by X-ray crystallography as well as by a range of computational chemistry techniques. The different conformations observed for the molecules in the crystals are due to the dictates of molecular packing as revealed by geometry-optimisation calculations. The crucial difference in the molecular packing pertains to the formation of phenylamino-N–H···N(pyrazolyl) hydrogen bonding within supramolecular chains with either helical (α-form; 21-screw symmetry) or zigzag (β-form; glide symmetry). As a consequence, the molecular packing is quite distinct in the polymorphs. Lattice energy calculations indicate the β-form is more stable by 11 kJ/mol than the α-form.

1. Introduction

In crystals, polymorphism refers to the situation where the same molecule, or molecules in multi-component crystals, assemble differently, implying the formation of distinct patterns of supramolecular interactions. The different assembly of molecules indicates the polymorphs are likely to exhibit distinct physiochemical properties, e.g., dissolution behaviour, stability, tabletting ability, etc., which, in the context of solid forms of drugs, indicates potential differences in bioavailability [1,2,3]. Further, having different properties, the generation of a new polymorph with advantageous characteristics offers opportunities in Intellectual Property (IP) protection [4,5], clearly also a crucial issue for the pharmaceutical industry. Such considerations provided impetus to the concept of co-crystal technology.
In the context of the pharmaceuticals, for which an early suggestion indicated that 50% of Active Pharmaceutical Ingredients (API’s) exhibit polymorphism [6], there was a proposal that forming multi-component crystals, especially with more than 100 Generally Regarded As Safe (GRAS) [7] co-formers, might reduce the propensity for polymorph formation [8,9,10]. While this is a desirable outcome, the reality suggests that just as the many computed polymorphs of single molecule species differ in energies by less than 10 kJ/mol [11], the same is true for co-crystals. Indeed, as studies on co-crystals increased, so did the emergence of polymorphs for these multi-component systems [9,12]. This outcome provides another example to McCrone’s time-proven axiom “…every compound has different polymorphic forms, and that, in general, the number of forms known for a given compound is proportional to the time and money spent in research on that compound.” [13]. With the above in mind, it is not surprising that the phenomenon of polymorphism has long attracted considerable attention of the research community [14,15,16,17,18]. Herein, the crystallographic and computational chemistry characterisation of two polymorphs of a pharmaceutically relevant molecule, namely N4-(4-methylphenyl)-N3-phenyl-1H-pyrazolo[3,4-d]pyrimidine-3,4-diamine (1), Figure 1, is described.
Bioisosteric ring replacement is one of the key strategies for scaffold hopping in medicinal chemistry and agrochemistry [19,20,21]. The replacement of the purine ring with isosteric heterocyclic systems has been recognised as a valid strategy in the design of new drugs targeting biomolecules (nucleic acids, enzymes, receptors and transporters) utilising biogenic purines as building blocks, substrates, cofactors or secondary messengers [22,23]. The first success of this approach was associated with pyrazolo[3,4-d]pyrimidines, viz. the development of the anti-gout drug allopurinol, a bioisoster of hypoxanthine [24]. In a very recent study, a library of pyrazolo[3,4-d]pyrimidines was designed and prepared as potential antileukemic agents isosteric to adenine [25]. The compounds were prepared using a new microwave-assisted three-component reaction of 5-aminopyrazole-4-carbonitriles with primary amines and orthoesters. The optimisation of the protocol was performed using the reaction of 5-amino-3-phenylaminopyrazole-4-carbonitrile with p-toluidine and trimethyl orthoformate resulting in the formation of 1, which was studied for its propensity to form polymorphs. This resulted in the isolation of two polymorphs, α and β, and these have been subjected to crystallographic and a variety of computational chemistry techniques in order to ascertain the distinctions in the molecular packing and their relative stability.

2. Materials and Methods

2.1. Synthesis and Crystallisation

Compound 1 was prepared and characterised as described in the literature [25]. The three-component reaction of trimethyl orthoformate (2), p-toluidine (3), and 5-amino-3-phenylaminopyrazole-4-carbonitrile (4) in toluene under controlled microwave irradiation at 200 °C for 35 min. (closed-vessel mode in a Discover SP microwave reactor, CEM, Matthews, NC, USA) resulted in the formation of compound 1, which was isolated in a 70% yield (Scheme 1). The reaction was proposed to proceed via the initial pyrimidine ring closure with the formation of intermediate 5 undergoing the Dimroth rearrangement to the more thermodynamically stable 1. Product 1 was purified by the recrystallisation from methanol and pure compound 1, which has NMR spectral characteristics matching the reported ones [25], was used for growing crystals for crystallographic analysis. The crystals were obtained at ambient temperature by slow evaporation of different solvents (i.e., methanol, ethanol, n-propanol and isopropanol) from saturated solutions of analytically pure samples of 1.

2.2. Physiochemical Characterisation

Variable-temperature unit-cell measurements were performed on a Rigaku/Oxford Diffraction XtaLAB Synergy diffractometer (Dualflex, AtlasS2; Rigaku Oxford Diffraction, Oxford, UK) fitted with CuKα radiation (λ = 1.54184 Å) with Oxford Cryosystem Cryostream 800 (Oxford Cryosystems, Oxford, UK). Data processing was accomplished with CrysAlisPro (Rigaku Oxford Diffraction, Oxfordshire, UK) [26]. Powder X-ray diffraction (PXRD) patterns were measured on a Rigaku SmartLab Powder X-ray diffractometer (Rigaku, Tokyo, Japan) using CuKα (λ = 1.5418 Å) radiation in the 2θ range of 5 to 40° (step size = 0.01°). The comparison between experimental and simulated (from CIFs) PXRD patterns was performed with Rigaku’s PDXL2 software (https://www.rigaku.com/en/products/software/pdxl/overview, accessed on 19 June 2023). The Differential Scanning Calorimetric (DSC) analyses were performed on a PerkinElmer DSC 8000 Differential Scanning Calorimeter (PerkinElmer, Shelton, CT, USA) under a helium gas flow in the temperature range of −150 to 220 °C at a rate of 10 °C min−1.

2.3. X-ray Crystallography

X-ray intensity data for colourless crystals of α-and β-forms of 1 were measured at T = 100 K on a Rigaku/Oxford Diffraction XtaLAB Synergy (Dualflex, AtlasS2) diffractometer (Rigaku Oxford Diffraction, Oxford, UK) fitted with CuKα radiation (λ = 1.54178 Å) so that θmax = 67.1° (=100% data completeness). Data reduction, including gaussian absorption correction, was accomplished with CrysAlisPro (Rigaku Oxford Diffraction, Oxfordshire, UK) [26]. The structures were solved by direct methods [27] and refined (anisotropic displacement parameters and C-bound H atoms in the riding model approximation) on F2 [28]. The N-bound H atoms were located in Fourier difference maps and refined with N–H = 0.88 ± 0.01 Å and Uiso = 1.2Ueq(N). A weighting scheme of the form w = 1/[σ2(Fo2) + (aP)2 + bP], where P = (Fo2 + 2Fc2)/3), was introduced in each case. The molecular structure diagrams were generated with ORTEP for Windows [29] with 70% displacement ellipsoids, and the packing diagrams were drawn with DIAMOND [30]. Additional data analysis was made with PLATON [31]. Crystal data and refinement details are given in Table 1.

2.4. Computational Studies

Geometry-optimisation calculations were performed in Gaussian16 [32] using long-range corrected wB97XD density functional with Grimme’s D2 dispersion model [33] coupled with Ahlrichs’s Def2TZVP basis set [34,35] along with frequency analysis for verification of the ground state structure, with the corresponding output analysed and interpreted through GaussView6 [36].
The Hirshfeld surface analysis was performed using CrystalExplorer21 [37] based on the methods reported in the literature [38], with all X–H bond lengths being adjusted to the neutron-derived values prior to the calculations [39]. The interaction energies and energy frameworks were calculated using the dispersion corrected CE-B3LYP/6-31G(d,p) model included in CrystalExplorer21 [37], with the total interaction energy being the sum of the energies of the four main components comprising electrostatic, polarisation, dispersion and exchange-repulsion with scale factors of 1.057, 0.740, 0.871 and 0.618, respectively [40].
A comparison of the molecular packing similarity between the polymorphs was performed using the Mercury [41] software package based on the calculation of the positional differences between a cluster of 15 molecules in each structure [42]. The parameters were set such that only molecules within a 20% tolerance for both distances and angles were accepted in the calculation while molecules with a variation > 20% were discarded; hydrogen atom positions were omitted, and inversions were allowed in the comparison. The lattice energies for the polymorphs were calculated through CrystalExplorer21 [37] using Equation (1) [43], where the second term is the cell dipole energy correction, with ρcell being the vector sum of the molecular dipole moments, Vcell being the volume and Z being the number of formula units in the unit-cell. Typically, the cell dipole energy correction is negligible (<0.25 kcal/mol) for unit-cells with small dipole moments [44].
E l a t t i c e = 1 2 R A B < R E t o t a l A B 2 π ρ c e l l 2 3 Z V c e l l

3. Results and Discussion

Two polymorphs in the monoclinic (P21/c; Z′ = 1) crystals were prepared from saturated methanol and ethanol solutions of 1 by slow evaporation of the solvent at ambient temperature, namely the α- and β-forms, respectively. Similar experiments from n-propanol and iso-propanol yielded the β-form, see Supplementary Materials Figure S1 for experimental and simulated PXRD patterns. Before a description of the molecular structures and packing is presented, experiments designed to evaluate the possibility of a phase transformation between the α- and β-forms will be outlined.
Each of the α- and β-forms was subjected to DSC experiments in the temperature range −150 to 220 °C at a rate of 10 °C min−1; see Supplementary Materials Figure S2 for DSC traces. No evidence for a phase change was apparent. Also, a single crystal of the β-form was subjected to variable-temperature experiments (298, 200, 100, 200, 298, 350 and 373 K). From the unit-cell data collated in Supplementary Materials Table S1, again no phase change was apparent.

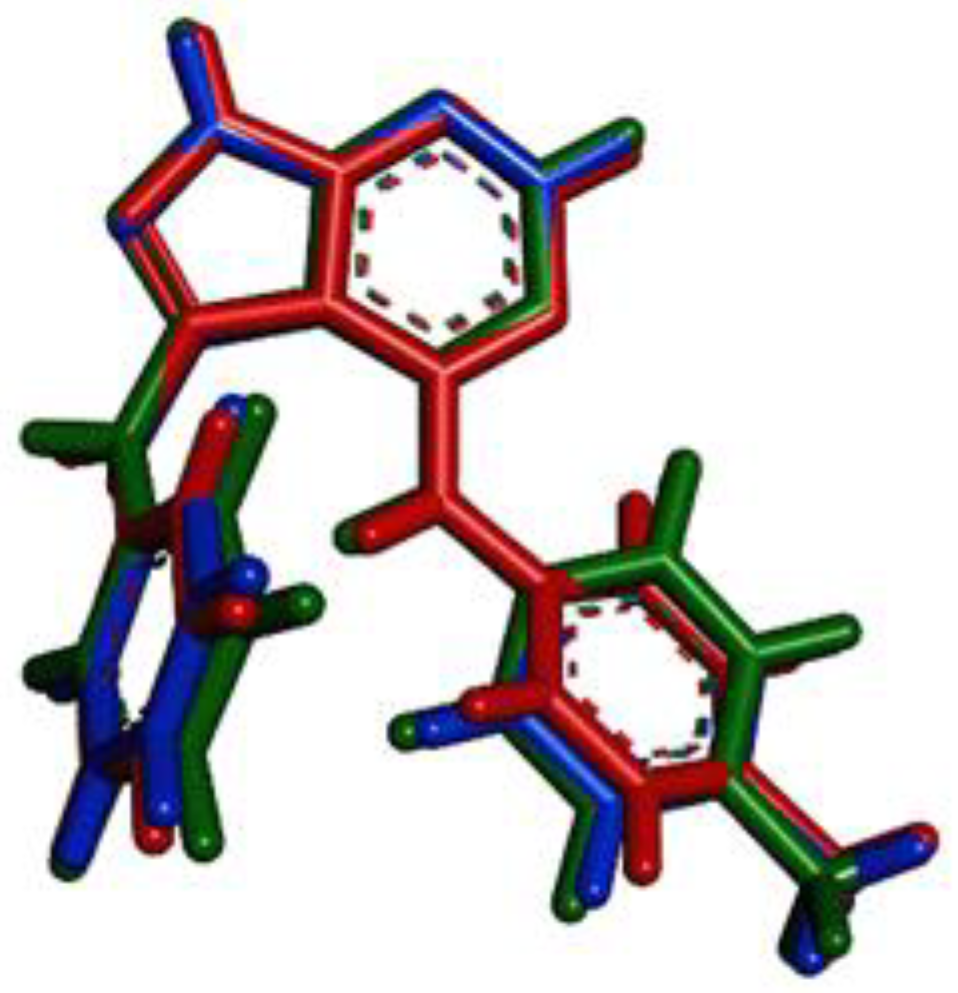
3.1. Molecular Structures

The molecular conformations in the α- and β-forms resemble each other but nonetheless present distinct features. The molecular structures are illustrated in Figure 2 and key geometric parameters are collated in Table 2. In the α-form, the nine atoms of the fused 1H-pyrazolo[3,4-d]pyrimidine system exhibit a r.m.s. deviation of 0.0308 Å with the maximum distortions to either side of the least-squares plane through the ring being 0.0414(10) for the N3 atom and 0.0411(12) for atom C3. Appended at the C2- and C4-positions are phenylamino and p-tolylamino substituents, respectively; the N5 and N6 atoms lie 0.1883(19) and 0.1248(18) Å to either side of the fused ring, respectively. The dihedral angles between the fused ring and the phenylamino and p-tolylamino substituents are 70.37(4) and 42.21(4)°, respectively, and the dihedral angle between the pendant rings is 85.15(4)°, indicating a near to orthogonal relationship; to a first approximation, the rings lie to the same side of the fused ring system. The relative arrangement of the substituents facilitates the formation of an intramolecular phenylamino-N–H···π(phenyl) contact; geometric details are given in Table 3.
To a first approximation, the molecular conformation in the β-polymorph matches that just described for the α-polymorph. The r.m.s. deviation for the fused ring system is 0.0022 Å with the maximum deviations being ±0.0040(8) Å for the N2 and C2 atoms; the N5 and N6 atoms lie 0.0455(14) and 0.0187(15) Å to either side of the least-squares plane. The dihedral angle between the fused ring and the phenylamino substituent of 70.98(3)° is in agreement with the equivalent angle in the α-polymorph but that between the fused ring and the p-tolylamino substituent of 21.59(5)° differs by more than 20°; the dihedral angle between the pendant rings is 77.10(3)°. There is also a close concordance in the torsion angle data included in Table 2, with the notable exceptions of the C4–N6–C12–C13, C17 angles which differ by approximately 15 and 10°, respectively. The remaining difference between the molecular conformations relates to the intramolecular phenylamino-N–H···π(phenyl) contact evident in the α-polymorph which does not persist in the β-polymorph where the N–H···Cg(phenyl) separation is 3.14 Å.
To gain a better understanding of the electronic structure and conformation of 1, the individual experimental molecule of each polymorph was subjected to geometry-optimisation calculations using DFT-wB97XD which is known to be one of most reliable methods for organic molecules [45,46]. The optimisation of each polymorph leads to the same local minimum structure, opt-1, as validated through the vibrational analysis without the presence of any imaginary frequency. A comparison of the geometric data, Table 2, shows that the optimised structure closely resembles to the experimental counterparts. Within the purine ring, a systematic shortening of the C–N bonds is apparent in opt-1, an observation related to the absence of hydrogen bonding in the idealised, gas-phase molecule. More significant differences are noted in the torsion angle data, Table 2. The most significant twist is associated with C4–N6–C12–C13 torsion angle between the α-form and opt-1, which differs by over 20°.
In view of the relatively large variation of the C4–N6–C12–C13 torsion angle between the α-form and opt-1, the latter was subjected to a relaxed potential energy simulation by systematic rotation about the N6–C12 bond within −41.1 to −12.0° to assess the influence of the energy change on the molecular conformation. The simulation shows that the potential energy gradually decreases from −41.1° and reaches a minimum at −20.3° before increasing again from −20.3° onwards with the energy between the least and most stable conformations differing by 1.38 kJ/mol, Figure 3.
The optimised structure is relatively closer to the β-polymorph with the RMSD of the two molecules being 0.0193 Å, while the RMSD with the α counterpart is 0.0339 Å; the RMSD between the α- and β-polymorphs is 0.0312 Å. The overall deviations in conformations between the molecules is illustrated in the overlay diagram shown in Figure 4.
Finally, single-point energy calculations for the experimental molecules extracted from the crystals of the α- and β-polymorphs show that the molecule in the β-polymorph is more stable than the α-form by 2.16 kJ/mol.

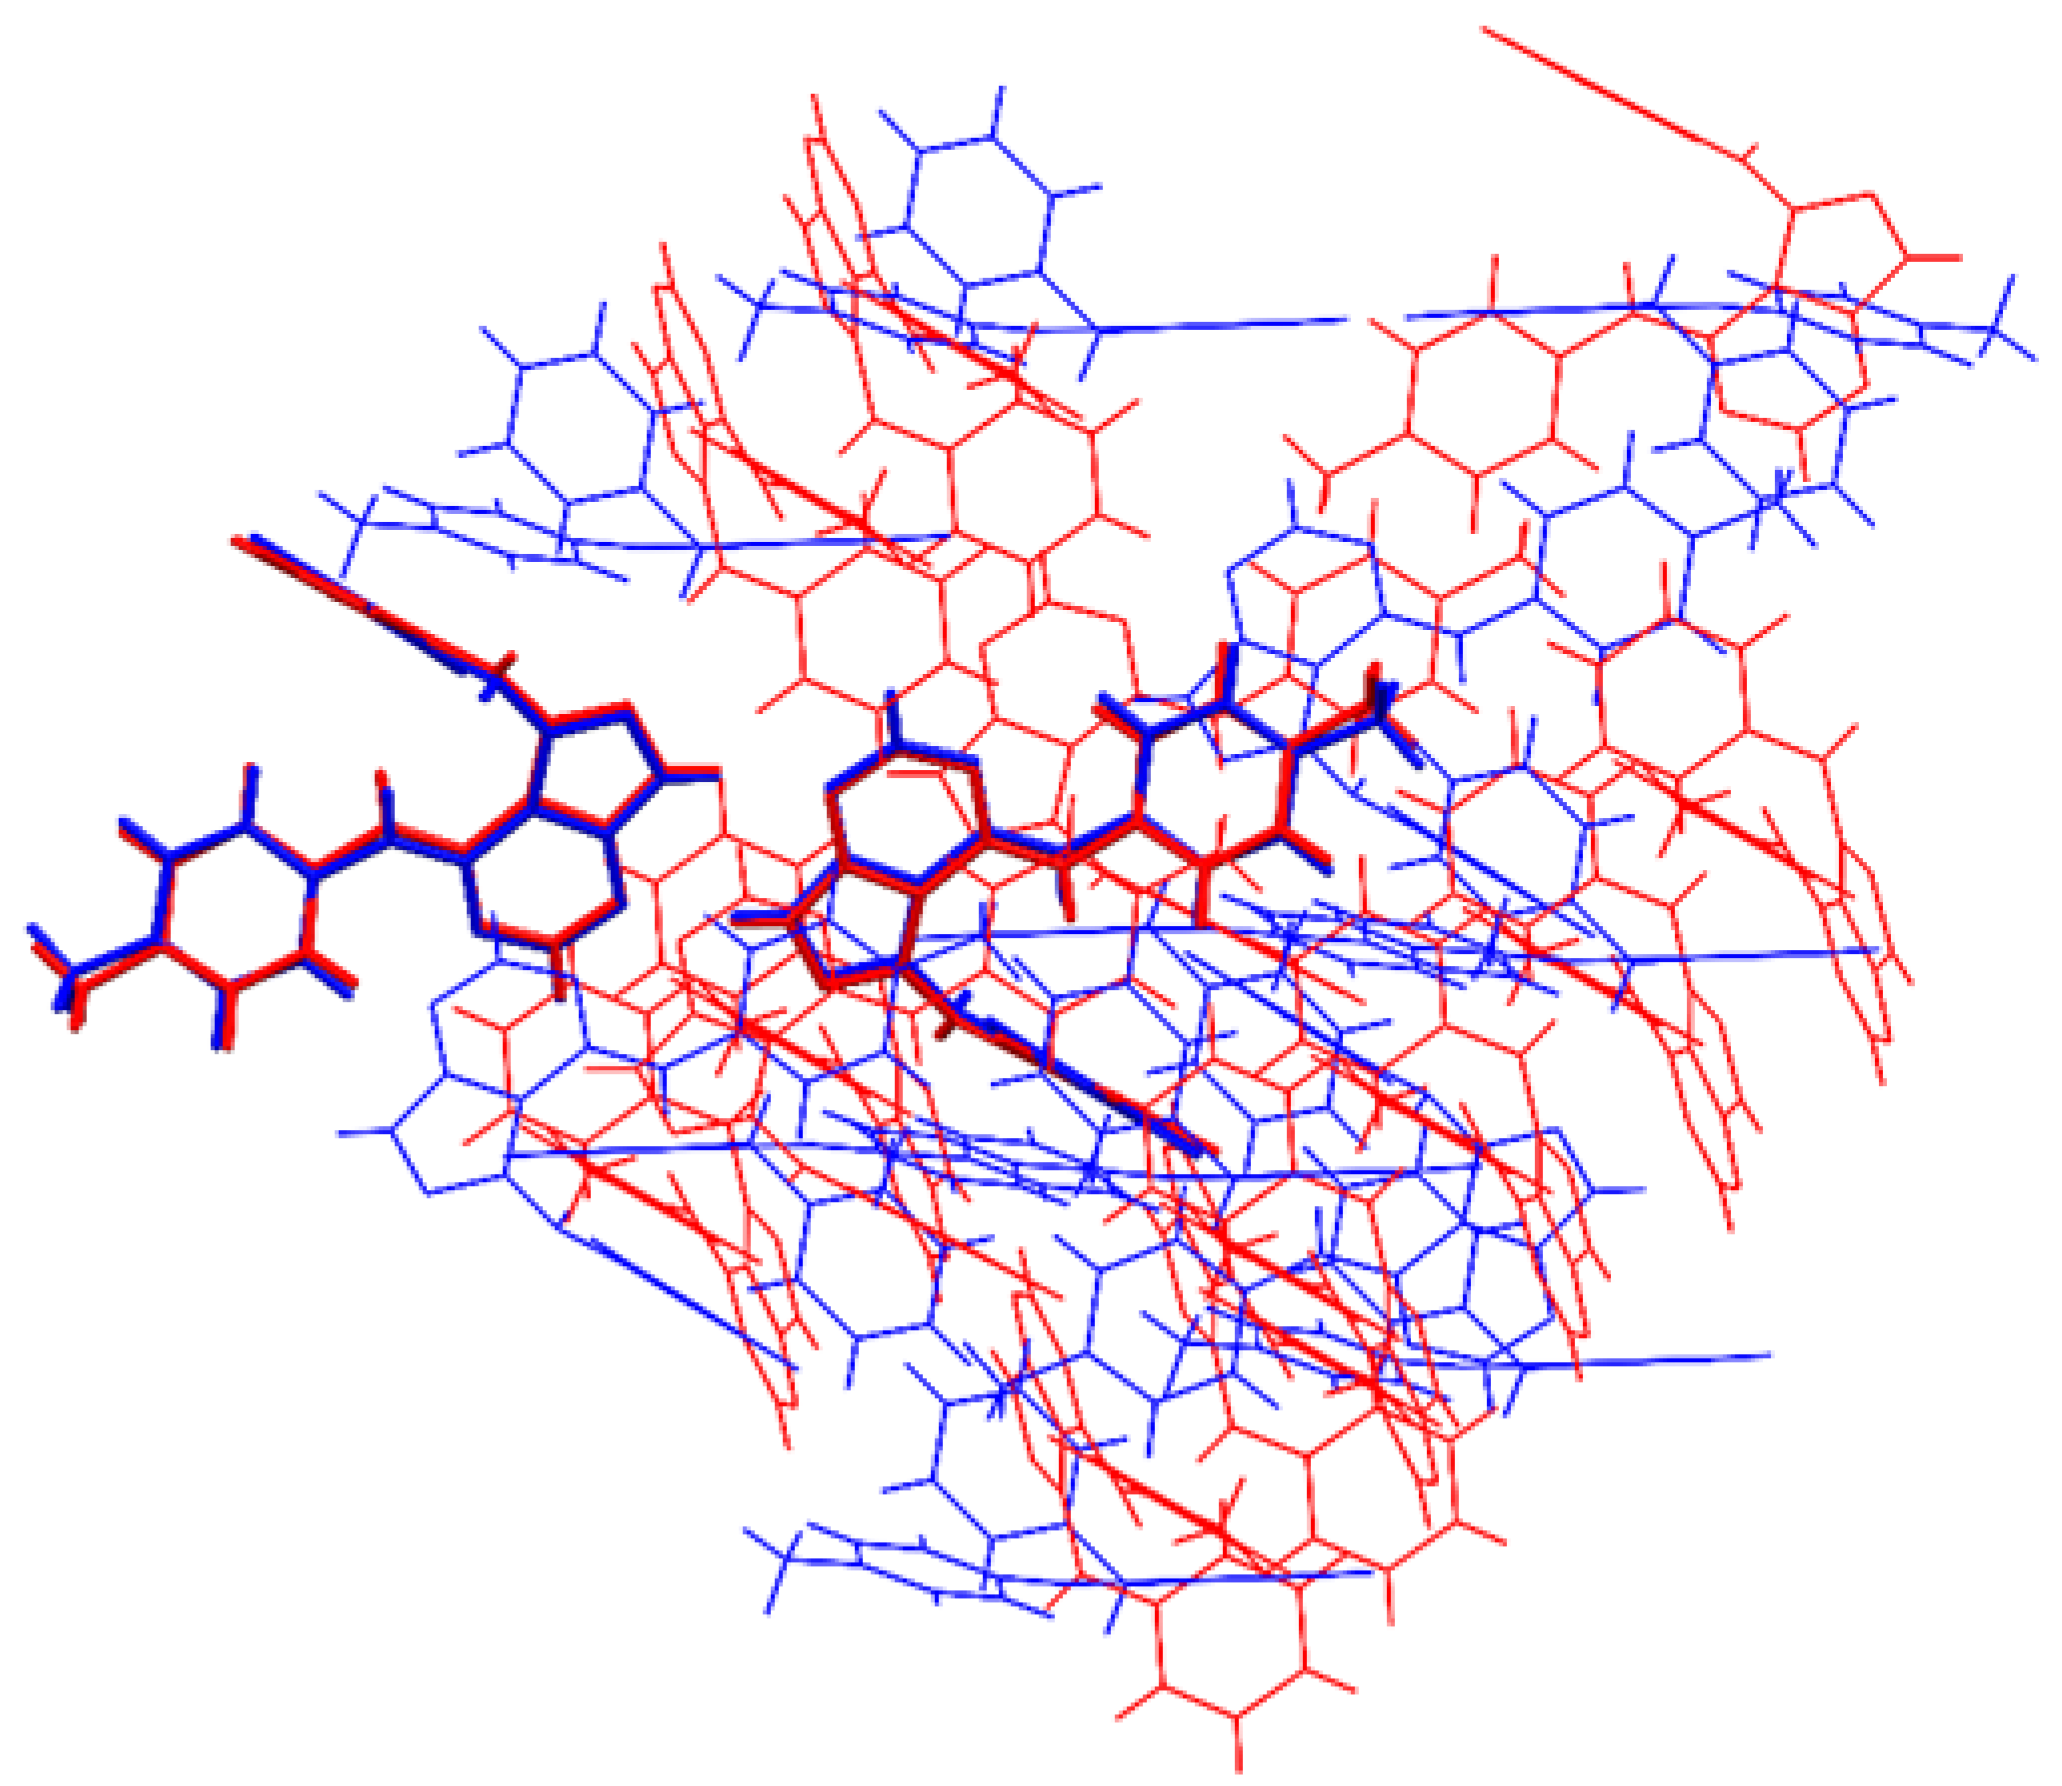
3.2. Molecular Packing

The crystal of the α-form features two short N–H···N hydrogen bonds which occur within a supramolecular layer in the bc-plane; see Table 3 for a listing of geometric parameters characterising the identified intermolecular contacts. The phenylamino-N–H···N(pyrazolyl) hydrogen bonding occurs between molecules aligned along the b-axis, being related by 21-screw symmetry. The connections between the supramolecular helical chains are of the type pyrazolyl-N–H···N(pyrimidyl) which occur across a centre of inversion and lead to eight-membered {···NCNH}2 homosynthons. Within the supramolecular layer are supporting pyrimidyl-C–H···π(phenyl) and p-tolyl-C–H···π(pyrimidyl) contacts, Table 3. The layers stack along the a-axis, with interdigitating methyl groups, but without directional interactions between them; a view of the unit-cell contents is shown in Figure 5.
Despite both the α- and β-forms crystallising with the same space group symmetry, distinctive modes of supramolecular association are apparent in their crystals. While, the same pattern of phenylamino-N–H···N(pyrazolyl) and pyrazolyl-N–H···N(pyrimidyl) hydrogen bonds noted in the α-form persist in the β-form, in the latter, the phenylamino-N–H···N(pyrazolyl) hydrogen bonds are formed between molecules assembled along the c-axis, i.e., generated by glide-symmetry, rather than the 21-screw symmetry in the α-form. In the crystal of the β-form, supramolecular layers are formed in the bc-plane. Within layers are p-tolyl-methyl-C–H···π(pyrimidyl) and π(pyrimidyl)···π(pyrimidyl) contacts, Table 3. The layers stack along the a-axis without directional interactions between the phenylamino rings that project into the inter-layer region; a view of the unit-cell contents is shown in Figure 6.
A molecular packing similarity analysis was performed using the Mercury software package [41] based on the calculation of the positional differences between a cluster of 15 molecules in each crystal [42]. The parameters were set such that only molecules within a 20% tolerance for both distances and angles were accepted in the calculation while molecules with a variation > 20% were discarded; hydrogen atom positions were omitted, and inversions were allowed in the comparison. As anticipated, the analysis indicates that the α- and β-po-lymorphs adopt quite distinct molecular packing with only two out of 15 molecules being overlapped with an RMS deviation of 0.296 Å, Figure 7.

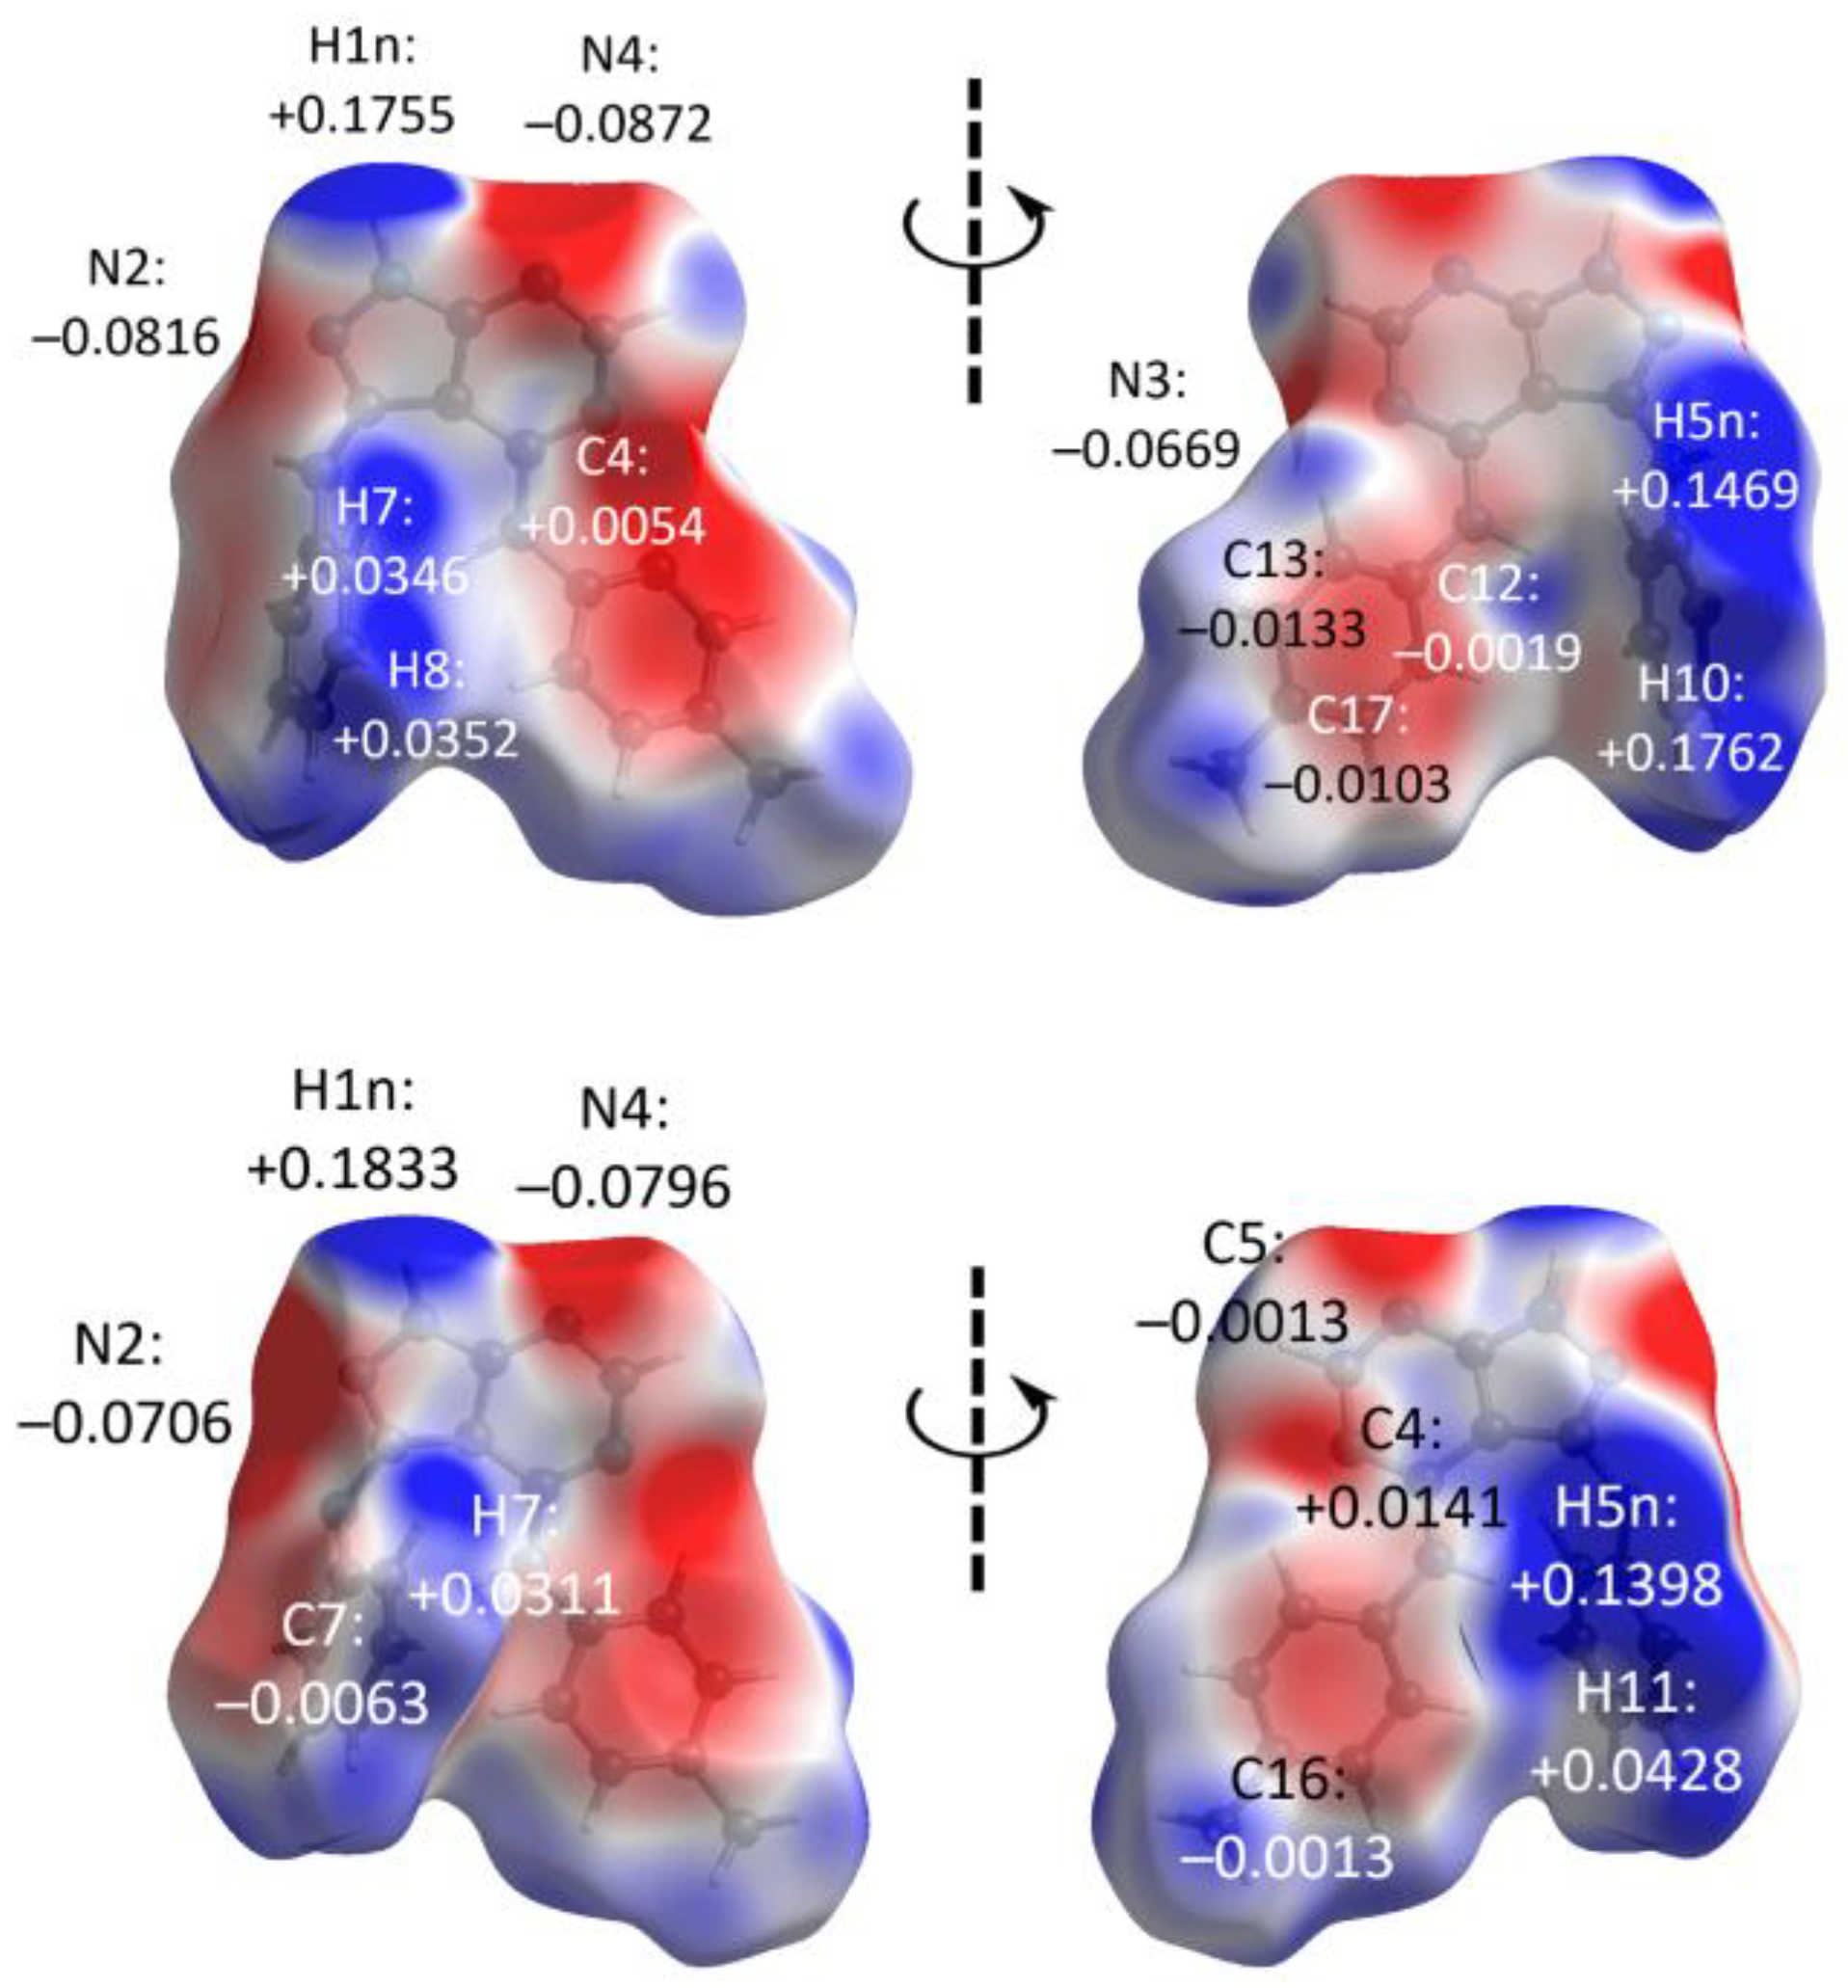
3.3. Hirshfeld Surface Analysis

A Hirshfeld surface analysis was performed to further comprehend the nature of the contacts in the crystals of the polymorphs. The analysis shows that the α- and β-polymorphs adopt relatively different contact features as revealed through the corresponding dnorm-surface mappings, Figure 8. In particular, the α-polymorph exhibits four intense red spots stemming from N1–H1n···N4 and N5–H5n···N2 contacts with the corresponding contact distances being 1.88 and 1.98 Å, separations significantly shorter than the sum of their van der Waals radii (ΣvdW) of 2.64 Å (Table 4), while the remaining features are weak red spots of diminished intensity which comprise C8–H8···C17 (dnorm = 2.71 Å vs. ΣvdW = 2.79 Å), C10–H10···N3 (dnorm = 2.58 Å vs. ΣvdW = 2.64 Å), π(C4)···π(C13) (dnorm = 3.35 Å vs. ΣvdW = 3.40 Å), C7–H7···π(C12) (dnorm = 2.77 Å vs. ΣvdW = 2.79 Å) and C13–H13···π(C5) (dnorm = 2.77 Å vs. ΣvdW = 2.79 Å). As for the β-polymorph, the same intense red spots as for the α-form are evident, but with N1–H1n···N4 and N5–H5n···N2 having different dnorm-distance of 1.86 and 2.02 Å, respectively. Besides, moderately intense, rather than faint red spots noted for the α-form, due to C11–H11···π(C7) (dnorm = 2.60 Å vs. ΣvdW = 2.79 Å), π(C4)···π(C5) (dnorm = 3.27 Å vs. ΣvdW = 3.40 Å) and C7–H7···π(C16) (dnorm = 2.69 Å vs. ΣvdW = 2.79 Å).
The Hirshfeld surfaces for the pair of polymorphs were also mapped with electrostatic potential and the curvedness index to complement the findings of the Hirshfeld surface analysis. The electrostatic potential mappings, as shown in Figure 9, indicate the identified point-to-point donor and acceptor atoms are charge-complemented and attracted to each other electrostatically. On the other hand, the curvedness mappings reveal that C13–H13···π(C5) contact in the α-polymorph and C7–H7···π(C16) contact in the β-form are supported by the large surface, shape complementarity contact area between two pyrazolopyrimidine fragments in the former and between the pyrazolopyrimidine and p-toluidine fragments in the latter, Figure 10.
The quantification of the close contacts in each polymorph was performed through a two-dimensional fingerprint plot analysis by combining di and de contact distances at intervals of 0.01 Å. In general, the overall shield-like profile for the α-polymorph differs slightly to the paw-like profile of the β-form, consistent with distinct contact patterns in the polymorphs, Figure 11. The former is dominated by H···H (49.5%), H···C/C···H (24.3%) and H···N/N···H (19.3%) contacts, and other minor contacts comprising N···C/C···N, C···C and N···N that constitute less than 4% each. While the β-polymorph exhibits the same order of significance, quantitative differences are apparent with the contact distribution for H···H, H···C/C···H, H···N/N···H and other minor contacts being 47.1%, 24.9%, 21.7% and 6.3%, respectively. A closer inspection shows that the α-polymorph projects a distinct tip in the decomposed H···H profile assigned to close contact between the H5 and H11 atoms (2.25 Å); this feature is not observed for the β counterpart. In addition, the pair of symmetrical tips in the pincer-like profile of the decomposed fingerprint plot for the H···C/C···H contacts for the α-polymorph is assigned to the reciprocal H8···C17 contacts with di + de being ~2.71 Å, while the equivalent tips for the β-polymorph are due to the reciprocal H11···C7 contacts, as mentioned above. The sharp tips in both decomposed H···N/N···H profiles are attributed to the reciprocal H1n···N4 contacts.

3.4. Interaction Energies

The identified interactions were subjected to interaction energy calculations to eva-luate the relative strength of specific contacts in the respective crystals. For the α-polymorph, the strongest interaction is due to the pair of N1–H1n···N4 hydrogen bonds that form an eight-membered {NHNH···}2 homosynthon with the interaction energy (Eint) being −69.9 kJ/mol. The combination of the C7–H7···π(C12), C8–H8···π(C17), C13–H13···π(C5) and π(C4)···π(C13) contacts collectively formed the second strongest interaction in the crystal with a slightly smaller Eint of −55.3 kJ/mol. This is followed by the N5–H5n···N2 and C10–H10···N3 interactions with the respective Eint being −34.2 and −17.6 kJ/mol, Table 5. The β-polymorph, on the other hand, is mainly stabilised by the same eight-membered {NHNH···}2 homosynthon with an Eint of −68.9 kJ/mol on top of N5–H5n···N2 and C11–H11···C7 contacts with a combined Eint of −54.9 kJ/mol. Meanwhile, C4 ···C5 and C7–H7···C16, which presented moderately intense red spots on the Hirshfeld surfaces, gave rise to Eint values of −34.6 and −30.7 kJ/mol, respectively.
The simulation of energy frameworks was performed to evaluate the influence of the overall force of interactions on the packing behaviour in the pair of polymorphs. As shown in Figure 12, the molecular packing of the α-polymorph is mainly sustained by electrostatic forces attributed to the strong N1–H1n···N4 hydrogen bond interactions along with the complementary dispersion forces owing to C–H···π interactions to form a zigzag form for the overall energy framework. In contrast, the β-polymorph exhibits a completely different, snake-crawling, curve-like energy framework despite it being mainly sustained by the same N1–H1n···N4 hydrogen bonds along with other supporting C–H···π interactions which constitute the dispersion force energy framework.
To compare the relative stability of the polymorphs, they were subjected to lattice energy calculations in CrystalExplorer21 [37]. In line with the profile energy and single point calculation results, the calculations show that the crystal of the β-polymorph is relatively more stable than the α-polymorph with Elattice for the former being −135.6 kJ/mol compared to −124.6 kJ/mol for the latter; see Table 6 for more details. The stabilisation by 11 kJ/mol is mainly due to the presence of several C–H···π interactions that help to enhance the contribution of the dispersion forces in the β-form compared with the packing in the α-polymorph. The enhanced stability of the β-form correlates with the greater density, i.e., 1.377 cf. 1.352 g cm−3, and the more efficient calculated packing coefficients [31], i.e., 70.6 cf. 69.3, for the β- and α-forms, respectively.

4. Conclusions

Two distinct conformations have been identified for a pyrazolo[3,4-d]pyrimidine derivative in two polymorphs, α and β, having the same crystal symmetry. In the crystals, molecules assemble via phenylamino-N–H···N(pyrazolyl) hydrogen bonding with helical or zigzag chains, respectively, indicating the distinctive molecular packing patterns. The lattice energy calculations suggest the β-form to be the more stable, an indication consistent with the calculated density and packing coefficients.

Supplementary Materials

The following supporting information can be downloaded at: https://www.mdpi.com/article/10.3390/cryst13060974/s1. Table S1: lists unit-cell data. Figures S1 and S2 show PXRD and DSC traces.

Author Contributions

Synthesis, J.H.N. Supervision, A.V.D. Investigation, formal analysis, writing, Y.S.T. Computational chemistry, draft preparation, S.L.T. Draft preparation, review and editing, E.R.T.T. All authors have read and agreed to the published version of the manuscript.

Funding

This work was supported by the Ministry of Higher Education, Malaysia under the Fundamental Research Grant Scheme (Grant no. FRGS/1/2015/SG01/MUSM/03/1).

Institutional Review Board Statement

Not applicable.

Informed Consent Statement

Not applicable.

Data Availability Statement

Crystallographic datasets for the α- and β-polymorphs are available through the Cambridge Structural Database with deposition numbers CCDC 2266924 (α) and 2266925 (β). These data can be obtained free of charge via https://www.ccdc.cam.ac.uk/structures/ (accessed on 1 June 2023).

Acknowledgments

The authors would like to thank Robust HPC Sdn Bhd for the provision of access to the high-performance computing facilities and for providing technical support services.

Conflicts of Interest

The authors declare no conflict of interest.

References

  1. Brittain, H.G. Polymorphism in Pharmaceutical Solids, 2nd ed.; Informa Healthcare: New York, NY, USA, 2009. [Google Scholar]
  2. Cruz-Cabeza, A.J.; Reutzel-Edens, S.M.; Bernstein, J. Facts and fictions about polymorphism. Chem. Soc. Rev. 2015, 44, 8619–8635. [Google Scholar] [CrossRef]
  3. Bernstein, J. Polymorphism in Molecular Crystals, 2nd ed.; Oxford University Press: New York, NY, USA, 2020. [Google Scholar]
  4. Lee, A.Y.; Erdemir, D.; Myerson, A.S. Crystal Polymorphism in Chemical Process Development. Annu. Rev. Chem. Biomol. Eng. 2011, 2, 259–280. [Google Scholar] [CrossRef] [PubMed]
  5. Tandon, R.; Tandon, N.; Thapar, R.K. Patenting of polymorphs. Pharm. Pat. Anal. 2018, 7, 59–63. [Google Scholar] [CrossRef] [Green Version]
  6. Henck, J.O.; Griesser, U.J.; Burger, A. Polymorphie von Arzneistoffen: Eine wirtschaftliche Herausforderung? (Polymorphism of drug substances: An economic challenge?). Pharm. Ind. 1997, 59, 165–169. [Google Scholar]
  7. For the FDA Database on GRAS Compounds. Available online: https://www.fda.gov/food/food-ingredients-packaging/generally-recognized-safe-gras (accessed on 3 June 2023).
  8. Arora, K.K.; Zaworotko, M.J. Polymorphism in Pharmaceutical Solids; Brittain, H.G., Ed.; Informa Healthcare: London, UK, 2009; Volume 1, p. 281. [Google Scholar]
  9. Tiekink, E.R.T. Crystal Engineering. In Supramolecular Chemistry: From Molecules to Nanomaterials; Steed, J.W., Gale, P.A., Eds.; John Wiley & Sons Ltd.: Chichester, UK, 2012; pp. 2791–2828. [Google Scholar] [CrossRef]
  10. Aitipamula, S.; Chow, P.S.; Tan, R.B.H. Polymorphism in cocrystals: A review and assessment of its significance. CrystEngComm 2014, 16, 3451–3465. [Google Scholar] [CrossRef]
  11. Price, S.L. Computed crystal energy landscapes for understanding and predicting organic crystal structures and polymorphism. Acc. Chem. Res. 2009, 42, 117–126. [Google Scholar] [CrossRef]
  12. Aitipamula, S.; Chow, P.S.; Tan, R.B.H. Polymorphs and solvates of a cocrystal involving an analgesic drug, ethenzamide, and 3,5-dinitrobenzoic acid. Cryst. Growth Des. 2010, 10, 2229–2238. [Google Scholar] [CrossRef]
  13. McCrone, W.C. Physics and Chemistry of the Solid State; Fox, D., Labes, M.M., Weissberger, A., Eds.; Wiley Interscience: Hoboken, NJ, USA, 1965; Volume 2, p. 725. [Google Scholar]
  14. Caira, M.R. Crystalline polymorphism of organic compounds. Topics Curr. Chem. 1998, 198, 163–208. [Google Scholar] [CrossRef]
  15. Price, C.P.; Grzesiak, A.L.; Matzger, A.J. Crystalline polymorph selection and discovery with polymer heteronuclei. J. Am. Chem. Soc. 2005, 127, 5512–5517. [Google Scholar] [CrossRef]
  16. Braga, D.; Grepioni, F.; Maini, L.; Polito, M. Crystal polymorphism and multiple crystal forms. Struct. Bond. 2009, 132, 25–50. [Google Scholar] [CrossRef]
  17. Yu, L. Polymorphism in molecular solids: An extraordinary system of red, orange, and yellow crystals. Acc. Chem. Res. 2010, 43, 1257–1266. [Google Scholar] [CrossRef]
  18. Brittain, H.G. Polymorphism and solvatomorphism 2010. J. Pharm. Sci. 2012, 101, 464–484. [Google Scholar] [CrossRef] [PubMed]
  19. Callis, T.B.; Garrett, T.R.; Montgomery, A.P.; Danon, J.J.; Kassiou, M. Recent scaffold hopping applications in central nervous system drug discovery. J. Med. Chem. 2022, 65, 13483–13504. [Google Scholar] [CrossRef] [PubMed]
  20. Jayashree, B.S.; Nikhil, P.S.; Paul, S. Bioisosterism in drug discovery and development—An overview. Med. Chem. 2022, 18, 915–925. [Google Scholar] [CrossRef] [PubMed]
  21. Lamberth, C. Isosteric ring exchange as a useful scaffold hopping tool in agrochemistry. J. Agric. Food Chem. 2023. [Google Scholar] [CrossRef]
  22. Lim, F.P.L.; Dolzhenko, A.V. 1,3,5-Triazine-based analogues of purine: From isosteres to privileged scaffolds in medicinal chemistry. Eur. J. Med. Chem. 2014, 85, 371–390. [Google Scholar] [CrossRef]
  23. Baillache, D.J.; Unciti-Broceta, A. Recent developments in anticancer kinase inhibitors based on the pyrazolo[3,4-d]pyrimidine scaffold. RSC Med. Chem. 2020, 11, 1112–1135. [Google Scholar] [CrossRef]
  24. Rundles, R.W. The development of allopurinol. Arch. Intern. Med. 1985, 145, 1492–1503. [Google Scholar] [CrossRef]
  25. Ng, J.H.; Lim, F.P.L.; Tiekink, E.R.T.; Dolzhenko, A.V. 3,4-Diaminopyrazolo[3,4-d]pyrimidines: A new three-component microwave-assisted synthesis and anti-leukemic properties. Org. Biomol. Chem. 2023, 21, 3432–3446. [Google Scholar] [CrossRef]
  26. Rigaku Oxford Diffraction. CrysAlis PRO; Oxford Diffraction Ltd.: Oxfordshire, UK, 2017. [Google Scholar]
  27. Sheldrick, G.M. A short history of SHELX. Acta Crystallogr. Sect. A Found. Crystallogr. 2008, 64, 112–122. [Google Scholar] [CrossRef] [Green Version]
  28. Sheldrick, G.M. Crystal structure refinement with SHELXL. Acta Crystallogr. Sect. C Struct. Chem. 2015, 71, 3–8. [Google Scholar] [CrossRef] [PubMed] [Green Version]
  29. Farrugia, L.J. WinGX and ORTEP for Windows: An update. J. Appl. Crystallogr. 2012, 45, 849–854. [Google Scholar] [CrossRef]
  30. Brandenburg, K. DIAMOND, Crystal Impact GbR.; Crystal Impact GbR.: Bonn, Germany, 2006. [Google Scholar]
  31. Spek, A.L. checkCIF validation ALERTS: What they mean and how to respond. Acta Crystallogr. Sect. E Crystallogr. Commun. 2020, 76, 1–11. [Google Scholar] [CrossRef] [PubMed] [Green Version]
  32. Frisch, M.J.; Trucks, G.W.; Schlegel, H.B.; Scuseria, G.E.; Robb, M.A.; Cheeseman, J.R.; Scalmani, G.; Barone, V.; Mennucci, B.; Petersson, G.A.; et al. Gaussian 16, Revision, C.01; Gaussian Inc.: Wallingford, CT, USA, 2016. [Google Scholar]
  33. Chai, J.D.; Head-Gordon, M. Long-range corrected hybrid density functionals with damped atom–atom dispersion corrections. Phys. Chem. Chem. Phys. 2008, 10, 6615–6620. [Google Scholar] [CrossRef] [PubMed] [Green Version]
  34. Weigend, F.; Ahlrichs, R. Balanced basis sets of split valence, triple zeta valence and quadruple zeta valence quality for H to Rn: Design and assessment of accuracy. Phys. Chem. Chem. Phys. 2005, 7, 3297–3305. [Google Scholar] [CrossRef]
  35. Weigend, F. Accurate Coulomb-fitting basis sets for H to Rn. Phys. Chem. Chem. Phys. 2006, 8, 1057–1065. [Google Scholar] [CrossRef]
  36. Dennington, R.; Keith, T.A.; Millam, J.M. GaussView, Version 6; Semichem Inc.: Shawnee Mission, KS, USA, 2016. [Google Scholar]
  37. Spackman, P.R.; Turner, M.J.; Mckinnon, J.J.; Wolff, S.K.; Grimwood, D.J.; Jayatilaka, D.; Spackman, M.A. CrystalExplorer: A program for Hirshfeld surface analysis, visualization and quantitative analysis of molecular crystals. J. Appl. Crystallogr. 2021, 54, 1006–1011. [Google Scholar] [CrossRef]
  38. Tan, S.L.; Jotani, M.M.; Tiekink, E.R.T. Utilizing Hirshfeld surface calculations, non-covalent interaction (NCI) plots and the calculation of interaction energies in the analysis of molecular packing. Acta Crystallogr. Sect. E Crystallogr. Commun. 2019, 75, 308–318. [Google Scholar] [CrossRef] [Green Version]
  39. Spackman, M.A.; Jayatilaka, D. Hirshfeld surface analysis. CrystEngComm 2009, 11, 19–32. [Google Scholar] [CrossRef]
  40. Mackenzie, C.F.; Spackman, P.R.; Jayatilaka, D.; Spackman, M.A. CrystalExplorer model energies and energy frameworks: Extension to metal coordination compounds, organic salts, solvates and open-shell systems. IUCrJ 2017, 4, 575–587. [Google Scholar] [CrossRef] [Green Version]
  41. Macrae, C.F.; Sovago, I.; Cottrell, S.J.; Galek, P.T.A.; McCabe, P.; Pidcock, E.; Platings, M.; Shields, G.P.; Stevens, J.S.; Towler, M.; et al. Mercury 4.0: From visualization to analysis, design and prediction. J. Appl. Crystallogr. 2020, 53, 226–235. [Google Scholar] [CrossRef] [PubMed] [Green Version]
  42. Motherwell, S.; Chisholm, J.A. COMPACK: A program for identifying crystal structure similarity using distances. J. Appl. Crystallogr. 2005, 38, 228–231. [Google Scholar] [CrossRef] [Green Version]
  43. Thomas, S.P.; Spackman, P.R.; Jayatilaka, D.; Spackman, M.A. Accurate lattice energies for molecular crystals from experimental crystal structures. J. Chem. Theory Comput. 2018, 14, 1614–1623. [Google Scholar] [CrossRef] [PubMed] [Green Version]
  44. Maschio, L.; Civalleri, B.; Ugliengo, P.; Gavezzotti, A. Intermolecular interaction energies in molecular crystals: Comparison and agreement of localized Møller–Plesset 2, dispersion-corrected Density Functional, and classical empirical two-body calculations. J. Phys. Chem. A 2011, 115, 11179–11186. [Google Scholar] [CrossRef]
  45. Zara, Z.; Iqbal, J.; Ayub, K.; Irfan, M.; Mahmood, A.; Khera, R.A.; Eliasson, B. A comparative study of DFT calculated and experimental UV/Visible spectra for thirty carboline and carbazole based compounds. J. Mol. Struct. 2017, 1149, 282–298. [Google Scholar] [CrossRef]
  46. Bayach, I.; Sarfaraz, S.; Sheikh, N.S.; Alamer, K.; Almutlaq, N.; Ayub, K. Hydrogen dissociation reaction on first-row transition metal doped nanobelts. Materials 2023, 16, 2792. [Google Scholar] [CrossRef]
Figure 1. Chemical diagram for N4-(4-methylphenyl)-N3-phenyl-1H-pyrazolo[3,4-d]pyrimidine-3,4-diamine (1).
Crystals 13 00974 g001
Scheme 1. Synthesis of N4-(4-methylphenyl)-N3-phenyl-1H-pyrazolo[3,4-d]pyrimidine-3,4-diamine (1).
Crystals 13 00974 sch001
Figure 2. The molecular structures in the: (a) α-polymorph and (b) β-polymorph of 1 showing atom labelling schemes and anisotropic displacement parameters at the 70% probability level.
Crystals 13 00974 g002
Figure 3. The potential energy profile upon the variation of the C4–N6–C12–C13 torsion angle for opt-1.
Crystals 13 00974 g003
Figure 4. Structural overlay between the molecules in the α-polymorph (red image), β-polymorph (blue) and optimised (opt-1; green). The molecules are overlapped such that the pyrazolopyrimidine fragments are coincident.
Crystals 13 00974 g004
Figure 5. A view of the unit-cell contents for the α-form in projection down the b-axis. The phenylamino-N–H···N(pyrazolyl), pyrazolyl-N–H···N(pyrimidyl) and C–H···π contacts are shown as orange, blue and purple dashed lines, respectively. Non-participating H atoms have been omitted.
Crystals 13 00974 g005
Figure 6. Supramolecular association in the crystal of the β-form: (a) detail of the phenylamino-N–H···N(pyrazolyl) and pyrazolyl-N–H···N(pyrimidyl) hydrogen bonds, shown as orange and blue dashed lines, respectively, (b) detail of the H···π and π···π contacts shown as purple and pink dashed lines, respectively, and (c) a view of the unit-cell contents shown in projection down the b-axis. Non-participating H atoms have been omitted.
Crystals 13 00974 g006
Figure 7. A comparison of the molecular packing between the α- (red image) and β- (blue) polymorphs, showing two pairs of molecules (highlighted as bold tubes) out of 15 fit within the 20% tolerance criterion.
Crystals 13 00974 g007
Figure 8. The two views of the dnorm-surface mappings for α- (top) and β- (bottom) polymorphs within the range −0.0815 to 1.0665 arbitrary units, highlighting close contacts as red dots on the surfaces with their intensity relative to the contact distance.
Crystals 13 00974 g008
Figure 9. The two views of electrostatic potential mapped onto the Hirshfeld surfaces for α- (top) and β- (bottom) polymorphs within the range −0.0312 to 0.0362 atomic units, highlighting the charge complementarity between the corresponding point-to-point interactions identified through the Hirshfeld surface analysis.
Crystals 13 00974 g009
Figure 10. The Hirshfeld surface mapped with curvedness (property range: −4.0 to +0.4 arbitrary units) showing the shape complementarity between (a) two pyrazolopyrimidine fragments connected by C13–H13···π(C5) contact in the α-polymorph and (b) the pyrazolopyrimidine and p-toluidine fragments connected by C7–H7···π(C16) in the β-polymorph.
Crystals 13 00974 g010
Figure 11. The overall two-dimensional fingerprint and decomposed plots delineated into the major contacts for α- (top) and β- (bottom) polymorphs.
Crystals 13 00974 g011
Figure 12. Perspective views of the electrostatic energy (red), dispersion force (green) and overall energy frameworks (blue) for the α- (top) and β- (bottom) polymorphs. The cylindrical radius is proportional to the relative strength of the corresponding energies and they were adjusted to the same scale factor of 150 with a cut-off value of 8 kJ/mol within a 2 × 2 × 2 unit-cells.
Crystals 13 00974 g012
Table 1. Crystallographic data and refinement details for the α- and β-polymorphs of 1.
Polymorphαβ
FormulaC18H16N6C18H16N6
Molecular weight316.37316.37
Crystal size/mm30.03 × 0.03 × 0.080.08 × 0.13 × 0.15
Colourcolorlesscolorless
Crystal systemmonoclinicmonoclinic
Space groupP21/cP21/c
a16.3112(4)14.4399(1)
b5.0264(1)13.0065(1)
c18.9678(3)8.1330(1)
β92.005(2)92.329(1)
V31554.15(5)1526.22(2)
Z44
Dc/g cm−31.3521.377
μ/mm−10.6860.699
Measured data19,22818,706
θ range/°4.7–67.13.1–67.1
Unique data27572728
Observed data (I ≥ 2.0σ(I))23452510
No. parameters227227
R, obs. data; all data0.035; 0.0440.032; 0.034
a; b in weighting scheme0.045; 0.6010.038; 0.507
Rw, obs. data; all data0.084; 0.0900.078; 0.080
Range of residual electron−0.20–0.16−0.23–0.16
density peaks/eÅ−3
Table 2. Selected bond lengths (Å) and angles (°) for the α- and β-polymorphs, and for the geometry-optimised molecule, opt-1.
ParameterαβOpt-1
N1–N21.3769(15)1.3687(13)1.356
C1–N11.3451(18)1.3457(15)1.345
C2–N21.3174(19)1.3246(15)1.310
C4–N31.3442(17)1.3429(15)1.329
C5–N31.3441(18)1.3461(15)1.339
C1–N41.3551(17)1.3565(15)1.339
C5–N41.3281(18)1.3283(15)1.316
C2–N51.3915(17)1.4097(15)1.388
C4–N61.3554(17)1.3546(15)1.352
C1–C31.3984(18)1.3930(16)1.395
C2–C31.4309(18)1.4242(16)1.429
C3–C41.4118(19)1.4188(16)1.416
N2–C2–N5–C6−126.44(15)−120.39(11)−127.1
C3–C2–N5–C660.4(2)61.44(16)57.9
C2–N5–C6–C716.5(2)15.71(16)9.3
C2–N5–C6–C11−163.22(13)−166.32(10)−168.5
N3–C4–N6–C12−0.1(2)6.54(18)9.5
C3–C4–N6–C12−178.83(13)−172.70(11)−170.8
C4–N6–C12–C13−41.1(2)−25.90(19)−20.3
C4–N6–C12–C17144.09(14)155.39(12)160.7
Table 3. Geometric parameters characterising the specified intermolecular contacts in the crystals of the α- and β-forms of 1.
AHBH···BA···BA–H···BSymmetry Operation
α
N6H6nCg(C6–C11)2.879(10)3.7434(12)171.2(12)x, y, z
N1H1nN41.997(15)2.8722(17)167.1(14)1 − x, 1 − y, − z
N5H5nN22.109(14)2.9673(17)166.5(13)1 − x, −½ + y, −½ − z
C5H5Cg(C6–C11)2.933.6934(15)138x, ½ − y, −½ + z
C13H13Cg(N3,N4,C1,C3–C5)2.803.4152(15)124x, −1 + y, z
β
N1H1nN41.970(12)2.8584(14)171.1(13)2 − x, 1 − y, − z
N5H5nN22.144(12)3.0137(13)168.1(12)x, ½ − y, ½ + z
C18H18bCg(C12–C17)2.943.7507(14)141x, 3/2y, ½ + z
Cg(N3,N4,C1,C3–C5) Cg(N3,N4,C1,C3–C5) 3.5651(6)0 a2 − x, 1 − y, 1 − z
a Angle between the aromatic rings.
Table 4. dnorm-Contact distances (with X–H adjusted to neutron values) for the intermolecular interactions identified in the α- and β-polymorphs, computed through the Hirshfeld surface analysis with a comparison to the corresponding sums of van der Waals radii (ΣvdW).
Contactdnorm Distance (Å)ΣvdW (Å)Δ(ΣvdW − dnorm Distance)Symmetry Operation
α
N1–H1n···N41.882.640.7581 − x, 1 − y, −z
N5–H5n···N21.982.640.6611 − x, −½ + y, ½ − z
C8–H8···C172.712.790.083x, 1 + y, z
C10–H10···N32.582.640.058x, −½ − y, ½ + z
C4···C133.353.400.046x, 1 + y, z
C7–H7···C122.772.790.025x, 1 + y, z
C13–H13···C52.772.790.019x, −1 + y, z
β
N1–H1n···N41.862.640.7822 − x, 1 − y, −z
N5–H5n···N22.022.640.619x, ½ − y, ½ + z
C11–H11···C72.602.790.192x, ½ − y, ½ + z
C4···C53.273.400.1262 − x, 1 − y, 1 − z
C7–H7···C162.692.790.098x, y, −1 + z
Table 5. Interaction energies (kJ/mol) for all close contacts present in the crystals of the α- and β-polymorphs.
ContactEeleEpolEdispErepEtotSymmetry Operation
α
{N1–H1n···N4}2−107.0−17.5−15.970.6−69.91 − x, 1 − y, −z
C7–H7···C12 +
C8–H8···C17 +
C13–H13···C5 +
C4 ···C13
−13.3−2.4−68.328.7−55.3x, 1 + y, z
N5–H5n···N2−40.9−6.3−15.828.8−34.21 − x, −½ + y, ½ − z
C10–H10···N3−9.7−1.3−19.112.5−17.6x, −½ − y, ½ + z
β
{N1–H1n···N4}2−109.2−18.6−16.775.5−68.92 − x, 1 − y, −z
N5–H5n···N2 +
C11–H11···C7
−46.2−7.1−42.040.4−54.9x, ½ − y, ½ + z
C4 ···C5−4.1−1.3−48.118.8−34.62 − x, 1 − y, 1 − z
C7–H7···C16−7.5−1.0−37.215.1−30.7x, y, −1 + z
Table 6. The lattice energy along with the corresponding energy components (kJ/mol) for the α- and β-polymorphs.
PolymorphEeleEpolEdispErepElattice
α−92.5−14.8−97.980.5−124.6
β−94.1−15.4−117.391.2−135.6
Disclaimer/Publisher’s Note: The statements, opinions and data contained in all publications are solely those of the individual author(s) and contributor(s) and not of MDPI and/or the editor(s). MDPI and/or the editor(s) disclaim responsibility for any injury to people or property resulting from any ideas, methods, instructions or products referred to in the content.

