Article

Synthesis of Up-Conversion Fluorescence N-Doped Carbon Dots with High Selectivity and Sensitivity for Detection of Cu2+ Ions

School of Chemical Engineering, Sichuan University, No. 24 South Section 1, Yihuan Road, Chengdu 610065, China
*
Author to whom correspondence should be addressed.
Crystals 2023, 13(5), 812; https://doi.org/10.3390/cryst13050812
Submission received: 14 April 2023 / Revised: 8 May 2023 / Accepted: 10 May 2023 / Published: 13 May 2023
(This article belongs to the Special Issue 1D and 2D Nanomaterials for Sensor Applications)

Abstract

:
Carbon dots have drawn extensive attention in the detection of metal ions with good stability, excellent biocompatibility and low toxicity. Meanwhile, the quantum yield, response rate and the detection mechanism for Cu2+ ions are vital to their development and application. To obtain more selective and sensitive materials to detect Cu2+ ions, N-doped carbon dots (DN-CDs) were synthesized by a one-step hydrothermal method using citric acid as the carbon source and diethylenetriamine (DETA) as the nitrogen source. The obtained DN-CDs exhibited stable and intense blue light emission and special near-infrared up-conversion fluorescence at 820 nm, attributed to the effect of introducing N atoms into the structure of carbon dots. Due to the dynamic quenching of the DN-CDs by Cu2+ ions, the fluorescence intensity (λex = 820 nm) of DN-CDs was quantitatively decreased in the presence of Cu2+ ions. The DN-CDs had a rapid response within 3 min. The DN-CD system exhibited a linear relationship with a concentration range from 2.5 to 50 µM and low detection limit (LOD) of 42 nM. After careful investigation, an interesting conclusion was proposed: N-doped CDs with N/O = 1:1 or higher with relatively abundant N atoms prefer to detect Cu2+ ions while those with N/O = 1:2 or lower prefer to detect Fe3+ ions.

1. Introduction

Industrial pollutants pose serious threats to nature and human health, so their removal and detection are extremely important. At present, some effective materials have been developed for the removal of pollutants, such as chitosan-based polymer materials with excellent adsorption abilities for heavy metal ions [1]. Additionally, some effective analytical methods have been developed to detect chemical or biological drugs, metal ions and organic pollutants [2,3,4,5]. Analytical methods used to detect metal ions include potential/electrochemical sensors [6,7], fluorescence analysis [8], atomic absorption spectrometry (AAS) [9] and inductively coupled plasma mass spectrometry (ICP-MS) [10]. However, most of these approaches are not suitable for real-time monitoring due to their high cost, long assay times, special equipment, and laborious and complex experimental processes. Therefore, fluorescent sensors with low cost, simple operation, high sensitivity and good selectivity have gradually emerged [11]. Nowadays, various materials have been developed as fluorescent probes for environmental monitoring of metal ions, such as metal–organic frameworks (MOFs) [12,13], nanoclusters [14,15], organic fluorescent dyes [16] and semiconductor quantum dots. In particular, fluorescent carbon-based materials have attracted extensive attention due to their good chemical stability, excellent biocompatibility and low toxicity [17], distinguishing themselves from traditional fluorescent materials.
With the progress in scientific and technological research, more heavy metals remain in the human living environment. The excessive intake of metal ions will have extremely serious effects on human health [18,19]. Copper is one of the most important transition metals in the human body [20] and plays an extremely important role in biological processes, such as embryonic development, mitochondrial respiration, regulation of hemoglobin levels as well as hepatocyte and neuronal functions [21,22]. Copper ions are widely distributed in the natural environment, especially in industrial wastewater. Long-time exposure to copper ions will cause high toxicity to the human body, and is associated with neurodegenerative diseases, such as Wilson’s syndrome, Alzheimer’s disease and Parkinson’s disease [23,24,25]. According to United States Environmental Protection Agency (USEPA) guidelines, drinkable water must not contain a Cu2+ content of ≥20 µM [26]. Therefore, the detection of copper ions in the environment requires a simple and practical detection method with high sensitivity and selectivity.
Carbon dots (CDs) are zero-dimensional carbon-based materials, mostly spherical nanoclusters with diameters of less than 10 nm, composed of amorphous or crystalline cores with sp2 hybrid carbon atoms [27]. Owing to their small size, high photostability, resistance to photobleaching, low toxicity, good water solubility, excellent biocompatibility and ease of surface functionalization, carbon dots have become the focus of fluorescent probe materials as well as in cell labeling, optical bioimaging, drug delivery, storage applications and photocatalysis [28]. Metal ions, such as Hg2+, Fe3+ and Cu2+, can effectively quench the fluorescence of carbon dots [29,30,31]. Carbon dots can be obtained by thermal decomposition [32], hydrothermal carbonization [33], microwave-assisted pyrolysis [34], electrochemical methods [35], etc. Hydrothermal carbonization refers to heating water and carbon-rich substances in a closed container to trigger the carbonization reaction. Citric acid is the most used carbon-rich substance, which is easy to condense and induce to form carbon rings, and is also has atoms that can be easily doped. Meanwhile, the surface of the formed carbon dots has rich functional groups, such as hydroxyl and carboxyl groups. The hydrothermal method is the most widely used method, which has the characteristics of good feasibility; cheap, diverse carbon sources; no toxicity; and environmental friendliness [36]. However, carbon dots without modification usually have a low quantum yield (QY) and poor stability, which affect their practical application [37,38]. Additionally, the origin of fluorescence in carbon dots has not yet been clarified. The fluorescence emission is primarily caused by the competition between the optical centers, surface states and traps [39]. Up-conversion fluorescence means that the shorter wavelengths of light are emitted through longer excitation wavelengths [40]. This fluorescence is usually caused by the multiphoton absorption effect. The fluorescence of carbon dots can be altered by controlling size and shape, modifying the edges of the surfaces and doping with heteroatoms, due to the edge effect, surface effect and quantum confinement effect (QCE) [41]. Doping different elements leads to better performance, such fluorescence improvement and shifting of the fluorescence spectra. Doping with different heteroatoms can change the electronic properties and excite special optical properties through the passivation of the surface states or the introduction of defects [42,43]. Salehtabar et al. [44] prepared photo-luminescent, water-soluble, nitrogen-doped, highly fluorescent carbon dots based on the gum tragacanth polysaccharide and triethylenetetramine (TETA). Therefore, it is a better way to synthetize fluorescent probe materials based on carbon dots with a higher sensitivity, higher selectivity, high quantum yield and unique fluorescence performance.
Herein, we report a simple method for preparing nitrogen-doped carbon dots (DN-CDs) with intense down-conversion and unique up-conversion fluorescence using diethylenetriamine (DETA) and citric acid as the nitrogen and carbon sources, respectively (Scheme 1). The DN-CDs had good fluorescence properties, and excellent photobleaching and stability. We used it for rapid, efficient and selective detection of copper ions within 3 min with a detection limit (LOD) as low as 42 nM. Compared with other carbon dots, DN-CDs showed better and stable up-conversion fluorescence, which could convert low energy light into high energy radiation through a nonlinear optical process, avoiding interference with biological background luminescence and achieving good photon tissue penetration [45,46,47,48]. This would compensate for the disadvantages of down-conversion fluorescence carbon dots, and has great potential for detecting metals in organisms. The experimental results proved that the mechanism of fluorescence quenching through dynamic quenching. Additionally, combined with reports in the literature, the ratio of N and O atoms may be more critical on the premise that the N, O-based functional groups interact with Cu2+. Two previously synthesized nitrogen-doped carbon dots were selected for comparison and preliminarily verified the proposed conclusion. This would be conducive to the selection and design of highly selective fluorescent probe materials for copper ions.

2. Experimental

2.1. Chemicals and Materials

All chemicals were of analytical grade and were used directly without any further purification. Diethylenetriamine, quinine sulfate and all the metal nitrates, nicotinamide sulfate and chloride salts were purchased from Kelong Chemical Co., Ltd. (Chengdu, China). Citric acid and sulfuric acid were purchased from Xilong Chemical Co., Ltd. (Chengdu, China). Anhydrous ethanol was purchased from Changlian Chemical Co., Ltd. (Chengdu, China). N, N-Dimethylformamide (DMF) and Tetrabutylammonium Tetrafluoroborate were purchased from Dingsheng Chemical Co., Ltd. (Chengdu, China). l-Glutamic acid (l-Glu) and m-phenylenediamine (MPD) were purchased from Aladdin Industrial Co., Ltd. (Shanghai, China).

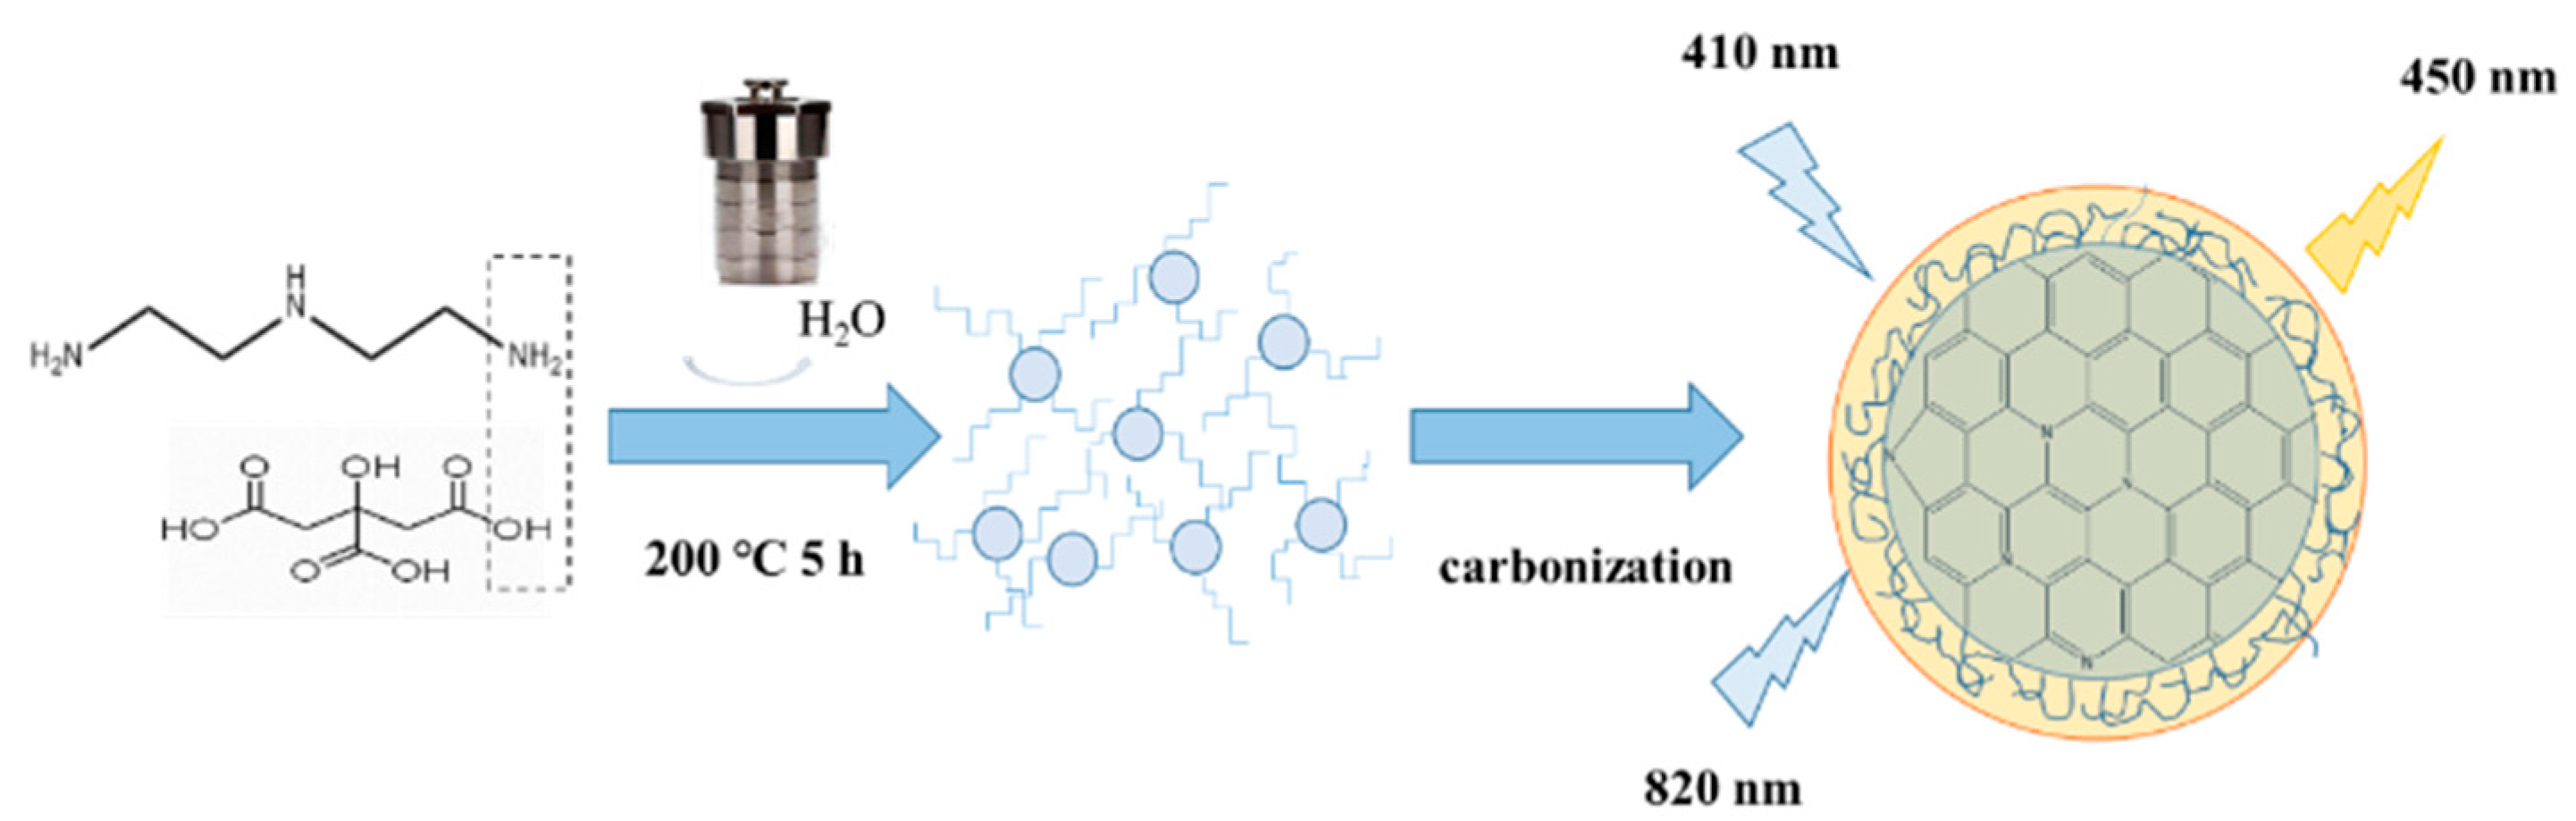
2.2. Preparation of N-CDs

N-doped carbon dots were synthesized by a simple one-step hydrothermal method. First, 0.44 g citric acid (CA) and a certain amount of diethylenetriamine (DETA) were added to 20 mL of ultra-pure water and sonicated for 20 min until the CA was dissolved. The prepared mixture was placed in a 50 mL PPL-lined stainless-steel autoclave and heated in an oven for a certain amount of time. The autoclave was cooled to room temperature after the reaction, and a slightly yellow solution was obtained. The solution was collected, dialyzed (MWCO = 500 Da) for 24 h to remove unreacted starting materials and then the dialysate was removed and internal solution was freeze-dried to obtain the final brown product. The optimal amount of DETA was determined by testing the varying molar ratios of CA:DETA (1:1, 1:2, 1:4, 1:8 and 1:10) with the reaction condition of 5 h and 180 °C. Additionally, the optimal reaction temperature was determined by testing different temperatures (150 °C, 180 °C, 200 °C, 220 °C and 240 °C) with a 1:4 molar ratio of CA:DETA and 5 h reaction time. Then, the reaction time was determined by testing different reaction times (4 h, 6 h, 8 h, 10 h and 12 h) with a 1:4 molar ratio of CA:DETA at 200 °C.
The two other carbon dots were prepared according to previous reports [49,50]. The specific preparation methods are detailed in the Supplementary Information.

2.3. Measurement of Quantum Yield

DN-CDs have similar absorption peaks (350 nm) and emission peaks (380–580 nm) as quinine acid; therefore, the QY could be measured using a relative method [51]. Quinine sulfate was selected as the reference compound (QY = 54% in 0.05 M H2SO4). The QY of our sample was calculated using Equation (1):
Y 1 = Y 2 S 1 S 2 A 2 A 1 n 1 2 n 2 2
where ‘Y1’ is the QY of DN-CDs, ‘Y2’ is the QY of quinine sulfate, ‘S’ is the peak area obtained from emission peak integration, ‘A’ is the absorbance intensity at λ(ex) of 350 nm, and ‘n’ is the refractive index (1.33 for both sample and reference). A series of solutions of DN-CDs and quinine sulfate were prepared until the absorbance intensities were below 0.05 at λex = 350 nm, which were recorded as A1 and A2, respectively. Then, the fluorescence spectra were measured and the emission peaks in the range of 400–700 nm were selected for integration to obtain the peak areas (S1 and S2). Finally, the QY for our DN-CDs was calculated using Equation (1).

2.4. Characterization

Transmission electron microscopy (TEM) was performed using an INSPECT F instrument (J&R Instrument Technology Co., Ltd., Shanghai, Chnia). X-ray photoelectron spectroscopy (XPS) results were obtained using XSAM 800 equipment (Kratos Analytical Ltd., Manchester, UK). The X-ray diffraction (XRD) patterns were identified using an X’Pert PRO diffractometer (PANalytical, Almelo, The Netherlands) with Cu Kα1 radiation, a step size of 0.01313° 2θ, and a counting time of 30 ms step-1 from 10° to 80°. FT-IR spectra were obtained using a Nicolet-6700 FT-IR spectrometer (Thermo Scientific, Madison, WI, USA). Fluorescence spectra were recorded using an F97-Pro fluorospectrophotometer (Lengguang Tech. Ltd., Shanghai, China). UV–Vis absorption spectra were recorded using a UV–vis spectrophotometer (Mapada Instruments Ltd., Shanghai, China). Fluorescence lifetime spectra were measured using F-7000 equipment. The redox properties of DN-CDs were examined by cyclic voltammetry which was carried out on a CH1660A electrochemical workstation.

2.5. Detection of Metal Ions

The PL spectra were measured to study the selectivity and sensitivity of the DN-CDs. The different chemical compounds with different metal ions (Na+, K+, Ca2+, Fe2+, Fe3+, Cr3+, Mg2+, Mn2+, Pb2+, Zn2+, Cd2+) and anions (SO42−, PO43−, Cl, NO3) were dissolved in DI-water to obtain a series of metal solutions with a concentration of 10 µM. 1 mL aqueous solution of metal ions and 1 mL aqueous solution of DN-CDs (20 µg/mL) were mixed. After a certain amount of time, PL intensity was detected three times to obtain the average value. To further study the sensitivity detection of Cu2+, a series of CuSO4 solutions with concentration of 0–500 µM were prepared and mixed with 1 mL DN-CDs (20 µg/mL). A Cu2+ solution was added into the solutions containing other metal ions to obtain a mixed solution with two metal ions to conduct interference tests.

2.6. Detection in Real Samples

We used the tap water from our laboratory, the water from Jinjiang River in Wuhou District, Chengdu, and the water from a lotus pond in the Wangjiang Campus of Sichuan University as the real water samples. These samples were filtered through a 0.22 µm membrane and centrifuged at 10,000 rpm for 5 min to remove any suspended materials. Then, 1 mL of the sample with a standard Cu2+ ion solution (10, 20 and 30 µM) was mixed with 1 mL of DN-CD solution for 4 min and the fluorescence intensity was measured.

3. Results and Discussion

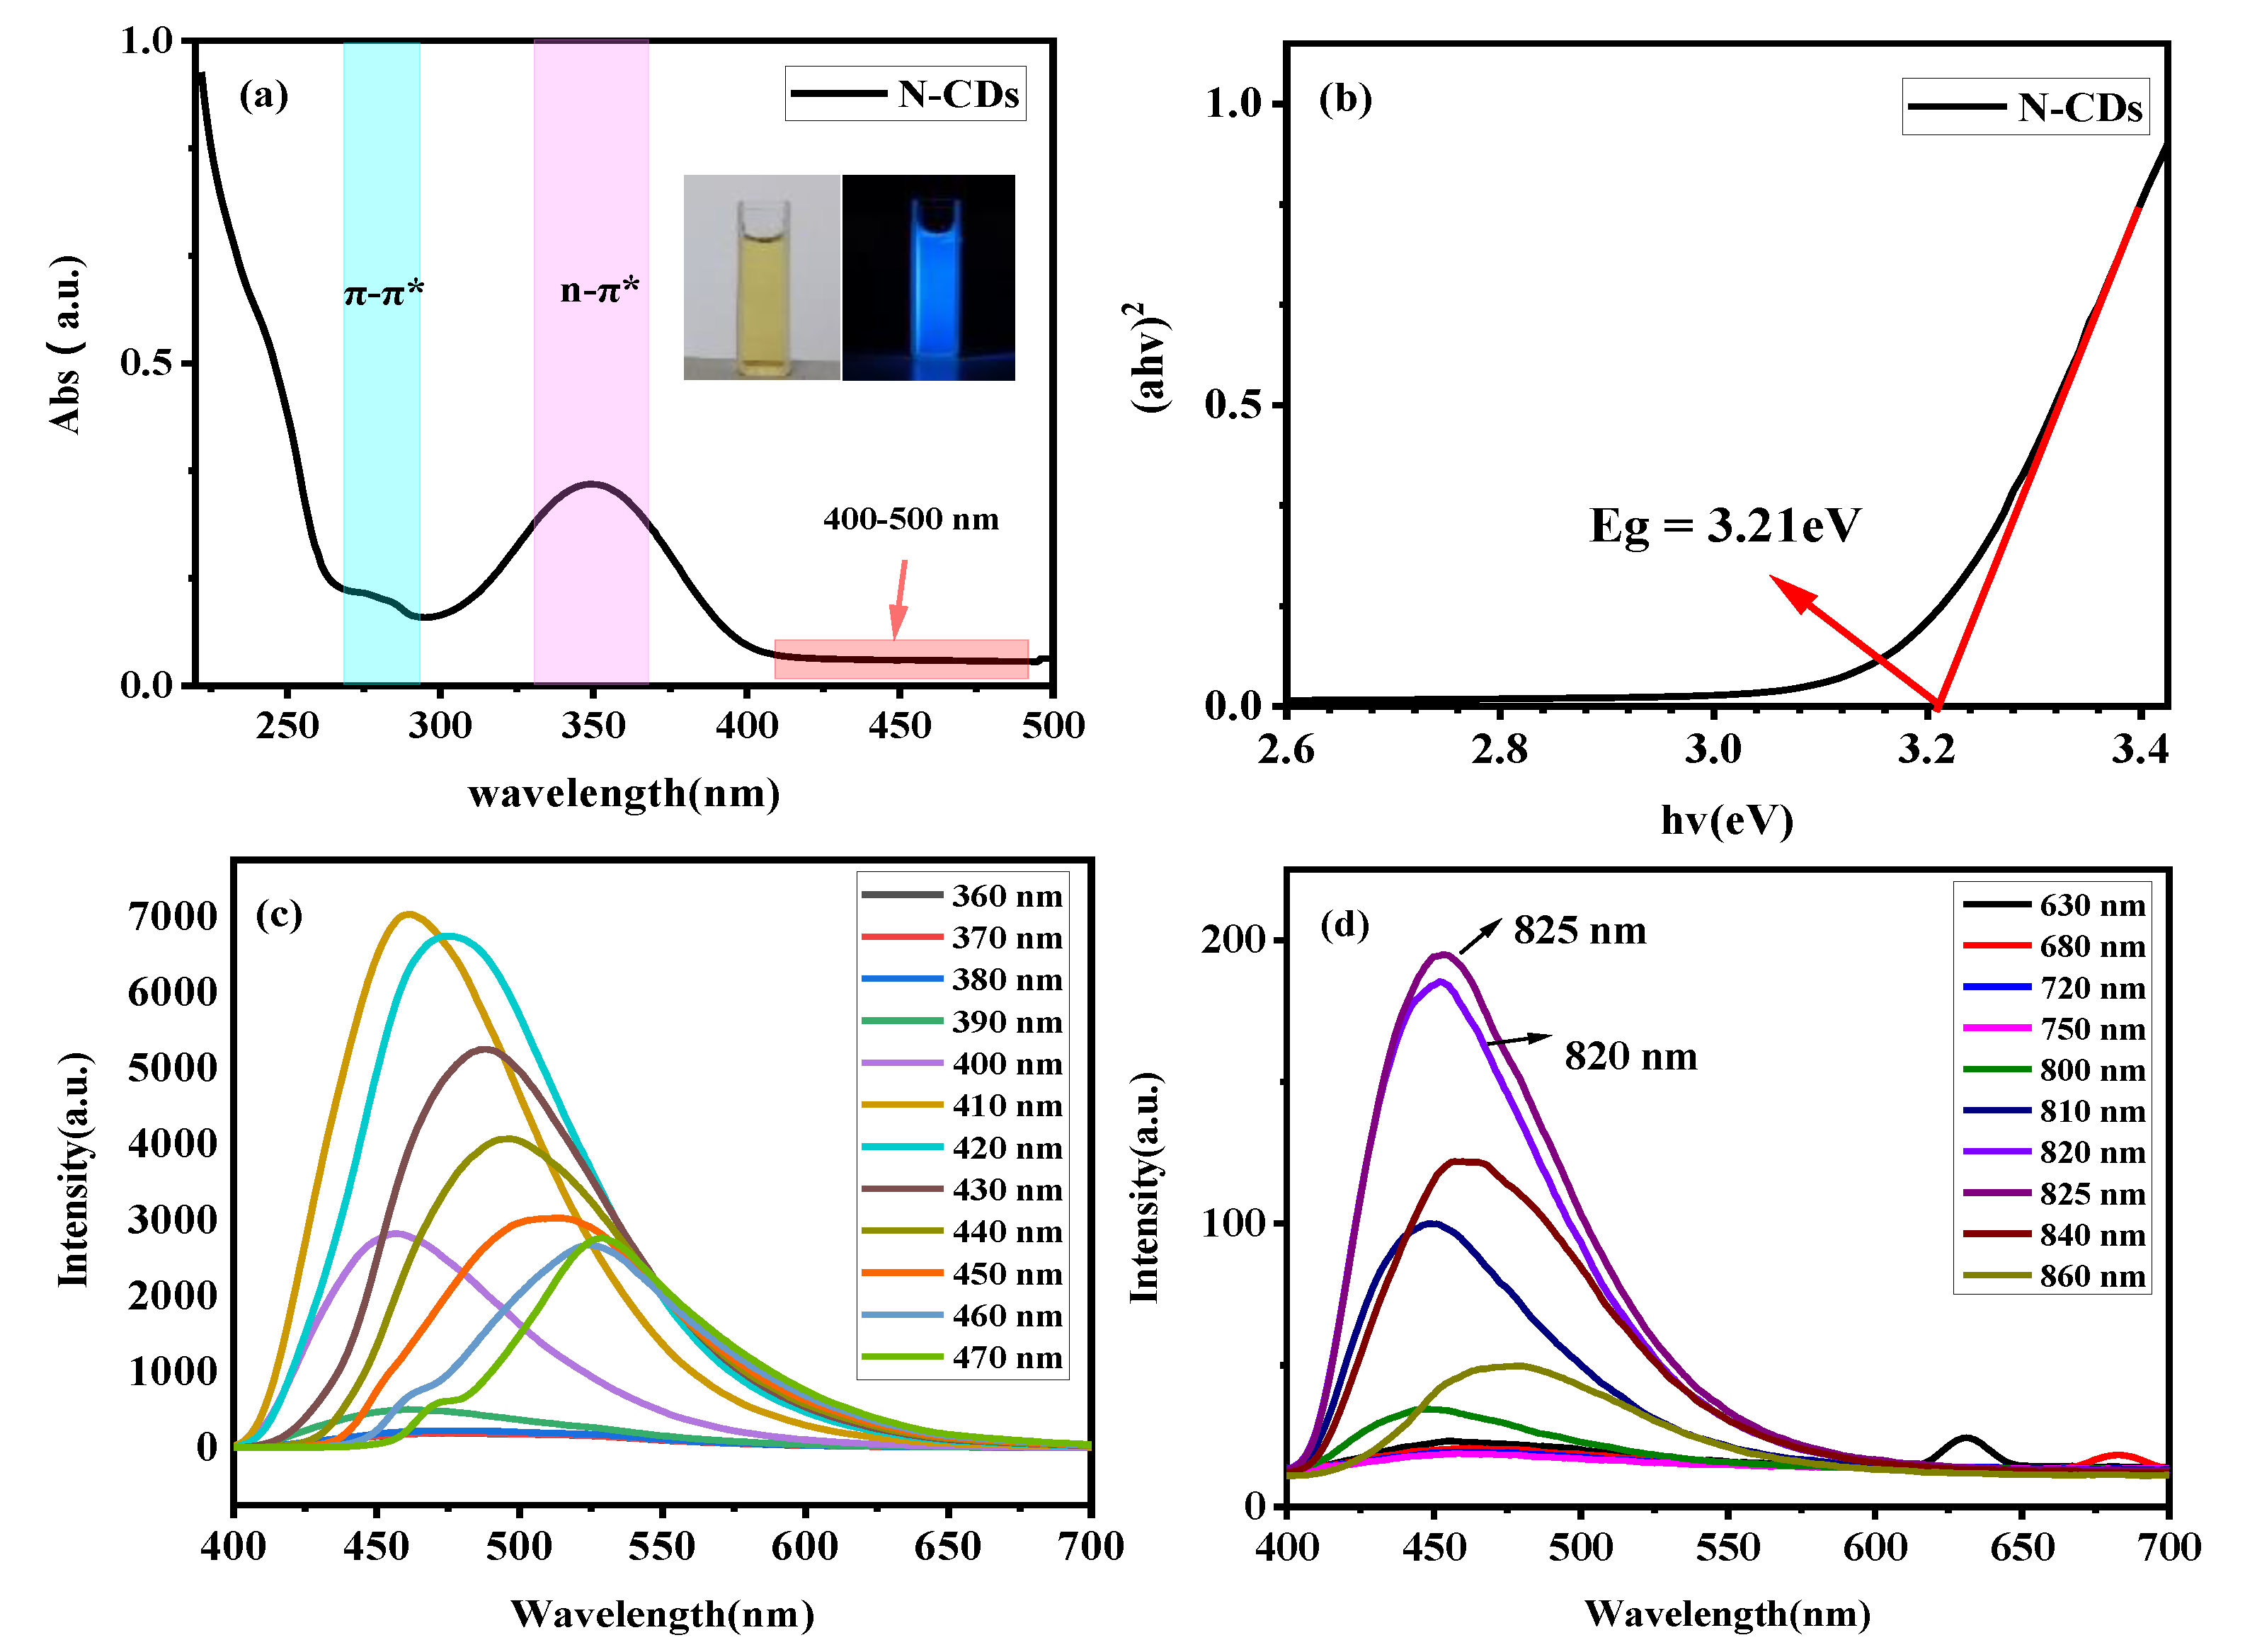
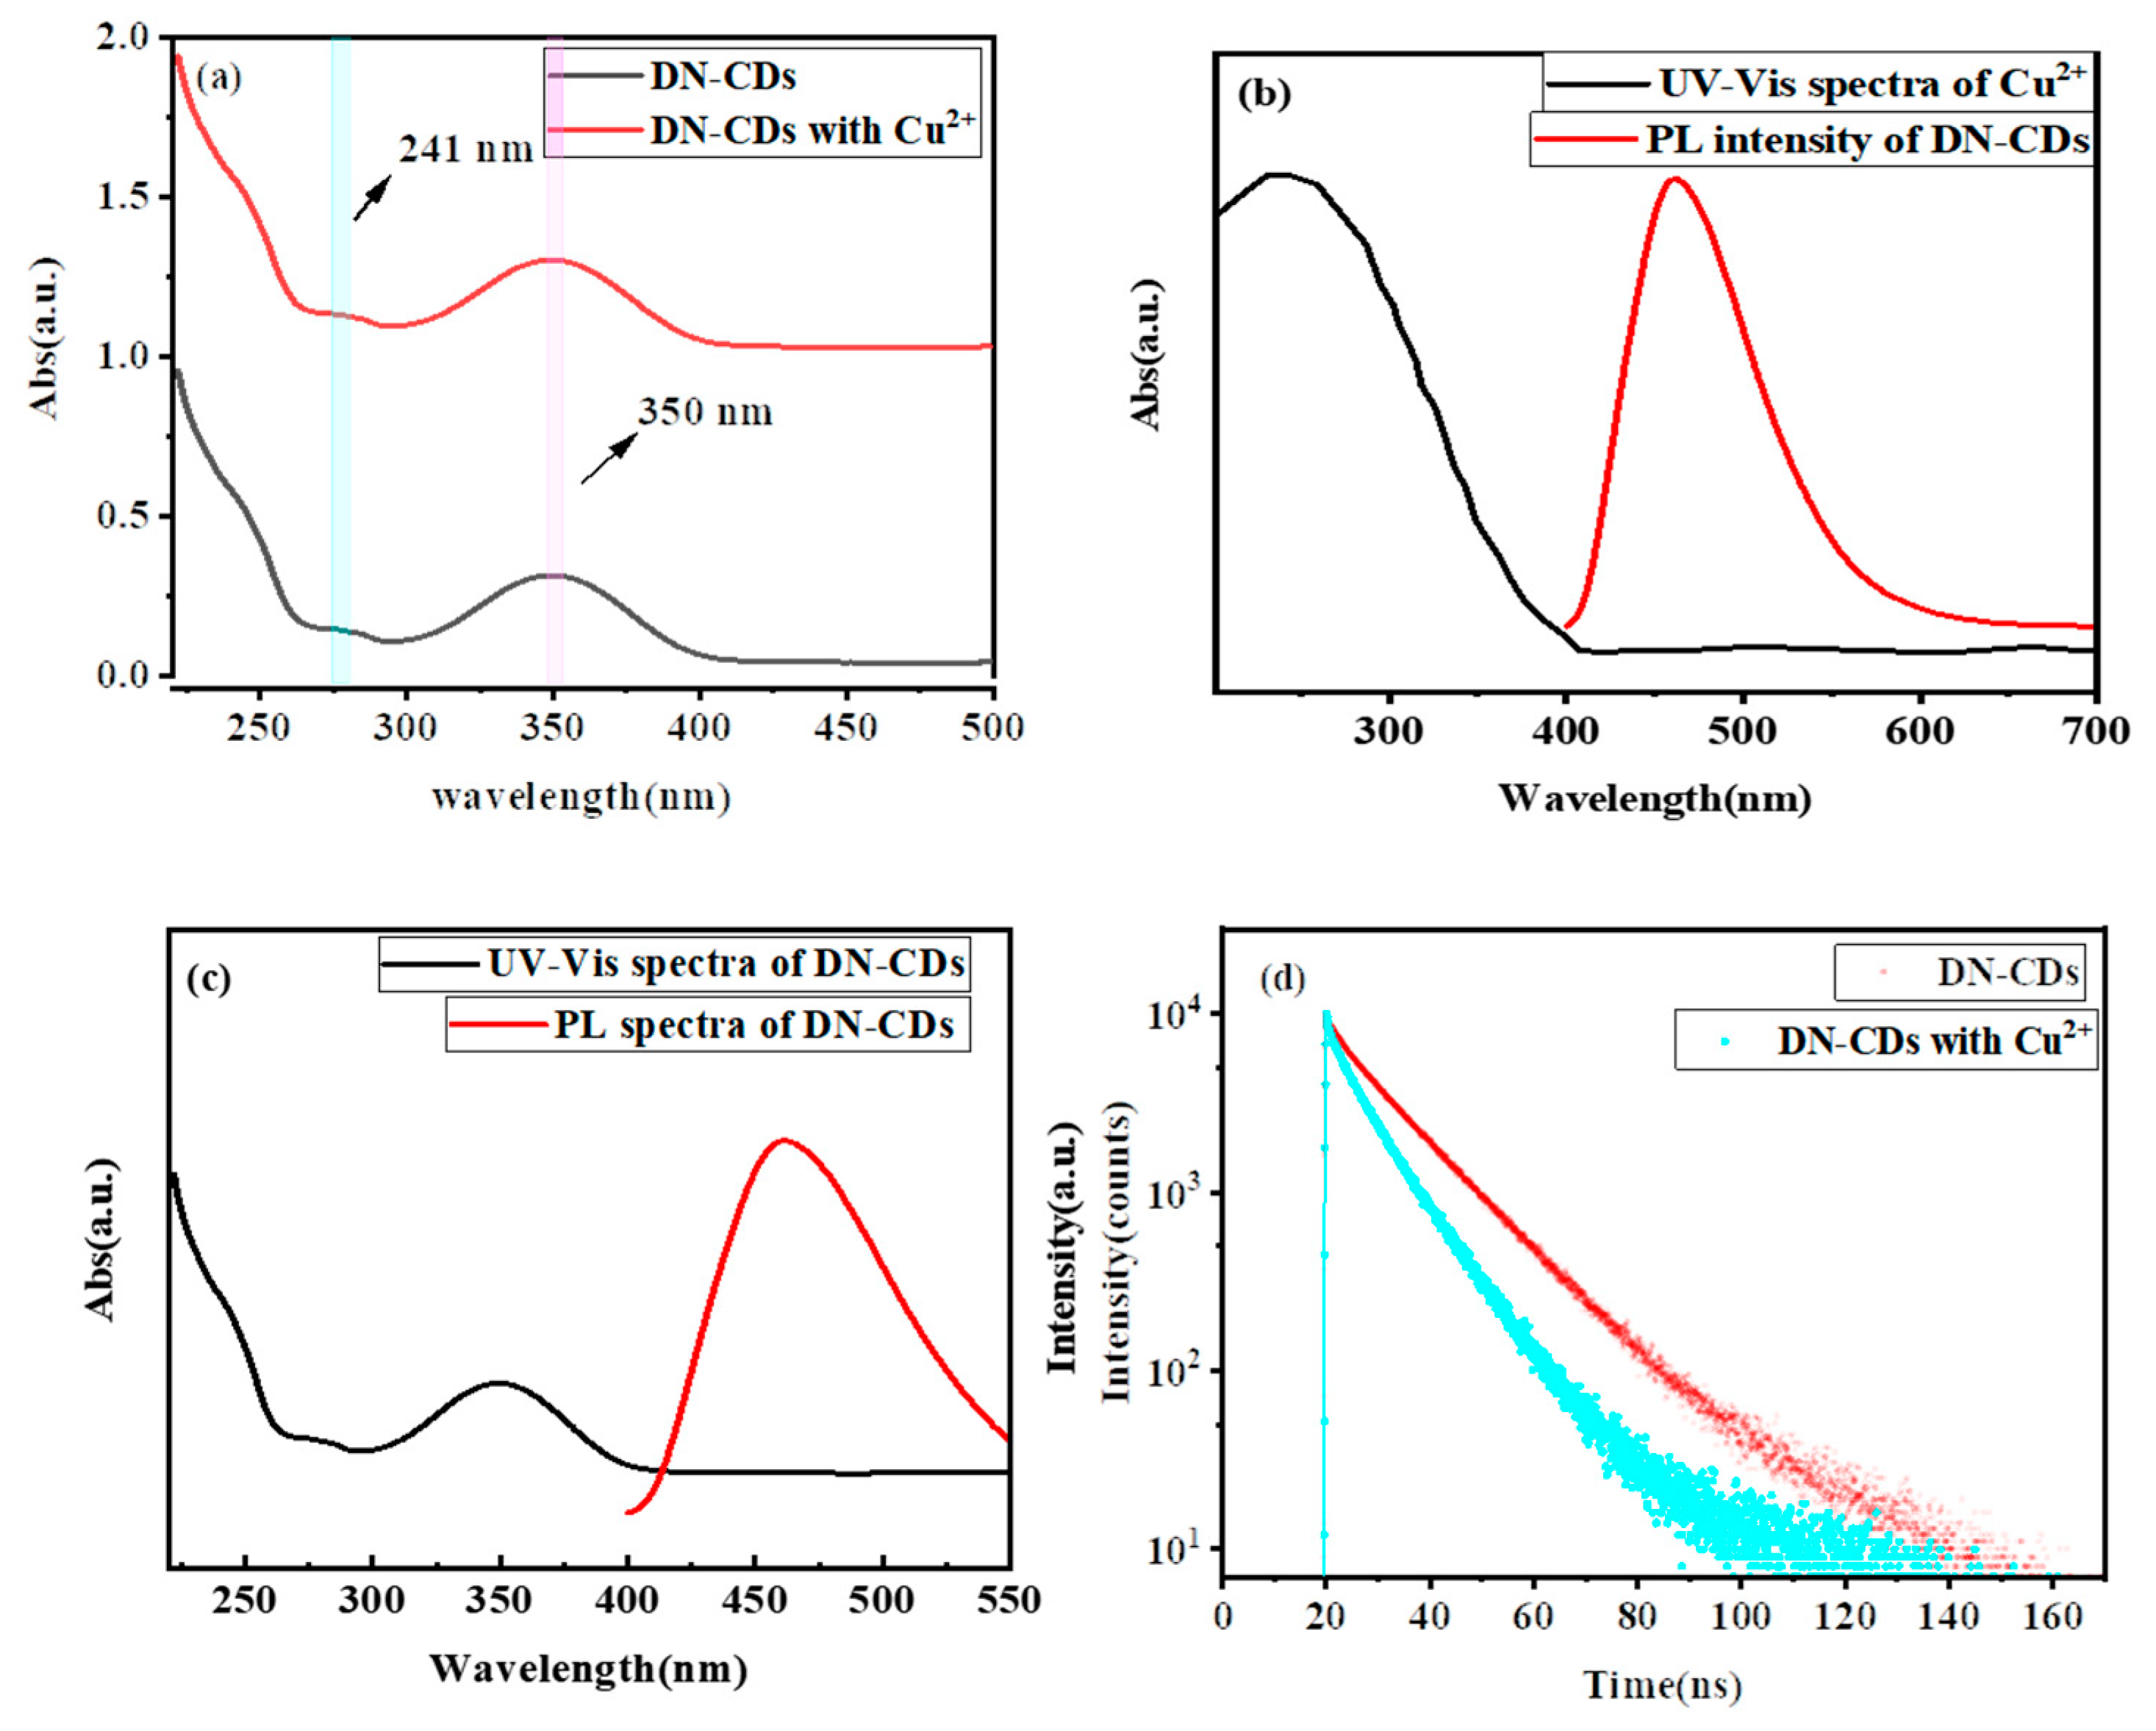
3.1. Optical Properties of DN-CDs

In this study, by changing the ratio of CA and DETA, reaction temperature and reaction time, we developed a simple one-step synthesis method for carbon dots with a high quantum yield under down-conversion fluorescence. As shown in Figure S1, it could be seen that with the increase in DETA and reaction temperature, the quantum yield first increased and then decreased. Additionally, in Figure 1c, the quantum yield decreased and then increased slightly. Finally, carbon dots with a high quantum yield under down-conversion fluorescence were obtained. Additionally, the optimum conditions were found to be CA/DETA = 1:4, reaction time of 4 h, and reaction temperature of 200 °C. And we used these carbon dots, denoted as DN-CDs, to perform the further characterizations.
The optical properties of the DN-CDs were measured using UV-vis absorption and PL spectroscopy, as shown in Figure 1a. Typically, the absorption of carbon dots could be divided into two main regions: π—π* and n—π* transition [52]. The weak absorption peak at 241 nm was the π—π* transition of C=C, attributed to the absorption peak of the carbon atom in cyclic aromatic hydrocarbons [53]. The wide absorption peak at 350 nm indicated the n—π* transition of the nitrogen- or oxygen-containing functional groups on the surface of the DN-CDs, attributed to the doping with N atoms [54]. The bandgap energies were determined according to the Tauc plot (Equation (2)) as follows:
( a h v ) 1 n = A ( h v E g )
where ‘a’ is the absorption coefficient, ‘h’ is Planck’s constant, ‘v’ is the incident light frequency, ‘Eg’ is the bandgap energy, ‘A’ is a constant and ‘v’ is a variable dependent on the type of bandgap [55]. As shown in Figure 1b, the bandgap of DN-CDs was 3.21 eV.
Under daylight, the DN-CD solution was slightly yellow and clear; in contrast, it was a bright blue color if exposed to UV irradiation at 365 nm (inset in Figure 1a). Figure 1c displayed the photoluminescence spectra of DN-CDs, showing a maximum emission at 450 nm (λex = 410 nm). Moreover, when the excitation wavelength was increased, the peak value of fluorescence had a small red shift, which indicated that the PL was dependent on the excitation wavelength. This excitation-dependent fluorescence property reflected the size of the DN-CDs and the distribution of different surface states [56]. In particular, Figure 1d also demonstrates the stable up-conversion PL property. When the excitation wavelength changed from 630 nm to 860 nm, the UCPL spectrum showed a basically unchanged emission at 451 nm, indicating a single emission center in the carbon dots. The peak intensities at 820 and 825 nm were significantly higher than that of other wavelengths. The doping with N atoms might lead to an increase in lone pair electrons on oxygen atoms and nitrogen atoms, increasing the electron density in the π—system. Additionally, it would reduce the π*—energy level of the excitation, so the excitation required a lower energy [35].

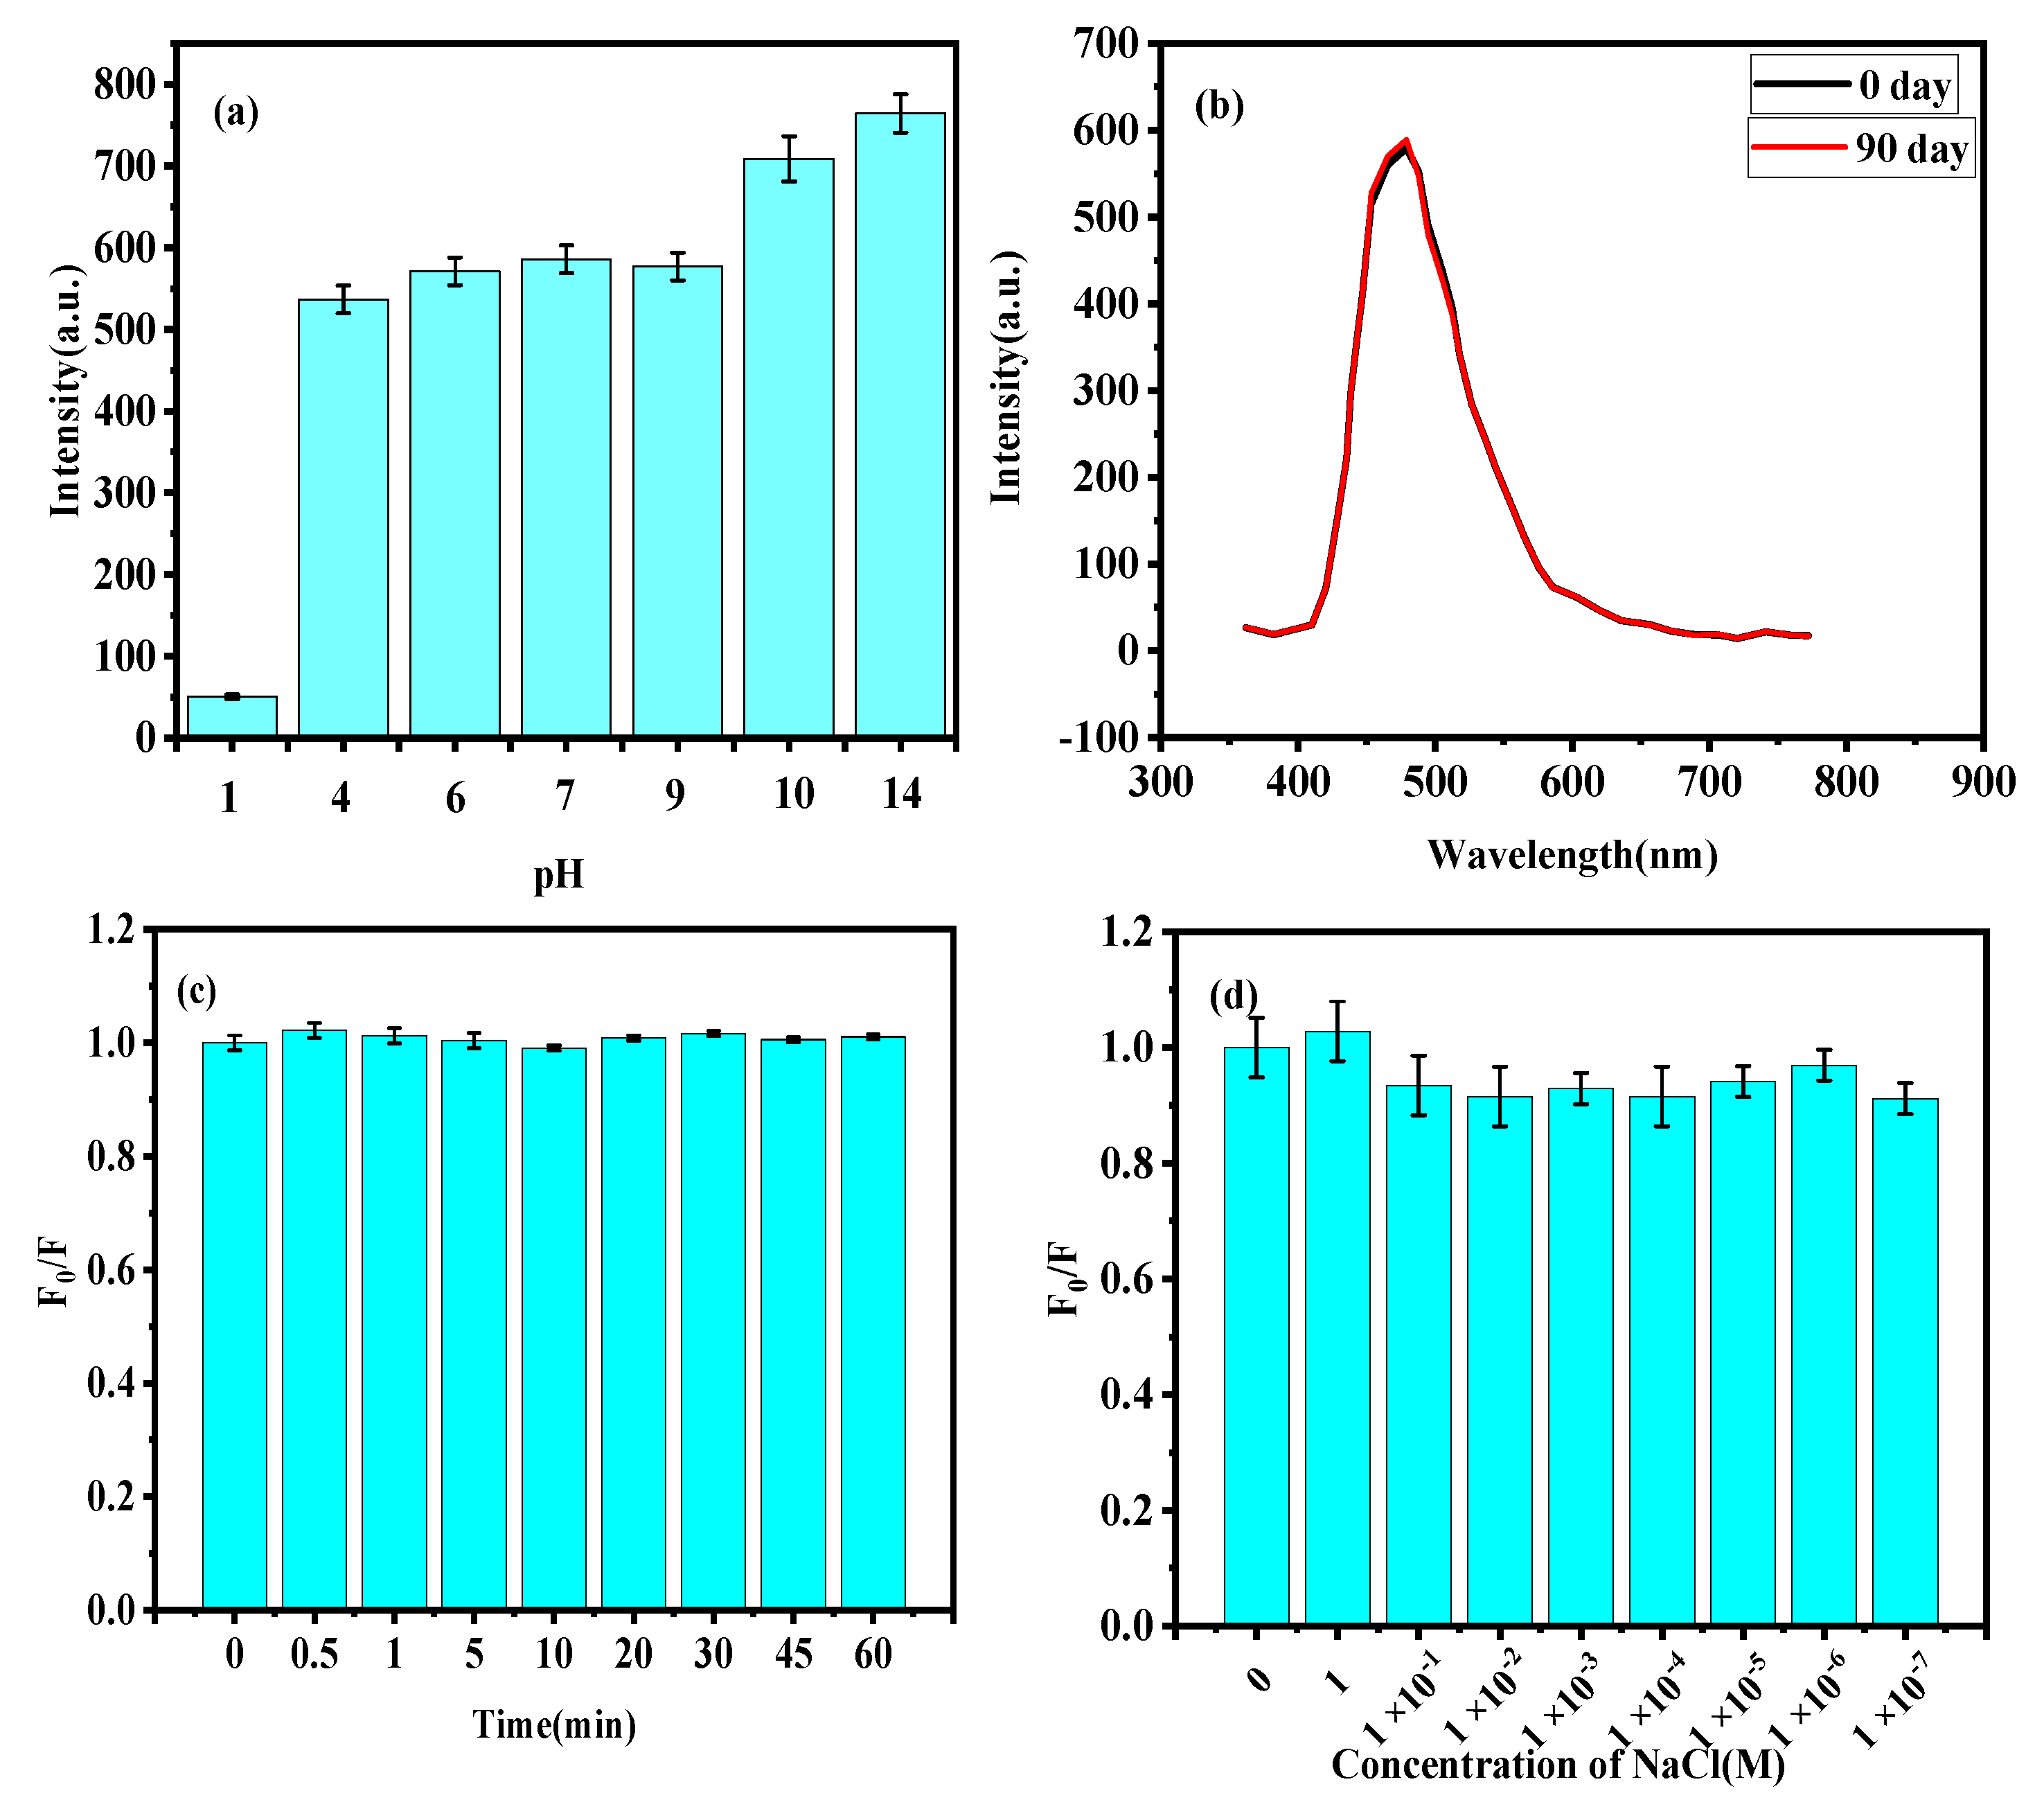
3.2. Photoluminescence Stability of DN-CDs

For the application of fluorescent probes in the detection of metal ions, it is important to explore the up-conversion fluorescence (UCPL) stability of DN-CDs. The PL intensity of DN-CDs under different pH conditions is shown in Figure 2a, indicating a strong UCPL intensity in a wide range of pH levels (pH = 4–12). In particular, DN-CDs had a negligible change in the PL emission range or intensity within pH levels of 4–9, indicating excellent stability of the DN-CDs; the UCPL intensity markedly changed under strong acid–base conditions, due to the protonation and deprotonation of the functional groups (-OH/-COOH and -NH2) on the surface of the DN-CDs, which resulted in the destruction of the aromatic conjugate system and complex system [24,57]. This was proven by the Zeta potentials in different pH aqueous solutions in Figure S2. DN-CDs had a negative potential at pH = 4–13, and the negative potential increased sharply under highly alkaline conditions. DN-CDs had a high positive potential at pH = 2, which indicated that the same protonation in a strong acidic environment. Meanwhile, the DN-CDs had a higher negative potential at pH = 11–13, which indicated intense deprotonation. In order to study the optical stability of carbon dots, we tested their up-conversion fluorescence intensity under daily storage conditions and simulated sunlight conditions using a xenon lamp (300 W). As shown in Figure 2b, we could see that the up-conversion fluorescence intensity of the DN-CD solution remained high after 90 days, which indicated that the DN-CDs had long-time UCPL stability; at the same time, the carbon dot solution was still clear and transparent. As shown in Figure 2c, the up-conversion fluorescence intensity of the carbon dot solution was basically unchanged within the first hour of xenon irradiation (300 W), where F0 is the initial up-conversion fluorescence intensity, and F is the up-conversion fluorescence intensity after xenon irradiation. In summary, the prepared carbon dots (DN-CDs) had strong pH stability and optical stability.

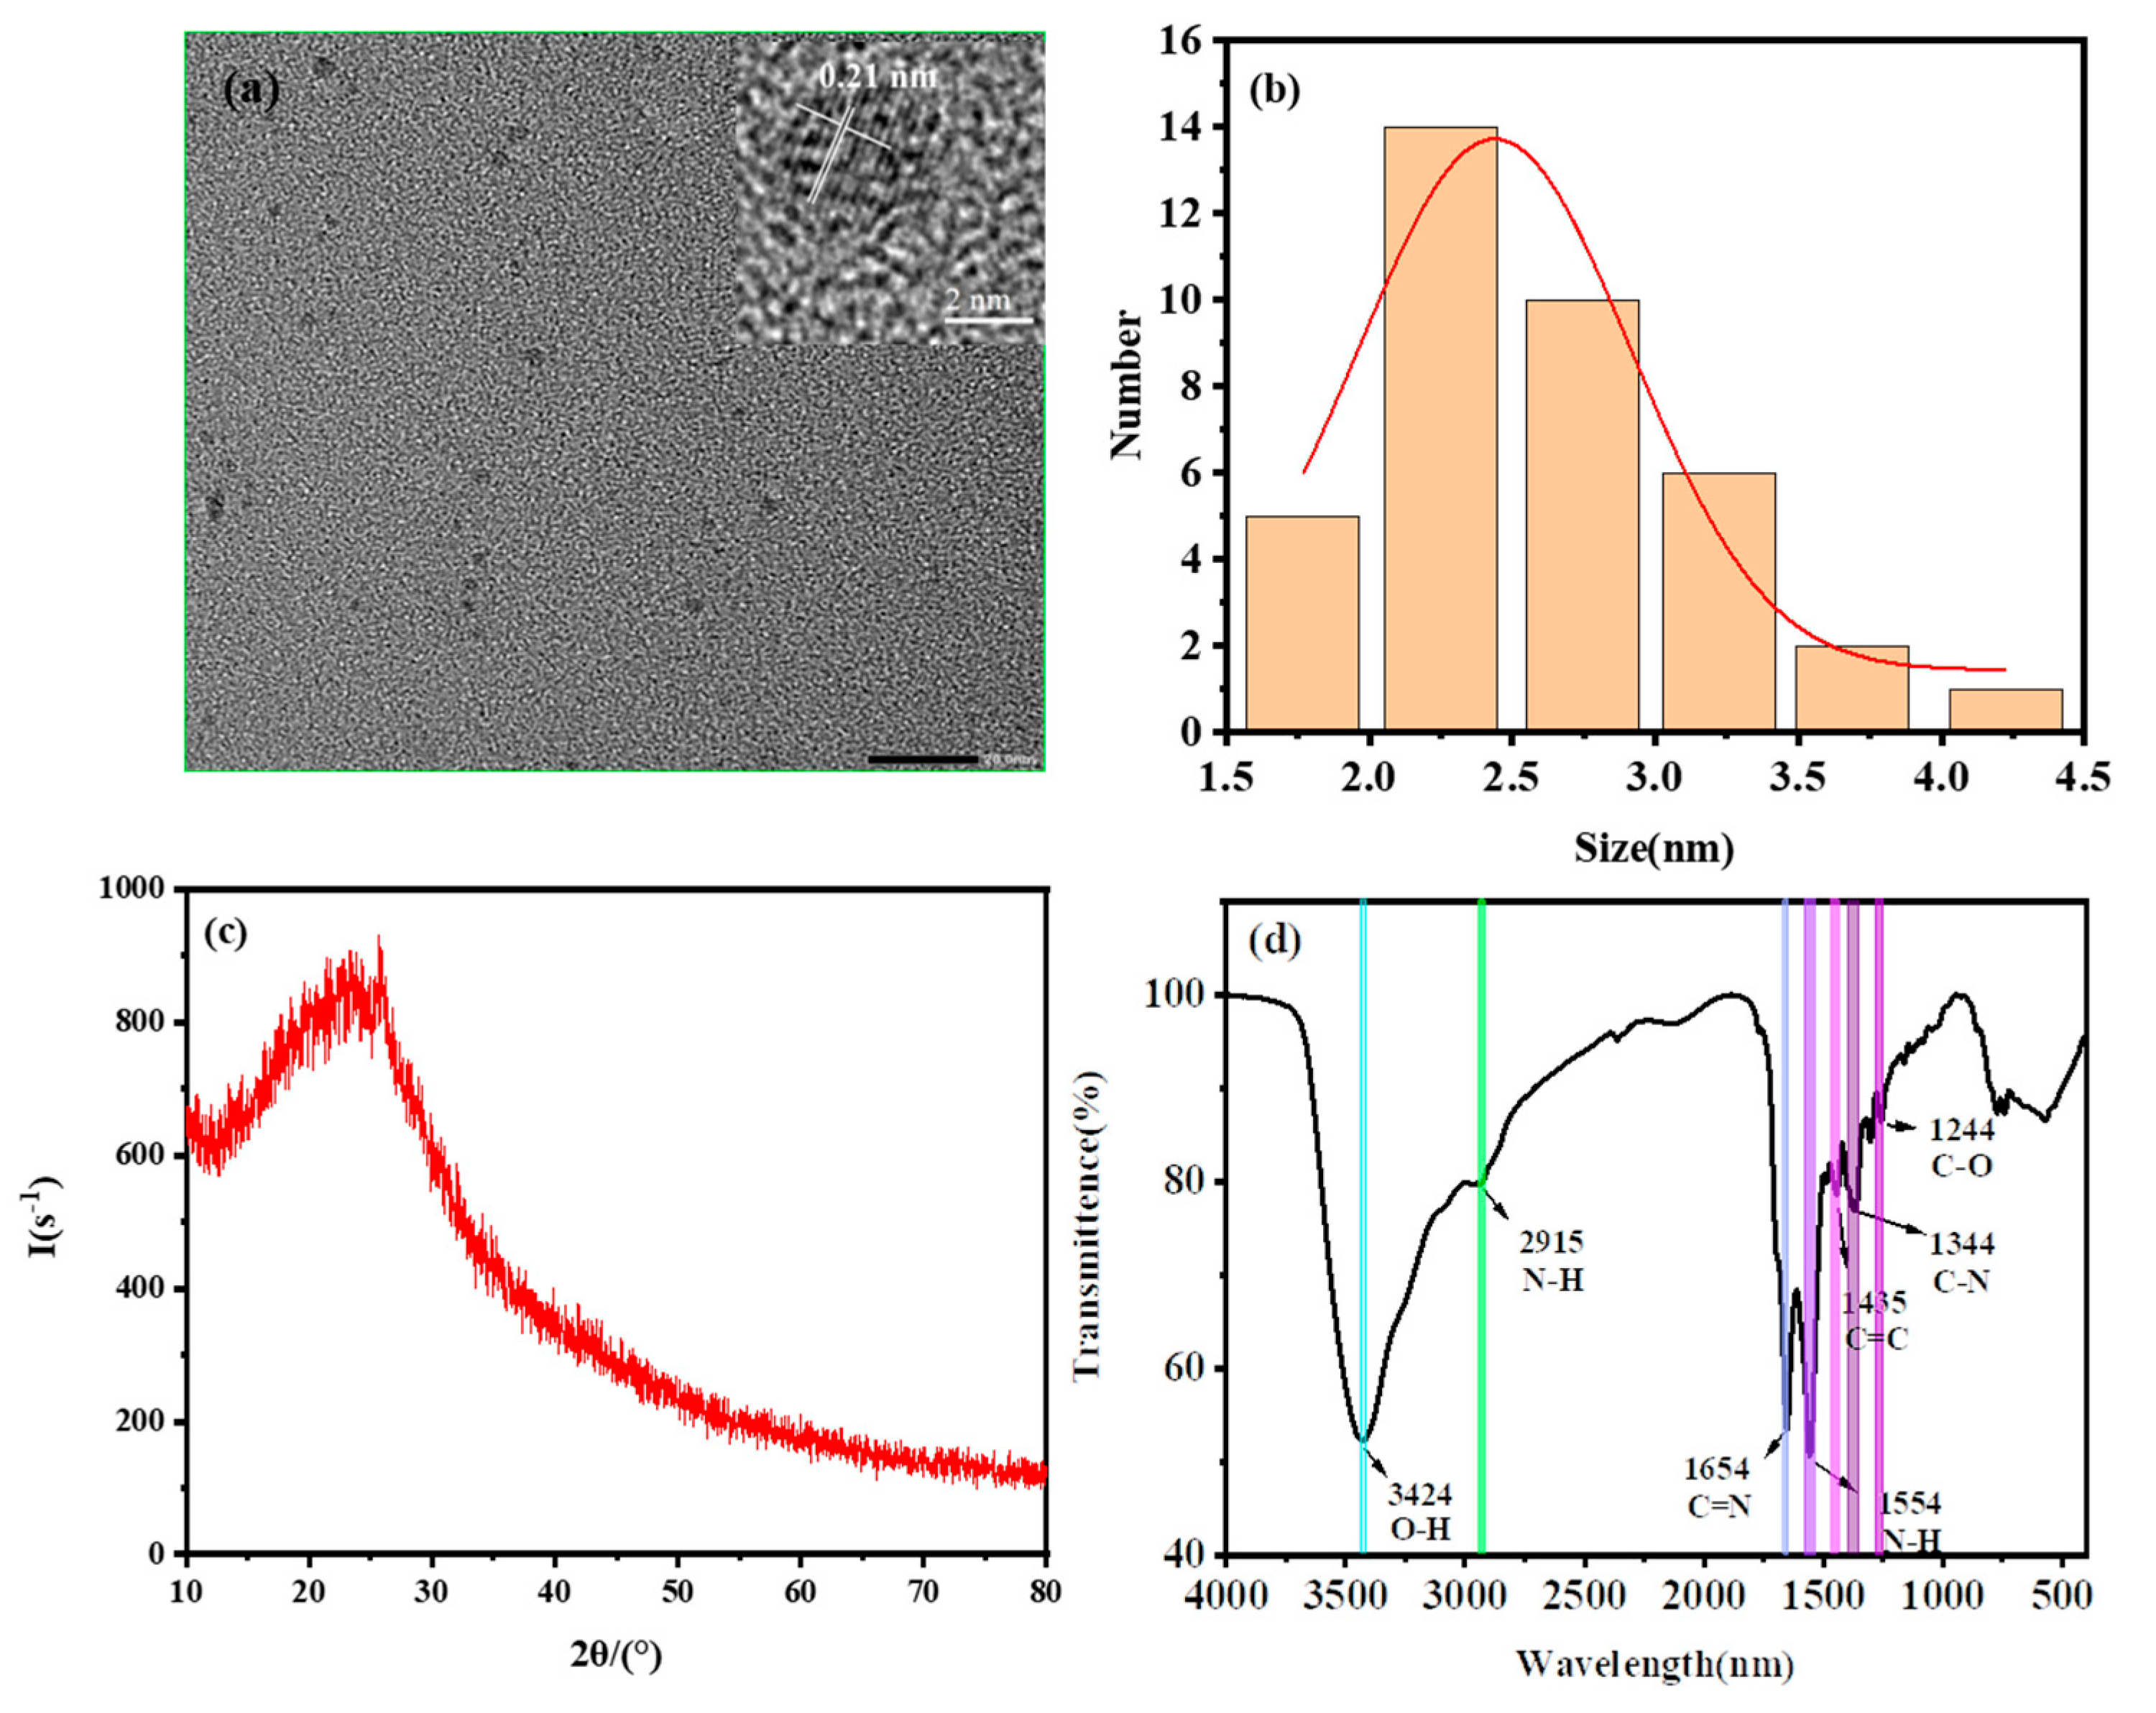
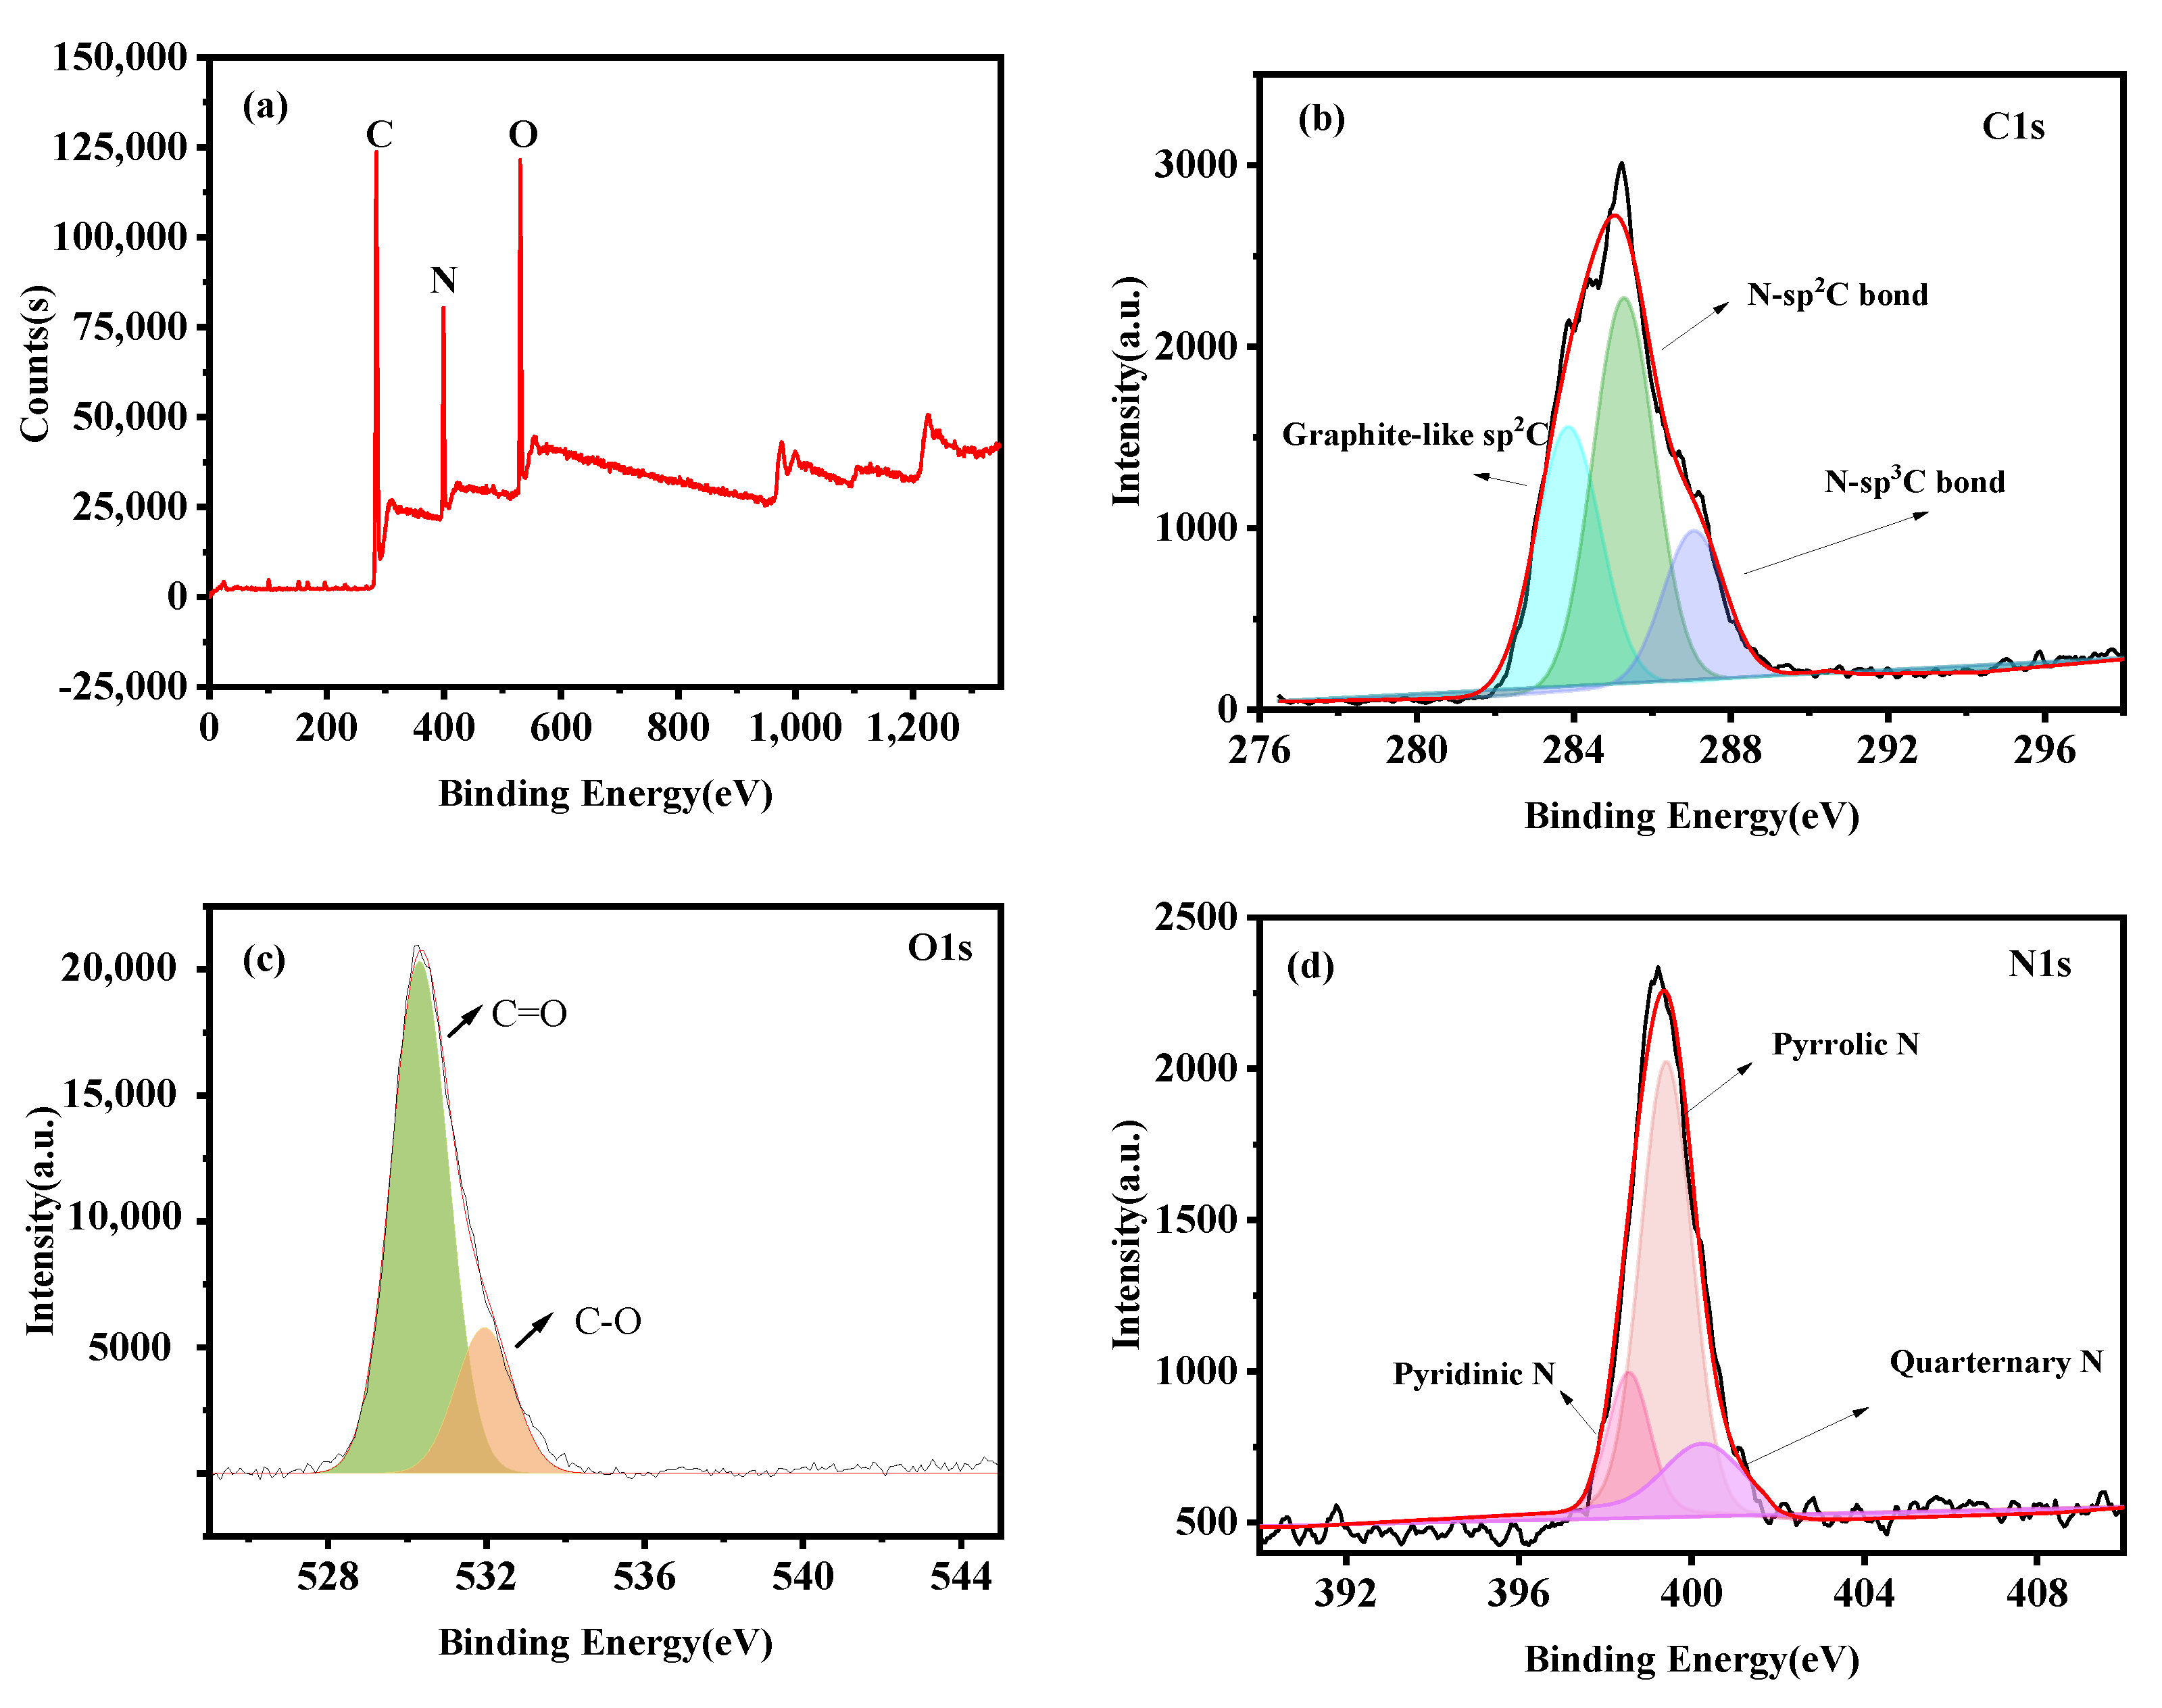
3.3. Morphological and Surface Properties of DN-CDs

The morphological and surface properties of the DN-CDs were investigated by TEM, FT-IR, XRD and XPS; the results are shown in Figure 3 and Figure 4. DN-CDs were nearly spherical with a size distribution between 1.5 and 4.5 nm and the average particle size was about 2.4 nm (Figure 3a,b). Furthermore, the dynamic light scattering (DLS) results in Figure S3 showed that the dynamic diameter of the DN-CDs was about 2.7 nm, which was basically consistent with the TEM. Additionally, we also tested the DLS of DN-CDs in strong acidic and alkaline environments, and found that there was a slight aggregation phenomenon with strong acids, with average size of 3.7 nm. This was also consistent with the fluorescence and Zeta potential changes under strong acidic conditions in Section 3.2. Meanwhile, we found that the crystalline lattice fringe had a space of 0.21 nm, which corresponded to the (100) lattice of graphene in the inset in Figure 3a. Through the Zeta potential of the DN-CDs, it was suggested that the DN-CDs had a negative charge (Figure S3). This was attributed to the partial ionization of the hydroxyl or carboxyl groups in the DN-CDs, which caused the formation of oxygen negative ions. Figure 3c shows the XRD pattern of the DN-CDs with broad peaks at 2θ = 23.9°, indicating that the carbon atom in DN-CDs was amorphous. Additionally, this also could be verified in the Raman spectrum of N-CDs in Figure S4. This demonstrated that the fluorescence properties of DN-CDs were mainly determined by the surface groups of the carbon dots.
FT-IR spectra were obtained to detect the functional groups of the DN-CDs. As shown in Figure 3d, the DN-CDs exhibited absorption peaks at 3423 cm−1 and 2915 cm−1, consistent with -OH and N-H stretch vibrations, showing that the DN-CDs had good water-solubility and contained amino groups on their surfaces. Compared with the FT-IR spectra of DETA, the absorption peak of N-H decreased, indicating that the amine group of DETA and the carboxyl group of citric acid had undergone a dehydration reaction. In addition, the absorption peaks at 1244 cm−1 and 1344 cm−1 represented the stretch vibrations of C-O and amide C-N, respectively. The absorption peaks at 1654 cm−1 and 1554 cm−1 were related to the typical stretch vibrations of C=N and N-H. The absorption peak of 1435 cm−1 was the typical stretch vibration of C=C due to the establishment of an unsaturated aromatic ring structure during the hydrothermal treatment. Moreover, it was confirmed by FT-IR spectra that some of the carbonyl groups of citric acid were converted into amide groups in the hydrothermal process. These functional groups improved the hydrophilicity of the DN-CDs in an aqueous system, suggesting the potential of DN-CDs as sensors for aqueous samples.
The elemental composition of the DN-CDs was examined through XPS (Figure 4). As shown in Figure 4a, according to the XPS full-scan profile of the DN-CDs, C, N and O exhibited distinct peaks in the spectra at 284.71 eV, 399.83 eV and 530.95 eV corresponding to the binding energies of C1s, N1s and O1s, respectively. Moreover, the contents of C, N, and O elements in the DN-CDs were 38.4%, 44.1%, and 17.5%, respectively, according to the EDS results (Figure S5). Figure 4b shows three peaks at 284.7 eV, 285.9 eV and 287.5 eV related to the binding energies of graphite-like Csp2, N-Csp2 and N-Csp3 bonds, respectively. The O1s spectra showed two peaks at 530.38 eV and 532.02 eV, attributed to the binding energy of C=O and C-O, respectively (Figure 4c). Additionally, the N1s spectra showed that it could be deconvoluted into three peaks at 398.8 eV, 400.5 eV and 401.2 eV which were consistent with the binding energies of pyridinic N, pyrrolic N and quarternary N, respectively (Figure 4d). The large amount of pyrrolic N indicated that most of the N atoms existed in a π conjugated system. In summary, we confirmed that the N elements were successfully doped onto the structure of the carbon dots.

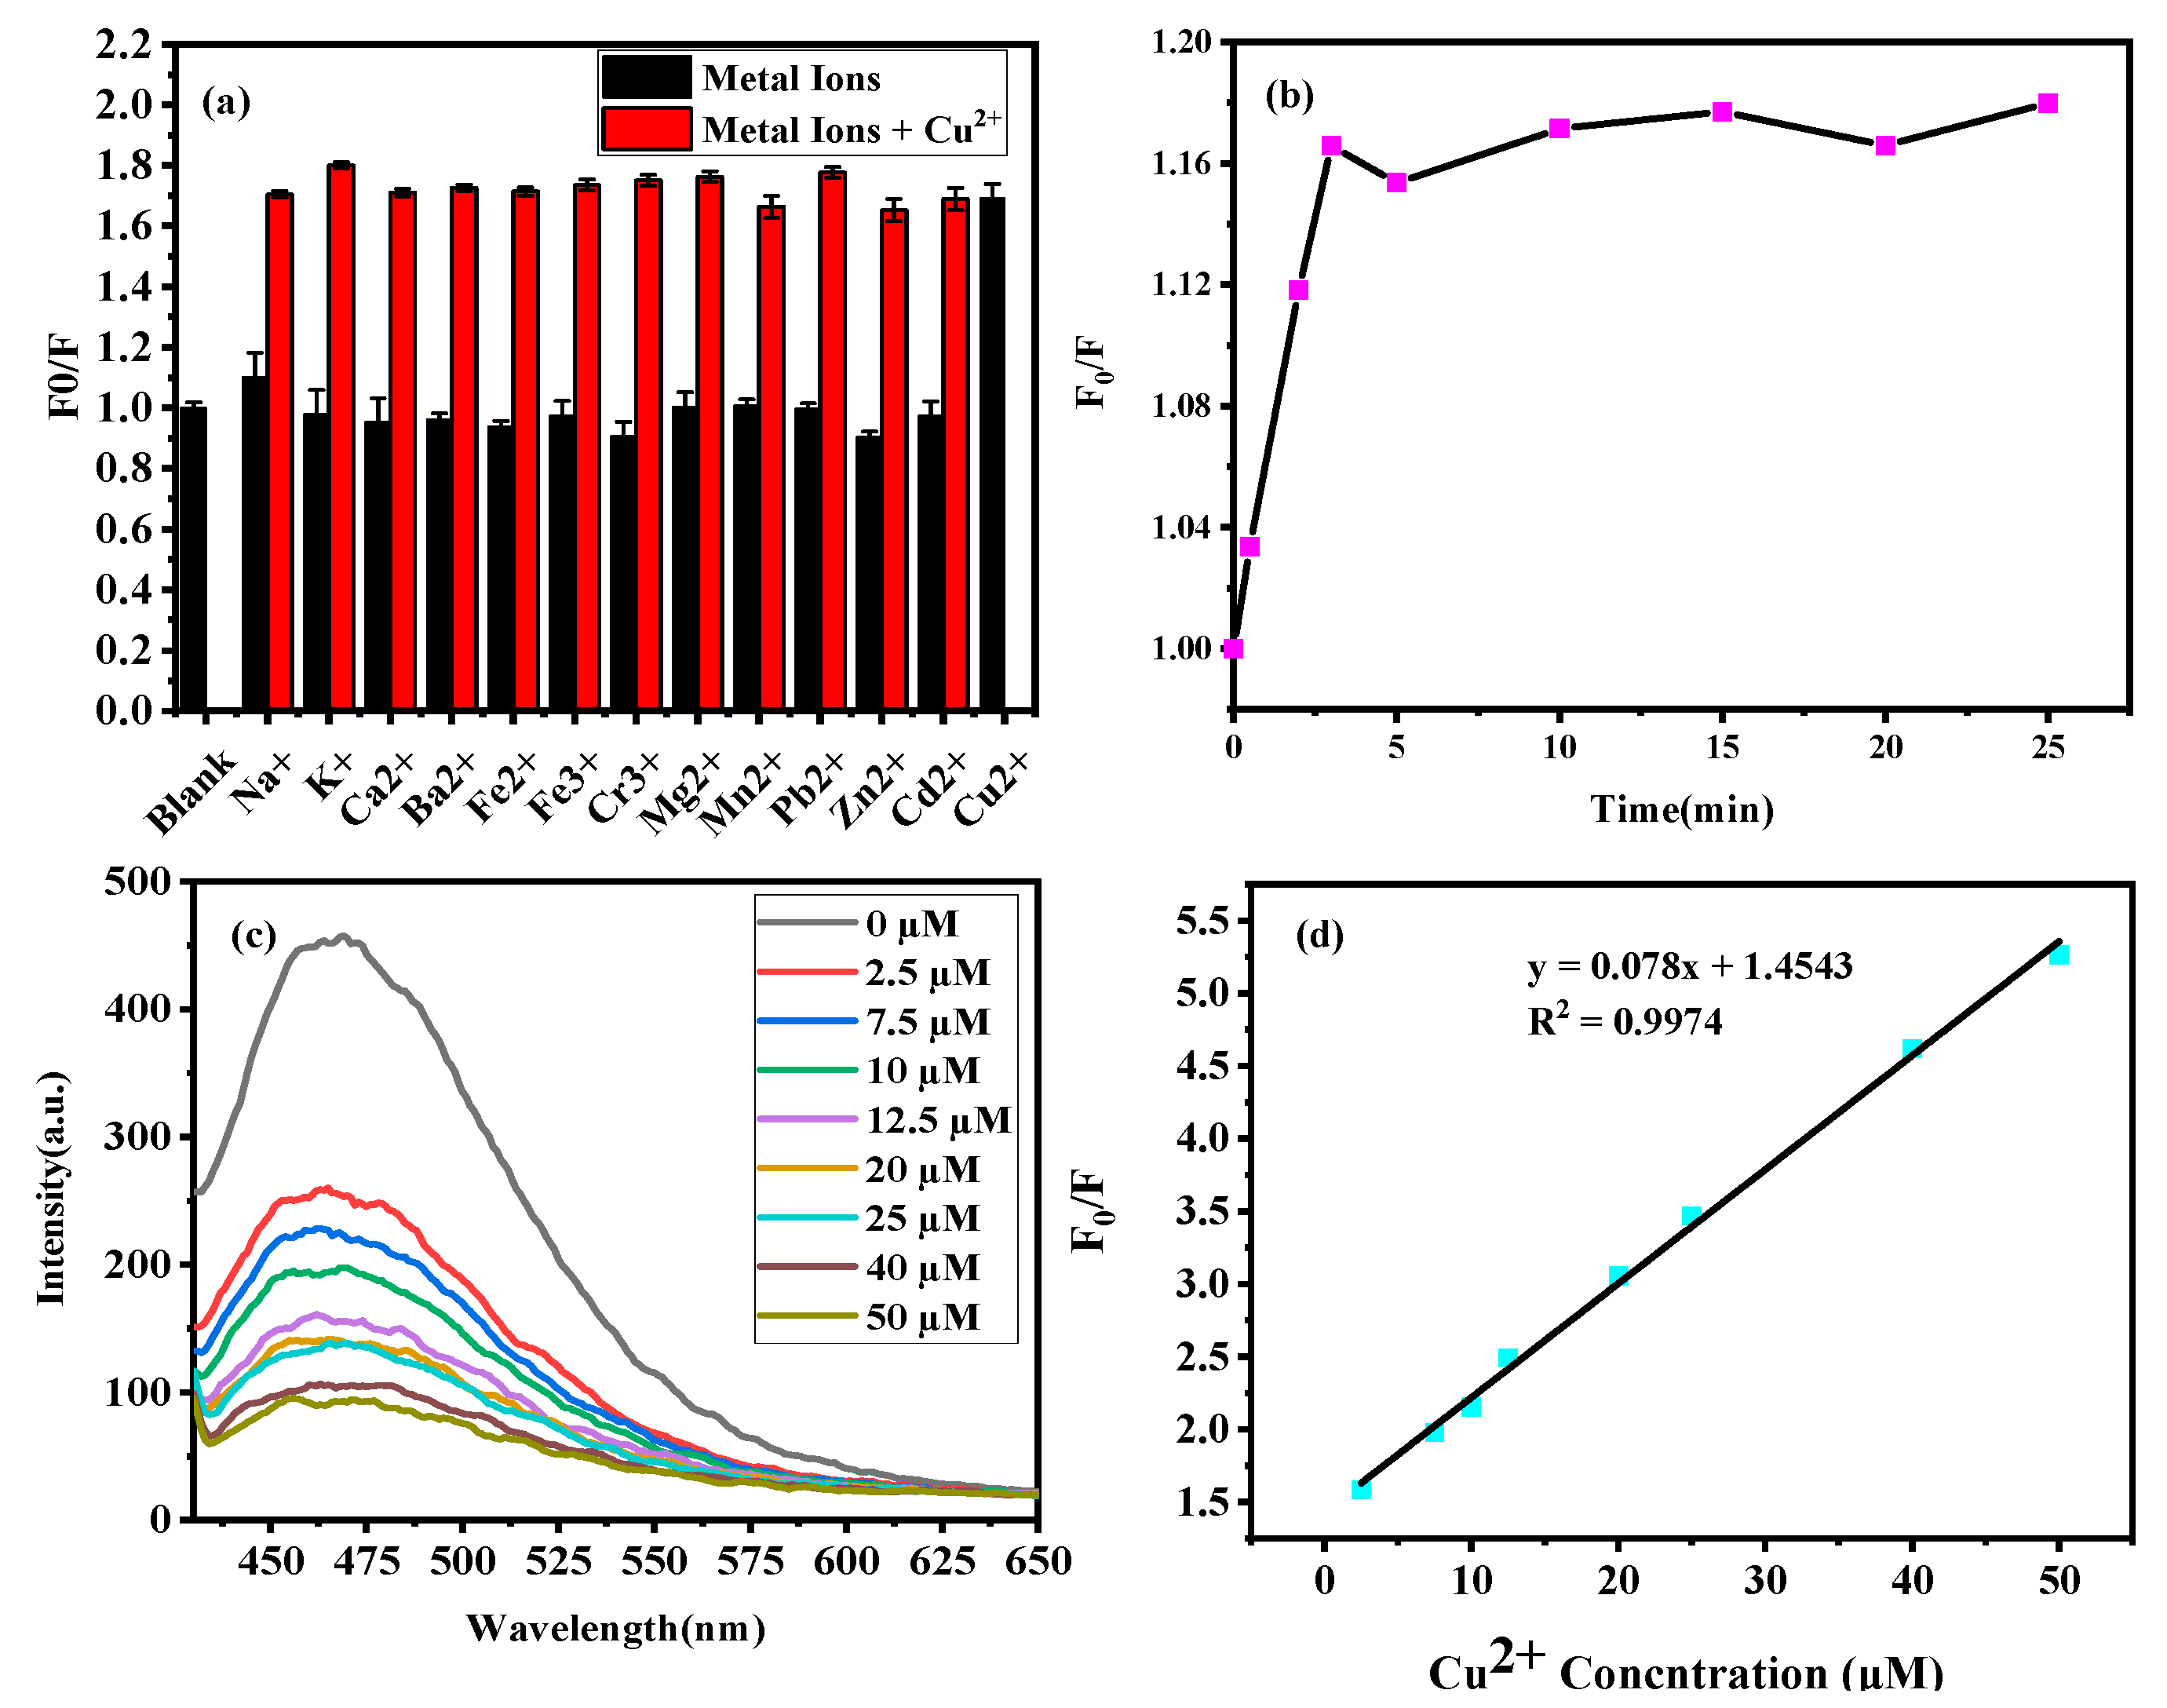
3.4. DN-CDs as a Photoluminescent Probe for Cu2+ Ions

To investigate the potential use of the DN-CDs as a PL probe, we examined the effects of different metal ions on PL intensity (Figure 5). It could be seen from Figure 5a that at the same concentration, Na+, K+, Ca2+, Fe2+, Fe3+, Cr3+, Mg2+, Mn2+, Pb2+, Zn2+ and Cd2+ ions basically did not change the PL intensity of the carbon dots; with the same concentration of Cu2+, the PL intensity was 60% of that of the control, showing an obvious fluorescence quenching phenomenon. In addition, the interference of other metal ions on the detection of Cu2+ was examined by adding the mixed solution of various metal ions and Cu2+ into the DN-CDs solution. Meanwhile, the effect of the addition of other metal ions on the detection of Cu2+ ions could be nearly ignored, which indicated that DN-CDs had excellent selective quenching for Cu2+. Moreover, we also explored the quenching kinetics of the DN-CDs by monitoring the PL intensity as a function of time. Figure 5b showed that the PL intensity of the DN-CD solution gradually weakened and finally stabilized with increasing Cu2+ ions concentration. This result indicated that the detection of Cu2+ ions in the DN-CD system was a rapid and effective process and the equilibrium was reached within 3 min. Thus, 3 min was chosen as the detection time in the following experiments.
To investigate the sensitivity of the DN-CDs for detecting Cu2+, the PL spectra of the DN-CDs were examined by adding Cu2+ solution at various concentrations (2.5–50 µM). Obviously, in Figure 5c, the intensity of PL quenching increased when the concentration of Cu2+ increased; therefore, the decrease in PL intensity was caused by the Cu2+ ions instead of the associated anions and was quantitatively related to the Cu2+ concentration. This indicated that the DN-CDs were capable of quantitatively detecting Cu2+ at low levels with high sensitively. Additionally, the PL quenching spectra of Cu2+ was analyzed by the Stern–Volmer (Equation (3)):
F 0 F = K s v Q + 1
where ‘F0 and ‘F’ are the PL intensities of the DN-CDs in the absence and presence of Cu2+, respectively, ‘Q’ is the concentration of Cu2+ and ‘Ksv’ is the Stern–Volmer quenching constant. This equation could represent the relationship between the relative PL intensity (F0/F) and Cu2+ concentration (Q).
According to Equation (3), we observed strong linearity with a correlation coefficient (R2) of 0.9974 when the concentration of Cu2+ changed from 2.5 to 50 µM. The linear relationship curve is shown in Figure 5d. Based on Equation LOD = 3·σ/S (where ‘σ’ is the standard deviation of the blank PL intensity of DN-CDs and ‘S’ is the slope of the linear relationship curve), the limit of detection (LOD) of Cu2+, was calculated to be 42 nM. Compared with the threshold of the United States Environmental Protection Agency (USEPA) guidelines, the LOD of the DN-CDs for Cu2+ in an aqueous system was much lower. We summarized the PL sensing performances of the other reported sensors for detecting Cu2+ in Table 1; it was clear that the LOD of our product was also lower than those of the other sensors.

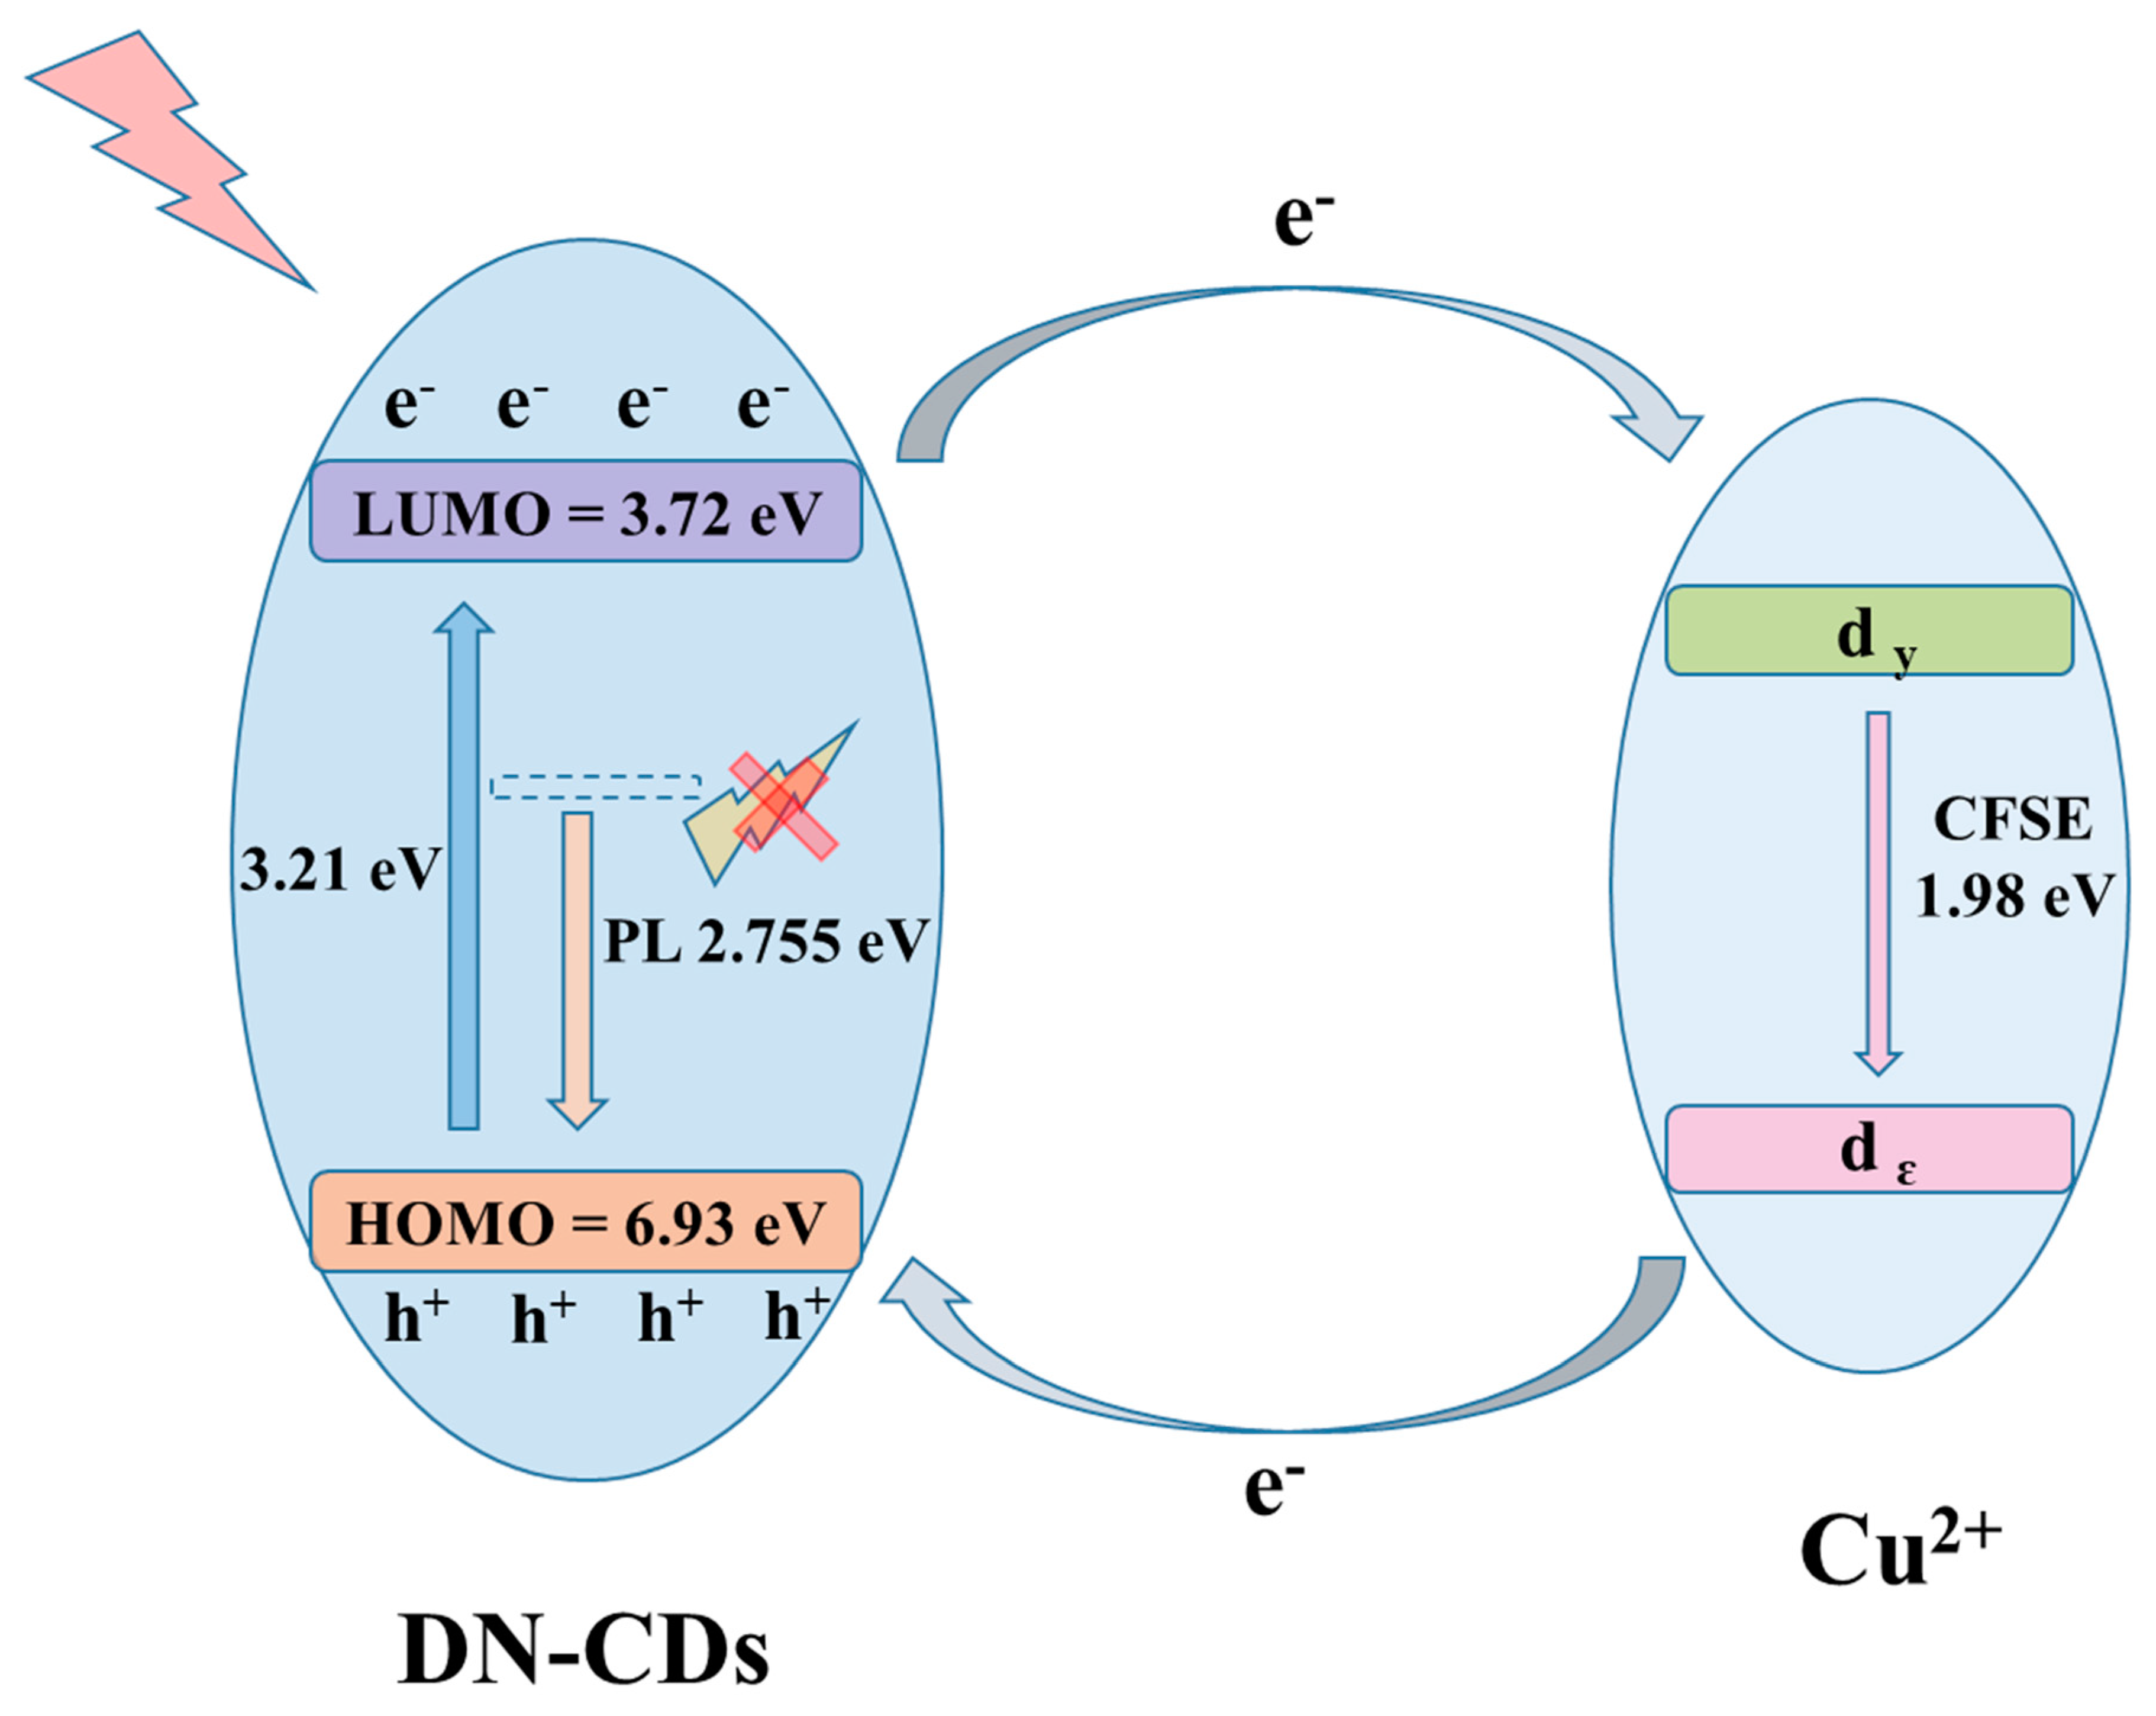
3.5. Mechanism of DN-CD Interaction with Cu2+

3.5.1. Exploration of Quenching Mechanism

Carbon dots have already been used in the field of PL sensors and the PL quenching mechanisms of carbon dots had been discussed in other articles. The quenching mechanisms can be roughly divided into two types, which included static quenching and dynamic quenching. There were also other mechanisms, such as Förster resonance energy transfer (FRET), photo-induced electron transfer (PET) and inner filter effect (IFE). Static quenching would occur through the interaction between the carbon dots and metal ions, forming a non-fluorescent ground-state complex. The existence of the non-fluorescent complex could be verified by UV-Vis spectra. If there was complexation between the functional groups in the carbon dots and metal ions, the absorption peaks on the spectra would have a corresponding blue shift or red shift or even produce an obvious new absorption peak due to a new chemical bond. Dynamic quenching would be caused by the collision of carbon dots through the mechanisms of charge transfer or energy transfer, so that the excited state of the carbon dots would return to its ground state. In contrast to static quenching, dynamic quenching would only affect the excited state of the carbon dots, so there would be no change in the UV-Vis spectra. However, a significant change in the lifetime of fluorescence would be detected. FRET would occur when the emission spectra of the carbon dots overlapped with the absorption spectra of the metal ions due to long range dipole–dipole interactions between the excited state of carbon dots and the ground state of metal ions. Additionally, if a FRET mechanism existed, it could change the lifetime of fluorescence. PET could be defined that the electron transfer would occur between carbon dots (as electron donor or electron receptor) and metal ions (as electron donor or electron receptor), if there is an energy gap between the lowest unoccupied molecular orbitals (LUMO) and the highest occupied molecular orbitals (HOMO) between the carbon dots and metal ions. Additionally, IFE would result from an overlap of the absorption spectra of the metal ions with the excitation or emission spectra of the carbon dots. This could cause energy transfer between the carbon dots and metal ions. Therefore, in this part, we explored the quenching mechanisms of our DN-CDs in detecting Cu2+ as static quenching, FRET, PET or IFE by UV-vis spectra.
As shown in Figure 6a, the absorption peak of the DN-CD solution did not change after adding the Cu2+ solution compared with the absorption peak without the Cu2+ solution, proving that there was no static quenching behavior in our DN-CD PL sensor system.
To explore other possible quenching mechanisms, we compared the PL spectra of DN-CDs with the absorption spectra of the Cu2+ aqueous solution (Figure 6b). This indicated that the significant fluorescence emission peak of DN-CDs at 450 nm basically did not overlap with the absorption peak of Cu2+. This concluded that there was no FRET quenching mechanism between the DN-CDs and Cu2+. At the same time, as shown in Figure 6c, there was no obvious overlap between the absorption spectra and fluorescence emission spectra of DN-CDs. Additionally, we used the up-conversion PL as the excitation wavelength, which was far from the absorption wavelength of Cu2+ (Figure S6). This could eliminate the IFE effect of the PL quenching progress, which might reduce the number of photons available for the DN-CDs [62].
The fluorescence lifetime decay of DN-CDs in the absence and presence of Cu2+ were measured at λex = 820 nm and λem = 450 nm (Figure 6d). After adding a certain amount of Cu2+ solution, the fluorescence lifetime of the DN-CD solution decreased from 10.69 ns to 5.14 ns. This suggested that dynamic quenching occurred in the sensor system. Additionally, we proposed a non-radiative electron-transfer mechanism (PET). We calculated the highest occupied molecular orbital (HOMO) and lowest unoccupied molecular (LUMO) energy levels of the DN-CDs according to the following Equation (4) [63]:
E L U M O = e ( E R e d + 4.4 ) E H O M O = e ( E O x + 4.4 ) E H O M O = E L U M O E g
where ‘EOx’ and ‘ERed’ are the onset of oxidation and reduction potential of DN-CDs, respectively, and ‘Eg’ is the optical energy gap resulting from the UV-Vis adsorption. Additionally, the ‘ERed’ was −0.69 eV according to the CV plot (Figure S7). The ‘ELUMO’ was calculated to be −3.71 eV and ‘EHOMO’ was calculated to be −6.92 eV. Obviously, the band gap could overlap the crystal field stabilization energy of Cu2+ (1.98 eV) [64]. As illustrated in Figure 7, the excited electrons of the DN-CDs were prone to transfer to the d orbital of Cu2+ [65]. Thus, the fluorescence was suppressed and became a partially non-radiative progress.

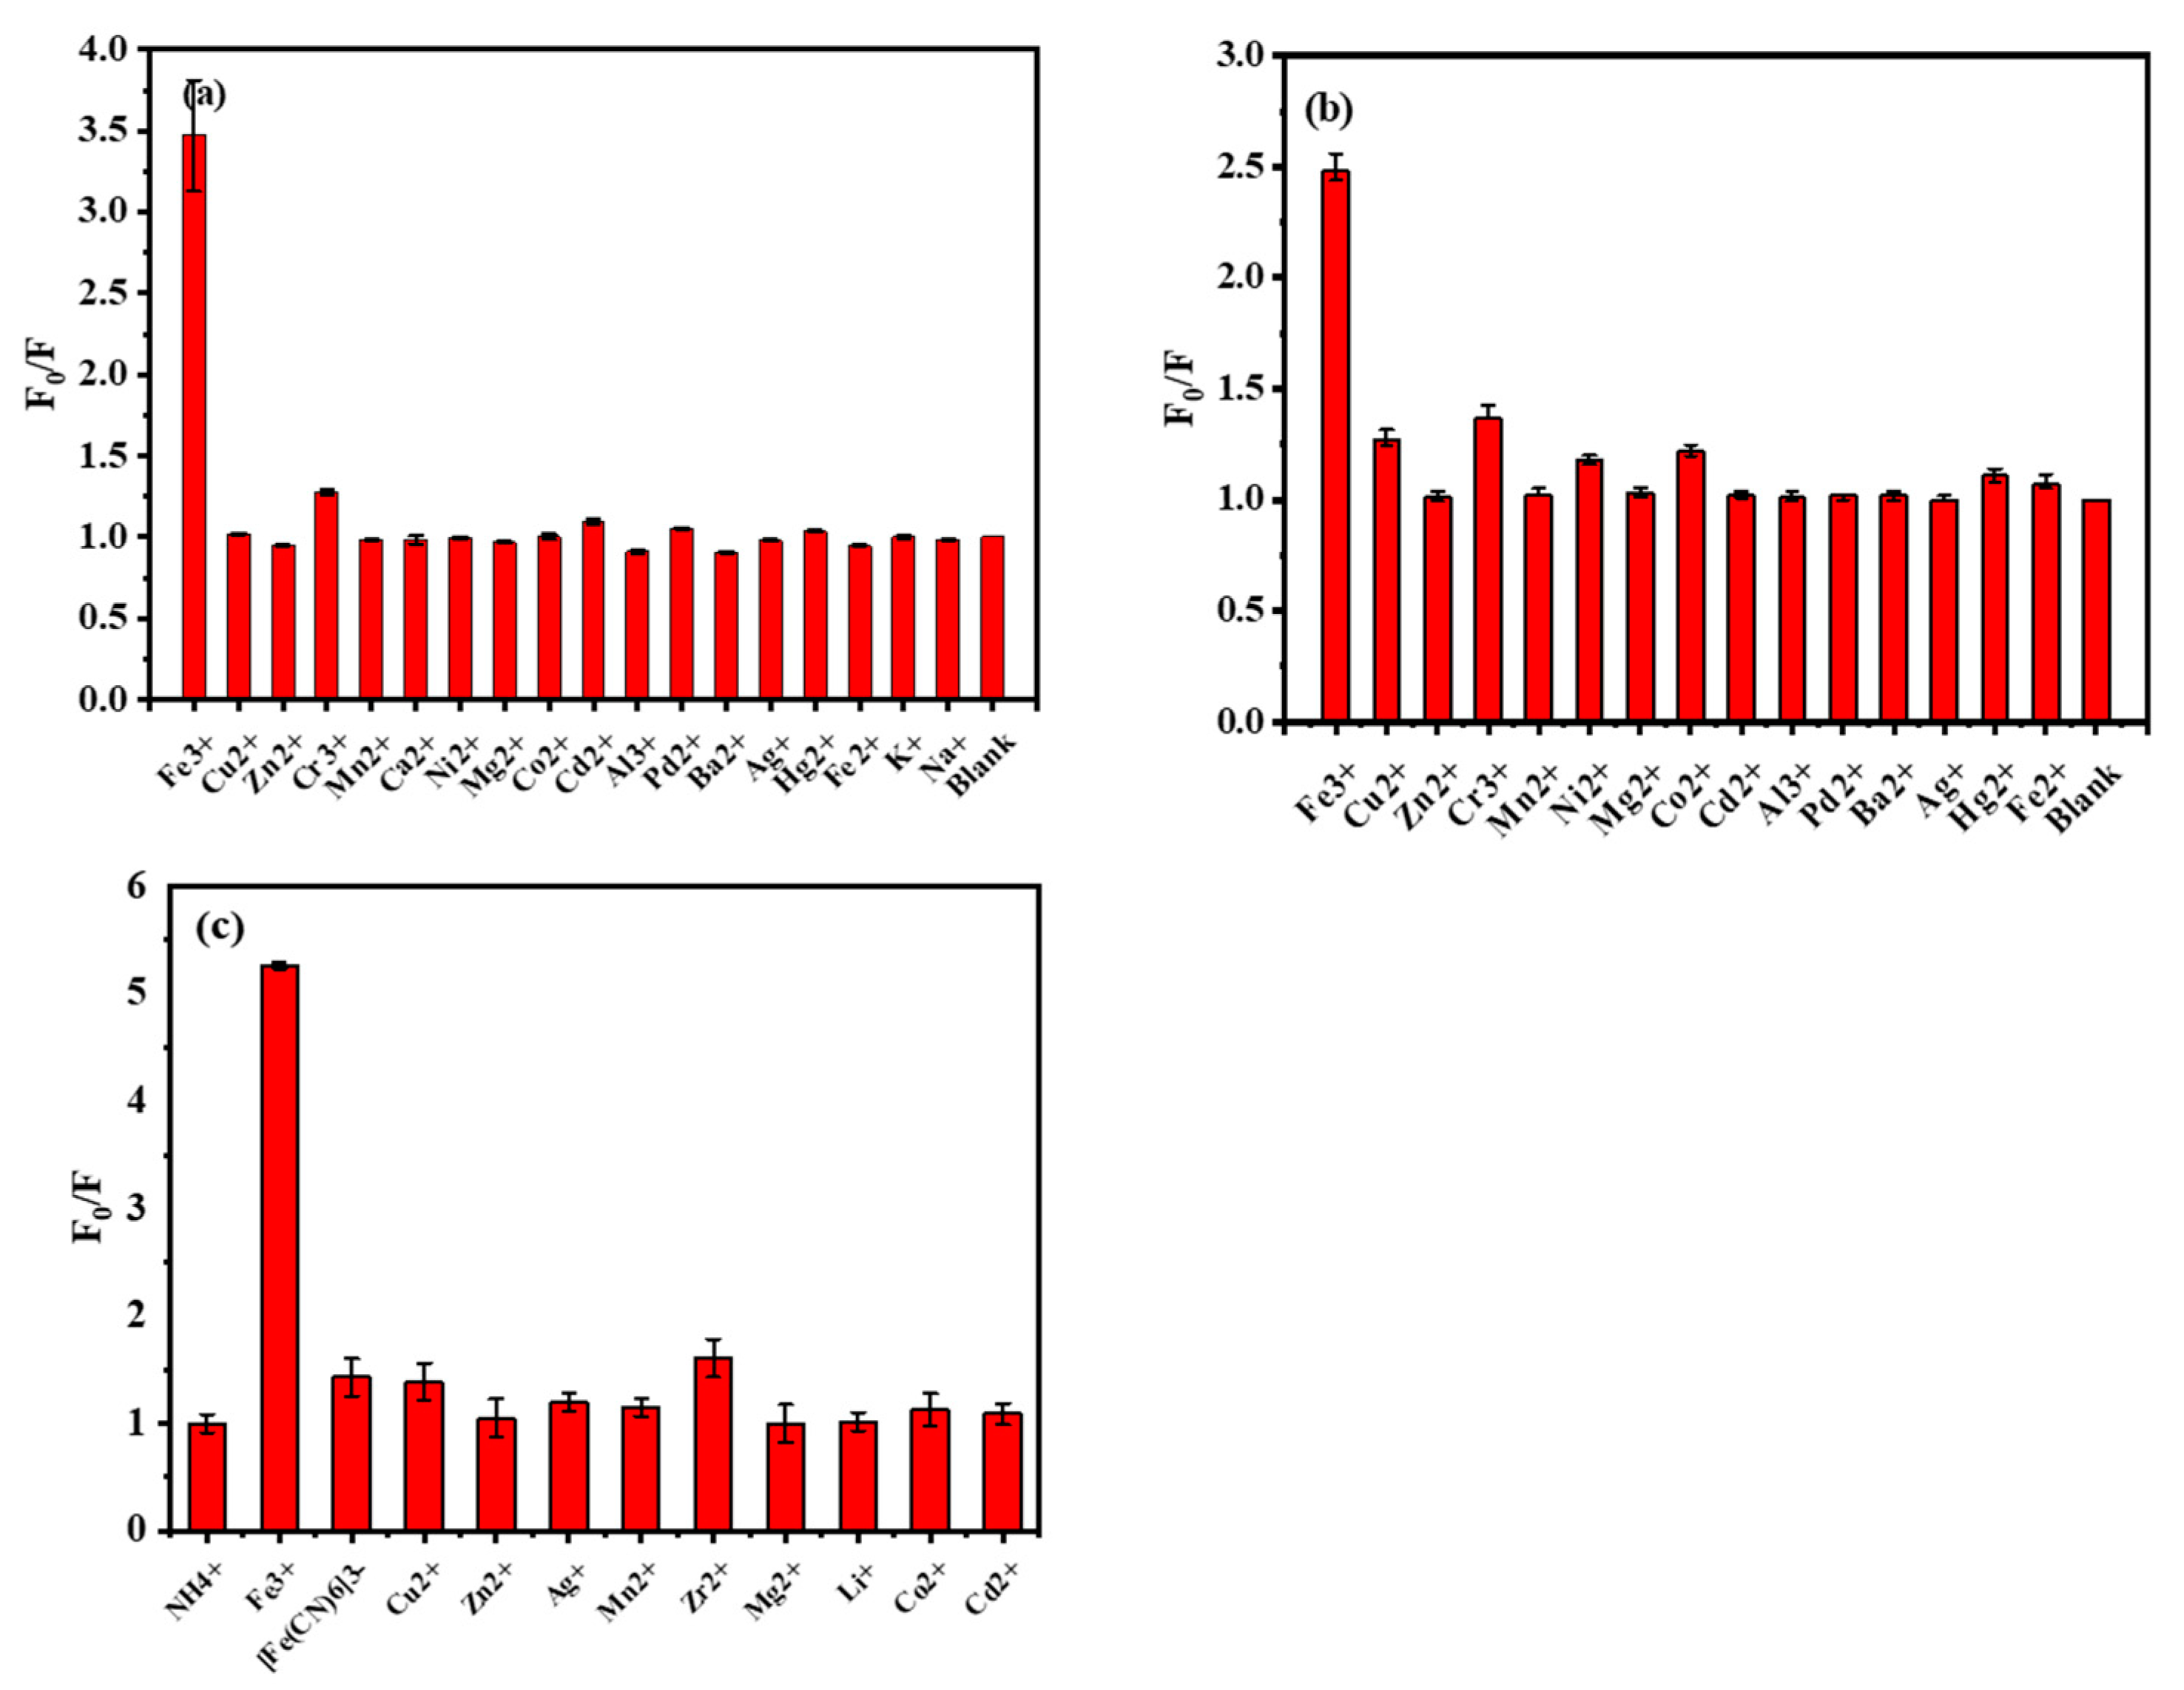
3.5.2. Discussion on the Selectivity of Cu2+ and Fe3+ Ions

We synthesized two other N-doped carbon dots in our laboratory named N-CDs-1 and N-CDs-2 and we found that they were capable of detecting Fe3+ ions. The PL spectra and FT-IR spectra demonstrated that we had successfully synthesized the previously reported carbon dots (Figure S8). The specific and detailed steps of detection of metal ions by these two carbon dots are displayed in the supporting information.
The results of testing the selectivity of N-CDs-1 and N-CDs-2 to metal ions are shown in Figure 8. As seen in Figure 8a, under the same conditions, obvious fluorescence quenching occurred after adding the Fe3+ solution to the carbon dot solutions. In contrast, other metal ions had little influence on the PL intensity of N-CDs-1. N-CDs-1 also had an up-conversion PL, so its UCPL sensing system was investigated. The result was consistent with the above one showing that N-CDs-1 with up-conversion PL was also selective for Fe3+ ions. Similarly, N-CDs-2 showed selectivity for the detection of Fe3+ as shown in Figure 8c. The addition of Fe3+ ions caused a strong quenching of the PL intensity, with a quenching degree of more than 80%. Instead, the highest quenching effect of the other ions was only 40% (CrCl3), which might be due to the larger band gap of the carbon dots, which could overlap with the crystal field energy of Cr3+ and produce PET behaviors. In summary, N-CDs-1 and N-CDs-2 could detect Fe3+ ions with a good linear relationship in the 1–1000 µM and 20–100 µM ranges and the LODs were 100 nM and 3.93 µM, respectively (Figure S9).
We were interested in the similarities and differences between the three N-doped carbon dots which could detect Cu2+ and Fe3+ ions. Through the comparison of the differences between DN-CDs, N-CDs-1 and N-CDs-2, the ratio of N and O atoms were found to be a potential reason for the ability to detecting Cu2+ and Fe3+ ions. Table S1 summarized the detection parameters for the selective detection of metal ions (Cu2+ and Fe3+) with the different N-doped carbon dots [66,67,68,69,70,71,72,73,74,75,76,77,78,79]. It could be found that although N-doped carbon dots contained different electron-rich functional groups, we suggest that the proportion of the N, O atoms might affect the selectivity towards Cu2+ and Fe3+ ions. The carbon dots with relatively rich N-based groups and more N atoms were more likely to selectively detect Cu2+ ions. More simply, the selective detection of Cu2+ and Fe3+ ions by carbon dots could be adjusted or converted by altering the ratio of N and O atoms. Moreover, the ratio of N/O of DN-CDs, N-CDs-1 and N-CDs-2 were 14.8:15.6, 21.7:12.8 and 27.1:5.2, which are consistent with our conclusion.
Hence, we preliminarily concluded that the selective detection of Cu2+ or Fe3+ ions by N-doped carbon dots could be estimated according to the ratio of N/O: when the ratio of N/O is about 1:1 or higher, the N-doped carbon dots tend to selectively detect Cu2+ ions; when the N/O ratio is about 1:2 or smaller, the N-doped carbon dots prefer to selectively detect Fe3+ ions. The Hard-Soft-Acid-Base theory could explain the difference: ‘acids’ and ‘bases’ can be classified as ‘hard’ or ‘soft’. ‘Hard’ refers to particles with a higher charge density and smaller radius, while ‘soft’ refers to particles with a lower charge density and larger radius. The interactions between a soft acid and soft base are more stable, while the interactions between a hard acid and hard base are more stable. Thus, Cu2+ ions are a borderline acid and can more easily interact with N atoms with a lower electronegativity and bigger radius; Fe3+ ions are similar to hard acids, so they are more likely to interact with O atoms with a higher electronegativity and smaller radius. Of course, the quenching mechanisms of carbon dots are complex and other situations would also exist, which require more detailed analysis methods.

3.6. Detection of Cu2+ Ions in Real Samples

To prove the practical application of the synthesized DN-CDs, we investigated the ability of the DN-CDs to detect Cu2+ ions in water samples as shown in Table S2. The relative standard deviations (RSDs) of Cu2+ ion detection in the three samples were less than 8% and the recovery rates were in the range of 95.4–105.9%. This verified that the DN-CDs have great potential in Cu2+ ion detection.

4. Conclusions

In conclusion, N-doped carbon dots with down-conversion and up-conversion fluorescence were synthesized by a simple one-step hydrothermal method. The prepared carbon dots, DN-CDs, had excellent fluorescence properties, good stability and a high quantum yield QY of 63.87%. They showed a significant fluorescence intensity at 410 nm, and also had up-conversion fluorescence at 820 nm. Additionally, the abundant N, O-based functional groups endowed the DN-CDs with excellent water solubility and excellent sensitivity and selectivity for Cu2+ ion detection with a rapid reaction time of 3 min. Therefore, it had better practicality. We also synthesized other N-doped carbon dots with different carbon sources and nitrogen sources to study their ability to detect metal ions. They had the ability to detect Fe3+ ions with a detection limit (LOD) of 100 nM and 3.39 µm. Additionally, although the principle of selective metal ion detection is very complex, by comparing the results in this paper and published reports, a method of synthesizing N-doped carbon dots to detect Cu2+ or Fe3+ ions exclusively through adjusting the ratio of N and O atoms was proposed: (1) when the ratio of N/O was about 1:1 or higher, the N-doped carbon dots tended to selectively detect Cu2+ ions; (2) when the N/O ratio was about 1:2 or smaller, the N-doped carbon dots preferred to selectively detect Fe3+ ions. This provided a possible direction for the design and synthesis of N-doped carbon dots with the ability to detect Cu2+ or Fe3+ ions in the future.

Supplementary Materials

The following supporting information can be downloaded at: https://www.mdpi.com/article/10.3390/cryst13050812/s1, Figure S1: The trends of the quantum yield fluorescence of N-doped carbon dots at different ratio of carbon source and nitrogen source (a), reaction temperature (b), reaction time (c); Figure S2: The Zeta potential of DN-CDs under different pH; Figure S3: The DLS of DN-CDs in aqueous solution at (a) pH = 1, (b) pH = 7 and (c) pH = 13; Figure S4: The Raman spectrum of DN-CDs; Figure S5: The EDS of DN-CDs; Figure S6: The up-conversion PL spectra of DN-CDs. (The emission spectrum at maximum excitation wavelength at 820 nm and the excitation spectrum at the maximum emission wavelength of 450 nm); Figure S7: The CV plot of DN-CDs; Figure S8: (a-c) The fluorescence emission spectra at λex = 450 nm and λex = 600 nm and FT-IR spectra of N-CDs-1; (d-e) The fluorescence emission spectra at λex = 380 nm and FT-IR spectra of N-CDs-2; Figure S9: The PL quenching efficiency of (a) N-CDs-2 at λex = 380 nm and (c) N-CDs-1 at λex = 410 nm and (e) at λex = 808 nm at different concentration of Fe3+ ions and the linear relationship between PL intensity and Fe3+ ions (‘F0’ is PL intensity in the absence of Fe3+ ions and ‘F’ is in the presence of Fe3+ ions) of (b) N-CDs-2 at λex = 380 nm, (d) N-CDs-1 at λex = 410 nm and (f) at λex = 808 nm; Table S1: The detection parameters for selective detection of metal ions (Cu2+ and Fe3+) with different N-doped carbon dots; Table S2: The detection of Cu2+ in real samples.

Author Contributions

Conceptualization, Y.X. and Q.Z.; validation, J.H.; investigation, H.M., P.L. and W.Z.; data curation, M.C., Z.M. and Y.D.; writing—original draft preparation, Y.X.; writing—review and editing, Q.Z.; funding acquisition, Q.Z. All authors have read and agreed to the published version of the manuscript.

Funding

This research was funded by an Industry-university-research cooperation of Sichuan University (No. 19H0340).

Data Availability Statement

The authors confirm that the data supporting the reported results can be found within the article. Other relevant information can be obtained from the author.

Conflicts of Interest

The authors declare that they have no known competing financial interests or personal relationships that could have influenced the work reported in this paper.

References

  1. Zhang, R.; Liu, B.; Ma, J.; Zhu, R. Preparation and characterization of carboxymethyl cellulose/chitosan/alginic acid hydrogels with adjustable pore structure for adsorption of heavy metal ions. Eur. Polym. J. 2022, 179, 111577. [Google Scholar] [CrossRef]
  2. Ansari, S.; Karimi, M. Novel developments and trends of analytical methods for drug analysis in biological and environmental samples by molecularly imprinted polymers. Trends Anal. Chem. 2017, 89, 146–162. [Google Scholar] [CrossRef]
  3. El-Shahawi, M.S.; Hamza, A.; Bashammakh, A.S.; Al-Saggaf, W.T. An overview on the accumulation, distribution, transformations, toxicity and analytical methods for the monitoring of persistent organic pollutants. Talanta 2010, 80, 1587–1597. [Google Scholar] [CrossRef] [PubMed]
  4. Martín-Pozo, L.; de Alarcón-Gómez, B.; Rodríguez-Gómez, R.; García-Córcoles, M.T.; Çipa, M.; Zafra-Gómez, A. Analytical methods for the determination of emerging contaminants in sewage sludge samples. A review. Talanta 2019, 192, 508–533. [Google Scholar] [CrossRef] [PubMed]
  5. Kumbhar, H.S.; Gadilohar, B.L.; Shankarling, G.S. A highly selective quinaldine–indole based spiropyran with intramolecular H-bonding for visual detection of Cu(II) ions. Sens. Actuators B Chem. 2016, 222, 35–42. [Google Scholar] [CrossRef]
  6. Gao, F.; Tu, X.; Yu, Y.; Gao, Y.; Zou, J.; Liu, S.; Qu, F.; Li, M.; Lu, L. Core-shell Cu@C@ZIF-8 composite: A high-performance electrode material for electrochemical sensing of nitrite with high selectivity and sensitivity. Nanotechnology 2022, 33, 225501. [Google Scholar] [CrossRef] [PubMed]
  7. Chen, H.; Yang, T.; Liu, F.; Li, W. Electrodeposition of gold nanoparticles on Cu-based metal-organic framework for the electrochemical detection of nitrite. Sens. Actuators B Chem. 2019, 286, 401–407. [Google Scholar] [CrossRef]
  8. Carolan, D.; Doyle, H. Germanium nanocrystals as luminescent probes for rapid, sensitive and label-free detection of Fe3+ ions. Nanoscale 2015, 7, 5488–5494. [Google Scholar] [CrossRef] [Green Version]
  9. Ferreira, S.L.C.; Bezerra, M.A.; Santos, A.S.; dos Santos, W.N.L.; Novaes, C.G.; de Oliveira, O.M.C.; Oliveira, M.L.; Garcia, R.L. Atomic absorption spectrometry—A multi element technique. Trends Anal. Chem. 2018, 100, 1–6. [Google Scholar] [CrossRef]
  10. Matusch, A.; Depboylu, C.; Palm, C.; Wu, B.; Höglinger, G.U.; Schäfer, M.K.H.; Becker, J.S. Cerebral bioimaging of Cu, Fe, Zn, and Mn in the MPTP mouse model of Parkinson’s disease using laser ablation inductively coupled plasma mass spectrometry (LA-ICP-MS). J. Am. Soc. Mass. Spectrom. 2010, 21, 161–171. [Google Scholar] [CrossRef] [Green Version]
  11. Trung, L.G.; Subedi, S.; Dahal, B.; Truong, P.L.; Gwag, J.S.; Tran, N.T.; Nguyen, M.K. Highly efficient fluorescent probes from chitosan-based amino-functional carbon dots for the selective detection of Cu2+ traces. Mater. Chem. Phys. 2022, 291, 126772. [Google Scholar] [CrossRef]
  12. Xu, H.; Zhou, S.; Xiao, L.; Wang, H.; Li, S.; Yuan, Q. Fabrication of a nitrogen-doped graphene quantum dot from MOF-derived porous carbon and its application for highly selective fluorescence detection of Fe3+. J. Mater. Chem. C 2015, 3, 291–297. [Google Scholar] [CrossRef]
  13. Yang, C.-X.; Ren, H.-B.; Yan, X.-P. Fluorescent Metal–Organic Framework MIL-53(Al) for Highly Selective and Sensitive Detection of Fe3+ in Aqueous Solution. Anal. Chem. 2013, 85, 7441–7446. [Google Scholar] [CrossRef]
  14. Mohandoss, S.; Palanisamy, S.; You, S.; Lee, Y.R. Synthesis of cyclodextrin functionalized photoluminescent metal nanoclusters for chemoselective Fe3+ ion detection in aqueous medium and its applications of paper sensors and cell imaging. J. Mol. Liq. 2022, 356, 118999. [Google Scholar] [CrossRef]
  15. Xin, J.-Y.; Li, Y.; Liu, F.-Y.; Sun, L.-R.; Wang, Y.; Xia, C.-G. Visible and Ultraviolet Dual-Readout Detection of Cu(II) in Preserved Vegetables Based on Self-Assembly and Peroxidase Simulation Properties of Mb-AuNPs. Sci. Adv. Mater. 2022, 14, 1410–1418. [Google Scholar] [CrossRef]
  16. Cetinkaya, Y.; Yurt, M.N.Z.; Avni Oktem, H.; Yilmaz, M.D. A Monostyryl Boradiazaindacene (BODIPY)-based lanthanide-free colorimetric and fluorogenic probe for sequential sensing of copper (II) ions and dipicolinic acid as a biomarker of bacterial endospores. J. Hazard. Mater. 2019, 377, 299–304. [Google Scholar] [CrossRef]
  17. Zhu, S.; Meng, Q.; Wang, L.; Zhang, J.; Song, Y.; Jin, H.; Zhang, K.; Sun, H.; Wang, H.; Yang, B. Highly photoluminescent carbon dots for multicolor patterning, sensors, and bioimaging. Angew. Chem. Int. Ed. Engl. 2013, 52, 3953–3957. [Google Scholar] [CrossRef]
  18. Han, Z.; Nan, D.; Yang, H.; Sun, Q.; Pan, S.; Liu, H.; Hu, X. Carbon quantum dots based ratiometric fluorescence probe for sensitive and selective detection of Cu2+ and glutathione. Sens. Actuators B Chem. 2019, 298, 126842. [Google Scholar] [CrossRef]
  19. Mitra, S.; Chakraborty, A.J.; Tareq, A.M.; Emran, T.B.; Nainu, F.; Khusro, A.; Idris, A.M.; Khandaker, M.U.; Osman, H.; Alhumaydhi, F.A.; et al. Impact of heavy metals on the environment and human health: Novel therapeutic insights to counter the toxicity. J. King. Saud. Univ. Sci. 2022, 34, 101865. [Google Scholar] [CrossRef]
  20. Zhou, W.; Mo, F.; Sun, Z.; Luo, J.; Fan, J.; Zhu, H.; Zhu, Z.; Huang, J.; Zhang, X. Bright red-emitting P, Br co-doped carbon dots as “OFF-ON” fluorescent probe for Cu2+ and L-cysteine detection. J. Alloys Compd. 2022, 897, 162731. [Google Scholar] [CrossRef]
  21. Kumari, A.; Kumar, A.; Sahu, S.K.; Kumar, S. Synthesis of green fluorescent carbon quantum dots using waste polyolefins residue for Cu2+ ion sensing and live cell imaging. Sens. Actuators B Chem. 2018, 254, 197–205. [Google Scholar] [CrossRef]
  22. Li, H.; Xu, T.; Zhang, Z.; Chen, J.; She, M.; Ji, Y.; Zheng, B.; Yang, Z.; Zhang, S.; Li, J. Photostable and printable fluorescence carbon quantum dots for advanced message encryption and specific reversible multiple sensing of Cu2+ and cysteine. Chem. Eng. J. 2023, 453, 139722. [Google Scholar] [CrossRef]
  23. Lv, W.; Lin, M.; Li, R.; Zhang, Q.; Liu, H.; Wang, J.; Huang, C. Aggregation-induced emission enhancement of yellow photoluminescent carbon dots for highly selective detection of environmental and intracellular copper(II) ions. Chin. Chem. Lett. 2019, 30, 1410–1414. [Google Scholar] [CrossRef]
  24. Sonaimuthu, M.; Ganesan, S.; Anand, S.; Kumar, A.J.; Palanisamy, S.; You, S.; Velsankar, K.; Sudhahar, S.; Lo, H.-M.; Lee, Y.R. Multiple heteroatom dopant carbon dots as a novel photoluminescent probe for the sensitive detection of Cu2+ and Fe3+ ions in living cells and environmental sample analysis. Environ. Res. 2023, 219, 115106. [Google Scholar] [CrossRef]
  25. Jiang, D.; Zheng, M.; Yan, X.; Huang, B.; Huang, H.; Gong, T.; Liu, K.; Liu, J. A “turn-on” ESIPT fluorescence probe of 2-(aminocarbonyl)phenylboronic acid for the selective detection of Cu(ii). RSC Adv. 2022, 12, 31186–31191. [Google Scholar] [CrossRef] [PubMed]
  26. Mahajan, P.G.; Dige, N.C.; Vanjare, B.D.; Eo, S.-H.; Kim, S.J.; Lee, K.H. A nano sensor for sensitive and selective detection of Cu2+ based on fluorescein: Cell imaging and drinking water analysis. Spectrochim. Acta A 2019, 216, 105–116. [Google Scholar] [CrossRef]
  27. Issa, M.A.; Abidin, Z.Z.; Sobri, S.; Rashid, S.A.; Mahdi, M.A.; Ibrahim, N.A. Fluorescent recognition of Fe3+ in acidic environment by enhanced-quantum yield N-doped carbon dots: Optimization of variables using central composite design. Sci. Rep. 2020, 10, 11710. [Google Scholar] [CrossRef] [PubMed]
  28. Nagaraj, M.; Ramalingam, S.; Murugan, C.; Aldawood, S.; Jin, J.-O.; Choi, I.; Kim, M. Detection of Fe3+ ions in aqueous environment using fluorescent carbon quantum dots synthesized from endosperm of Borassus flabellifer. Environ. Res. 2022, 212, 113273. [Google Scholar] [CrossRef]
  29. Wang, Y.; Chang, Q.; Hu, S. Carbon dots with concentration-tunable multicolored photoluminescence for simultaneous detection of Fe3+ and Cu2+ ions. Sens. Actuators B Chem. 2017, 253, 928–933. [Google Scholar] [CrossRef]
  30. Yuan, Y.H.; Liu, Z.X.; Li, R.S.; Zou, H.Y.; Lin, M.; Liu, H.; Huang, C.Z. Synthesis of nitrogen-doping carbon dots with different photoluminescence properties by controlling the surface states. Nanoscale 2016, 8, 6770–6776. [Google Scholar] [CrossRef]
  31. Zhang, H.; Chen, Y.; Liang, M.; Xu, L.; Qi, S.; Chen, H.; Chen, X. Solid-phase synthesis of highly fluorescent nitrogen-doped carbon dots for sensitive and selective probing ferric ions in living cells. Anal. Chem. 2014, 86, 9846–9852. [Google Scholar] [CrossRef]
  32. Mejía Ávila, J.; Rangel Ayala, M.; Kumar, Y.; Pérez-Tijerina, E.; Robles, M.A.R.; Agarwal, V. Avocado seeds derived carbon dots for highly sensitive Cu (II)/Cr (VI) detection and copper (II) removal via flocculation. Chem. Eng. J. 2022, 446, 137171. [Google Scholar] [CrossRef]
  33. Rahmani, Z.; Ghaemy, M. One-step hydrothermal-assisted synthesis of highly fluorescent N-doped carbon dots from gum tragacanth: Luminescent stability and sensitive probe for Au3+ ions. Opt. Mater. 2019, 97, 109356. [Google Scholar] [CrossRef]
  34. Luo, T.; Bu, L.; Peng, S.; Zhang, Y.; Zhou, Z.; Li, G.; Huang, J. One-step microwave-assisted preparation of oxygen-rich multifunctional carbon quantum dots and their application for Cu2+-curcumin detection. Talanta 2019, 205, 120117. [Google Scholar] [CrossRef] [PubMed]
  35. Zhao, Q.; Li, X.; Wang, X.; Zang, Z.; Liu, H.; Li, L.; Yu, X.; Yang, X.; Lu, Z.; Zhang, X. Surface amino group modulation of carbon dots with blue, green and red emission as Cu2+ ion reversible detector. Appl. Surf. Sci. 2022, 598, 153892. [Google Scholar] [CrossRef]
  36. Xu, J.; Wang, C.; Li, H.; Zhao, W. Synthesis of green-emitting carbon quantum dots with double carbon sources and their application as a fluorescent probe for selective detection of Cu2+ ions. RSC Adv. 2020, 10, 2536–2544. [Google Scholar] [CrossRef] [Green Version]
  37. Jiao, T.; Wen, H.; Dong, W.; Wen, W.; Li, Z. Metal ion (Fe3+ and Cu2+) catalyzed synthesis of high quantum yield carbon dots. Mater. Lett. 2022, 324, 132575. [Google Scholar] [CrossRef]
  38. Siahcheshm, P.; Heiden, P. High quantum yield carbon quantum dots as selective fluorescent turn-off probes for dual detection of Fe2+/Fe3+ ions. J. Photochem. Photobiol. A 2023, 435, 114284. [Google Scholar] [CrossRef]
  39. Atabaev, T.S. Doped carbon dots for sensing and bioimaging applications: A minireview. Nanomaterials 2018, 8, 342. [Google Scholar] [CrossRef] [Green Version]
  40. Gao, X.; Du, C.; Zhuang, Z.; Chen, W. Carbon quantum dot-based nanoprobes for metal ion detection. J. Mater. Chem. C 2016, 4, 6927–6945. [Google Scholar] [CrossRef]
  41. Molaei, M.J. Principles, mechanisms, and application of carbon quantum dots in sensors: A review. Anal. Methods 2020, 12, 1266–1287. [Google Scholar] [CrossRef]
  42. Mohandoss, S.; Ganesan, S.; Palanisamy, S.; You, S.; Velsankar, K.; Sudhahar, S.; Lo, H.-M.; Lee, Y.R. Nitrogen, sulfur, and phosphorus Co-doped carbon dots-based ratiometric chemosensor for highly selective sequential detection of Al3+ and Fe3+ ions in logic gate, cell imaging, and real sample analysis. Chemosphere 2023, 313, 137444. [Google Scholar] [CrossRef] [PubMed]
  43. Tian, L.; Li, Z.; Wang, P.; Zhai, X.; Wang, X.; Li, T. Carbon quantum dots for advanced electrocatalysis. J. Energy Chem. 2021, 55, 279–294. [Google Scholar] [CrossRef]
  44. Salehtabar, F.; Ghaemy, M. Preparation of strongly photoluminescent nanocomposite from DGEBA epoxy resin and highly fluorescent nitrogen-doped carbon dots. Polym. Bull. 2023, 80, 3247–3264. [Google Scholar] [CrossRef]
  45. Liu, R.; Haruna, S.A.; Ali, S.; Xu, J.; Ouyang, Q.; Li, H.; Chen, Q. An Up-conversion signal probe-MnO2 nanosheet sensor for rapid and sensitive detection of tetracycline in food. Spectrochim. Acta A 2022, 270, 120855. [Google Scholar] [CrossRef]
  46. Fu, A.C.; Hu, Y.; Zhao, Z.-H.; Su, R.; Song, Y.; Zhu, D. Functionalized paper microzone plate for colorimetry and up-conversion fluorescence dual-mode detection of telomerase based on elongation and capturing amplification. Sens. Actuators B Chem. 2018, 259, 642–649. [Google Scholar] [CrossRef]
  47. Liang, J.-M.; Zhang, F.; Zhu, Y.-L.; Deng, X.-Y.; Chen, X.-P.; Zhou, Q.-J.; Tan, K.-J. One-pot hydrothermal synthesis of Si-doped carbon quantum dots with up-conversion fluorescence as fluorescent probes for dual-readout detection of berberine hydrochloride. Spectrochim. Acta A 2022, 275, 121139. [Google Scholar] [CrossRef]
  48. Fu, J.; Zhou, S.; Tang, S.; Wu, X.; Zhao, P.; Tang, K.; Chen, Y.; Yang, Z.; Zhang, Z. Imparting down/up-conversion dual channels fluorescence to luminescence metal-organic frameworks by carbon dots-induced for fluorescence sensing. Talanta 2022, 242, 123283. [Google Scholar] [CrossRef]
  49. Deng, Y.; Chen, M.; Chen, G.; Zou, W.; Zhao, Y.; Zhang, H.; Zhao, Q. Visible–Ultraviolet Upconversion Carbon Quantum Dots for Enhancement of the Photocatalytic Activity of Titanium Dioxide. ACS Omega 2021, 6, 4247–4254. [Google Scholar] [CrossRef]
  50. Mao, Z.; Li, H.; Gan, N.; Suo, Z.; Zhang, H.; Zhao, Q. Contribution of nicotinamide as an intracyclic N dopant to the structure and properties of carbon dots synthesized using three α-hydroxy acids as C sources. Nanotechnology 2022, 33, 215705. [Google Scholar] [CrossRef]
  51. Fang, C.; Lihua, Z.; Hong, W. Preparation of Carbon Dots and Determination of Their Fluorescence Quantum Yield. Univ. Chem. 2019, 34, 67–72. [Google Scholar]
  52. Ali, M.; Anjum, A.S.; Bibi, A.; Wageh, S.; Sun, K.C.; Jeong, S.H. Gradient heating-induced bi-phase synthesis of carbon quantum dots (CQDs) on graphene-coated carbon cloth for efficient photoelectrocatalysis. Carbon 2022, 196, 649–662. [Google Scholar] [CrossRef]
  53. Liang, C.; Xie, X.; Shi, Q.; Feng, J.; Zhang, D.; Huang, X. Nitrogen/sulfur-doped dual-emission carbon dots with tunable fluorescence for ratiometric sensing of ferric ions and cell membrane imaging. Appl. Surf. Sci. 2022, 572, 151447. [Google Scholar] [CrossRef]
  54. Chen, X.; Song, Z.; Yuan, B.; Li, X.; Li, S.; Thang Nguyen, T.; Guo, M.; Guo, Z. Fluorescent carbon dots crosslinked cellulose Nanofibril/Chitosan interpenetrating hydrogel system for sensitive detection and efficient adsorption of Cu (II) and Cr (VI). Chem. Eng. J. 2022, 430, 133154. [Google Scholar] [CrossRef]
  55. Preeyanghaa, M.; Vinesh, V.; Sabarikirishwaran, P.; Rajkamal, A.; Ashokkumar, M.; Neppolian, B. Investigating the role of ultrasound in improving the photocatalytic ability of CQD decorated boron-doped g-C3N4 for tetracycline degradation and first-principles study of nitrogen-vacancy formation. Carbon 2022, 192, 405–417. [Google Scholar] [CrossRef]
  56. Dong, Y.; Pang, H.; Yang, H.B.; Guo, C.; Shao, J.; Chi, Y.; Li, C.M.; Yu, T. Carbon-Based Dots Co-doped with Nitrogen and Sulfur for High Quantum Yield and Excitation-Independent Emission. Angew. Chem. Int. Ed. 2013, 52, 7800–7804. [Google Scholar] [CrossRef]
  57. Gao, Y.; Zhang, H.; Jiao, Y.; Lu, W.; Liu, Y.; Han, H.; Gong, X.; Shuang, S.; Dong, C. Strategy for Activating Room-Temperature Phosphorescence of Carbon Dots in Aqueous Environments. Chem. Mater. 2019, 31, 7979–7986. [Google Scholar] [CrossRef]
  58. Wang, H.; Wang, P.; Niu, L.; Liu, C.; Xiao, Y.; Tang, Y.; Chen, Y. Carbazole-thiophene based fluorescent probe for selective detection of Cu2+ and its live cell imaging. Spectrochim. Acta A 2022, 278, 121257. [Google Scholar] [CrossRef]
  59. Kateshiya, M.R.; Malek, N.I.; Kailasa, S.K. Folic acid functionalized molybdenum oxide quantum dots for the detection of Cu2+ ion and alkaline phosphatase via fluorescence turn off–on mechanism. Spectrochim. Acta A 2022, 268, 120659. [Google Scholar] [CrossRef]
  60. Zhao, L.-X.; Chen, K.-Y.; Xie, K.-B.; Hu, J.-J.; Deng, M.-Y.; Zou, Y.-L.; Gao, S.; Fu, Y.; Ye, F. A benzothiazole-based “on-off” fluorescence probe for the specific detection of Cu2+ and its application in solution and living cells. Dye. Pigm. 2023, 210, 110943. [Google Scholar] [CrossRef]
  61. Zhang, Y.; Zhu, T.; Xu, Y.; Yang, Y.; Sheng, D.; Ma, Q. Quaternized salicylaldehyde Schiff base side-chain polymer-grafted magnetic Fe3O4 nanoparticles for the removal and detection of Cu2+ ions in water. Appl. Surf. Sci. 2023, 611, 155632. [Google Scholar] [CrossRef]
  62. John, B.K.; John, N.; Korah, B.K.; Thara, C.; Abraham, T.; Mathew, B. Nitrogen-doped carbon quantum dots as a highly selective fluorescent and electrochemical sensor for tetracycline. J. Photochem. Photobiol. A 2022, 432, 114060. [Google Scholar] [CrossRef]
  63. Sun, S.; Bao, W.; Yang, F.; Yan, X.; Sun, Y.; Zhang, G.; Yang, W.; Li, Y. Electrochemical synthesis of FeNx doped carbon quantum dots for sensitive detection of Cu2+ ion. Green. Energy Environ. 2021, 8, 141–150. [Google Scholar] [CrossRef]
  64. Bossu, F.P.; Chellappa, K.L.; Margerum, D.W. Ligand effects on the thermodynamic stabilization of copper(III)-peptide complexes. J. Am. Chem. Soc. 1977, 99, 2195–2203. [Google Scholar] [CrossRef] [PubMed]
  65. Wang, J.; Sheng Li, R.; Zhi Zhang, H.; Wang, N.; Zhang, Z.; Huang, C.Z. Highly fluorescent carbon dots as selective and visual probes for sensing copper ions in living cells via an electron transfer process. Biosens. Bioelectron. 2017, 97, 157–163. [Google Scholar] [CrossRef] [PubMed]
  66. Wu, H.; Pang, L.-F.; Fu, M.-J.; Guo, X.-F.; Wang, H. Boron and nitrogen co-doped carbon dots as fluorescence sensor for Fe3+ with improved selectivity. J. Pharm. Biomed. Anal. 2020, 180, 113052. [Google Scholar] [CrossRef]
  67. Zhang, Z.; Chen, X.; Wang, J. Bright blue emissions N-doped carbon dots from a single precursor and their application in the trace detection of Fe3+ and F. Inorg. Chim. Acta 2021, 515, 120087. [Google Scholar] [CrossRef]
  68. Zhou, Y.; Chen, G.; Ma, C.; Gu, J.; Yang, T.; Li, L.; Gao, H.; Xiong, Y.; Wu, Y.; Zhu, C.; et al. Nitrogen-doped carbon dots with bright fluorescence for highly sensitive detection of Fe3+ in environmental waters. Spectrochim. Acta A Mol. Biomol. Spectrosc. 2023, 293, 122414. [Google Scholar] [CrossRef]
  69. Zhang, W.J.; Liu, S.G.; Han, L.; Luo, H.Q.; Li, N.B. A ratiometric fluorescent and colorimetric dual-signal sensing platform based on N-doped carbon dots for selective and sensitive detection of copper (II) and pyrophosphate ion. Sens. Actuators B Chem. 2019, 283, 215–221. [Google Scholar] [CrossRef]
  70. Yang, L.; Zeng, J.; Quan, T.; Liu, S.; Deng, L.; Kang, X.; Xia, Z.; Gao, D. Liquid-liquid extraction and purification of oil red O derived nitrogen-doped highly photoluminescent carbon dots and their application as multi-functional sensing platform for Cu2+ and tetracycline antibiotics. Microchem. J. 2021, 168, 106391. [Google Scholar] [CrossRef]
  71. Yang, F.; Zhou, P.; Duan, C. Solid-phase synthesis of red dual-emissive nitrogen-doped carbon dots for the detection of Cu2+ and glutathione. Microchem. J. 2021, 169, 106534. [Google Scholar] [CrossRef]
  72. Praneerad, J.; Thongsai, N.; Supchocksoonthorn, P.; Kladsomboon, S.; Paoprasert, P. Multipurpose sensing applications of biocompatible radish-derived carbon dots as Cu2+ and acetic acid vapor sensors. Spectrochim. Acta A 2019, 211, 59–70. [Google Scholar] [CrossRef] [PubMed]
  73. Li, Z.; Zhou, Q.; Li, S.; Liu, M.; Li, Y.; Chen, C. Carbon dots fabricated by solid-phase carbonization using p-toluidine and l-cysteine for sensitive detection of copper. Chemosphere 2022, 308, 136298. [Google Scholar] [CrossRef]
  74. Krishnaiah, P.; Atchudan, R.; Perumal, S.; Salama, E.-S.; Lee, Y.R.; Jeon, B.-H. Utilization of waste biomass of Poa pratensis for green synthesis of n-doped carbon dots and its application in detection of Mn2+ and Fe3+. Chemosphere 2022, 286, 131764. [Google Scholar] [CrossRef]
  75. Gao, B.; Chen, D.; Gu, B.; Wang, T.; Wang, Z.; Xie, F.; Yang, Y.; Guo, Q.; Wang, G. Facile and highly effective synthesis of nitrogen-doped graphene quantum dots as a fluorescent sensing probe for Cu2+ detection. Curr. Appl. Phys. 2020, 20, 538–544. [Google Scholar] [CrossRef]
  76. Liu, L.; Qin, K.; Yin, S.; Zheng, X.; Li, H.; Yan, H.; Song, P.; Ji, X.; Zhang, Q.; Wei, Y.; et al. Bifunctional carbon dots derived from an anaerobic bacterium of porphyromonas gingivalis for selective detection of Fe and bioimaging. Photochem. Photobiol. 2021, 97, 574–581. [Google Scholar] [CrossRef]
  77. Fu, Y.; Zhao, S.; Wu, S.; Huang, L.; Xu, T.; Xing, X.; Lan, M.; Song, X. A carbon dots-based fluorescent probe for turn-on sensing of ampicillin. Dye. Pigment. 2020, 172, 107846. [Google Scholar] [CrossRef]
  78. Qian, Z.; Shan, X.; Chai, L.; Ma, J.; Chen, J.; Feng, H. Si-doped carbon quantum dots: A facile and general preparation strategy, bioimaging application, and multifunctional sensor. ACS Appl. Mater. Interfaces 2014, 6, 6797–6805. [Google Scholar] [CrossRef] [PubMed]
  79. Zhang, L.C.; Yang, Y.M.; Liang, L.; Jiang, Y.J.; Li, C.M.; Li, Y.F.; Zhan, L.; Zou, H.Y.; Huang, C.Z. Lighting up of carbon dots for copper (II) detection using an aggregation-induced enhanced strategy. Analyst 2022, 147, 417–422. [Google Scholar] [CrossRef]
Scheme 1. Schematic illustration for DN-CD preparation.
Crystals 13 00812 sch001
Figure 1. UV–Vis absorption and PL spectra of the DN-CDs. (* represents antibonding molecular orbital) (a) The UV-Vis absorption of DN-CDs. Inset: photograph taken under daylight and 365 nm UV light. (b) The Tauc plot according to the UV-Vis absorption. (The carbon dots are usually indirect bandgaps, so we selected the value of ‘n’ as 2) (c) Emission spectra of DN-CDs at different excitation wavelengths. (d) Up-conversion emission spectra of DN-CDs at different excitation wavelengths.
Crystals 13 00812 g001
Figure 2. (a) The effect of pH on the UCPL intensity of DN-CDs in a range from 1 to 13. (b) The effect of storage time on PL intensity of DN-CDs after 90 days. (c) The effect of 60 min of UV irradiation on the UCPL intensity (F0 is the initial UCPL intensity and F is the UCPL intensity after under UV irradiation). (d) The effect of salt concentration on the UCPL intensity for DN-CDs at different concentrations of NaCl (‘F0’ is the PL intensity of a blank sample and ‘F’ is the intensity of the experimental sample).
Crystals 13 00812 g002
Figure 3. TEM image (a), size distribution (b), XRD spectra (c) and FT-IR spectra (d) of DN-CDs (the inset in (a) is the HRTEM of the DN-CDs).
Crystals 13 00812 g003
Figure 4. (a) The full-scan XPS spectra of the DN-CDs; (b) C1s spectra of the DN-CDs; (c) O1s spectra of the DN-CDs; (d) N1s spectra of the DN-CDs.
Crystals 13 00812 g004
Figure 5. (a) The selectivity of DN-CDs to various metal ions: relative PL intensity of the DN-CDs (20 μg/mL) in the absence (black column) and presence (red column) of other metal ions (10 µM) (λex = 820 nm and λem = 450 nm); (b) the effect of reaction time on the quenching equilibrium of DN-CDs; (c) PL quenching efficiency of DN-CDs at different concentrations of Cu2+ ions (2.5–50 µM); (d) the linear relationship between PL intensity and Cu2+ ion concentration (F0 is the PL intensity in the absence of Cu2+ ions and F is in the presence of Cu2+ ions).
Crystals 13 00812 g005
Figure 6. (a) The UV-Vis spectra of DN-CDs in the absence and presence of Cu2+ ions; (b) the comparison of the absorption spectra of Cu2+ ions and the emission spectra of DN-CDs at λex = 820 nm; (c) the UV-Vis spectra and emission spectra of DN-CDs at λex = 820 nm; (d) the fluorescence lifetime decay of DN-CDs in the absence and presence of Cu2+ ions (λex = 410 nm and λem = 450 nm).
Crystals 13 00812 g006
Figure 7. The mechanism of fluorescence quenching detection for Cu2+.
Crystals 13 00812 g007
Figure 8. (a) The selectivity of N-CDs-1 to various metal ions at λex = 410 nm, λem = 510 nm and (b) λex = 808 nm, λem = 510 nm; (c) the selectivity of N-CDs-2 to various metal ions at λex = 380 nm, λem = 450 nm.
Crystals 13 00812 g008
Table 1. The range of detection and LOD of other PL sensors for Cu2+ ions.
SensorRange of DetectionLODRef.
BP/NS-CDs0–50 µM0.18 µM[24]
OPD-CDs0.5–40 µM0.28 µM[23]
NS-CDs1–10 µM0.29 µM[58]
FA-MoOx QDs0.2–500 µM29 nM[59]
HBT-H0–5 µM0.308 µM[60]
Fe3O4@SiO2-PAP0.1–0.2 mg/L0.125 µM[61]
Disclaimer/Publisher’s Note: The statements, opinions and data contained in all publications are solely those of the individual author(s) and contributor(s) and not of MDPI and/or the editor(s). MDPI and/or the editor(s) disclaim responsibility for any injury to people or property resulting from any ideas, methods, instructions or products referred to in the content.

