Article

The Influence of Foundry Scrap Returns on Chemical Composition and Microstructure Development of AlSi9Cu3 Alloy

1
Laboratory for Heat Treatment and Materials Testing, Faculty of Mechanical Engineering, University of Ljubljana, 1000 Ljubljana, Slovenia
2
Department of Materials and Metallurgy, Faculty of Natural Sciences and Engineering, University of Ljubljana, 1000 Ljubljana, Slovenia
3
Institute of Manufacturing Technology, Faculty of Mechanical Engineering, Brno University of Technology, 616 69 Brno, Czech Republic
*
Author to whom correspondence should be addressed.
Crystals 2023, 13(5), 757; https://doi.org/10.3390/cryst13050757
Submission received: 12 April 2023 / Revised: 28 April 2023 / Accepted: 30 April 2023 / Published: 3 May 2023
(This article belongs to the Special Issue Advances of Aluminum Alloys: Innovation and Application Potential)

Abstract

:
Recycling is now, more than ever, an important part of any foundry process due to the high cost of energy. The basis of the work presented here is a study of the addition of foundry scrap returns to the melt in order to reduce material and energy costs. The most important issue in such a process is the quality of both the prepared melt and final product. In this work, scrap returns were added to the AlSi9Cu3 base alloy in different proportions. Chemical composition was monitored, the solidification path was predicted by CALPHAD calculations and monitored by thermal analysis, and the formed microstructure was studied. The mechanical properties were also determined. The results showed that as the amount of scrap returns increased, elements such as Fe, Ni, Pb, Sr, etc. were more built up and elements such as Mg, Mn, Cr, etc. were decreased due to oxidation. The different chemical composition led to a reduced Mn:Fe ratio, resulting in the formation of needle-like Fe-rich phases and a decrease in mechanical properties.

1. Introduction

In foundries and within the aluminium industry, the demand for aluminium alloys for the automotive industry is constantly increasing due to their good specific strength and corrosion resistance. Most of the aluminium comes from primary production, i.e., from electrolysis. However, the production of secondary aluminium is increasing rapidly [1,2]. Firstly, due to the high price of primary alloys, foundries often use recycled materials to increase the efficiency and productivity of the process. Secondly, the reuse of recycled and scrap parts saves up to 95% energy compared to the production of primary aluminium, resulting in less greenhouse gas emissions [3,4,5].
The solidification of theAlSi9Cu3(Fe) alloy has been studied by various researchers [6,7,8]. Solidification depends on the chemical composition and cooling rate and starts with the nucleation of primary αAl dendrites at about 610–570 °C. Soon after, the formation of iron-rich phases such as α-Al15(Mn,Fe)3Si2 and/or β-Al5FeSi occurs. Eutectic crystallisation of (αAl + βSi) begins at 566 °C, followed by the formation of Mg2Si (if the criteria are met). Subsequently, the formation of the copper-rich phase begins in the final stage of solidification, in which the first formation of the θ-Al2Cu phase takes place. Solidification is completed with the complex eutectic Q-Al5Mg8Si6Cu2 phase in the temperature range of ~495–451 °C [9,10].
When using secondary aluminium, the efficiency of the process is lower due to the higher slag content. Secondly, many impurities are introduced into the melt with secondary aluminium. Iron is one of the main elements that form iron-rich intermetallic phases, including the less harmful α-Al15(Mn,Fe)3Si2 phase with “Chinese script” morphology and harmful β-Al5FeSi needles [11]. To avoid the formation of β-Al5FeSi, different methods can be used: melt superheating, higher cooling rates, and chemical modification. In practise, the Mn:Fe ratio = 0.5 is most often maintained [12]. With the addition of recycled and scrap parts, the chemical composition changes and it is known that the concentrations of Mg and Mn decrease due to oxidation. Both elements play an important role, firstly in the formation of α-Al15(Mn,Fe)3Si2, and secondly, the presence of Cu and Mg allows additional hardening of the AlSi9Cu3(Fe) alloy by heat treatment or natural ageing. During ageing, θ-Al2Cu and/or Mg2Si precipitates are formed, which lead to an increase in tensile strength (Rm) and hardness of the AlSi9Cu3(Fe) alloy [13]. Furthermore, grain refinement of primary αAl with Al-Ti-B master alloy is often used to improve Rm and hardness of aluminium alloys [14,15]. Modification of eutectic βSi by the addition of Sr is also a well-known practise [16]. When Sr-modified scrap is added to the melt, the chemical composition of Ti, B, and Sr increases, and enrichment of these elements can lead to the formation of new Sr-rich intermetallic Al2SrSi2 [17,18].
The aim of the present study was to observe the effects of different amounts of scrap returns on the chemical composition of the castings. The main focus of the study was on the cooling curves and changes in mechanical properties, such as tensile strength, yield strength, and hardness, which change due to natural ageing.

2. Materials and Methods

The work was based on the production of specimens from a base alloy with different amounts of foundry scrap returns. Foundry scrap returns in this context meant the rejected castings from gating and feeder systems that are recycled during the production of castings at every foundry and are a necessity in casting production. The amount of castings rejected from gating and feeder systems during brut casting is usually from 30% to 50% or more, which is why foundry scrap returns are an important part of the charge material. Usually, the foundry scrap returns used in the production of new castings are from the same alloy as the castings produced. The alloy used for the experiment was a standard AlSi9Cu3 base alloy (chemical composition given in Table 1) to which scrap returns described above (chemical composition given in Table 2) were added in quantities ranging from 0% to 100%. Table 2 shows the designations of the samples and the additions of return scrap. The samples of about 2000 g were melted in an induction furnace with a steel crucible. After melting, the temperature was raised to 700 °C, and grain refiners (0.02 wt% Ti in the AlTi5B1 master alloy) and modifiers (0.01 wt% Sr in the AlSr10 master alloy) were added. The melt was degassed with a laboratory impeller at 600 rpm and an argon gas flow of 3 L/min for 120 s. The melts prepared in this way were poured into a Croning measuring cell for simple thermal analysis, where the temperature was recorded over time. The remainder of the melt was poured into a square steel mould that was preheated to 450 °C. The castings from the Croning measuring cell were cut for chemical analysis, differential scanning calorimetry (DSC), and metallographic observations. The castings from the steel mould were used to prepare tensile and hardness test specimens. Figure 1 shows the melting procedure, the cast samples, and the sections for the above analyses. Chemical analysis was carried out by inductively coupled plasma–optical emission spectrometry (ICP–OES) using an Agilent 5800 VDV instrument and metallographic observations were made by optical metallography and scanning electron microscopy (SEM) using an Olympus BX 61 microscope and Jeol JSM-6500F SEM with an EDS detector, respectively. Round tensile test specimens (DIN 50125) were tested 35 days after casting the samples, with four replicates using the INSTRON 8802 machine according to SIST EN ISO 6892-1 A224. Brinell hardness (HBW 2.5/62.5) measurements were taken for 35 days after casting to follow the natural ageing process, with two repetitions for each sample using a NEXUS 7500 tester. Based on the chemical composition, CALPHAD simulations of the phase diagrams were calculated for all alloys using ThermoCalc 2020a software and the TCAL6 database. In addition, the non-equilibrium solidification course for each alloy was predicted using the Scheil model.

3. Results and Discussion

3.1. Chemical Composition

The chemical composition was analysed for all six samples listed in Table 2. Figure 2a shows the change in chemical composition as a function of the proportion of scrap returns. The main alloying elements, such as Si, Cu, and Fe, varied randomly from sample to sample. In the case of Si, the variation was between 7.4 and 8 wt%, which was still within the range of standard values. Similar fluctuations were also observed for Cu. The reason for these differences in the values for Si and Cu was the addition of residues to the base alloy. The scrap had different shapes and sizes, e.g., the feeder systems were relatively large, which meant that solidification in the feeder systems during production of the castings took place at the lowest cooling rates, resulting in a coarse and inhomogeneous microstructure. When cutting samples from such feeder systems, the areas with more or less microstructural constituents such as eutectic βSi and Cu-rich Al2Cu and Q-AlCuMgSi phases were randomly selected, resulting in differences in the Si and Cu values.
For other alloying elements, the situation was a little different. The contents of some elements that were susceptible to oxidation were reduced at higher additions of scrap returns. This meant that the liquid metal used for the casting process was kept in a furnace for a while before casting, where elements such as Ca, Mg, and Zr were oxidised. On the other hand, elements such as Cr and Mn could also oxidise or form phases that settled on the bottom of the holding furnace due to the higher density or float in the oxide layer that was removed before casting. When the return scrap was remelted in the production of samples, oxidation took place again, resulting in a further decrease in the composition of the elements mentioned.
In contrast, the contents of some elements were increased. These elements were B, Bi, Sn, Sr, Ni, Pb, Ti, and Zn. These elements were more stable and did not oxidise in the melt. Ti, B, and Sr are added to the melt with the intention of refining the grain and modifying the melt. From the first sample (226-100) to the last, which had 100% scrap return content (226-00), the contents of Ti, B, and Sr were increased by 14%, 50%, and as much as 66%, respectively.

3.2. CALPHAD Simulations

The result of the CALPHAD calculations was an isopleth phase diagram, as shown for sample 226-100 in Figure 3a. It showed the solidification path of an alloy in which solidification started with the αAl phase, followed by Al15Si2M4, the iron-rich α-Al15(Fe,Mn)3Si2 phase. Another iron-rich phase, Al9Fe2Si2, solidified next, also referred to as Al5FeSi and marked as β-AlFeSi [19]. Solidification proceeded with the main eutectic (αAl + βSi) phase in which solidification should end. According to the calculations, precipitation occurred in the Q-Al5Cu2Mg8Si6 phase, which is also referred to as Q-AlCuMgSi. The next phase to precipitate was Al2Cu and the low-temperature Si2Sr phase. Figure 3b–e shows the plots of phase fractions versus temperature for samples 226-100 and 226-00. The phase fractions were slightly different in the two alloys, but differences were also observed in the temperature ranges of solidification and precipitation of the phases and in the order of solidification of the iron-rich phases. In the first sample, the iron-rich α-Al15(Fe,Mn)3Si2 phase solidified first, followed by β-AlFeSi, but in sample 226-00, it was the other way around due to the different chemical composition. Figure 2b shows the calculated phase fractions for all samples and it can be seen that fractions of α-Al15(Fe,Mn)3Si2 and Q-AlCuMgSi decreased as the amount of scrap returns in the alloy increased due to the lower content of Mn and Mg in the samples.
The Scheil model of solidification for all samples is shown in Figure 4. The predicted solidification path was similar to that described above, with the difference being that the Cu-containing phases solidified at the end of the solidification range and did not precipitate out of the solid. The difference in the solidification of the Cu-rich Q-AlCuMgSi and Al2Cu phases was evident in the second sample (226-80), which contained 20% scrap returns. In the sample without scrap returns (266-100), Q-AlCuMgSi solidified first and then Al2Cu, but the order was reversed in sample 226-80, so that Al2Cu solidified before Q-AlCuMgSi. The reason for this must have been the lower Mg content and different Cu content, as mentioned above. Similarly, there was another change in the order of solidification of Fe-bearing phases, as described in the equilibrium isopleth phase diagram. In samples 226-100 to 226-40, the first of the iron phases to solidify was α-Al15(Fe, Mn)3Si2 and the second was β-AlFeSi, but the order of solidification changed in the samples containing more than 80% scrap returns (226-20 and 226-00). It can also be seen that after the main eutectic (αAl + βSi) solidification ended, the β-AlFeSi phase disappeared. Figure 4 shows the presence of the AlB2, Al3Ti, and Si2Sr phases. The reason for this was that B, Ti, and Sr were also included in the calculations, resulting in the aforementioned phases. The rest of the solidification was unaffected and the phases were not the object of the study.

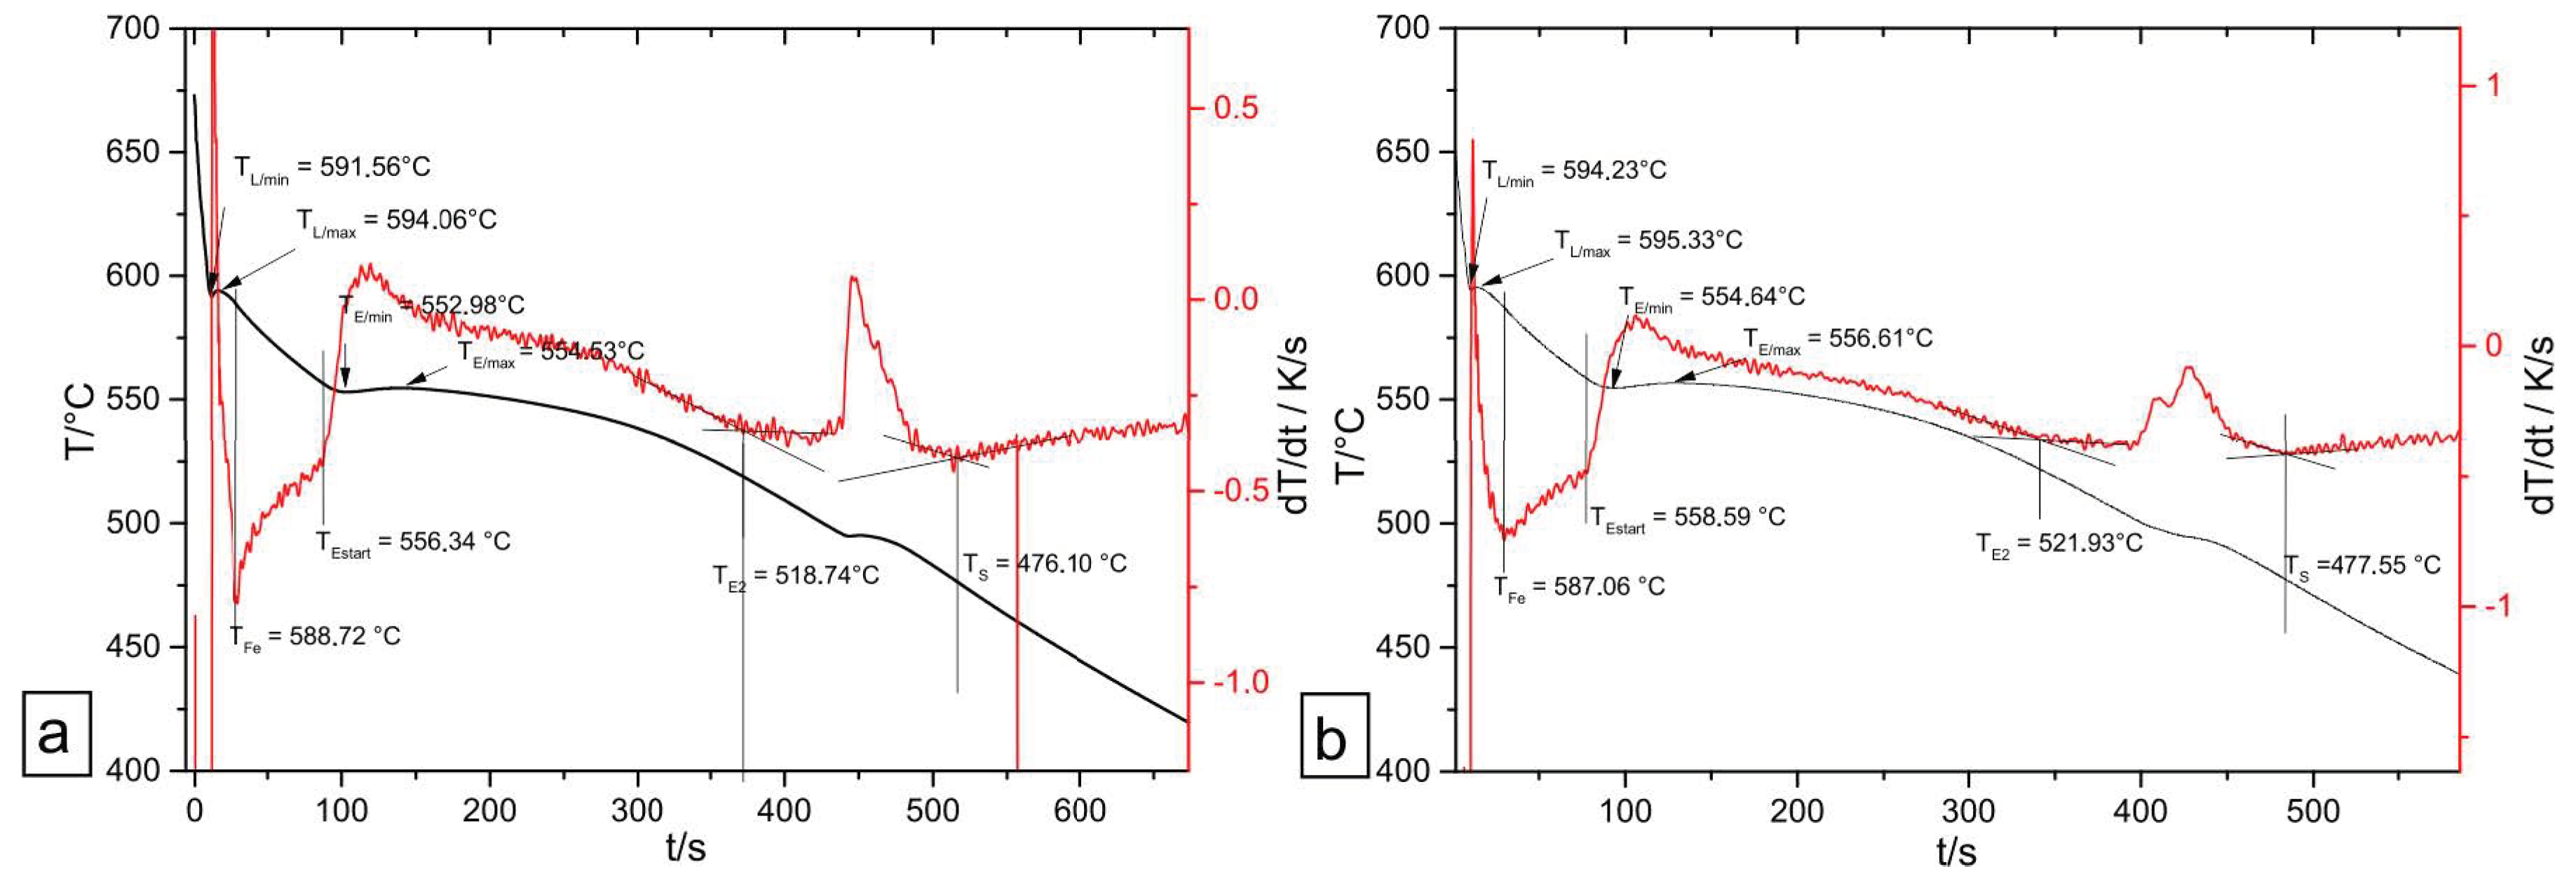
3.3. Thermal Analysis

Thermal analysis was carried out for all six samples. Figure 5 shows the cooling curves and derivatives of samples 266-100 and 266-00, respectively. All cooling curves showed similar behaviours. The differences in all characteristic temperatures were relatively small, e.g., the liquid temperature ranged between 594.1 °C and 595.3 °C. Higher differences were found in the main eutectic region and the second eutectic region, reaching up to 5.5 °C difference. The derivative curves of all samples were also similar, except that the last peak changed with higher additions of scrap returns and split into two peaks. It was assumed that the reason for this was the changed order of solidification of the Cu-rich phases and the lower amount of the Q-AlCuMgSi phase.

3.4. Metallography

  • SEM
SEM micrographs are shown in Figure 6 with the corresponding EDS analyses. The same microstructural constituents were determined in all six samples, only the fractions were changed, as shown below. Figure 6a shows phases such as αAl-matrix, βSi, α-Al15(Fe, Mn)3Si2, β-AlFeSi, and Al2Cu with the corresponding EDS analyses in Table 3. Figure 6b shows the Cu-containing Al2Cu and Q-AlCuMgSi phases and a heavy phase rich in Pb, Sn, and Ca, which was most probably oxidised since the amount of oxygen was relatively high. An additional Al2SrSi2 phase was determined as a result of Sr enrichment. The actual compositions of the phases determined by the EDS analyses (Table 3) were not exact but varied in elements and Al was present in almost all measurements. This was due to the nature of the analysis, which also analysed the background of the sample. The phases were determined on the basis of EDS analyses and previous reports [17,18,20,21,22,23].
  • Optic metallography
Optical metallography showed similar results to SEM, but some phases and their distributions were clearly visible in the optical micrographs. Figure 7 shows optic micrographs of all six samples at lower magnification. The green and red arrows show the Fe-rich phases. The green arrows show the Al15(Fe, Mn)3Si2 phases, which were in the form of Chinese script, and the red arrows show the needle-like β-AlFeSi phases. In the sample without scrap returns there were no needle-like phases, but as the content of scrap returns in the samples increased, the needle-like phases appeared and the proportions became higher due to different Mn:Fe ratios as the Mn content decreased. Very few needle-like phases appeared in samples 226-100 and 226-80, but the first representative needle-like phase appeared in sample 226-60, in which the Mn:Fe ratio was 0.38, and the amount of the phase increased as the ratio was further decreased to 0.30 in sample 226-00. Table 4 shows the results of the number and measured areas of the needle-like phase on two micrographs for each sample. In samples 226-100 and 226-80, 7 and 5 needles were found, respectively, but the number of needles increased to more than 30 in samples with higher amounts of foundry scrap returns. Table 4 also shows the area percentages of the needle-shaped phase in the samples. It can be seen that the amount increased from 0.11 area percent in sample 226-100 to 0.69 area percent in sample 226-00. The Chinese script-like Al15(Fe, Mn)3Si2 phase did not show the decreasing trend as would be expected due to the inhomogeneous distribution of phases in the microstructure and the phases were not captured representatively in the optic micrographs.

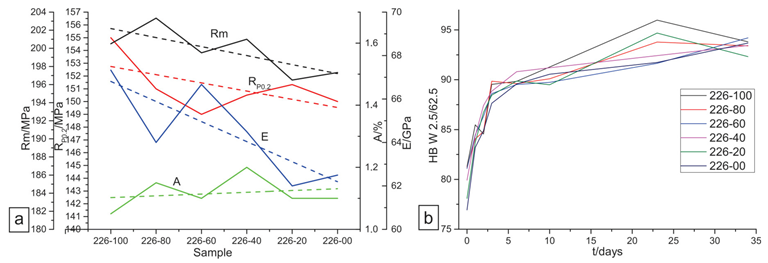
3.5. Mechanical Properties

  • Tensile tests
Thirty-five days after casting the samples, the four specimens of each alloy sample underwent tensile testing. According to the standard SIST EN ISO 6892-1 A224, the tensile strength (Rm), yield strength (Rp0.2), elongation (A), and modulus of elasticity (E) were determined. The average values were calculated from four measurements and are shown graphically in Figure 8a. In addition, linear correlations were calculated, as shown in Figure 8a. It can be seen that all of the measured properties decreased with increasing amounts of scrap material, except for a slight increase in elongation, but the scatter of the results was relatively large so the increase was insignificant. The decrease in all measured properties with the addition of scrap material was related to the higher amount of needle-like β-AlFeSi phase and the lower amount of Chinese script-like phase.
  • Brinell hardness
Brinell hardness measurements were taken on all samples for 35 days after casting. Table 5 shows the average values of hardness for each sample over the period of time. The results are also shown graphically in Figure 8b. All samples showed an increase in hardness over time, which meant that natural ageing had taken place over time, especially in the first three days. On the first day, the highest hardness was in the samples with little or no scrap return addition and the lowest hardness was in sample 226-00, which consisted only of scrap returns. This was caused by the needle-like β-AlFeSi phase, similar to the tensile test results. After two days of natural ageing, this trend faded and the results were scattered among the samples. On the last day of measurement, the hardness of the samples differed only by about 2 HB, and reached a value of 93 HB on average. The total increase in hardness during the 35 days of natural ageing was 15.4% for sample 226-100 and the highest value was 21.8% for sample 226-00. The reason for the natural ageing was the Cu and Mg contents in the samples, which led to the precipitation of the Al2Cu and Mg2Si phases, thereby hardening the matrix. The difference in the intensity of hardening was most likely caused by the different amounts of the elements mentioned, but other elements involved also influenced the hardness of the samples. From the results, it was concluded that the influence of the amount of needle-like β-AlFeSi phase had a detrimental effect on the mechanical properties of the as-cast state, but after natural ageing, the precipitation increased the hardness and the negative influence of the needle-like β-AlFeSi phase was reduced. Similar observations were confirmed above, where one can see that the tensile test results differed very little with increasing amounts of needle-like β-AlFeSi phase when the samples were naturally aged.

4. Conclusions

The general objective of the present work was to monitor the quality of Al alloy castings in the recycling of foundry scrap returns, which is of great importance nowadays. Six samples of melt were prepared, each with a higher percentage of scrap returns from 0% to 100%. Chemical analysis showed that elements such as B, Bi, Sn, Sr, Ni, Pb, Ti and Zn, which were more stable in the melt, accumulated with higher additions of foundry scrap returns. Elements such as Ca, Mg, Zr, Cr, and Mn appeared to be less stable, so their contents decreased. The changed chemical composition led to slightly different solidification sequences of the alloys, which was confirmed by thermodynamic calculations. The order of solidification changed for the Fe-bearing phases. Normally, the α-Al15(Fe,Mn)3Si2 phase solidified before the β-AlFeSi phase, but in the sample with 100% scrap material, the order was changed. Similar observations were made for the Cu-bearing phases, where the Q-AlCuMgSi phase solidified first for the sample without scrap returns, but the Al2Cu phase solidified before the Q-AlCuMgSi phase for the other samples.
Metallographic observations showed that with higher additions of scrap returns, the Mn:Fe ratio decreased, the amount of needle-like Fe-bearing phase β-AlFeSi increased, and, in contrast, the amount of the Chinese script-like α-Al15(Fe,Mn)3Si2 phase decreased. This also affected the mechanical properties, with the hardness of the samples being lower in the first three days with higher additions of scrap returns. However, over time, natural ageing took place and the hardness of all samples almost equalised, which meant that the precipitation reduced the negative influence of the needle-like β-AlFeSi phase. Similar results were observed in the tensile test analyses, where the tensile strength, yield strength, and modulus of elasticity decreased with higher additions of scrap returns, but the elongation remained almost the same.
The general conclusion of the present work was that the recycling of foundry scrap in foundries is desirable and possible, but that the chemical composition should be considered very carefully as it affects the microstructure and thus the mechanical properties. This research has shown that the addition of scrap returns up to 60% does not have a major impact on the mechanical properties, but negative deviations occur at higher amounts.

Author Contributions

Conceptualization and methodology, M.P. and J.Š.; validation, T.B., M.V. and M.P.; formal analysis, V.K.; investigation, J.Š., M.P., M.V. and P.M.; data curation, T.B.; writing—original draft preparation, J.Š.; writing—review and editing, M.P.; visualization, V.K.; supervision, M.P.; project administration, M.V.; funding acquisition, P.M. All authors have read and agreed to the published version of the manuscript.

Funding

This research was co-funded by the Republic of Slovenia, the Ministry of Education, Science and Sport, and the European Regional Development Fund. The work was carried out in the framework of the project ˝Modelling of Thermomechanical Processing of the Aluminium Alloys for High Quality Products˝ (MARTIN, Grant No. OP20.03531).

Data Availability Statement

No new data were created or analyzed in this study. Data sharing is not applicable to this article.

Acknowledgments

The authors would like to acknowledge the Republic of Slovenia, the Ministry of Education, Science and Sport, and the European Regional Development Fund and the framework of the project “Modelling of Thermomechanical Processing of the Aluminium Alloys for High Quality Products” (MARTIN, Grant No. OP20.03531).

Conflicts of Interest

The authors declare no conflict of interest.

References

  1. Galevsky, G.V.; Rudneva, V.V.; Aleksandrov, V.S. Current State of the World and Domestic Aluminium Production and Consumption. IOP Conf. Ser. Mater. Sci. Eng. 2018, 411, 012017. [Google Scholar] [CrossRef]
  2. Capuzzi, S.; Timelli, G. Preparation and Melting of Scrap in Aluminum Recycling: A Review. Metals 2018, 8, 249. [Google Scholar] [CrossRef]
  3. Wallace, G. Production of Secondary Aluminium. In Fundamentals of Aluminium Metallurgy; Elsevier: Amsterdam, The Netherlands, 2011; pp. 70–82. ISBN 9781845696542. [Google Scholar]
  4. Hurtalová, L.; Tillová, E.; Chalupová, M. Identification and Analysis of Intermetallic Phases in Age-Hardened Recycled AlSi9Cu3 Cast Alloy. Arch. Mech. Eng. 2012, 59, 385–396. [Google Scholar] [CrossRef]
  5. Sevigné-Itoiz, E.; Gasol, C.M.; Rieradevall, J.; Gabarrell, X. Environmental Consequences of Recycling Aluminum Old Scrap in a Global Market. Resour. Conserv. Recycl. 2014, 89, 94–103. [Google Scholar] [CrossRef]
  6. Bäckerud, L.; Chai, G.; Tamminen, J. Solidification Characteristics of Aluminum Alloys: Foundry Alloys; Solidification Characteristics of Aluminum Alloys; Skanaluminium; American Foundryman’s Society: Schaumburg, IL, USA, 1990; pp. 151–201. ISBN 9780874331196. [Google Scholar]
  7. Gowri, S.; Samuel, F.H. Effect of Alloying Elements on the Solidification Characteristics and Microstructure of Al-Si-Cu-Mg-Fe 380 Alloy. Metall. Mater. Trans. A 1994, 25, 437–448. [Google Scholar] [CrossRef]
  8. Žbontar, M.; Petrič, M.; Mrvar, P. The Influence of Cooling Rate on Microstructure and Mechanical Properties of Alsi9Cu3. Metals 2021, 11, 186. [Google Scholar] [CrossRef]
  9. Samuel, F.H. Incipient Melting of Al5Mg8Si6Cu2 and Al2Cu Intermetallics in Unmodified and Strontium-Modified Al-Si-Cu-Mg (319) Alloys during Solution Heat Treatment. J. Mater. Sci. 1998, 33, 2283–2297. [Google Scholar] [CrossRef]
  10. Djurdjevic, M.B.; Manasijevic, S.; Odanovic, Z.; Radisa, R. Influence of Different Contents of Si and Cu on the Solidification Pathways of Cast Hypoeutectic Al-(5-9)Si-(1-4)Cu (Wt.%) Alloys. Int. J. Mater. Res. 2013, 104, 865–873. [Google Scholar] [CrossRef]
  11. Kuchariková, L.; Tillová, E.; Mazur, M.; Herčko, A. Influence on the Quality of Secondary Aluminum Alloy Casts by Mn Addition. Qual. Prod. Improv.—QPI 2019, 1, 319–325. [Google Scholar] [CrossRef]
  12. Hernández-Rodríguez, A.; de Castro-román, M.J.; Herrera-Trejo, M.; Belmares-Perales, S.; Orozco-González, P. Effects of the Fe/Mn Weight Ratio and Cooling Rate on the Area Fractions of α-AlFeSi and β-AlFesi Phases in al-7.5Si-3.75Cu-0.5Mg-0.55Fe-XMn Aluminum Alloy. Metalurgija 2014, 53, 314–316. [Google Scholar]
  13. Jarco, A.; Pezda, J. Influence of Natural Ageing on Impact Strength of the EN AC-AlSi9Cu3(Fe) Alloy. Arch. Foundry Eng. 2015, 15, 81–84. [Google Scholar]
  14. Chen, Z.; Kang, H.; Fan, G.; Li, J.; Lu, Y.; Jie, J.; Zhang, Y.; Li, T.; Jian, X.; Wang, T. Grain Refinement of Hypoeutectic Al-Si Alloys with B. Acta Mater. 2016, 120, 168–178. [Google Scholar] [CrossRef]
  15. Fan, Z.; Wang, Y.; Zhang, Y.; Qin, T.; Zhou, X.R.; Thompson, G.E.; Pennycook, T.; Hashimoto, T. Grain Refining Mechanism in the Al/Al-Ti-B System. Acta Mater. 2015, 84, 292–304. [Google Scholar] [CrossRef]
  16. Wang, L.; Shivkumar, S. Strontium Modification of Aluminium Alloy Castings in the Expendable Pattern Casting Process. J. Mater. Sci. 1995, 30, 1584–1594. [Google Scholar] [CrossRef]
  17. Eguskiza, S.; Niklas, A.; Fernández-Calvo, A.I.; Santos, F.; Djurdjevic, M. Study of Strontium Fading in Al-Si-Mg and Al-Si-Mg-Cu Alloy by Thermal Analysis. Int. J. Met. 2015, 9, 43–50. [Google Scholar] [CrossRef]
  18. Dolata, A.J.; Dyzia, M.; Boczkal, S. Influence of the Sr and Mg Alloying Additions on the Bonding between Matrix and Reinforcing Particles in the AlSi7Mg/SiC-Cg Hybrid Composite. Arch. Metall. Mater. 2016, 61, 651–656. [Google Scholar] [CrossRef]
  19. Ahmad, Z. (Ed.) Recent Trends in Processing and Degradation of Aluminium Alloys; InTech: Rijeka, Croatia, 2011; pp. 224–230. ISBN 978-953-307-734-5. [Google Scholar]
  20. Hao, J.; Yu, B.; Bian, J.; Chen, B.; Wu, H.; Li, W.; Li, Y.; Li, R. Calculation Based on the Formation of Mg2Si and Its Effect on the Microstructure and Properties of Al–Si Alloys. Materials 2021, 14, 6537. [Google Scholar] [CrossRef] [PubMed]
  21. di Giovanni, M.T.; Cerri, E.; Saito, T.; Akhtar, S.; Åsholt, P.; Li, Y.; di Sabatino, M. How Slight Solidification Rate Variations within Cast Plate Affect Mechanical Response: A Study on As-Cast A356 Alloy with Cu Additions. Adv. Mater. Sci. Eng. 2018, 2018, 4030689. [Google Scholar] [CrossRef]
  22. Bobel, A.; Kim, K.; Wolverton, C.; Walker, M.; Olson, G.B. Equilibrium Composition Variation of Q-Phase Precipitates in Aluminum Alloys. Acta Mater. 2017, 138, 150–160. [Google Scholar] [CrossRef]
  23. Ebhota, W.S.; Jen, T.-C. Intermetallics Formation and Their Effect on Mechanical Properties of Al-Si-X Alloys. In Intermetallic Compounds—Formation and Applications; InTech: Rijeka, Croatia, 2018. [Google Scholar]
Figure 1. (a) Melting in a steel crucible; (b) Casting from steel mould for mechanical testing; (c) Casting from Croning cell, sectioned for different tests.
Crystals 13 00757 g001
Figure 2. (a) The chemical composition of all samples; (b) The amounts of phases in all samples predicted by CALPHAD calculations.
Crystals 13 00757 g002
Figure 3. (a) Isopleth phase diagram for sample 226-100; (b) Phase fraction versus temperature for sample 226-100; (c) Magnification of (b); (d) Phase fraction versus temperature for sample 226-00; (e) Magnification of (d).
Crystals 13 00757 g003
Figure 4. Scheil model of solidification of: (a) Sample 226-100; (b) Sample 226-80; (c) Sample 226-60; (d) Sample 226-440; (e) Sample 226-20; (f) Sample 226-00.
Crystals 13 00757 g004
Figure 5. Cooling curve and its derivative for samples (a) 226-100; (b) 226-00.
Crystals 13 00757 g005
Figure 6. SEM micrographs with marked spots of EDS analyses: (a) Sample 226-00; (b) Sample 226-100; (c) Sample 226-20.
Crystals 13 00757 g006
Figure 7. Optical micrographs with marked phases (green arrows mark the α-Al15(Fe, Mn)3Si2 phase, red arrows mark the β-AlFeSi phase): (a) Sample 226-100; (b) Sample 226-80; (c) Sample 226-60; (d) Sample 226-40; (e) Sample 226-20; (f) Sample 226-00.
Crystals 13 00757 g007
Figure 8. (a) Mechanical properties from the tensile tests; (b) Hardness measurements over time.
Crystals 13 00757 g008
Table 1. Chemical composition of AlSi9Cu3 base alloy and foundry scrap returns in wt%.
ElementSiFeCuMnMgCrNiZn
Base7.510.59732.9550.27380.33660.04070.02440.6846
Scrap7.5040.60952.9950.18380.25470.03050.04320.7343
ElementTiAgBBeBiCaCdCe
Base0.0951<0.000010.00150.000010.0020.00220.00019<0.00010
Scrap0.108<0.000010.00210.000010.00310.000830.00032<0.00010
ElementCoGaHgLiNaPPbSb
Base0.00140.012<0.00010.00003<0.000020.00090.03670.0022
Scrap0.000830.0125<0.00010.00003<0.000060.000830.05820.0006
Table 2. Sample designations and additions of scrap returns to the base alloy.
Sample DesignationBase
Alloy/wt%
Base Alloy/gScrap Return/wt% Scrap Return/g
226-1001002030.800
226-80801607.020414.5
226-60601200.840784.1
226-4040795.2601204.7
226-2020395.1801620.6
226-00001002030.7
Table 3. EDS analyses in at% and determined phases from Figure 6.
·PhaseOAlSiCrMnFeCuZnMgCaSnPbSr
1Al2Cu1.863.81.5···32.9······
2α-Al15(Fe, Mn)3Si2·70.111.81.04.411.01.6······
3β-AlFeSi·65.120.8·1.512.7·······
4αAl-matrix·97.71.5···0.50.3·····
5βSi·27.672.1···0.2······
6Pb-rich phase41.911.14.7···2.9··2.33.229.8·
7Al2Cu1.319.731.2···10.9·4.2····
8Q-AlCuMgSi1.278.61.1···19.1·36.9····
9Al2SrSi22.131.852.9······0.7··12.6
10Pb-rich phase·6.991.1·····0.6·0.50.50.5
11βSi·5.494.6··········
Table 4. The number and amount of needle-like β-AlFeSi phase in all samples.
Sample DesignationArea/µm2Area%No.
226-100628.40540.1091097
226-80681.30810.1181215
226-60732.1280.12358911
226-402630.3120.45729731
226-202697.6560.46839132
226-004003.5380.69066733
Table 5. Results of Brinell hardness measurements (HBW 2.5/62.5) in HB.
Day/Sample226-100226-80226-60226-40226-20226-00
0818181807877
1858484848483
2858586878785
3909089898888
6909090919090
10919090919090
23969492929592
34949394939294
Disclaimer/Publisher’s Note: The statements, opinions and data contained in all publications are solely those of the individual author(s) and contributor(s) and not of MDPI and/or the editor(s). MDPI and/or the editor(s) disclaim responsibility for any injury to people or property resulting from any ideas, methods, instructions or products referred to in the content.

