
Evaluation of Thermal Stability and Its Effect on the Corrosion Behaviour of Mg-RE Alloys Processed by High-Pressure Torsion
 , , ,
, , ,  and
and
Abstract
:1. Introduction
2. Materials and Experimental Procedures
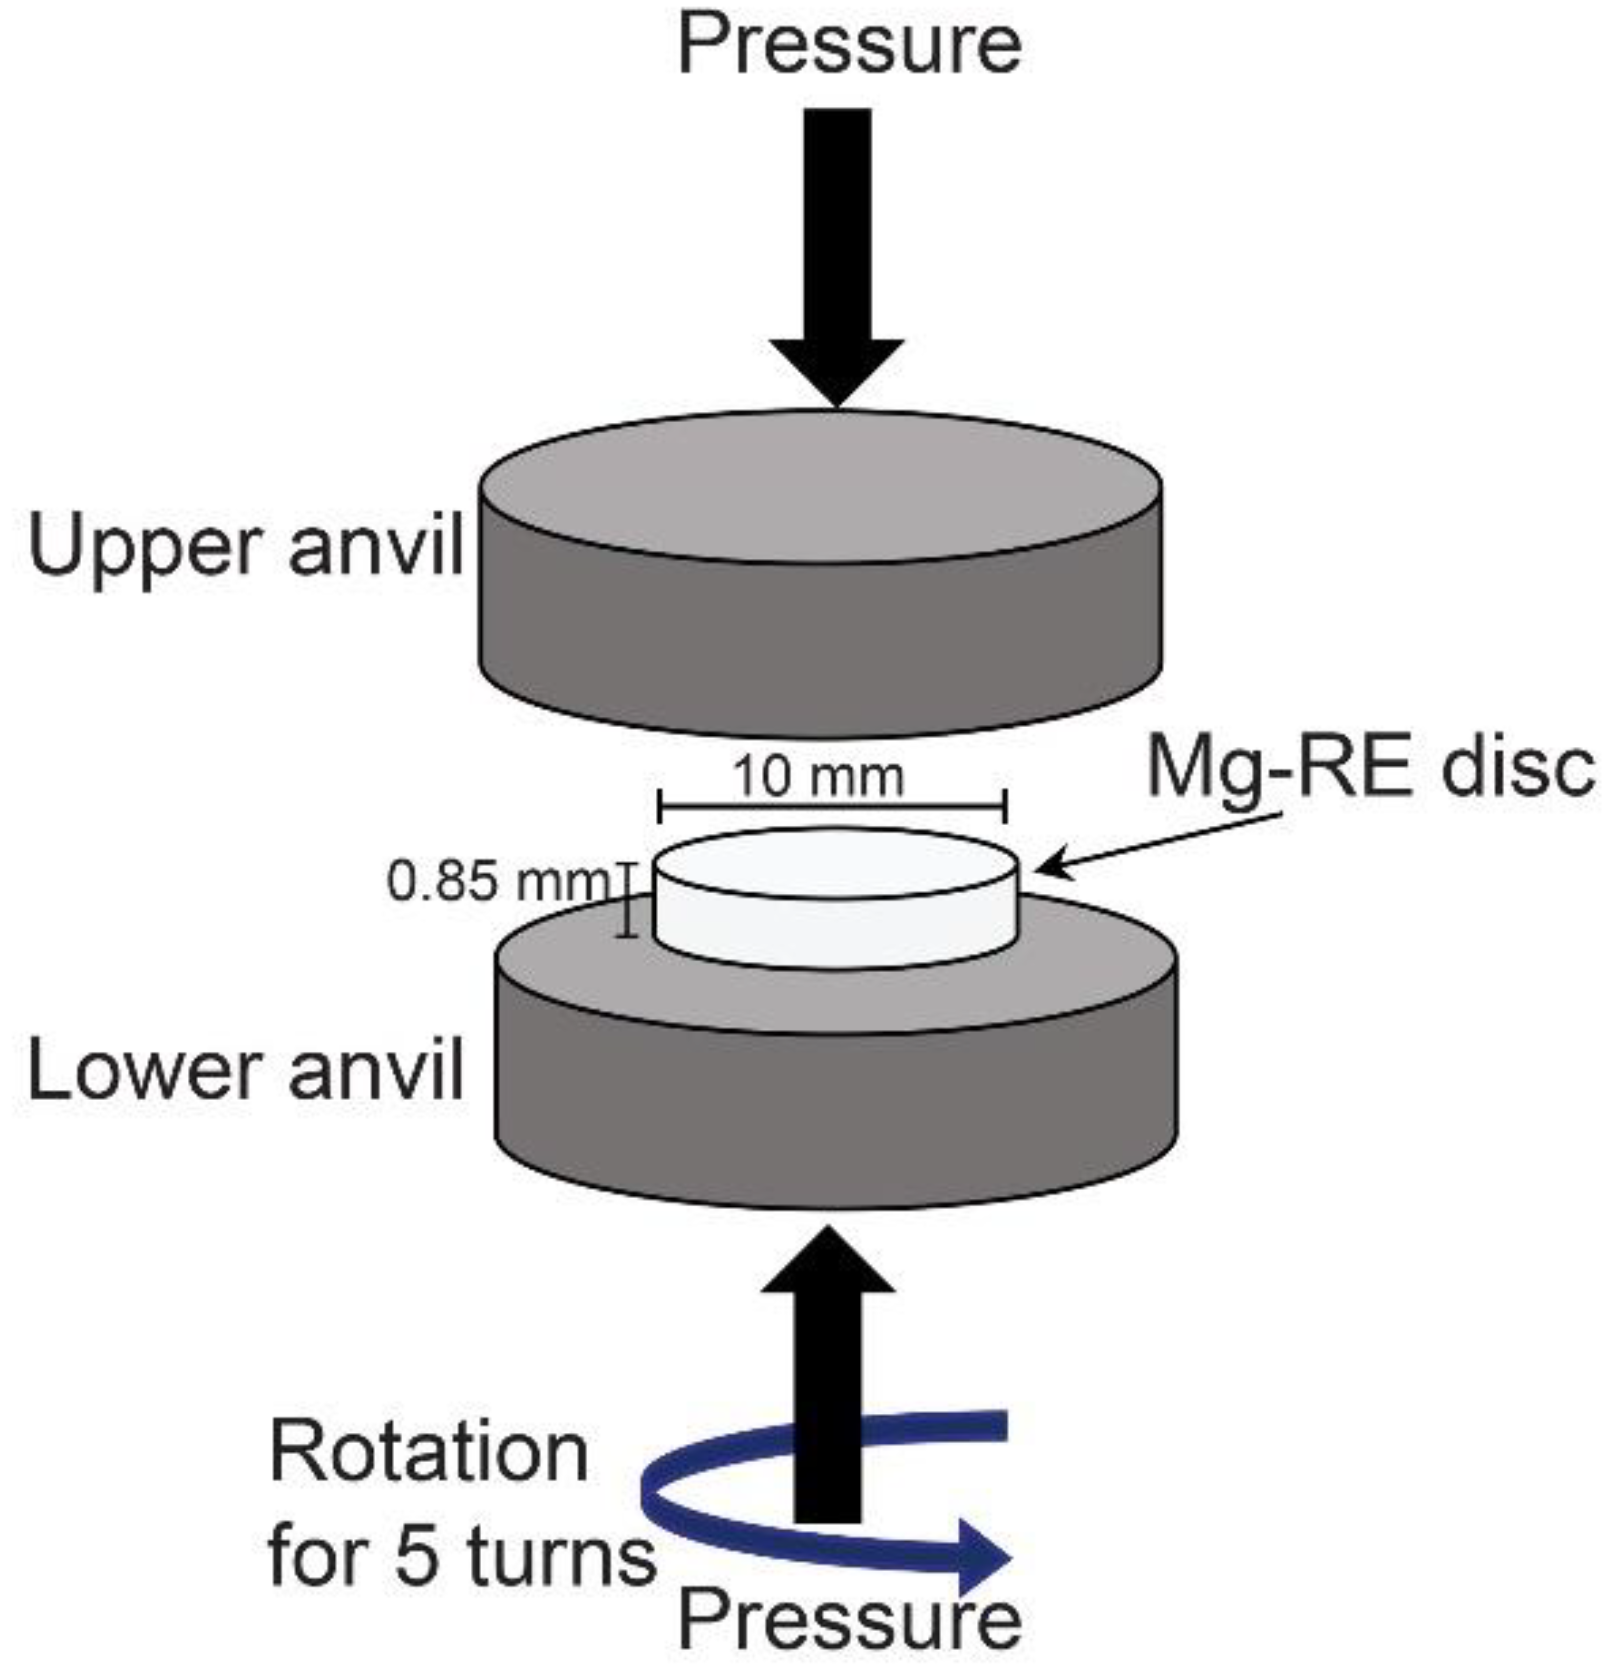
2.1. Materials
2.2. Microstructure and Texture Characterisation
2.3. Electrochemical Tests
3. Results
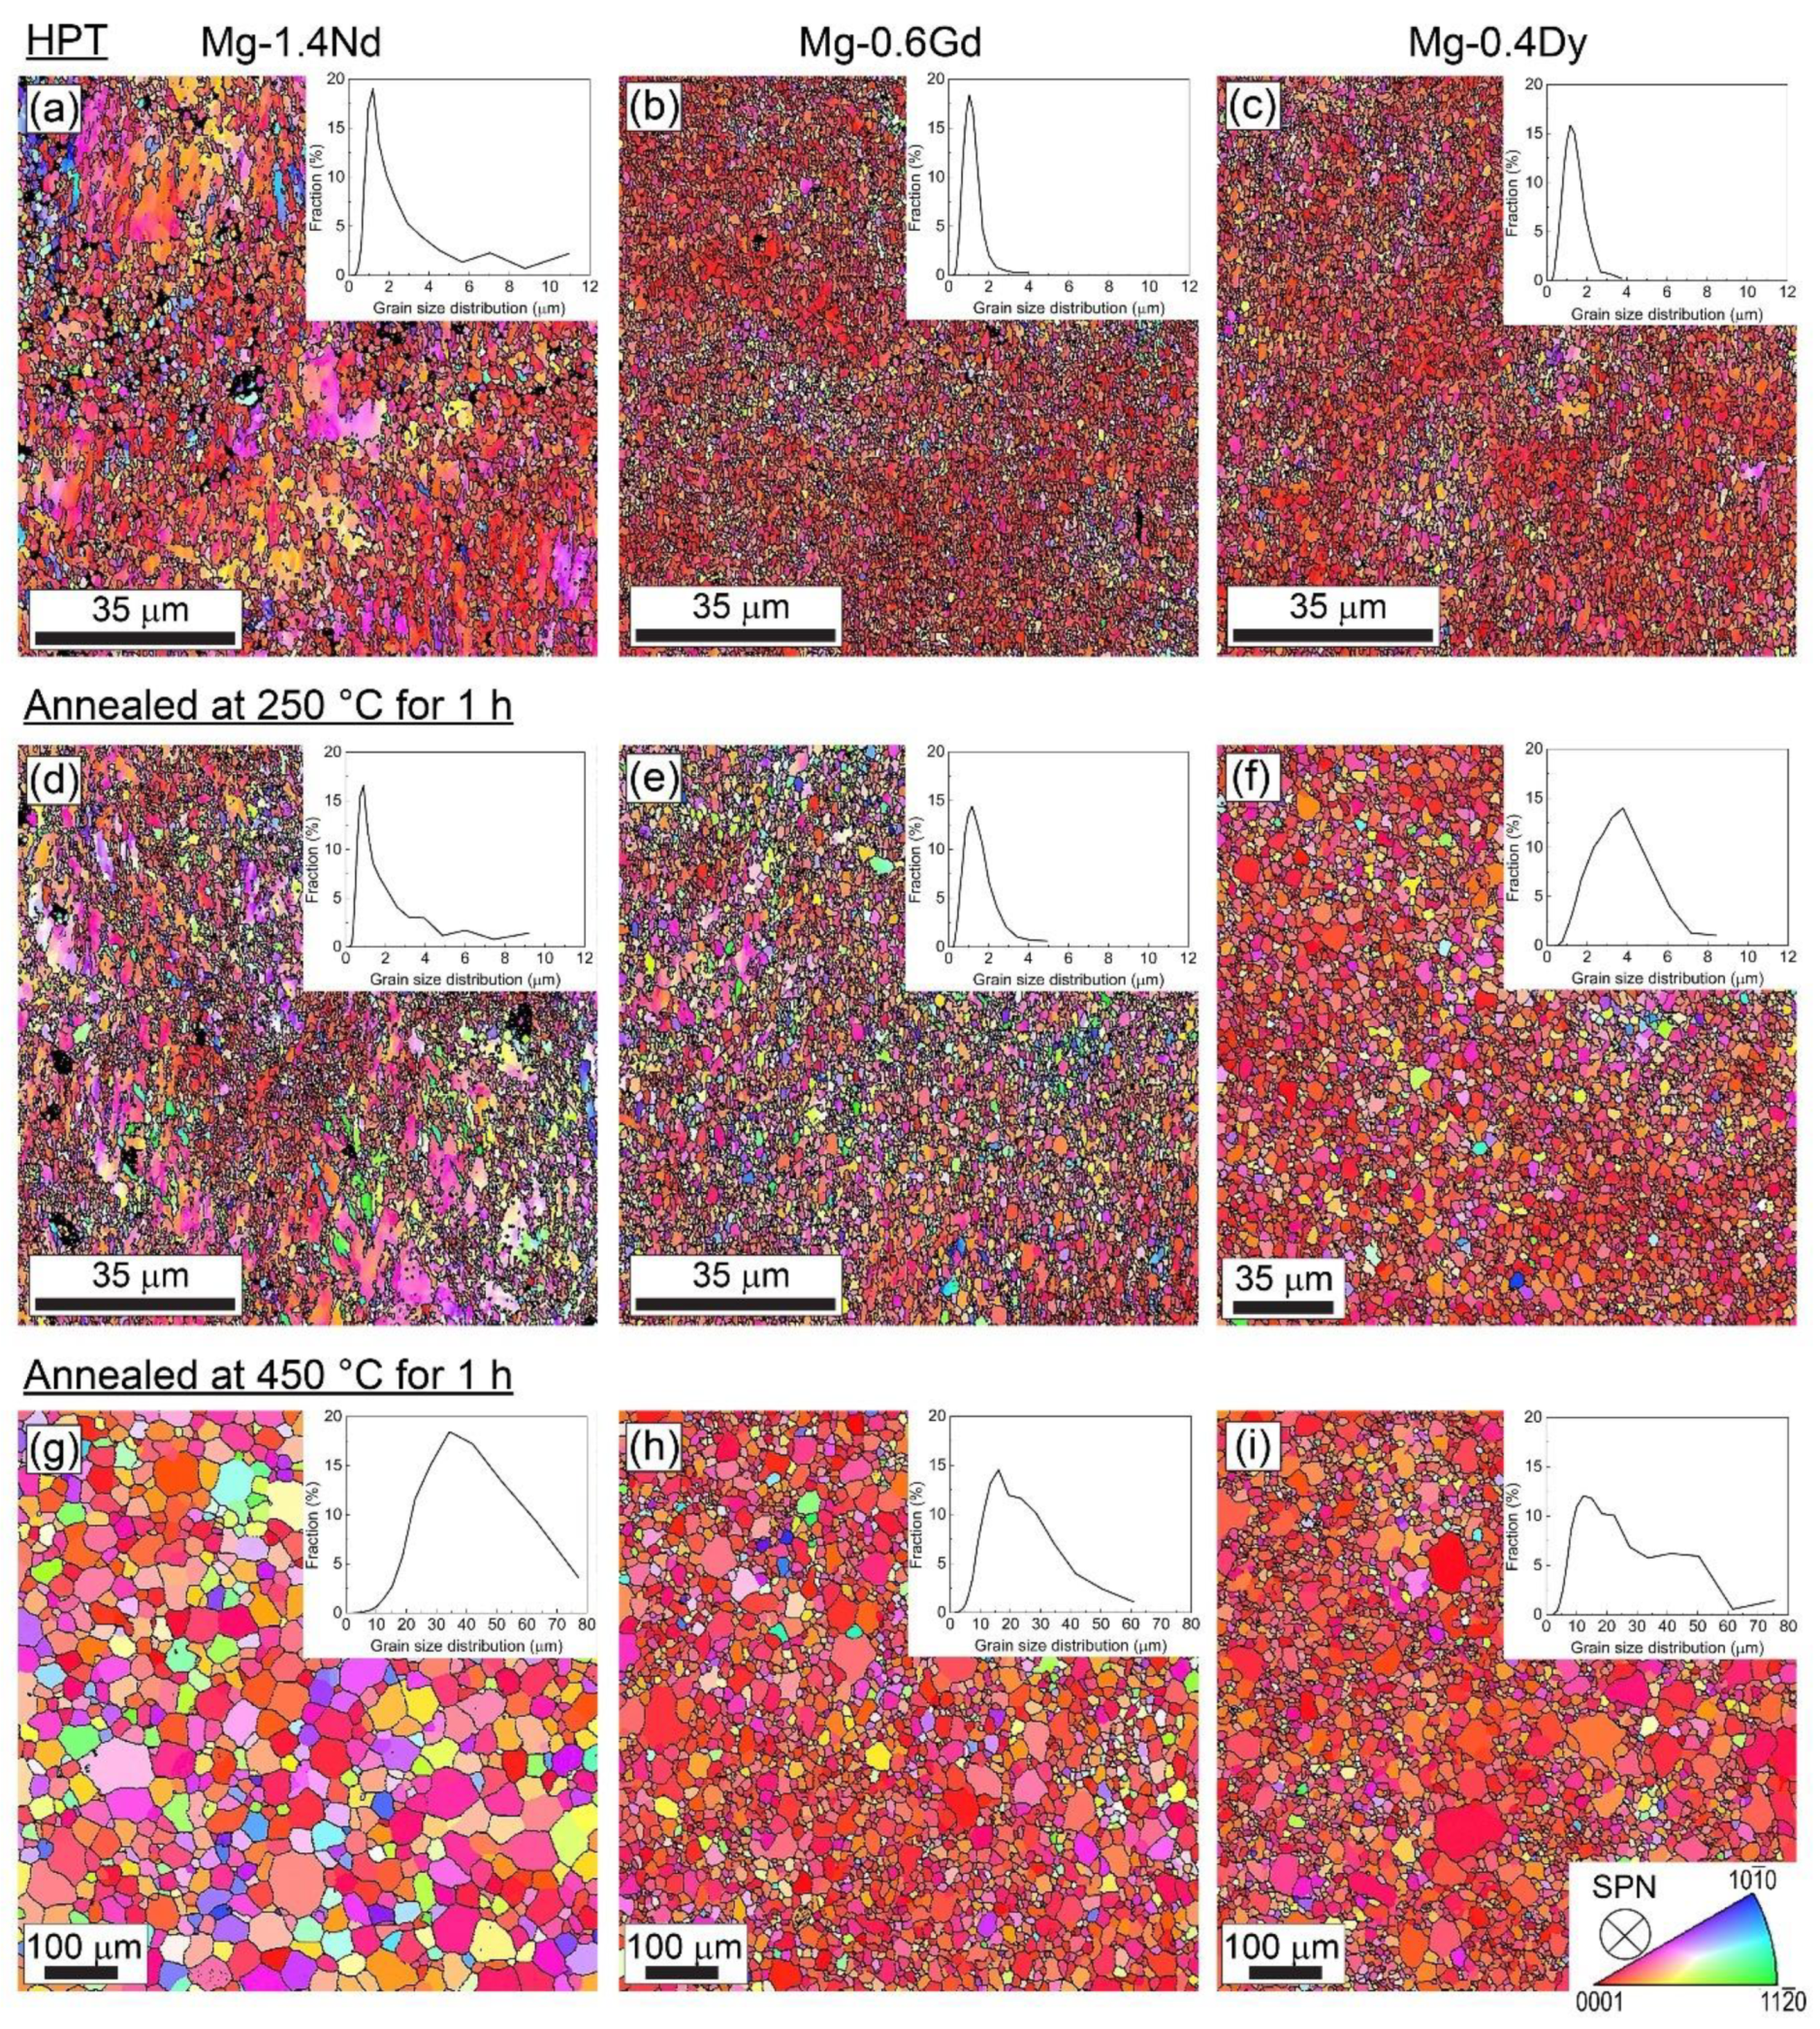
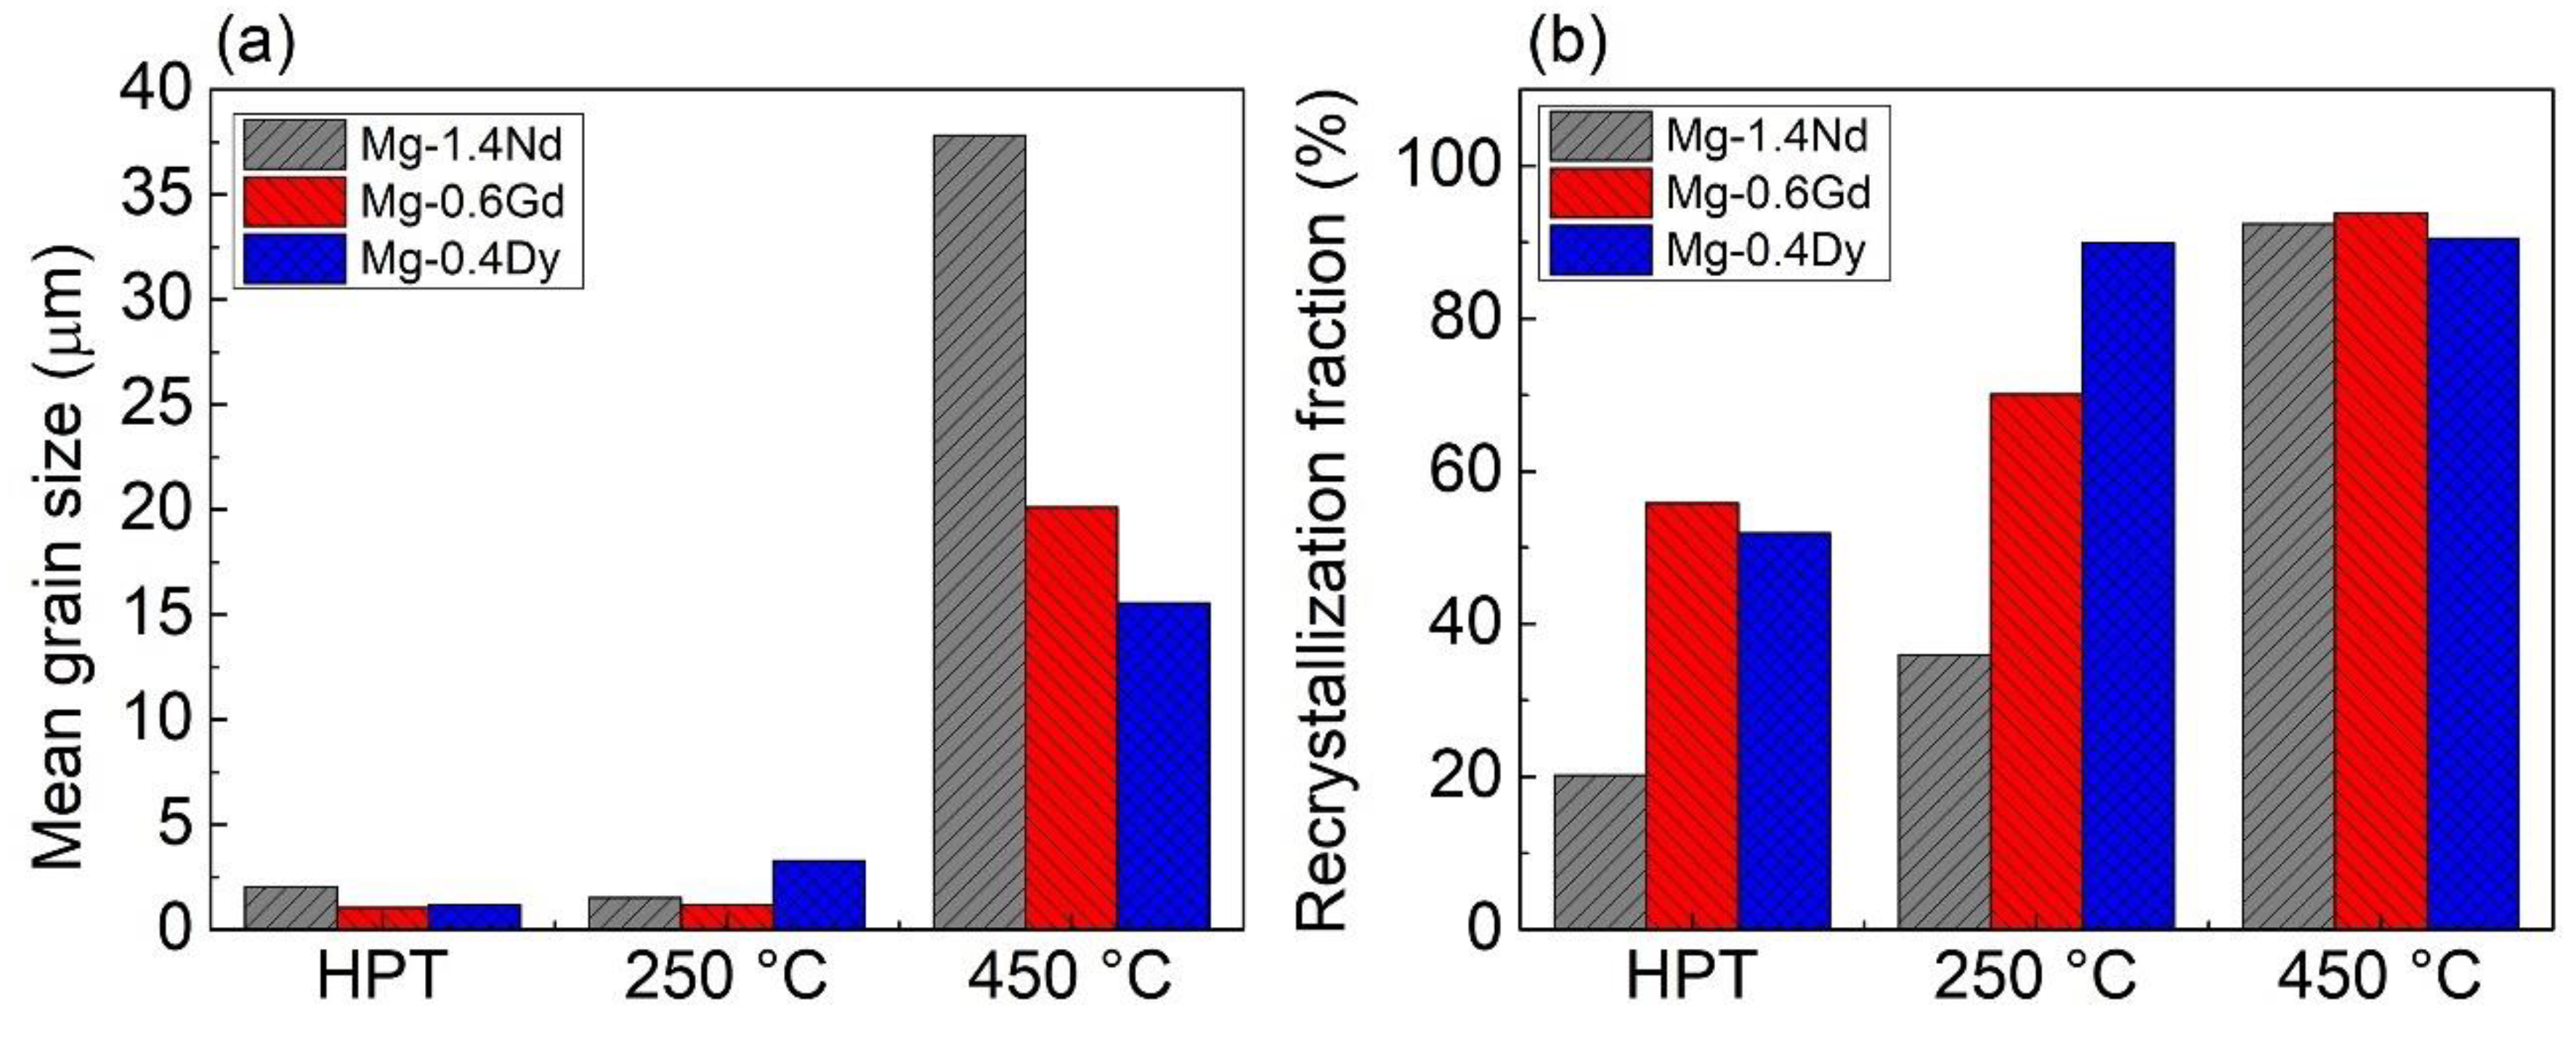
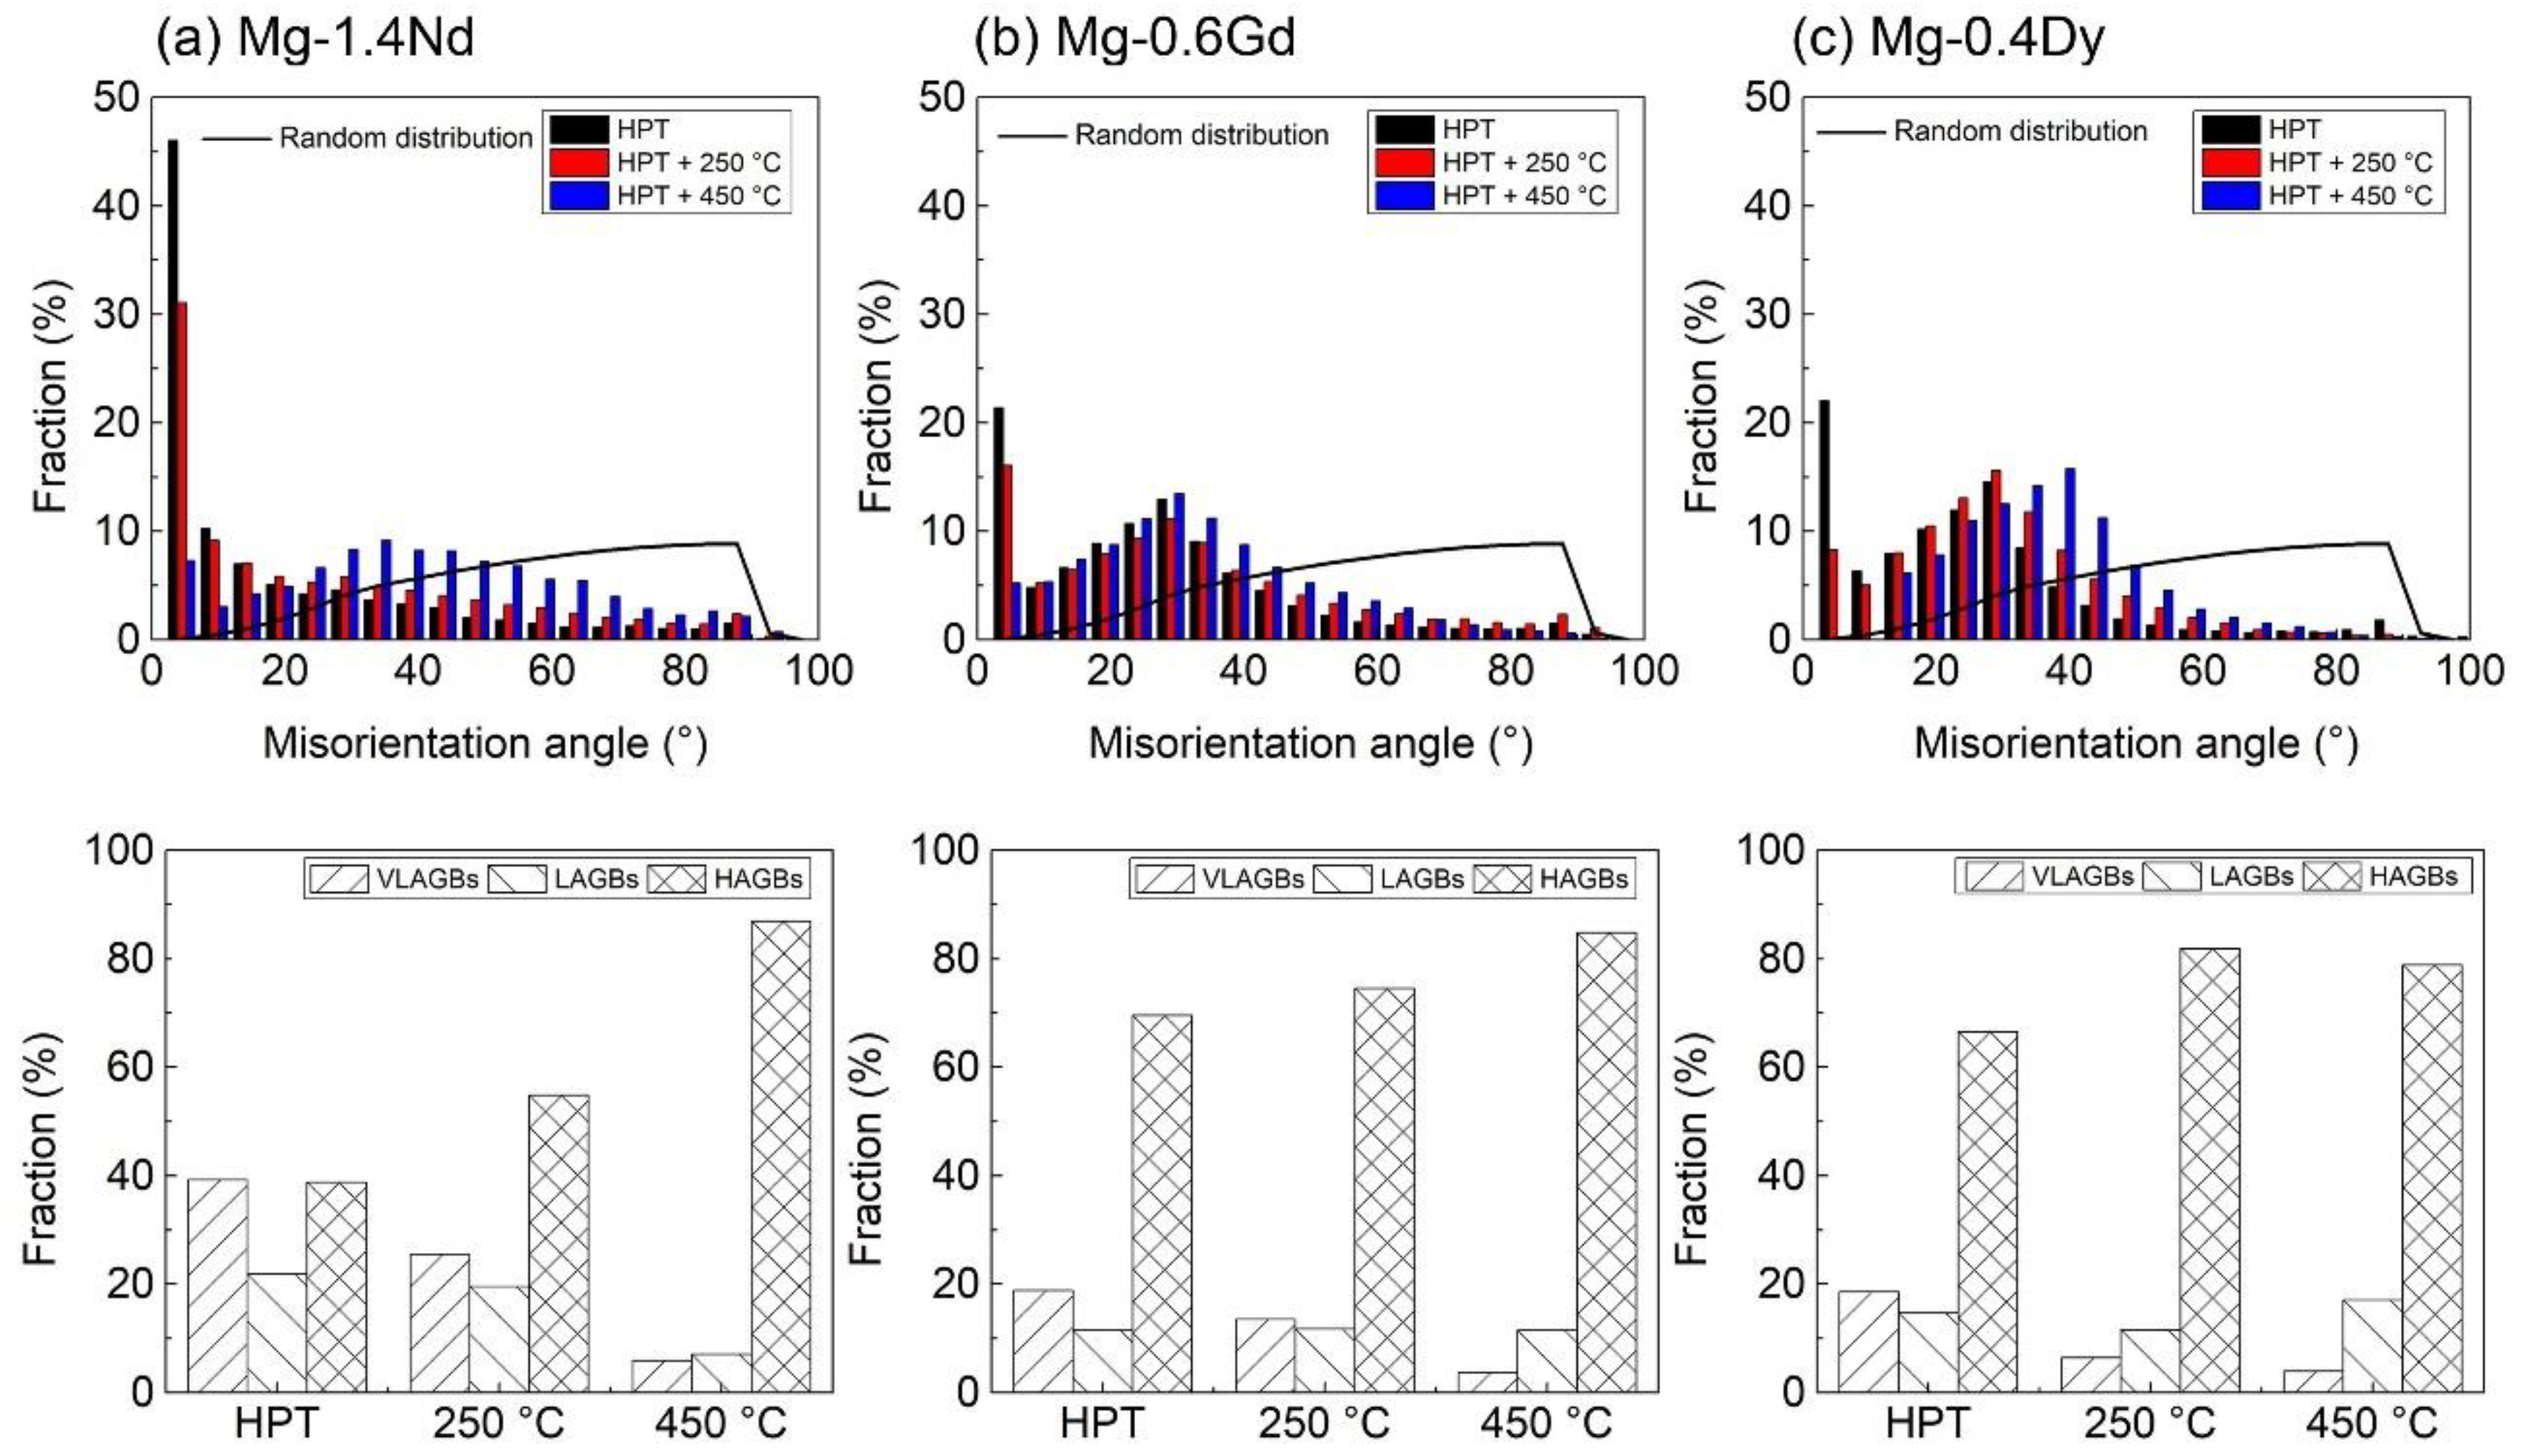
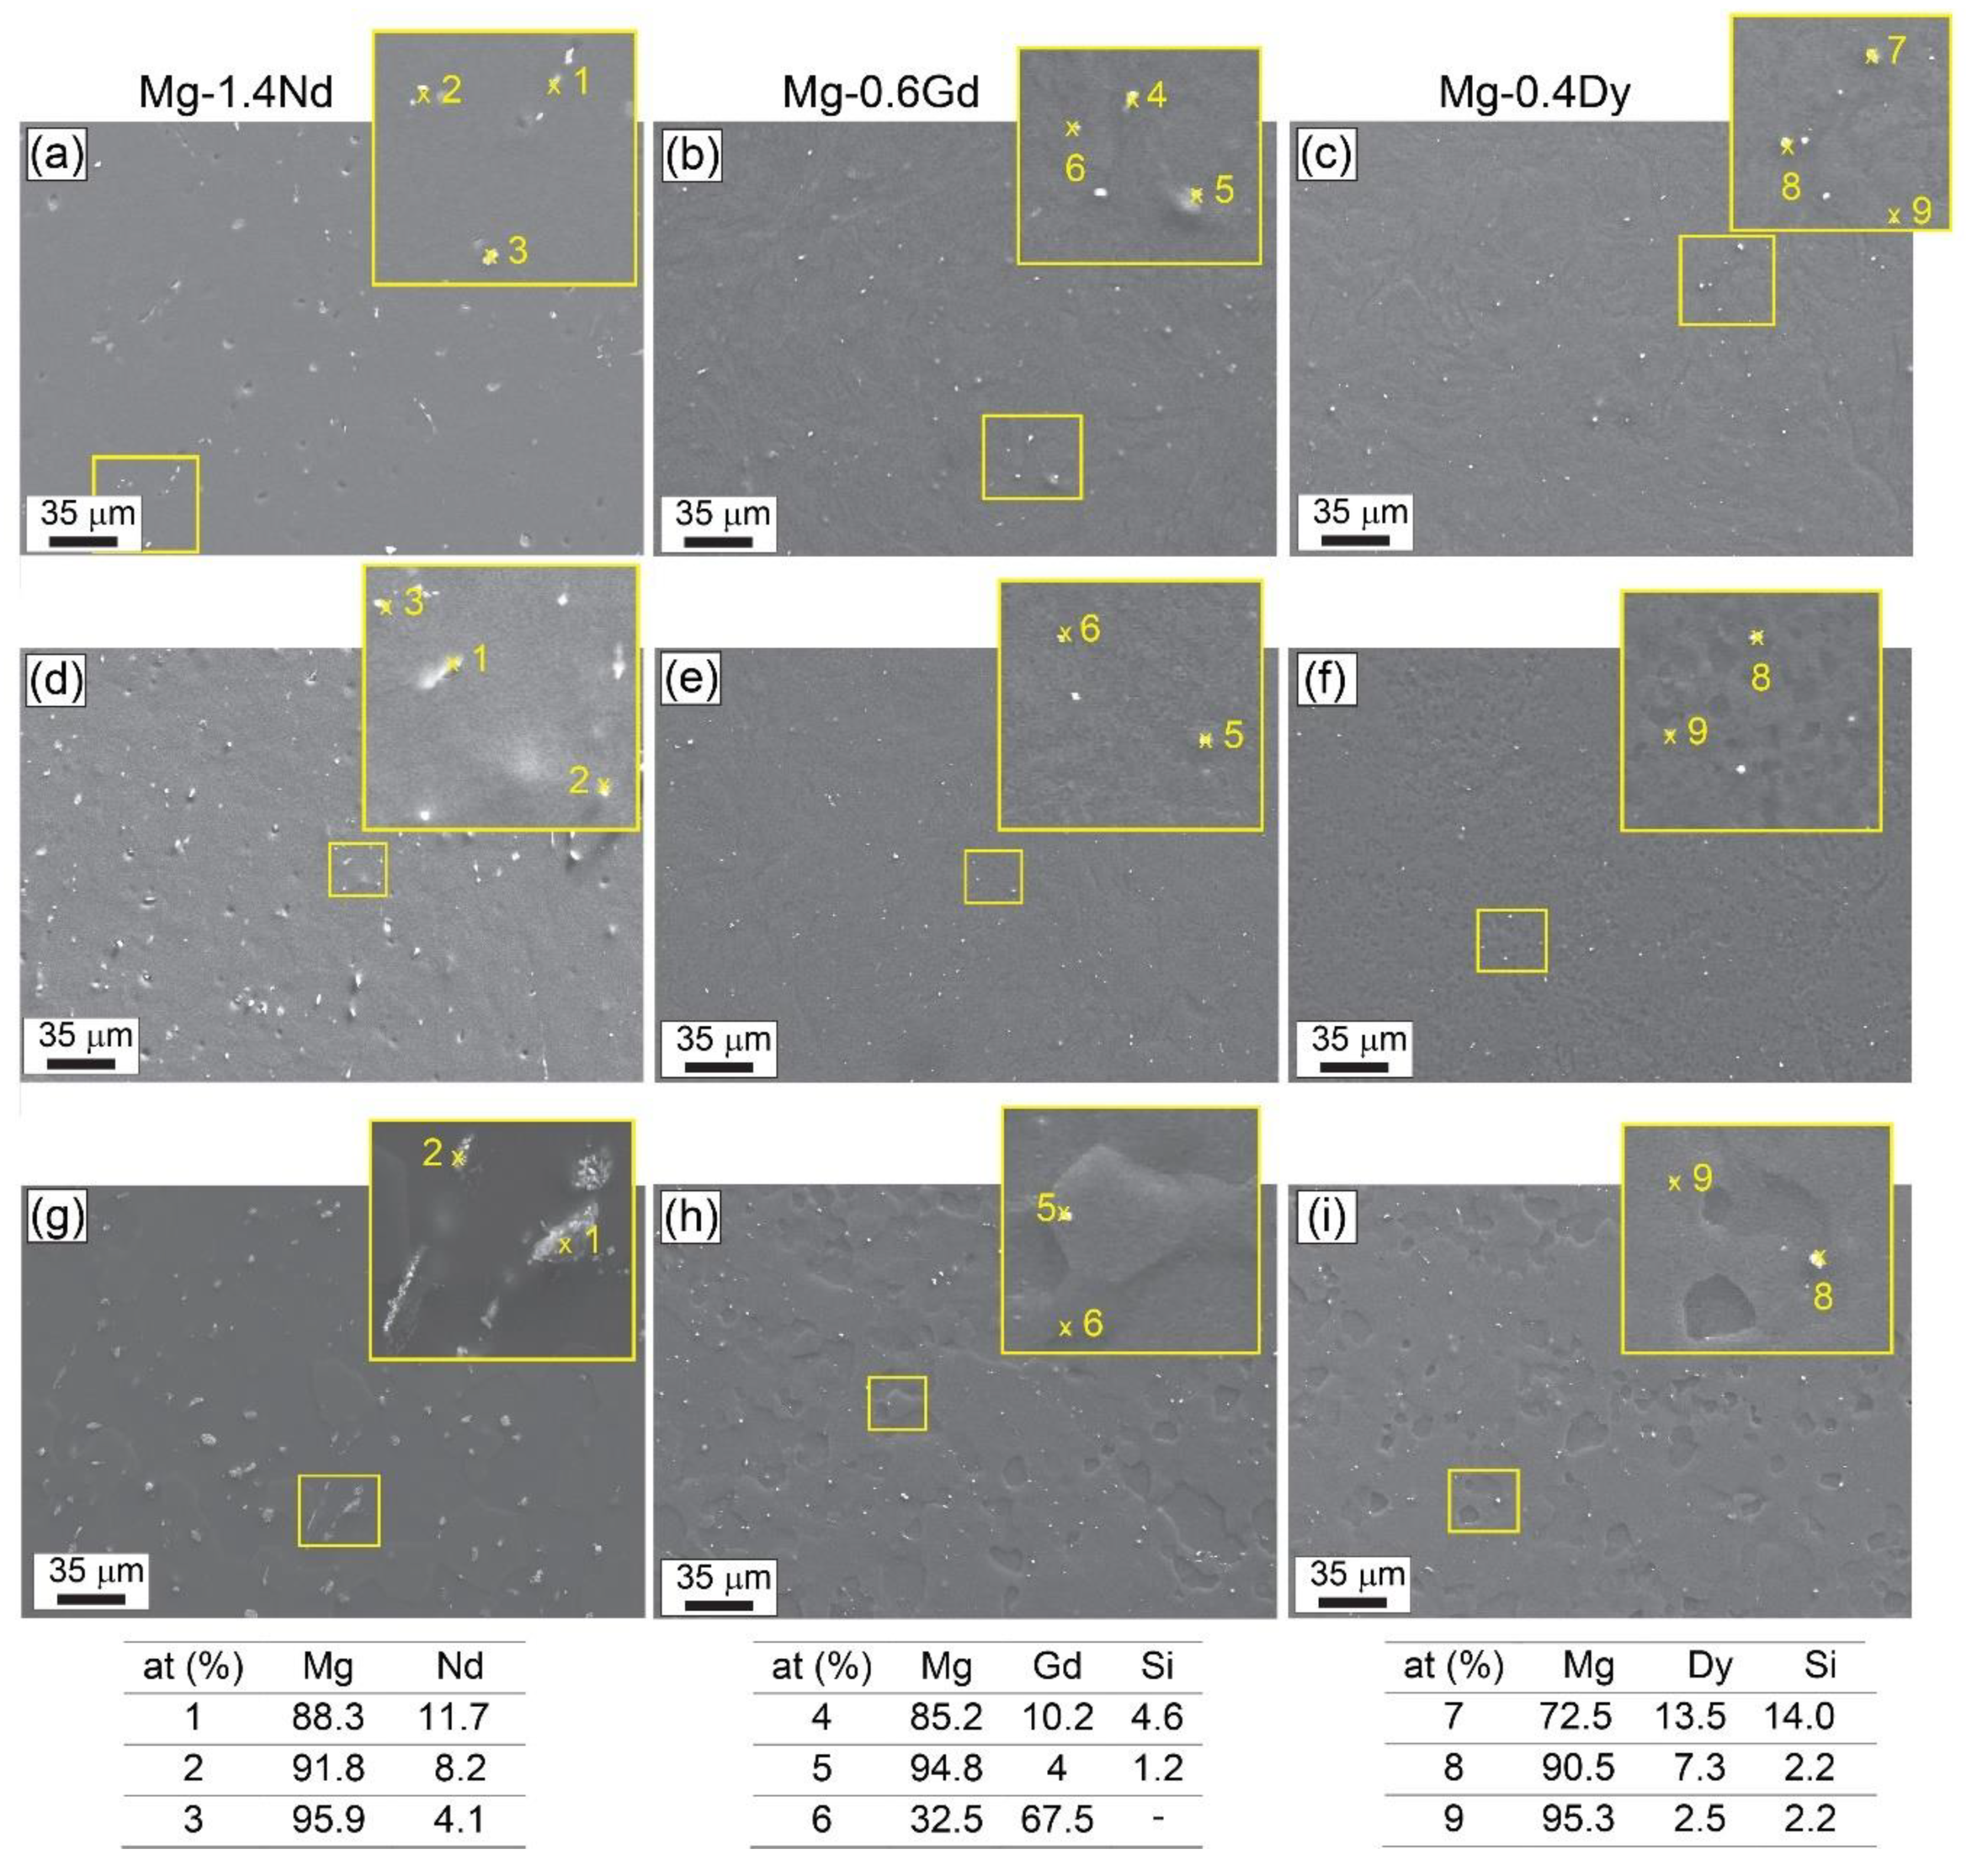
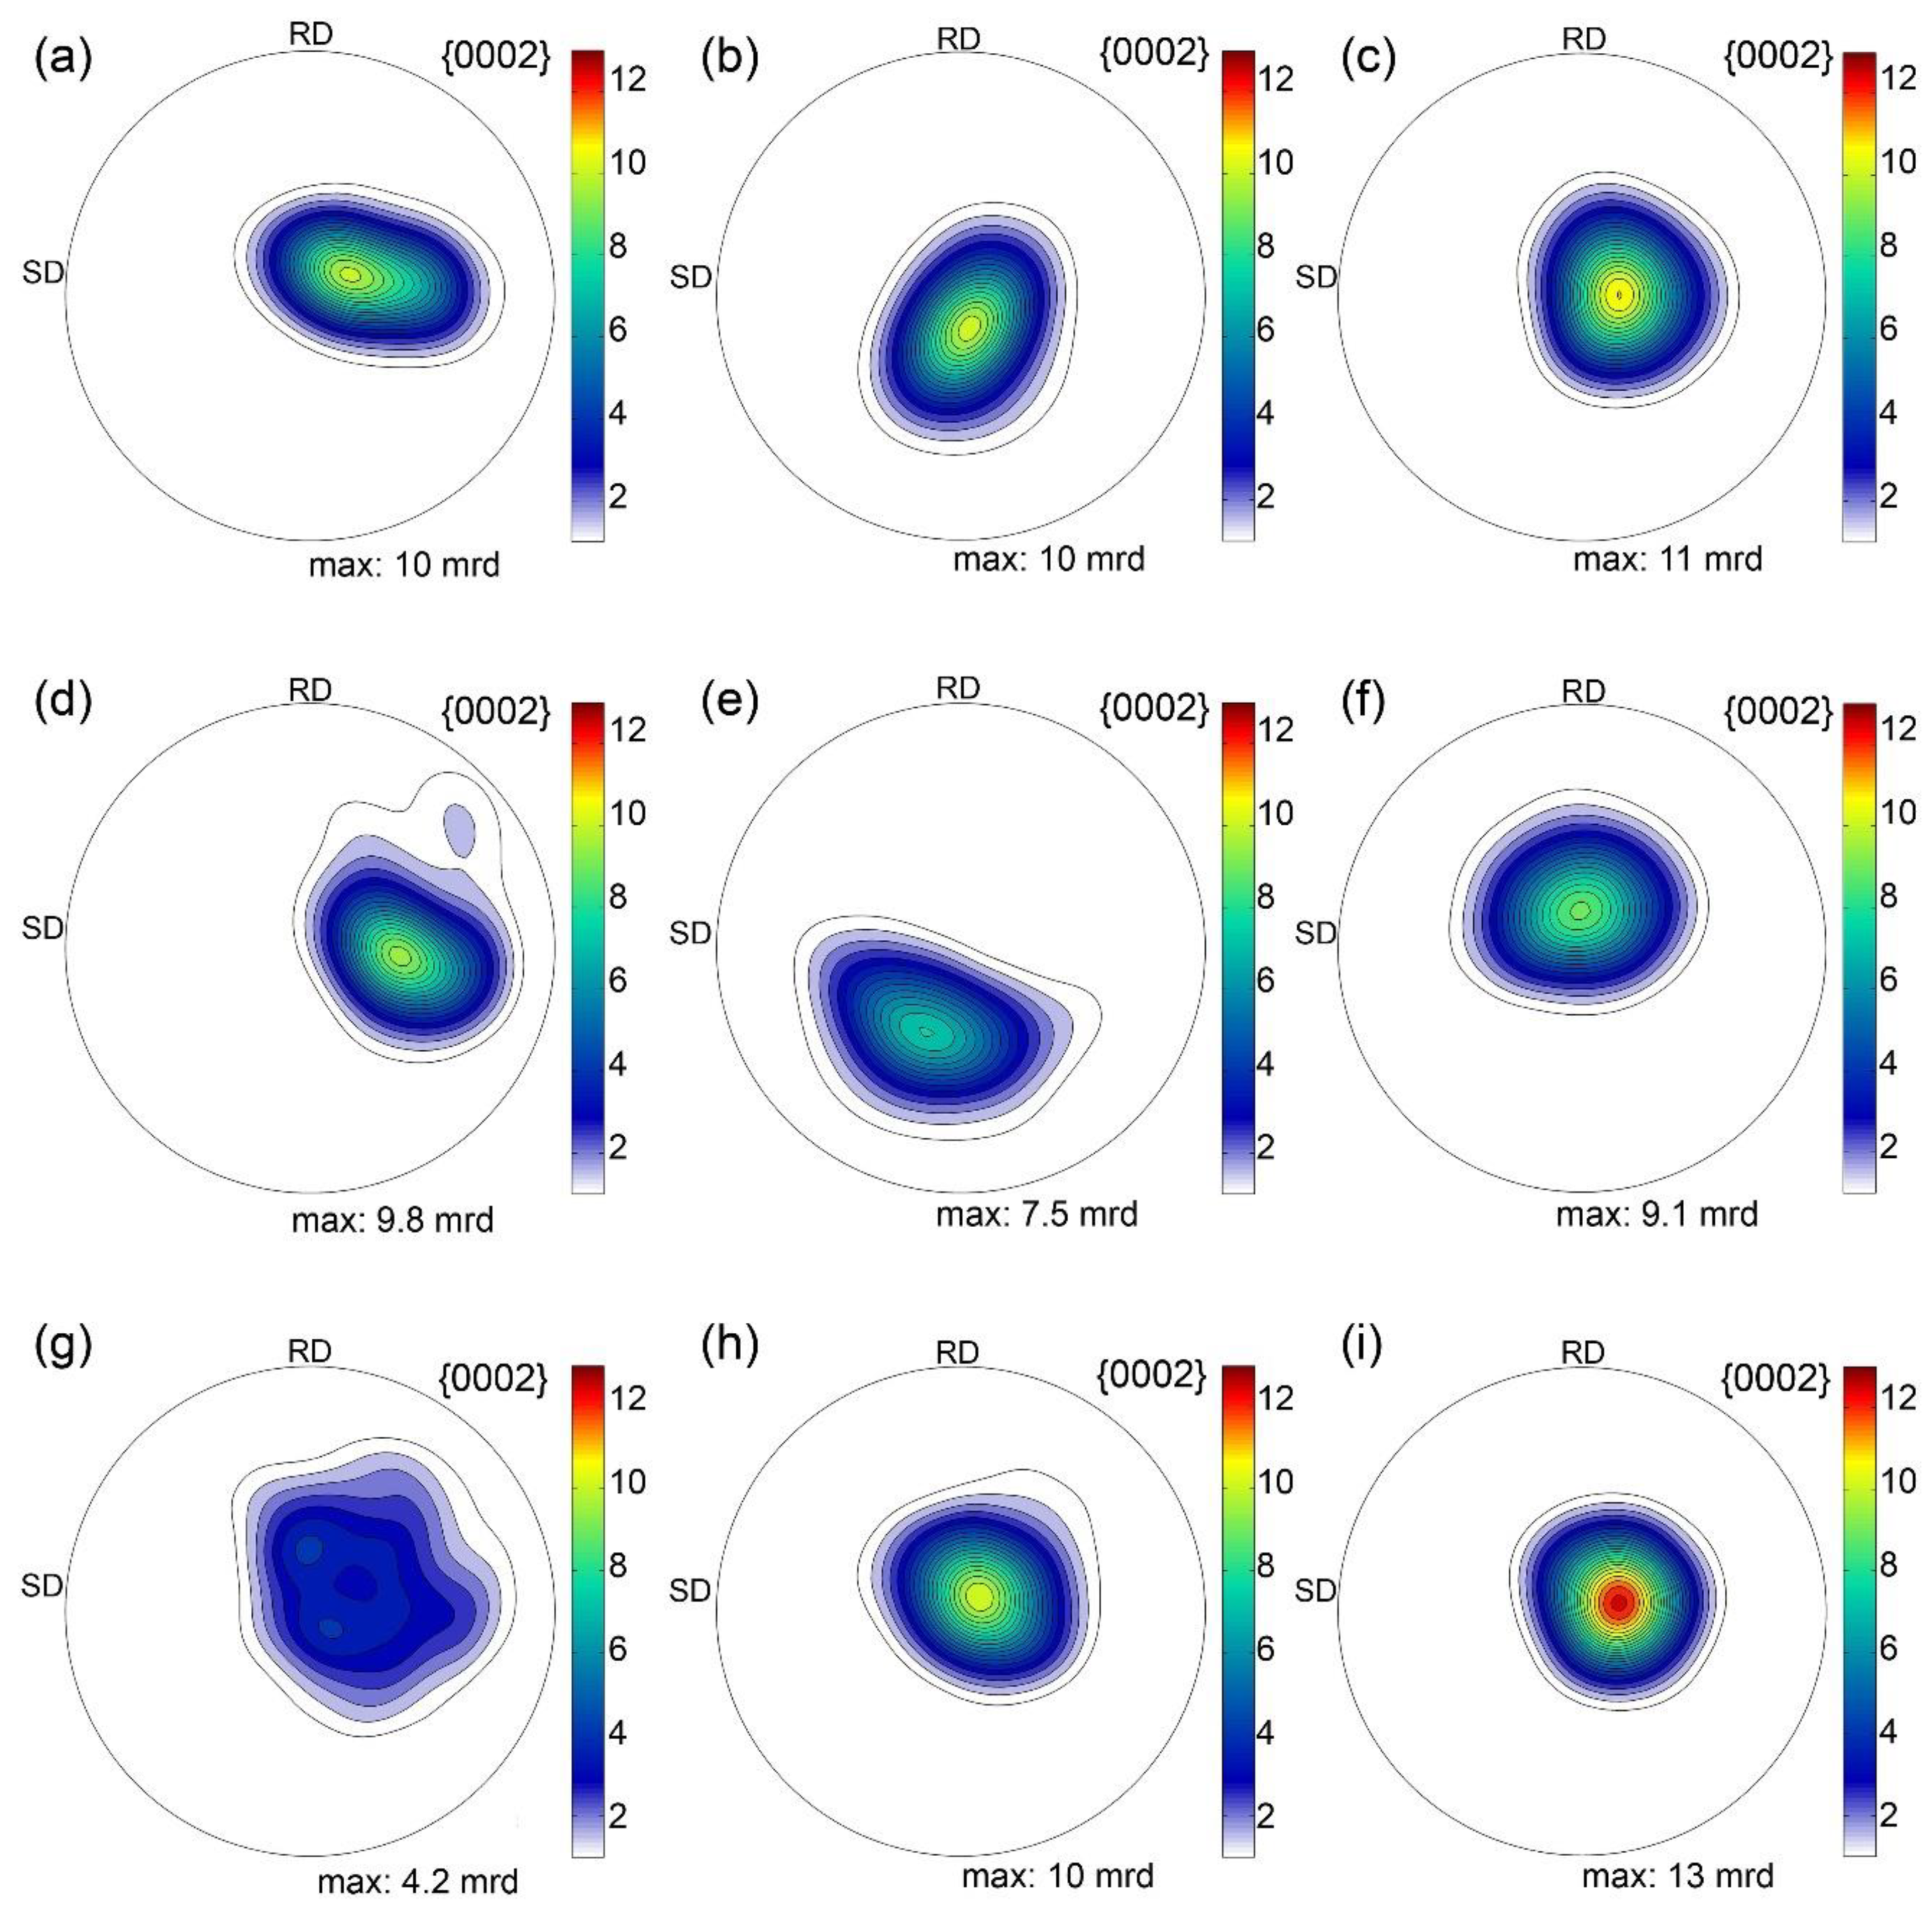
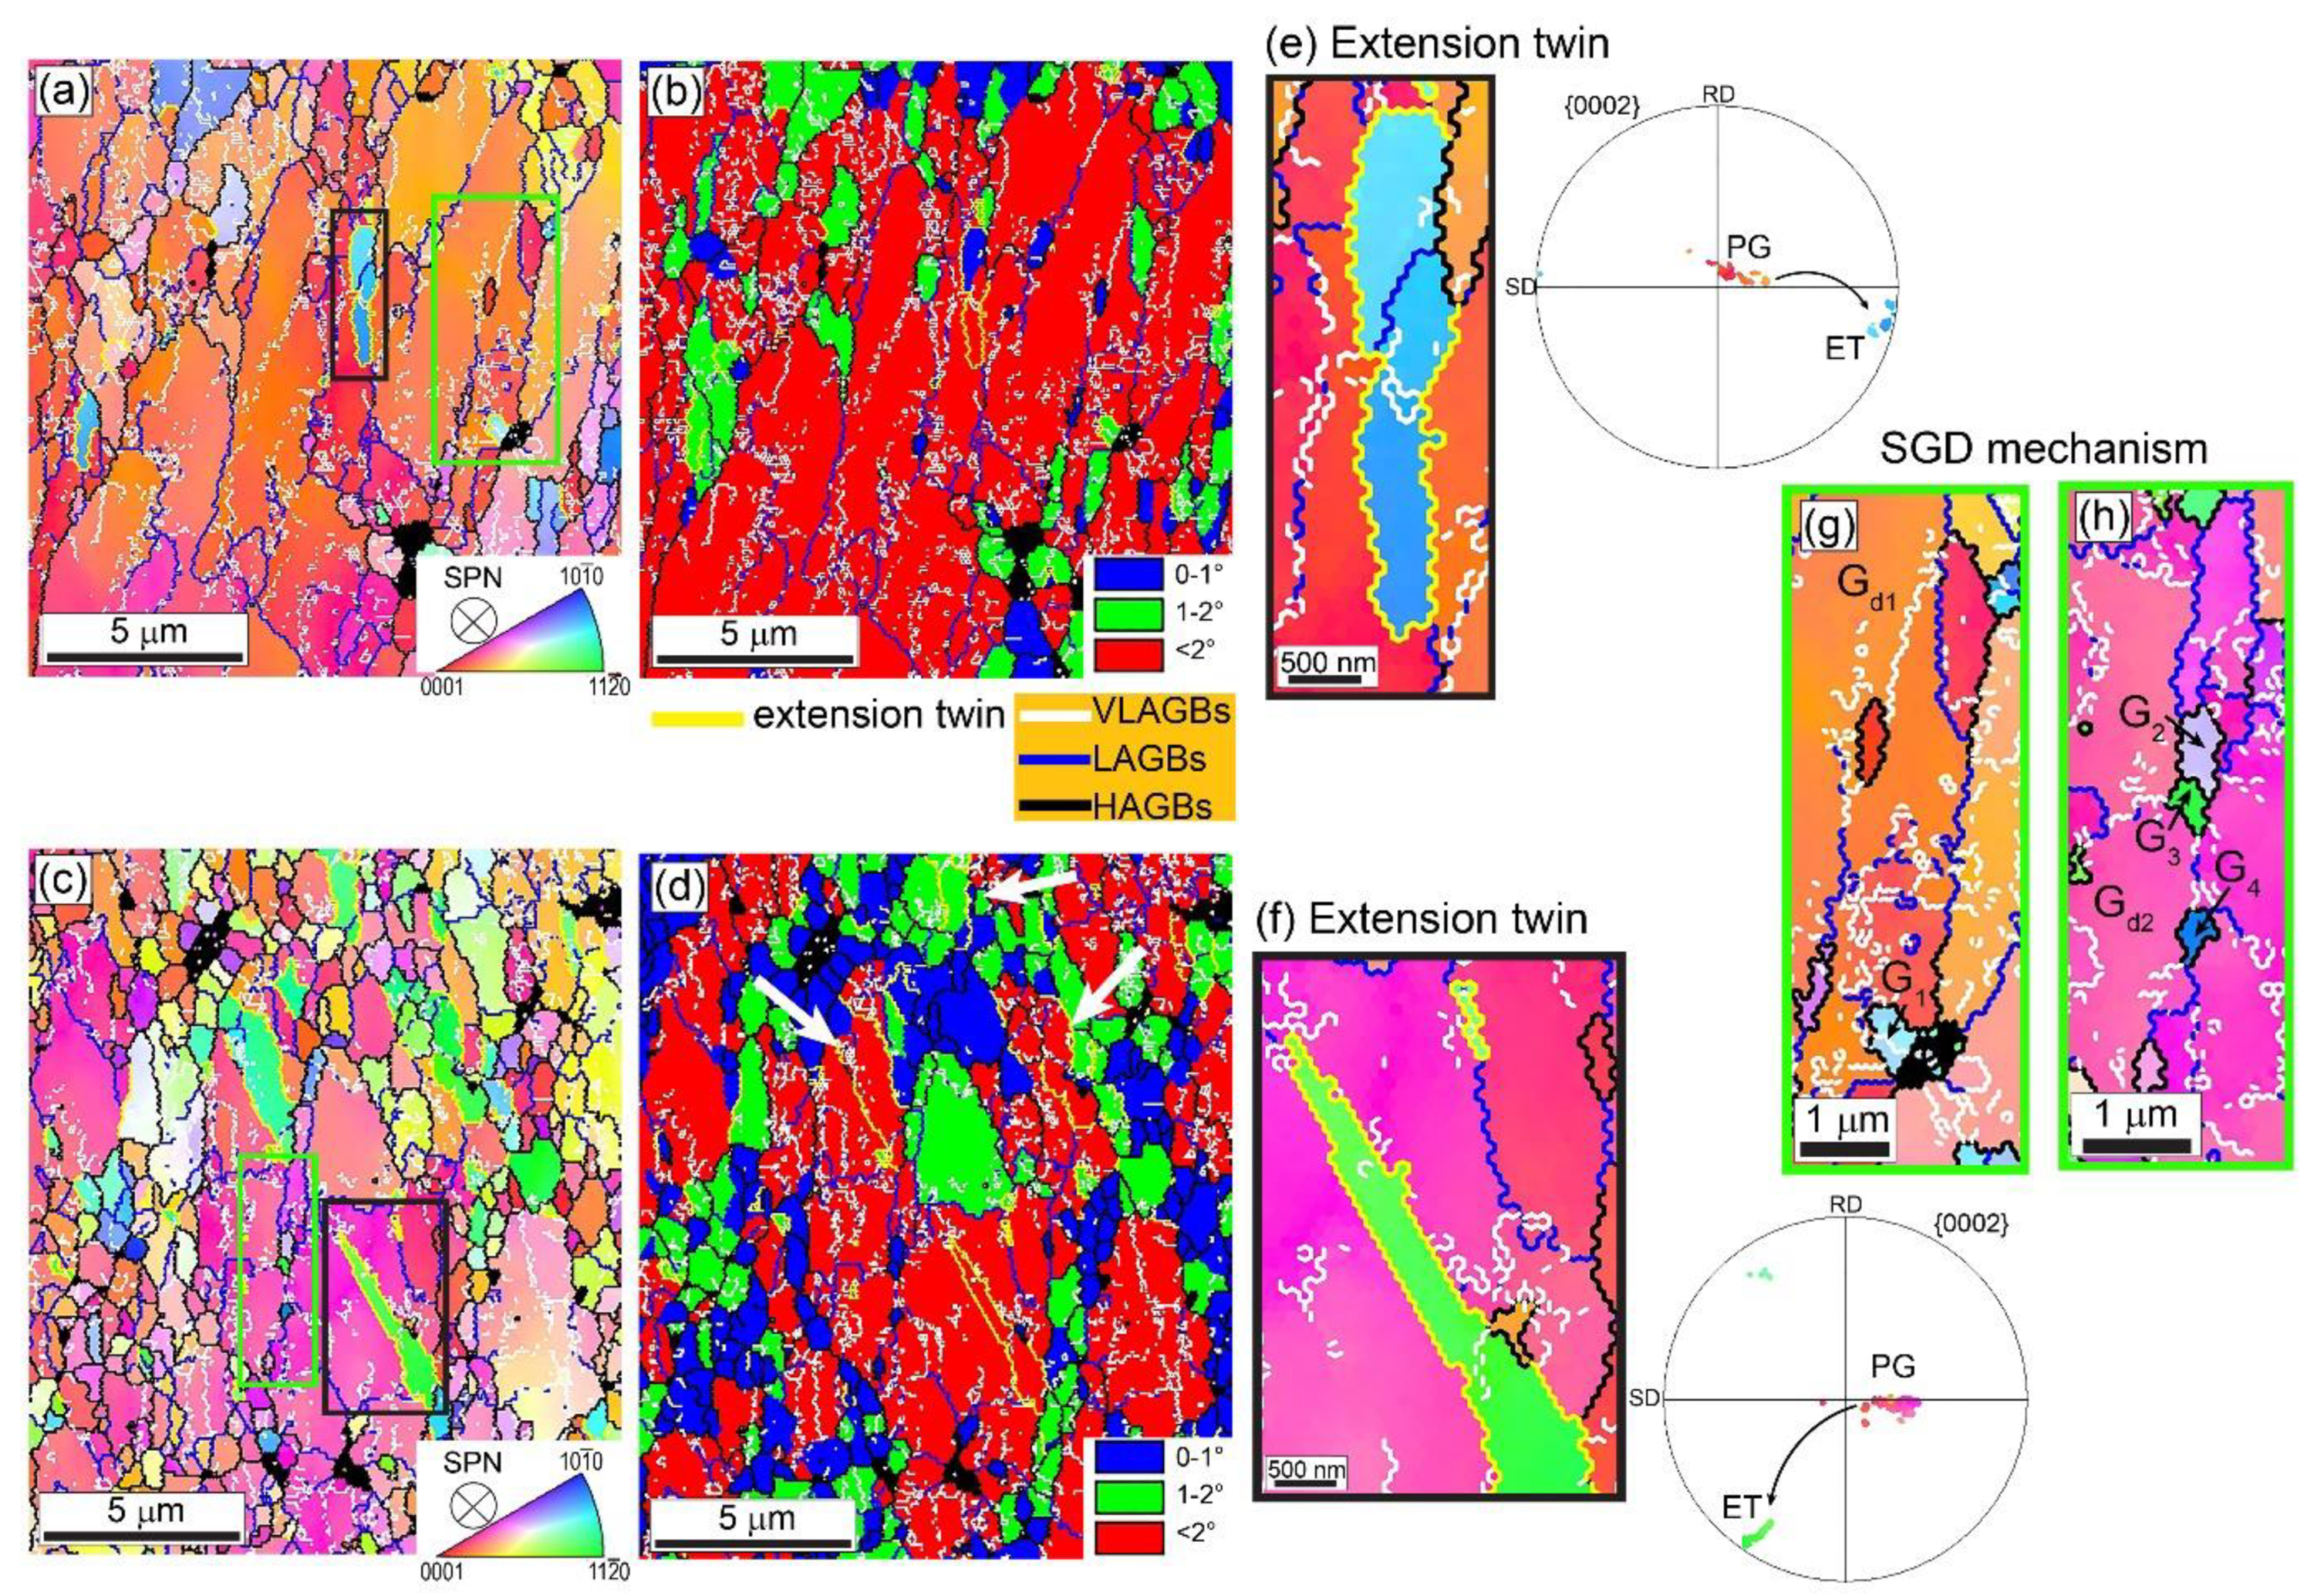
3.1. Microstructure and Texture Evolution
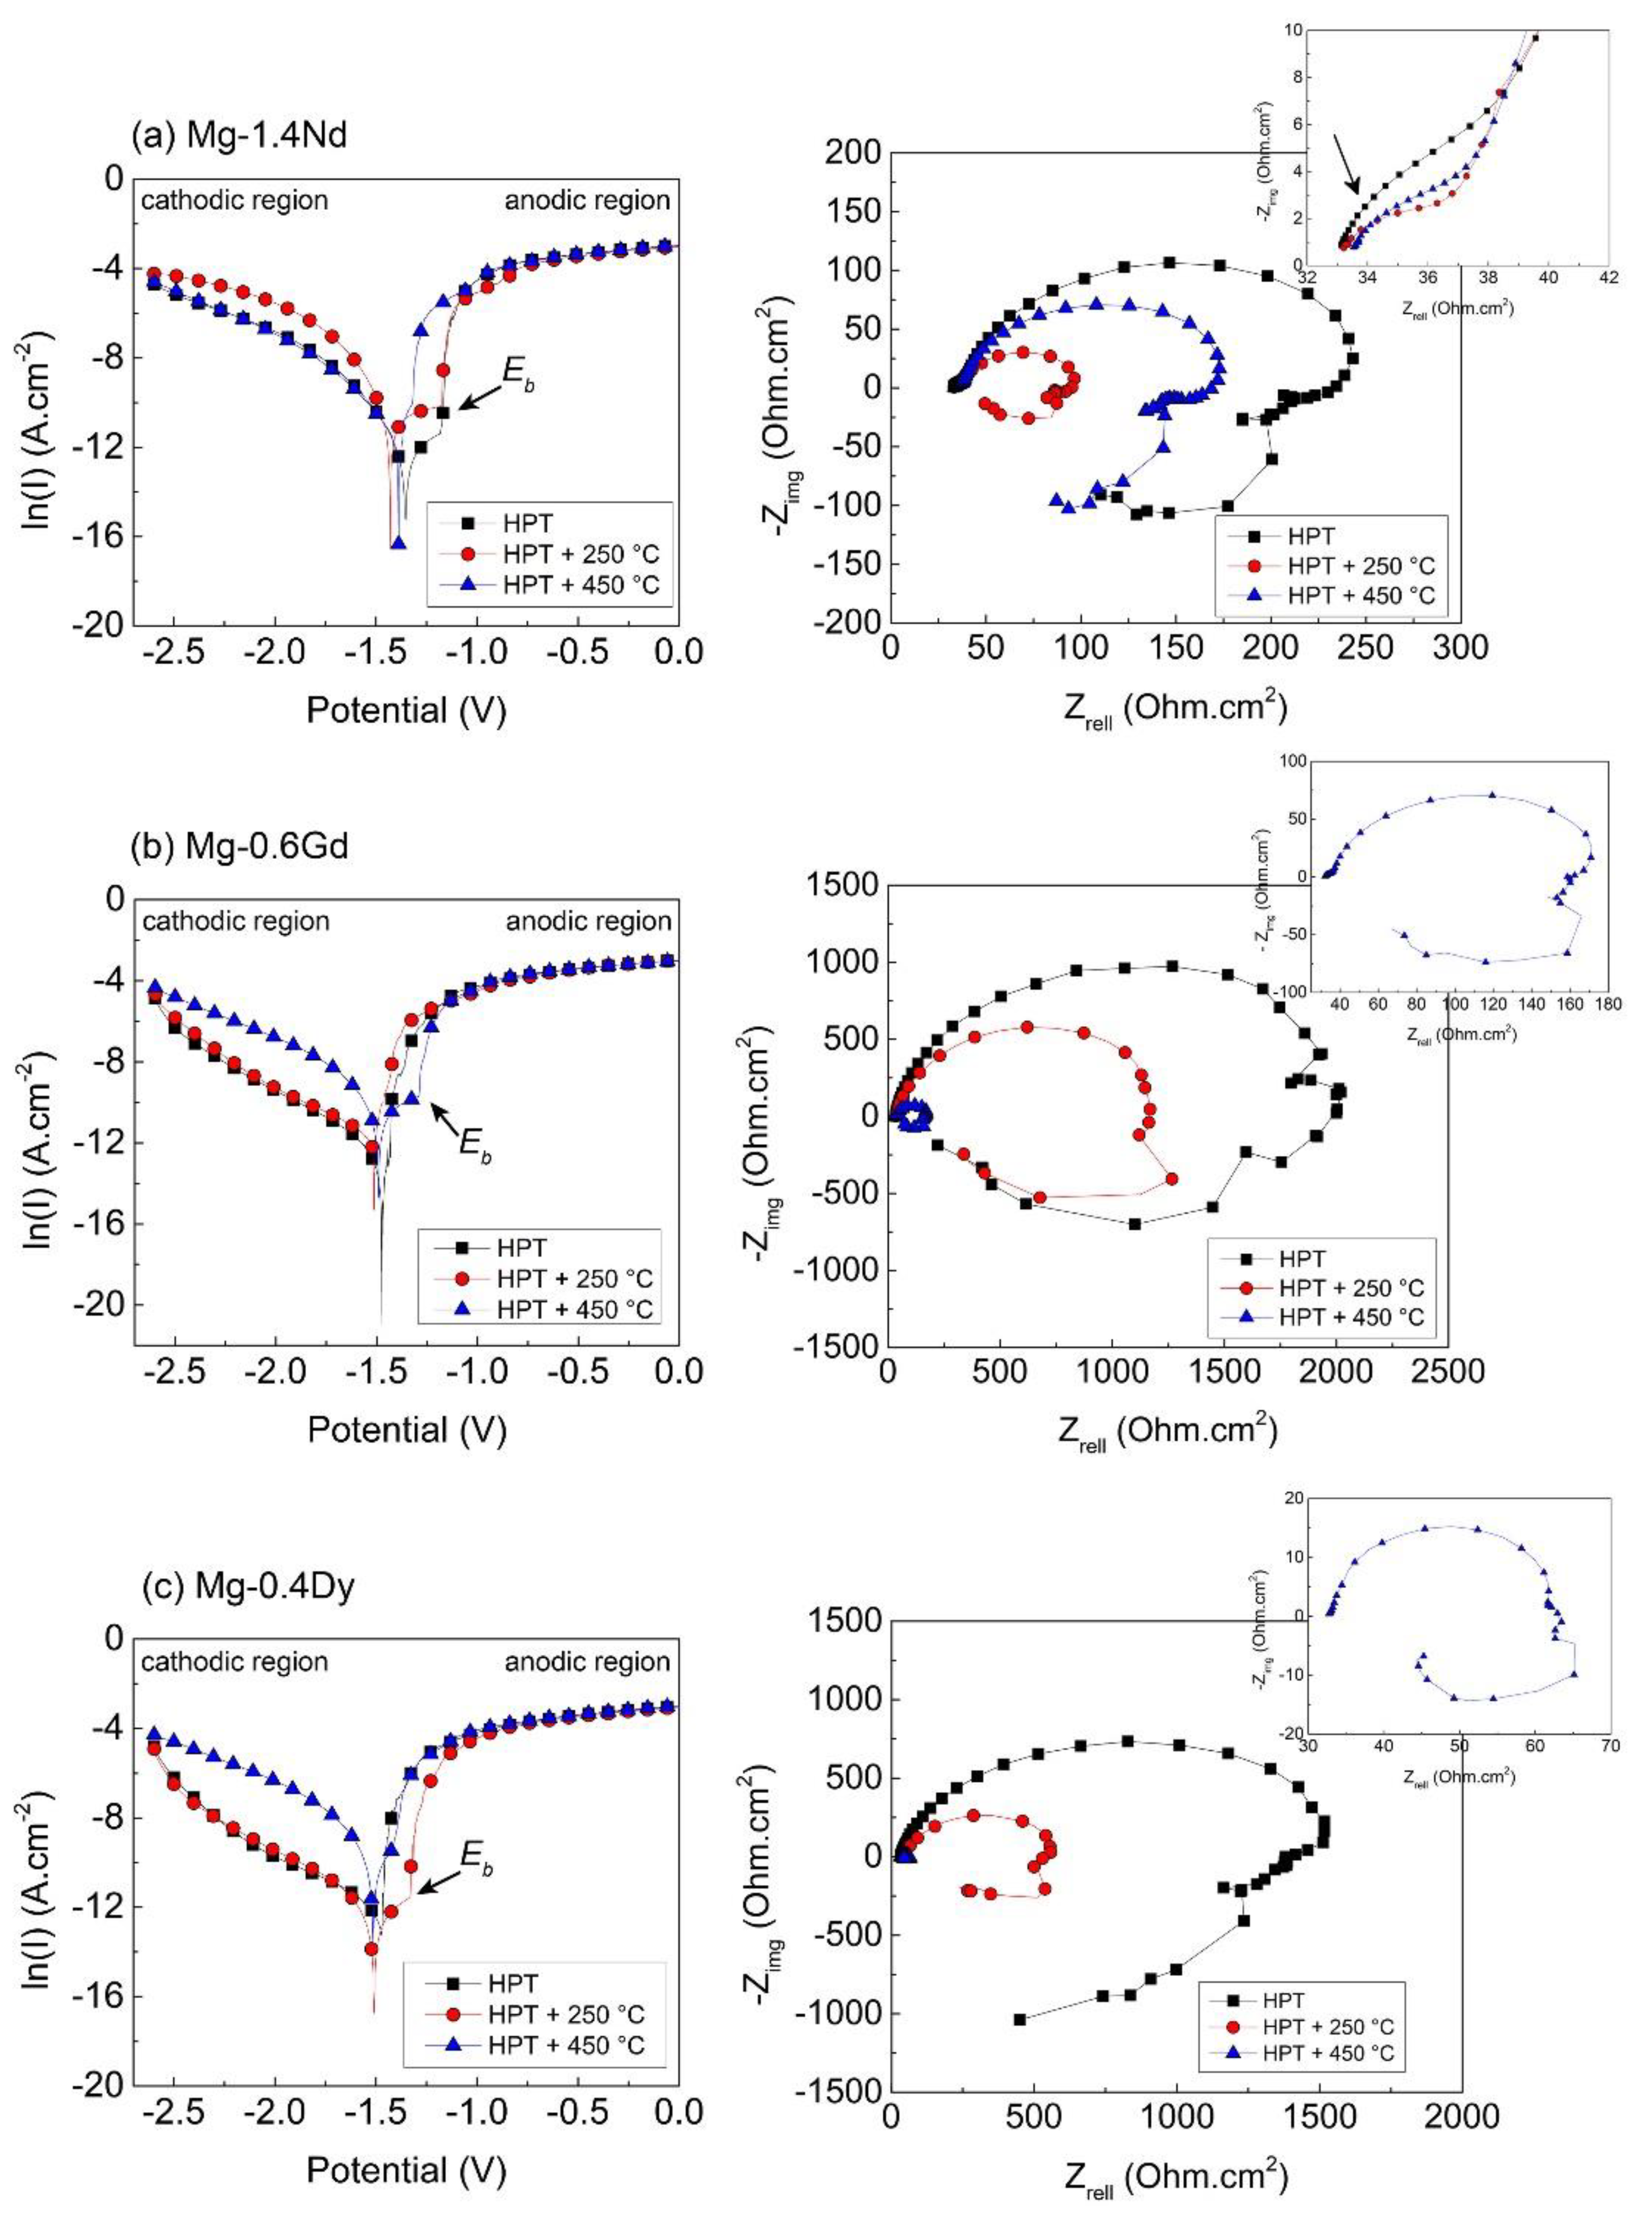
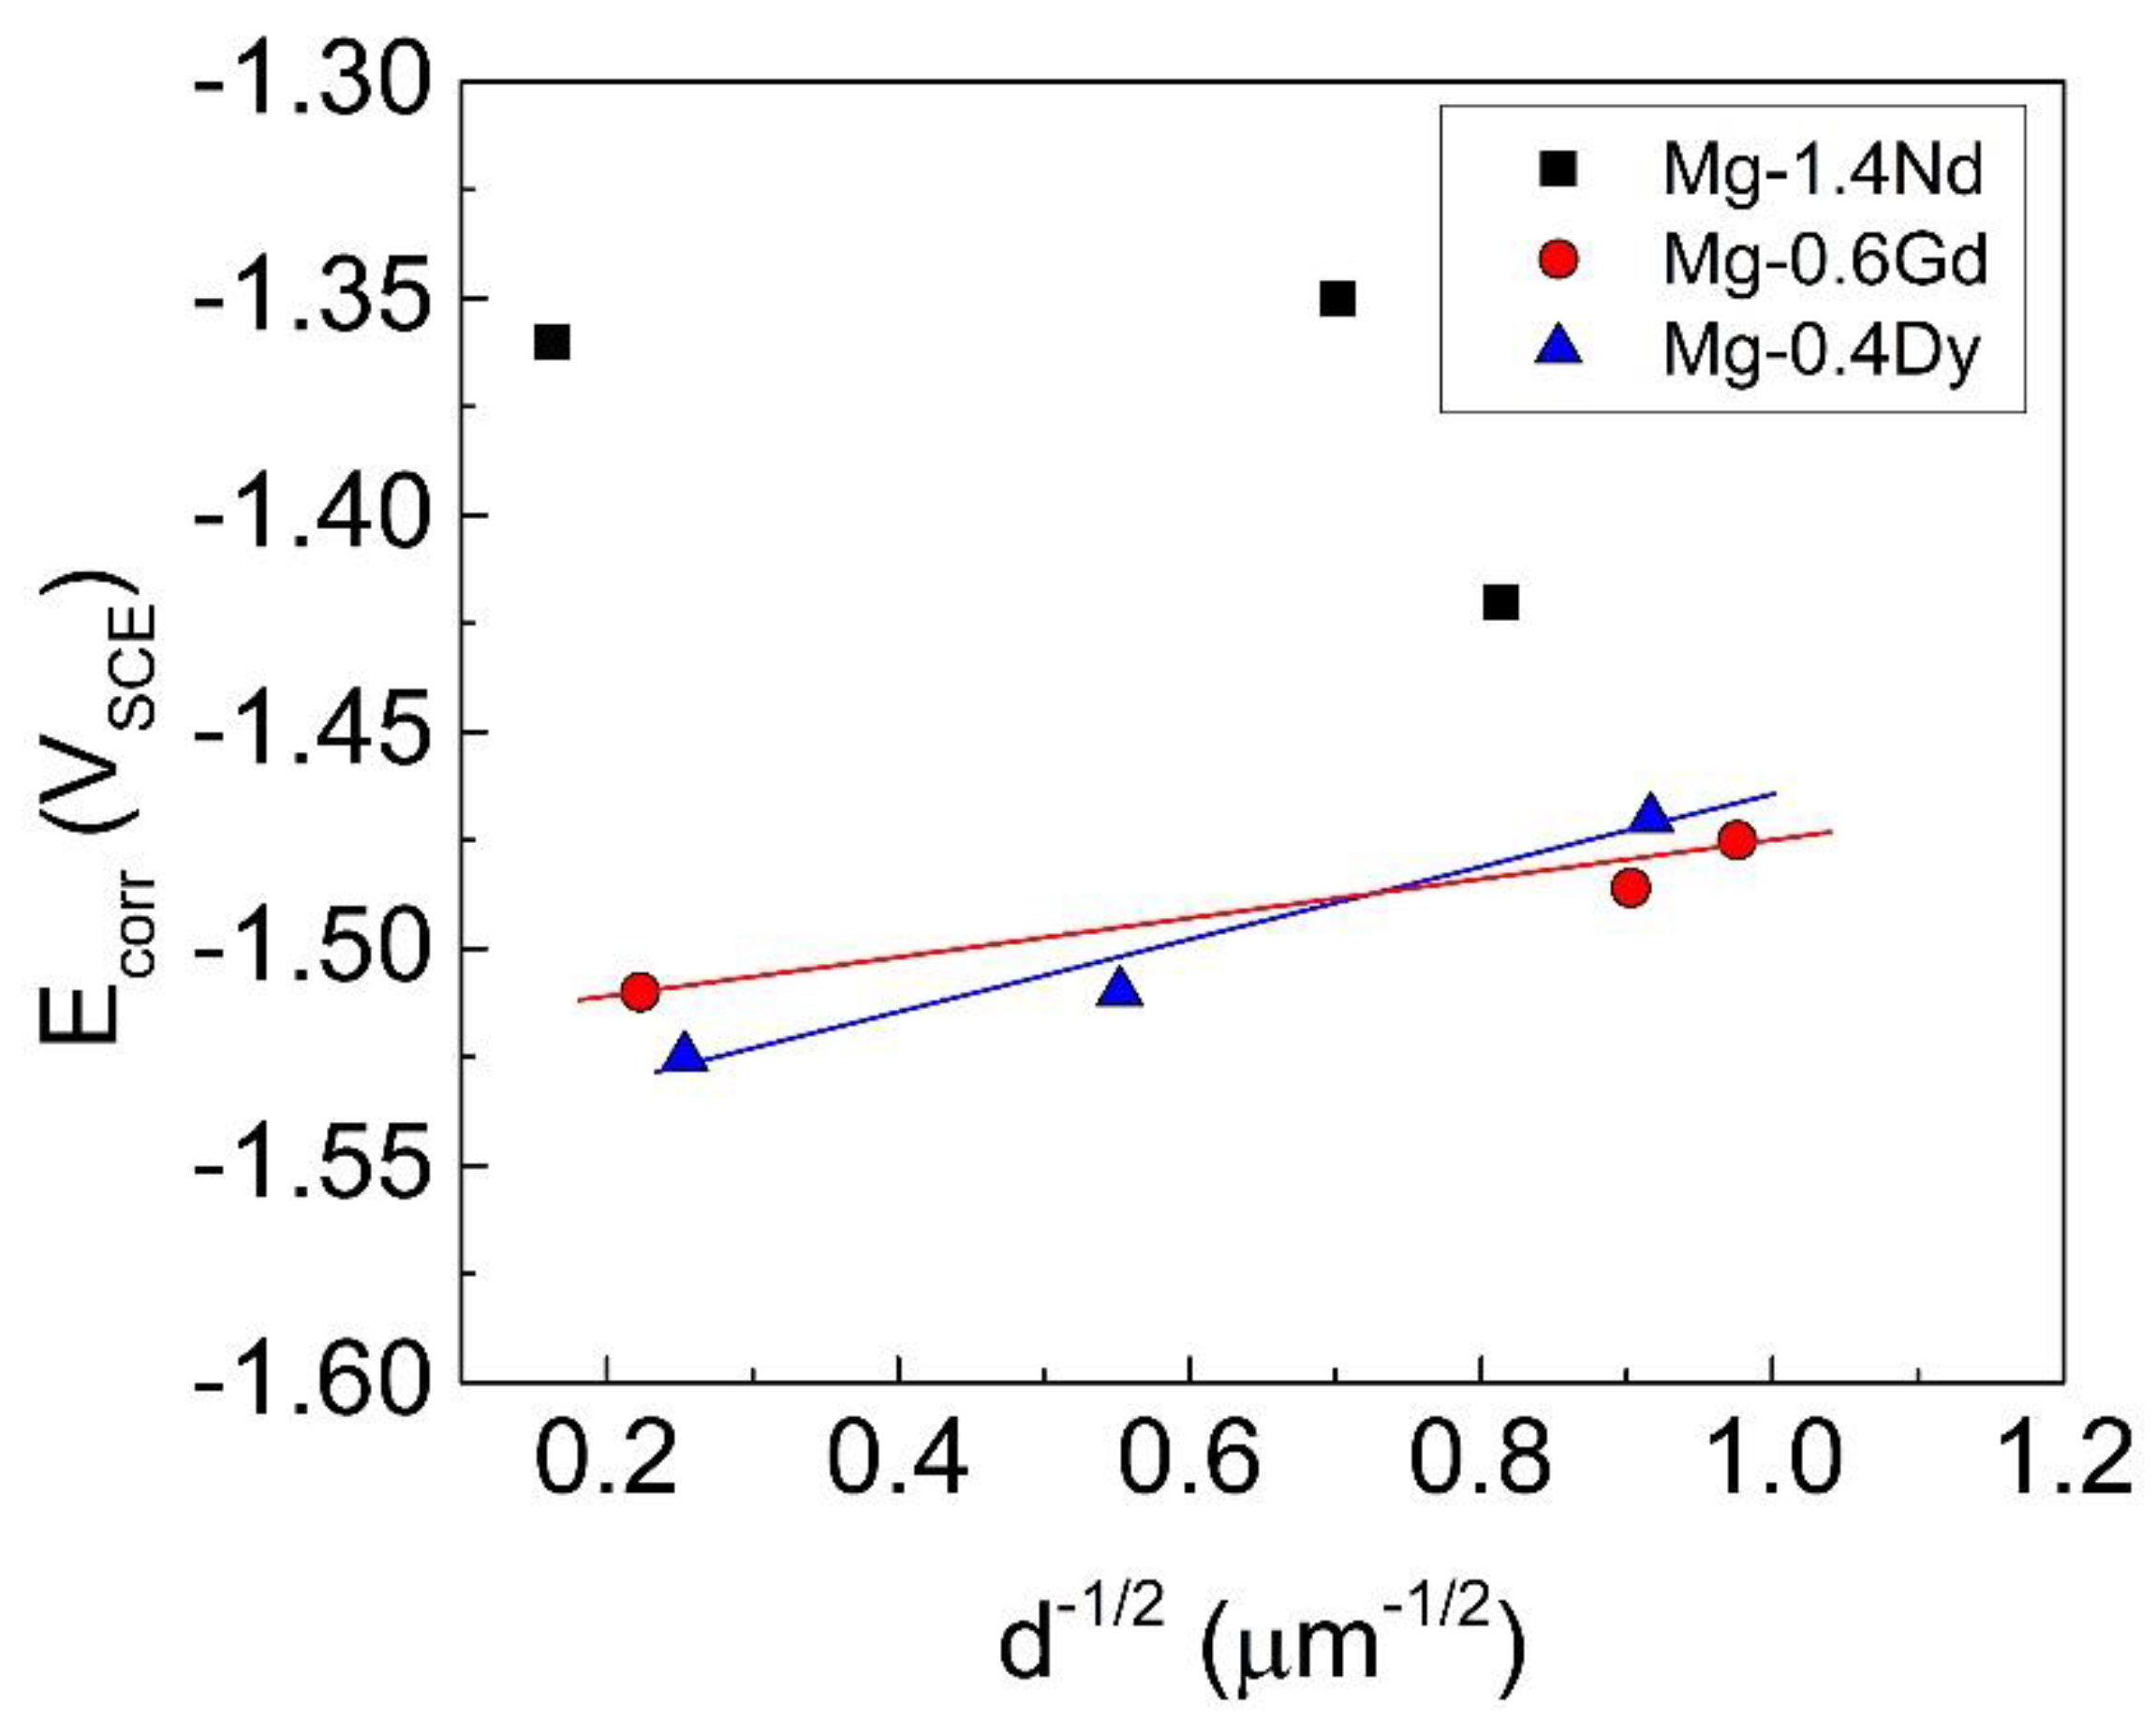
3.2. Electrochemical Corrosion Behaviour
4. Discussion
4.1. Microstructure and Texture Evolution
4.2. Corrosion Behaviour
5. Summary and Conclusions
Author Contributions
Funding
Institutional Review Board Statement
Informed Consent Statement
Data Availability Statement
Acknowledgments
Conflicts of Interest
References
- Song, J.; Chen, J.; Xiong, X.; Peng, X.; Chen, D.; Pan, F. Research advances of magnesium and magnesium alloys worldwide in 2021. J. Magnes. Alloy. 2022, 10, 863–898. [Google Scholar] [CrossRef]
- Shi, B.; Yang, C.; Peng, Y.; Zhang, F.; Pan, F. Anisotropy of wrought magnesium alloys: A focused overview. J. Magnes. Alloy. 2022, 10, 1476–1510. [Google Scholar] [CrossRef]
- Agnew, S.R.; Yoo, M.H.; Tomé, C.N. Application of texture simulation to understanding mechanical behavior of Mg and solid solution alloys containing Li or Y. Acta Mater. 2001, 49, 4277–4289. [Google Scholar] [CrossRef]
- Chino, Y.; Kado, M.; Mabuchi, M. Enhancement of tensile ductility and stretch formability of magnesium by addition of 0.2 wt% (0.035at%) Ce. Mater. Sci. Eng. A 2008, 494, 343–349. [Google Scholar] [CrossRef]
- Sandlöbes, S.; Friák, M.; Neugebauer, J.; Raabe, D. Basal and non-basal dislocation slip in Mg–Y. Mater. Sci. Eng. A 2013, 576, 61–68. [Google Scholar] [CrossRef]
- Stanford, N.; Atwell, D.; Barnett, M.R. The effect of Gd on the recrystallisation, texture and deformation behaviour of magnesium-based alloys. Acta Mater. 2010, 58, 6773–6783. [Google Scholar] [CrossRef]
- Hadorn, J.P.; Hantzsche, K.; Yi, S.; Bohlen, J.; Letzig, D.; Wollmershauser, J.A.; Agnew, S.R. Role of Solute in the Texture Modification During Hot Deformation of Mg-Rare Earth Alloys. Metall. Mater. Trans. A 2012, 43, 1347–1362. [Google Scholar] [CrossRef]
- Guerza-Soualah, F.; Azzeddine, H.; Baudin, T.; Helbert, A.-L.; Brisset, F.; Bradai, D. Microstructural and textural investigation of an Mg–Dy alloy after hot plane strain compression. J. Magnes. Alloy. 2020, 8, 1198–1207. [Google Scholar] [CrossRef]
- Guerza-Soualah, F.; Hanna, A.; Azzeddine, H.; Helbert, A.-L.; Brisset, F.; Baudin, T.; Bradai, D. The deformation and recrystallization behaviour of an Mg-Dy alloy processed by plane strain compression. Mater. Today Commun. 2020, 24, 101239. [Google Scholar] [CrossRef]
- Molodov, K.D.; Al-Samman, T.; Molodov, D.A. Effect of gadolinium on the deformation and recrystallization behavior of magnesium crystals. Acta Mater. 2022, 240, 118312. [Google Scholar] [CrossRef]
- Arrabal, R.; Matykina, E.; Pardo, A.; Merino, M.C.; Paucar, K.; Mohedano, M.; Casajús, P. Corrosion behaviour of AZ91D and AM50 magnesium alloys with Nd and Gd additions in humid environments. Corros. Sci. 2012, 55, 351–362. [Google Scholar] [CrossRef]
- Meng, J.; Sun, W.; Tian, Z.; Qiu, X.; Zhang, D. 2—Corrosion performance of magnesium (Mg) alloys containing rare-earth (RE) elements. In Corrosion Prevention of Magnesium Alloys; Song, G.-L., Ed.; Woodhead Publishing: Sawston, UK, 2013; pp. 38–60. [Google Scholar]
- Azzeddine, H.; Hanna, A.; Dakhouche, A.; Rabahi, L.; Scharnagl, N.; Dopita, M.; Brisset, F.; Helbert, A.-L.; Baudin, T. Impact of rare-earth elements on the corrosion performance of binary magnesium alloys. J. Alloys Compd. 2020, 829, 154569. [Google Scholar] [CrossRef]
- Chi, Y.C.; Guan, B.R.; Chen, F.; Qin, F.X. Effect of RE Elements Addition on Corrosion Behavior of Mg-Zn-Ca Amorphous Alloys for Biomedical Applications. Mater. Sci. Forum 2021, 1035, 501–510. [Google Scholar] [CrossRef]
- Xie, J.; Zhang, J.; You, Z.; Liu, S.; Guan, K.; Wu, R.; Wang, J.; Feng, J. Towards developing Mg alloys with simultaneously improved strength and corrosion resistance via RE alloying. J. Magnes. Alloy. 2021, 9, 41–56. [Google Scholar] [CrossRef]
- Tan, J.; Ramakrishna, S. Applications of Magnesium and Its Alloys: A Review. Appl. Sci. 2021, 11, 6861. [Google Scholar] [CrossRef]
- Powell, B.R.; Krajewski, P.E.; Luo, A.A. Chapter 4—Magnesium alloys for lightweight powertrains and automotive structures. In Materials, Design and Manufacturing for Lightweight Vehicles, 2nd ed.; Mallick, P.K., Ed.; Woodhead Publishing: Sawston, UK, 2021; pp. 125–186. [Google Scholar]
- Staiger, M.P.; Pietak, A.M.; Huadmai, J.; Dias, G. Magnesium and its alloys as orthopedic biomaterials: A review. Biomaterials 2006, 27, 1728–1734. [Google Scholar] [CrossRef]
- Azzeddine, H.; Hanna, A.; Dakhouche, A.; Luthringer-Feyerabend, B. Corrosion behaviour and cytocompatibility of selected binary magnesium-rare earth alloys. J. Magnes. Alloy. 2021, 9, 581–591. [Google Scholar] [CrossRef]
- Stanford, N. Micro-alloying Mg with Y, Ce, Gd and La for texture modification—A comparative study. Mater. Sci. Eng. A 2010, 527, 2669–2677. [Google Scholar] [CrossRef]
- Long, L.J.; Huang, G.H.; Yin, D.D.; Ji, B.; Zhou, H.; Wang, Q.D. Effects of Y on the Deformation Mechanisms of Extruded Mg-Y Sheets During Room-Temperature Compression. Metall. Mater. Trans. A 2020, 51, 2738–2751. [Google Scholar] [CrossRef]
- Xu, Y.; Gavras, S.; Gensch, F.; Kainer, K.U.; Hort, N. Effect of Nd Additions on the Mechanical Properties of Mg Binary Alloys. JOM 2020, 72, 517–525. [Google Scholar] [CrossRef]
- Sheikhani, A.; Roumina, R.; Mahmudi, R. Texture softening in a rare earth elements-containing AZ31 magnesium alloy during hot compression deformation. J. Mater. Res. Technol. 2022, 18, 4089–4098. [Google Scholar] [CrossRef]
- Mirzakhani, A.; Assempour, A. The effects of microstructural parameters on the tension-compression mechanical behavior of extruded Mg-XY rods using crystal plasticity finite element modeling. Results Eng. 2023, 17, 100834. [Google Scholar] [CrossRef]
- Zhou, S.; Tang, A.; Liu, T.; Peng, P.; Zhang, J.; She, J.; Pan, F. Ductility enhancement by activating non-basal slip in as-extruded Mg alloys with dilute Sc addition. J. Mater. Res. Technol. 2023, 22, 3362–3374. [Google Scholar] [CrossRef]
- Zhilyaev, A.P.; Langdon, T.G. Using high-pressure torsion for metal processing: Fundamentals and applications. Prog. Mater. Sci. 2008, 53, 893–979. [Google Scholar] [CrossRef]
- Huang, Y.; Figueiredo, R.B.; Baudin, T.; Brisset, F.; Langdon, T.G. Evolution of Strength and Homogeneity in a Magnesium AZ31 Alloy Processed by High-Pressure Torsion at Different Temperatures. Adv. Eng. Mater. 2012, 14, 1018–1026. [Google Scholar] [CrossRef]
- Valiev, R.Z.; Estrin, Y.; Horita, Z.; Langdon, T.G.; Zechetbauer, M.J.; Zhu, Y.T. Producing bulk ultrafine-grained materials by severe plastic deformation. JOM 2006, 58, 33–39. [Google Scholar] [CrossRef] [Green Version]
- Figueiredo, R.B.; Langdon, T.G. Fabricating Ultrafine-Grained Materials through the Application of Severe Plastic Deformation: A Review of Developments in Brazil. J. Mater. Res. Technol. 2012, 1, 55–62. [Google Scholar] [CrossRef] [Green Version]
- Huang, Y.; Langdon, T.G. Advances in ultrafine-grained materials. Mater. Today 2013, 16, 85–93. [Google Scholar] [CrossRef]
- Wongsa-Ngam, J.; Kawasaki, M.; Langdon, T.G. A comparison of microstructures and mechanical properties in a Cu–Zr alloy processed using different SPD techniques. J. Mater. Sci. 2013, 48, 4653–4660. [Google Scholar] [CrossRef]
- Figueiredo, R.B.; Langdon, T.G. Deformation mechanisms in ultrafine-grained metals with an emphasis on the Hall–Petch relationship and strain rate sensitivity. J. Mater. Res. Technol. 2021, 14, 137–159. [Google Scholar] [CrossRef]
- Azzeddine, H.; Bradai, D.; Baudin, T.; Langdon, T.G. Texture evolution in high-pressure torsion processing. Prog. Mater. Sci. 2022, 125, 100886. [Google Scholar] [CrossRef]
- Bahmani, A.; Lotfpour, M.; Taghizadeh, M.; Kim, W.-J. Corrosion behavior of severely plastically deformed Mg and Mg alloys. J. Magnes. Alloy. 2022, 10, 2607–2648. [Google Scholar] [CrossRef]
- Nazeer, F.; Long, J.; Yang, Z.; Li, C. Superplastic deformation behavior of Mg alloys: A-review. J. Magnes. Alloy. 2022, 10, 97–109. [Google Scholar] [CrossRef]
- Kai, M.; Horita, Z.; Langdon, T.G. Developing grain refinement and superplasticity in a magnesium alloy processed by high-pressure torsion. Mater. Sci. Eng. A 2008, 488, 117–124. [Google Scholar] [CrossRef]
- Huang, Y.; Figueiredo, R.B.; Baudin, T.; Helbert, A.-L.; Brisset, F.; Langdon, T.G. Effect of temperature on the processing of a magnesium alloy by high-pressure torsion. J. Mater. Sci. 2012, 47, 7796–7806. [Google Scholar] [CrossRef]
- Meng, F.; Rosalie, J.M.; Singh, A.; Somekawa, H.; Tsuchiya, K. Ultrafine grain formation in Mg–Zn alloy by in situ precipitation during high-pressure torsion. Scr. Mater. 2014, 78–79, 57–60. [Google Scholar] [CrossRef]
- Alsubaie, S.A.; Bazarnik, P.; Lewandowska, M.; Huang, Y.; Langdon, T.G. Evolution of microstructure and hardness in an AZ80 magnesium alloy processed by high-pressure torsion. J. Mater. Res. Technol. 2016, 5, 152–158. [Google Scholar] [CrossRef] [Green Version]
- Alizadeh, R.; Mahmudi, R.; Ngan, A.H.W.; Huang, Y.; Langdon, T.G. Superplasticity of a nano-grained Mg–Gd–Y–Zr alloy processed by high-pressure torsion. Mater. Sci. Eng. A 2016, 651, 786–794. [Google Scholar] [CrossRef] [Green Version]
- Sun, W.T.; Qiao, X.G.; Zheng, M.Y.; Zhao, X.J.; Chen, H.W.; Gao, N.; Starink, M.J. Achieving ultra-high hardness of nanostructured Mg-8.2Gd-3.2Y-1.0Zn-0.4Zr alloy produced by a combination of high pressure torsion and ageing treatment. Scr. Mater. 2018, 155, 21–25. [Google Scholar] [CrossRef] [Green Version]
- Sun, W.T.; Qiao, X.G.; Zheng, M.Y.; He, Y.; Hu, N.; Xu, C.; Gao, N.; Starink, M.J. Exceptional grain refinement in a Mg alloy during high pressure torsion due to rare earth containing nanosized precipitates. Mater. Sci. Eng. A 2018, 728, 115–123. [Google Scholar] [CrossRef] [Green Version]
- Hanna, A.; Azzeddine, H.; Lachhab, R.; Baudin, T.; Helbert, A.-L.; Brisset, F.; Huang, Y.; Bradai, D.; Langdon, T.G. Evaluating the textural and mechanical properties of an Mg-Dy alloy processed by high-pressure torsion. J. Alloys Compd. 2019, 778, 61–71. [Google Scholar] [CrossRef]
- Li, Y.; Qu, C.; Wang, J.; Xu, R. Exceptional aging hardening behaviour of nanocrystalline Mg–Y-Nd-Gd-Zr alloy prepared by high pressure torsion. J. Alloys Compd. 2020, 813, 152123. [Google Scholar] [CrossRef]
- Zhang, N.X.; Kawasaki, M.; Ding, H.; Langdon, T.G. An examination of microstructural evolution and homogeneity in a magnesium AZ80 alloy processed by high-pressure torsion. Mater. Sci. Eng. A 2021, 806, 140832. [Google Scholar] [CrossRef]
- Silva, C.L.P.; Soares, R.B.; Pereira, P.H.R.; Figueiredo, R.B.; Lins, V.F.C.; Langdon, T.G. The Effect of High-Pressure Torsion on Microstructure, Hardness and Corrosion Behavior for Pure Magnesium and Different Magnesium Alloys. Adv. Eng. Mater. 2019, 21, 1801081. [Google Scholar] [CrossRef]
- Kasaeian-Naeini, M.; Sedighi, M.; Hashemi, R. Severe plastic deformation (SPD) of biodegradable magnesium alloys and composites: A review of developments and prospects. J. Magnes. Alloy. 2022, 10, 938–955. [Google Scholar] [CrossRef]
- Gerashi, E.; Alizadeh, R.; Langdon, T.G. Effect of crystallographic texture and twinning on the corrosion behavior of Mg alloys: A review. J. Magnes. Alloy. 2022, 10, 313–325. [Google Scholar] [CrossRef]
- Li, L.; Liu, W.; Qi, F.; Wu, D.; Zhang, Z. Effects of deformation twins on microstructure evolution, mechanical properties and corrosion behaviors in magnesium alloys—A review. J. Magnes. Alloy. 2022, 10, 2334–2353. [Google Scholar] [CrossRef]
- Mohammadi Zerankeshi, M.; Alizadeh, R.; Gerashi, E.; Asadollahi, M.; Langdon, T.G. Effects of heat treatment on the corrosion behavior and mechanical properties of biodegradable Mg alloys. J. Magnes. Alloy. 2022, 10, 1737–1785. [Google Scholar] [CrossRef]
- Yang, L.; Huang, Y.; Feyerabend, F.; Willumeit, R.; Mendis, C.; Kainer, K.U.; Hort, N. Microstructure, mechanical and corrosion properties of Mg–Dy–Gd–Zr alloys for medical applications. Acta Biomater. 2013, 9, 8499–8508. [Google Scholar] [CrossRef] [Green Version]
- Chen, L.-Y.; Xu, J.-Q.; Choi, H.; Pozuelo, M.; Ma, X.; Bhowmick, S.; Yang, J.-M.; Mathaudhu, S.; Li, X.-C. Processing and properties of magnesium containing a dense uniform dispersion of nanoparticles. Nature 2015, 528, 539–543. [Google Scholar] [CrossRef]
- Hanna, A.; Dakhouche, A.; Tirsatine, K.; Sari, A.; Khereddine, Y.; Bradai, D.; Azzeddine, H. Effect of hot rolling on the corrosion behavior of AZ31 magnesium alloy. J Metall. Res. Technol. 2019, 116, 109. [Google Scholar] [CrossRef] [Green Version]
- Zou, G.; Peng, Q.; Wang, Y.; Liu, B. The effect of extension twinning on the electrochemical corrosion properties of Mg–Y alloys. J. Alloys Compd. 2015, 618, 44–48. [Google Scholar] [CrossRef]
- Liu, J.; Han, E.H.; Song, Y.; Shan, D. Effect of twins on the corrosion behavior of Mg–5Y–7Gd–1Nd–0.5Zr Mg alloy. J. Alloys Compd. 2018, 757, 356–363. [Google Scholar] [CrossRef]
- Sakai, T.; Belyakov, A.; Kaibyshev, R.; Miura, H.; Jonas, J.J. Dynamic and post-dynamic recrystallization under hot, cold and severe plastic deformation conditions. Prog. Mater. Sci. 2014, 60, 130–207. [Google Scholar] [CrossRef] [Green Version]
- Khodabakhshi, F.; Mohammadi, M.; Gerlich, A.P. Stability of ultra-fine and nano-grains after severe plastic deformation: A critical review. J. Mater. Sci. 2021, 56, 15513–15537. [Google Scholar] [CrossRef]
- Hanna, A.; Azzeddine, H.; Huang, Y.; Bradai, D.; Cabrera, J.M.; Langdon, T.G. An investigation of the thermal stability of an MgDy alloy after processing by high-pressure torsion. Mater. Charact. 2019, 151, 519–529. [Google Scholar] [CrossRef] [Green Version]
- Tighiouaret, S.; Lachhab, R.; Hanna, A.; Azzeddine, H.; Huang, Y.; Baudin, T.; Helbert, A.-L.; Brisset, F.; Bradai, D.; Langdon, T.G. Thermal Stability of an Mg–Nd Alloy Processed by High-Pressure Torsion. Adv. Eng. Mater. 2019, 21, 1900801. [Google Scholar] [CrossRef]
- Liu, X.; Xu, R. Microstructure Evolution and Thermal Stability of Mg-Sm-Ca Alloy Processed by High-Pressure Torsion. J. Mater. Eng. Perform. 2022, 31, 2644–2652. [Google Scholar] [CrossRef]
- Sun, W.; He, Y.; Qiao, X.; Zhao, X.; Chen, H.; Gao, N.; Starink, M.J.; Zheng, M. Exceptional thermal stability and enhanced hardness in a nanostructured Mg-Gd-Y-Zn-Zr alloy processed by high pressure torsion. J. Magnes. Alloy. 2022. [Google Scholar] [CrossRef]
- Wang, J.; Li, Y.; Xu, R. The thermal stability and activation energy of the nanocrystalline Mg-Zn-Y alloy obtained by high pressure torsion. Mater. Lett. 2020, 268, 127607. [Google Scholar] [CrossRef]
- Zhang, C.; Guan, S.; Wang, L.; Zhu, S.; Chang, L. The microstructure and corrosion resistance of biological Mg–Zn–Ca alloy processed by high-pressure torsion and subsequently annealing. J. Mater. Res. 2017, 32, 1061–1072. [Google Scholar] [CrossRef]
- Rokhlin, L.L. Magnesium Alloys Containing Rare Earth Metals: Structure and Properties, 1st ed.; CRC Press: London, UK, 2003; p. 256. [Google Scholar]
- Hanna, A.; Rabahi, L.; Soualili, M.A.; Dakhouche, A.; Bradai, D.; Azzeddine, H. On the corrosion behaviour of as-cast and heat-treated Mg-RE alloys in 0.9% NaCl solution. J. Met. Mater. Miner. 2020, 30, 29–39. [Google Scholar] [CrossRef]
- Figueiredo, R.B.; Cetlin, P.R.; Langdon, T.G. Using finite element modeling to examine the flow processes in quasi-constrained high-pressure torsion. Mater. Sci. Eng. A 2011, 528, 8198–8204. [Google Scholar] [CrossRef]
- Cho, J.-H.; Rollett, A.D.; Oh, K.H. Determination of a mean orientation in electron backscatter diffraction measurements. Metall. Mater. Trans. A 2005, 36, 3427–3438. [Google Scholar] [CrossRef]
- Hielscher, R.; Schaeben, H. A novel pole figure inversion method: Specification of the MTEX algorithm. J. Appl. Cryst. 2008, 41, 1024–1037. [Google Scholar] [CrossRef]
- Klar, R.; Lücke, K. Orientierungszusammenhänge bei der Rekristallisation von Einkristallen aus Zink und Kadmium. Int. J. Mater. Res. 1968, 59, 194–202. [Google Scholar] [CrossRef]
- Gottstein, G.; Al Samman, T. Texture Development in Pure Mg and Mg Alloy AZ31. Mater. Sci. Forum 2005, 495–497, 623–632. [Google Scholar] [CrossRef]
- Hirsch, J.; Al-Samman, T. Superior light metals by texture engineering: Optimized aluminum and magnesium alloys for automotive applications. Acta Mater. 2013, 61, 818–843. [Google Scholar] [CrossRef]
- Ould Mohamed, O.; Azzeddine, H.; Huang, Y.; Baudin, T.; Bazarnik, P.; Brisset, F.; Kawasaki, M.; Langdon, T.G. Investigation of Microstructure and Texture Evolution in an AZ31/Mg–Gd Alloy Hybrid Metal Fabricated by High-Pressure Torsion. Adv. Eng. Mater. 2023, 2201794. [Google Scholar] [CrossRef]
- Natarajan, A.R.; Solomon, E.L.S.; Puchala, B.; Marquis, E.A.; Van der Ven, A. On the early stages of precipitation in dilute Mg–Nd alloys. Acta Mater. 2016, 108, 367–379. [Google Scholar] [CrossRef] [Green Version]
- Song, G.L.; Atrens, A. Corrosion Mechanisms of Magnesium Alloys. Adv. Eng. Mater. 1999, 1, 11–33. [Google Scholar] [CrossRef]
- Thomaz, T.R.; Weber, C.R.; Pelegrini, T.; Dick, L.F.P.; Knörnschild, G. The negative difference effect of magnesium and of the AZ91 alloy in chloride and stannate-containing solutions. Corros. Sci. 2010, 52, 2235–2243. [Google Scholar] [CrossRef]
- Bender, S.; Goellner, J.; Heyn, A.; Schmigalla, S. A new theory for the negative difference effect in magnesium corrosion. Mater. Corros. 2012, 63, 707–712. [Google Scholar] [CrossRef]
- Baril, G.; Pébère, N. The corrosion of pure magnesium in aerated and deaerated sodium sulphate solutions. Corros. Sci. 2001, 43, 471–484. [Google Scholar] [CrossRef]
- Song, Y.; Shan, D.; Chen, R.; Zhang, F.; Han, E.-H. Biodegradable behaviors of AZ31 magnesium alloy in simulated body fluid. Mater. Sci. Eng. C 2009, 29, 1039–1045. [Google Scholar] [CrossRef]
- Li, J.; Jiang, Q.; Sun, H.; Li, Y. Effect of heat treatment on corrosion behavior of AZ63 magnesium alloy in 3.5wt.% sodium chloride solution. Corros. Sci. 2016, 111, 288–301. [Google Scholar] [CrossRef] [Green Version]
- Mohajernia, S.; Hejazi, S.; Eslami, A.; Saremi, M. Modified nanostructured hydroxyapatite coating to control the degradation of magnesium alloy AZ31 in simulated body fluid. Surf. Coat. Technol. 2015, 263, 54–60. [Google Scholar] [CrossRef]
- Liu, F.; Song, Y.-W.; Shan, D.-Y.; Han, E.-H. Corrosion behavior of AZ31 magnesium alloy in simulated acid rain solution. Trans. Nonferrous Met. Soc. China 2010, 20, s638–s642. [Google Scholar] [CrossRef]
- Zhang, T.; Shao, Y.; Meng, G.; Cui, Z.; Wang, F. Corrosion of hot extrusion AZ91 magnesium alloy: I-relation between the microstructure and corrosion behavior. Corros. Sci. 2011, 53, 1960–1968. [Google Scholar] [CrossRef]
- Sitdikov, O.; Kaibyshev, R.; Sakai, T. Dynamic Recrystallization Based on Twinning in Coarse-Grained Mg. Mater. Sci. Forum 2003, 419–422, 521–526. [Google Scholar] [CrossRef]
- Galiyev, A.; Kaibyshev, R.; Gottstein, G. Correlation of plastic deformation and dynamic recrystallization in magnesium alloy ZK60. Acta Mater. 2001, 49, 1199–1207. [Google Scholar] [CrossRef]
- Zhang, Q.; Fan, T.-W.; Fu, L.; Tang, B.-Y.; Peng, L.-M.; Ding, W.-J. Ab-initio study of the effect of rare-earth elements on the stacking faults of Mg solid solutions. Intermetallics 2012, 29, 21–26. [Google Scholar] [CrossRef]
- Humphreys, J.; Rohrer, G.S.; Rollett, A. Chapter 7—Recrystallization of Single-Phase Alloys. In Recrystallization and Related Annealing Phenomena, 3rd ed.; Humphreys, J., Rohrer, G.S., Rollett, A., Eds.; Elsevier: Oxford, UK, 2017; pp. 245–304. [Google Scholar]
- Tighiouaret, S.; Hanna, A.; Azzeddine, H.; Rabahi, L.; Dakhouche, A.; Brisset, F.; Helbert, A.-L.; Baudin, T.; Bradai, D. On the evolution of microstructure, texture and corrosion behavior of a hot-rolled and annealed AZ31 alloy. Mater. Chem. Phys. 2021, 267, 124598. [Google Scholar] [CrossRef]
- Su, J.; Yue, S. Texture Weakening and Grain Refinement by High Speed Rolling and Annealing of an AZ31 Magnesium Alloy. In Proceedings of the Magnesium Technology 2017; Springer International Publishing: Berlin/Heidelberg, Germany, 2017; pp. 547–554. [Google Scholar]
- Jung, I.-H.; Sanjari, M.; Kim, J.; Yue, S. Role of RE in the deformation and recrystallization of Mg alloy and a new alloy design concept for Mg–RE alloys. Scr. Mater. 2015, 102, 1–6. [Google Scholar] [CrossRef]
- Sadi, S.; Hanna, A.; Baudin, T.; Brisset, F.; Cabrera, J.M.; Azzeddine, H. Microstructure and texture evolution of ECAP-processed Mg-Ce alloy during isothermal annealing. Mater. Today Commun. 2022, 32, 103920. [Google Scholar] [CrossRef]
- Ralston, K.D.; Fabijanic, D.; Birbilis, N. Effect of grain size on corrosion of high purity aluminium. Electrochim. Acta 2011, 56, 1729–1736. [Google Scholar] [CrossRef]
- Ralston, K.D.; Birbilis, N.; Davies, C.H.J. Revealing the relationship between grain size and corrosion rate of metals. Scr. Mater. 2010, 63, 1201–1204. [Google Scholar] [CrossRef]
- Zhang, T.; Meng, G.; Shao, Y.; Cui, Z.; Wang, F. Corrosion of hot extrusion AZ91 magnesium alloy. Part II: Effect of rare earth element neodymium (Nd) on the corrosion behavior of extruded alloy. Corros. Sci. 2011, 53, 2934–2942. [Google Scholar] [CrossRef]
- Liu, J.; Song, Y.; Chen, J.; Chen, P.; Shan, D.; Han, E.-H. The Special Role of Anodic Second Phases in the Micro-galvanic Corrosion of EW75 Mg Alloy. Electrochim. Acta 2016, 189, 190–195. [Google Scholar] [CrossRef]
- Cai, C.; Song, R.; Wang, L.; Li, J. Effect of anodic T phase on surface micro-galvanic corrosion of biodegradable Mg-Zn-Zr-Nd alloys. Appl. Surf. Sci. 2018, 462, 243–254. [Google Scholar] [CrossRef]


| Ecorr (VSCE) | Icorr (A.cm−2) | βc (VSCE) | |
|---|---|---|---|
| Mg-1.4Nd | |||
| HPT | −1.35 | 1.07 × 10⁻⁴ | −0.32 |
| HPT + 250 °C | −1.42 | 5.93 × 10⁻⁴ | −0.30 |
| HPT + 450 °C | −1.36 | 1.01 × 10⁻⁴ | −0.20 |
| Mg-0.6Gd | |||
| HPT | −1.47 | 5.18 × 10⁻⁶ | −0.19 |
| HPT + 250 °C | −1.48 | 9.45 × 10⁻⁶ | −0.21 |
| HPT + 450 °C | −1.51 | 1.55 × 10⁻⁴ | −0.25 |
| Mg-0.4Dy | |||
| HPT | −1.47 | 6.39 × 10⁻⁶ | −0.21 |
| HPT + 250 °C | −1.51 | 8.81 × 10⁻⁶ | −0.22 |
| HPT + 450 °C | −1.52 | 3.29 × 10⁻⁴ | −0.29 |
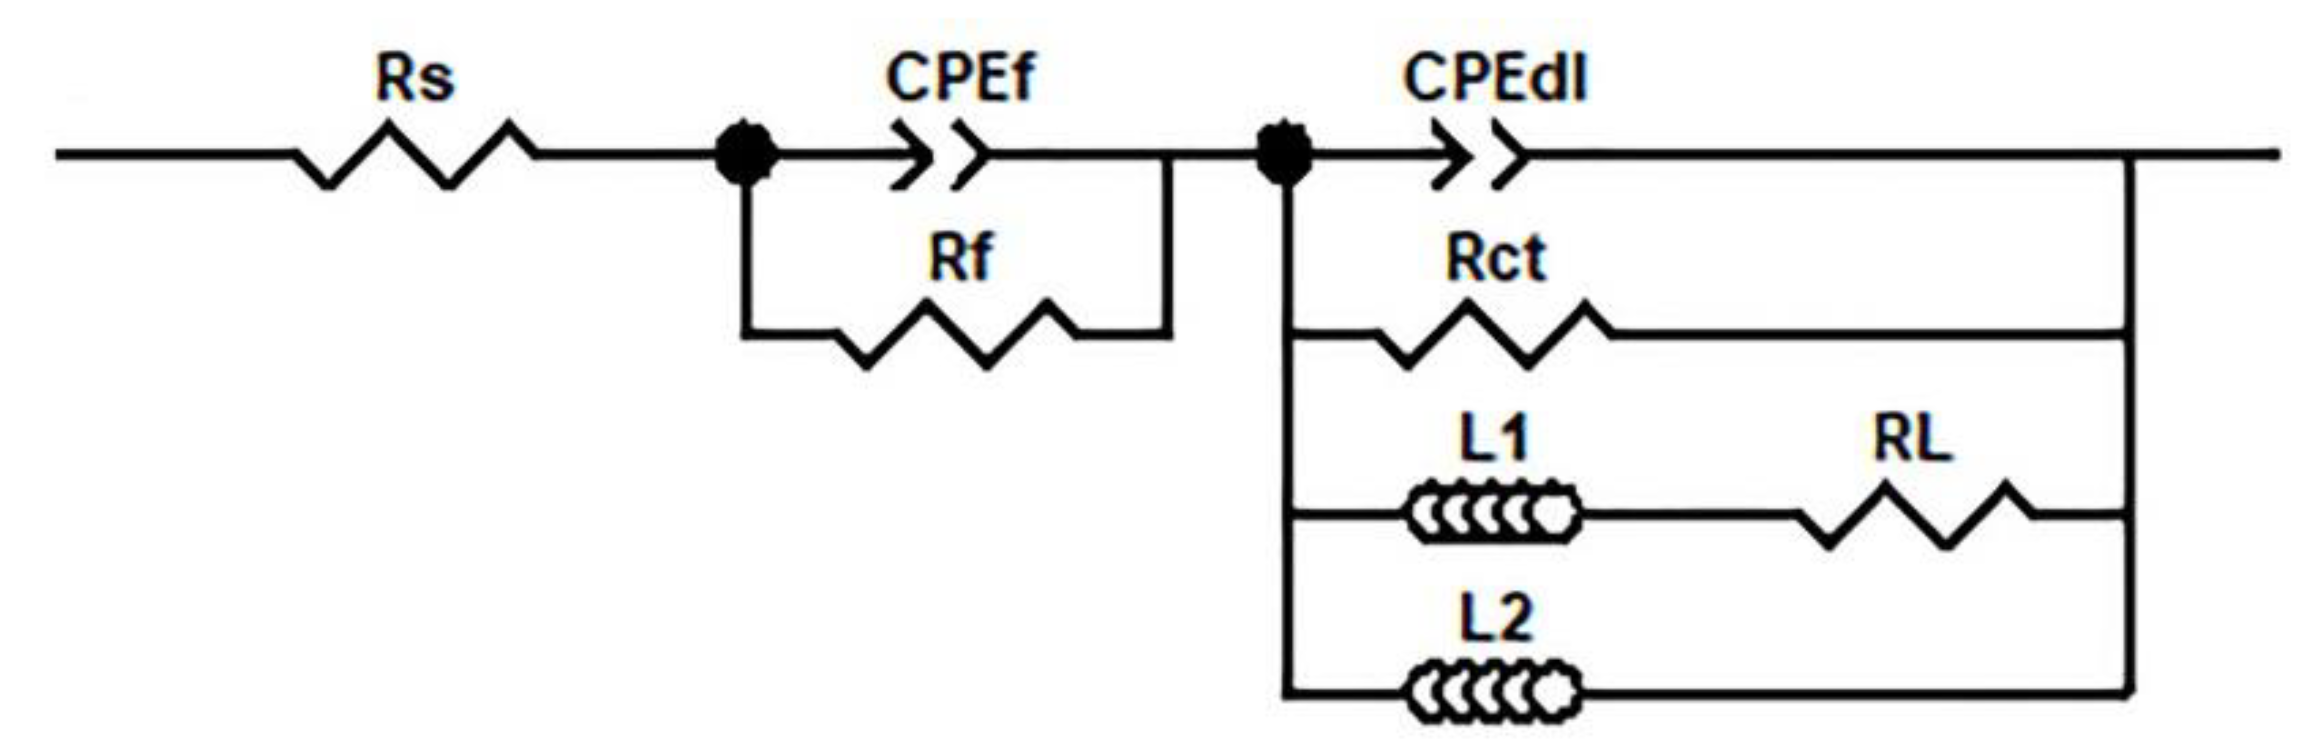
| Rs (Ω.cm2) | CPEf (F.cm−2) | Rf (Ω.cm2) | CPEdl (F.cm−2) | Rct (Ω.cm2) | L1 (H.cm−2) | RL (Ω.cm2) | L2 (F.cm−2) | Rp (Ω.cm2) | |||
|---|---|---|---|---|---|---|---|---|---|---|---|
| Yf | nf | Ydl | ndl | ||||||||
| Mg-1.4Nd | |||||||||||
| HPT | 32.96 | 1.38 × 10⁻⁵ | 0.97 | 4.95 | 6.14 × 10⁻⁵ | 0.91 | 251.4 | 23.85 | 581.4 | 1198 | 213.4 |
| HPT + 250 °C | 31.61 | 3.35 × 10⁻³ | 0.39 | 10.04 | 1.23 × 10⁻⁴ | 0.97 | 61.2 | 9.32 | 183.2 | 263.2 | 87.5 |
| HPT + 450 °C | 33.33 | 1.74 × 10⁻⁵ | 0.95 | 3.81 | 8.75 × 10⁻⁵ | 0.92 | 162.6 | 19.06 | 368.1 | 770.2 | 149.9 |
| Mg-0.6Gd | |||||||||||
| HPT | 32.95 | 2.49 × 10⁻⁵ | 0.98 | 504.2 | 4.55 × 10⁻⁴ | 0.85 | 3825 | 79.34 | 2340 | 6270 | 1988 |
| HPT + 250 °C | 34.06 | 3.49 × 10⁻³ | 0.87 | 244.4 | 2.29 × 10⁻⁵ | 0.89 | 1379 | 21.32 | 1205 | 3189 | 921.5 |
| HPT + 450 °C | 30.47 | 4.29 × 10⁻³ | 0.37 | 11.31 | 7.98 × 10⁻⁵ | 0.96 | 150.8 | 22.77 | 664.8 | 747 | 164.7 |
| Mg-0.4Dy | |||||||||||
| HPT | 33.04 | 1.19 × 10⁻⁴ | 0.98 | 1.75 | 1.88 × 10⁻⁵ | 0.91 | 1713 | 595.1 | 6017 | 9975 | 1368.1 |
| HPT + 250 °C | 32.65 | 4.34 × 10⁻⁴ | 0.61 | 75.8 | 3.64 × 10⁻⁵ | 0.97 | 527.5 | 103.6 | 3955 | 1653 | 573.9 |
| HPT + 450 °C | 32.76 | 3.89 × 10⁻³ | 0.90 | 8.51 | 3.78 × 10⁻⁴ | 0.92 | 34.92 | 3.69 | 169.8 | 86.86 | 70.2 |
Disclaimer/Publisher’s Note: The statements, opinions and data contained in all publications are solely those of the individual author(s) and contributor(s) and not of MDPI and/or the editor(s). MDPI and/or the editor(s) disclaim responsibility for any injury to people or property resulting from any ideas, methods, instructions or products referred to in the content. |
© 2023 by the authors. Licensee MDPI, Basel, Switzerland. This article is an open access article distributed under the terms and conditions of the Creative Commons Attribution (CC BY) license (https://creativecommons.org/licenses/by/4.0/).
Share and Cite
Azzeddine, H.; Hanna, A.; Dakhouche, A.; Baudin, T.; Brisset, F.; Huang, Y.; Langdon, T.G. Evaluation of Thermal Stability and Its Effect on the Corrosion Behaviour of Mg-RE Alloys Processed by High-Pressure Torsion. Crystals 2023, 13, 662. https://doi.org/10.3390/cryst13040662
Azzeddine H, Hanna A, Dakhouche A, Baudin T, Brisset F, Huang Y, Langdon TG. Evaluation of Thermal Stability and Its Effect on the Corrosion Behaviour of Mg-RE Alloys Processed by High-Pressure Torsion. Crystals. 2023; 13(4):662. https://doi.org/10.3390/cryst13040662
Chicago/Turabian StyleAzzeddine, Hiba, Abdelkader Hanna, Achour Dakhouche, Thierry Baudin, François Brisset, Yi Huang, and Terence G. Langdon. 2023. "Evaluation of Thermal Stability and Its Effect on the Corrosion Behaviour of Mg-RE Alloys Processed by High-Pressure Torsion" Crystals 13, no. 4: 662. https://doi.org/10.3390/cryst13040662