
Spectroscopic Characteristics and Coloring Mechanisms of Different Colored Spinels from Myanmar

School of Gemology, China University of Geosciences, Beijing 100083, China
*
Authors to whom correspondence should be addressed.
Crystals 2023, 13(4), 575; https://doi.org/10.3390/cryst13040575
Submission received: 7 March 2023
/
Revised: 22 March 2023
/
Accepted: 24 March 2023
/
Published: 28 March 2023
(This article belongs to the Section Mineralogical Crystallography and Biomineralization)
Abstract
:Spinel is a common gemstone that has attracted the attention of gemologists worldwide because of its high refractive index, rich colors and brilliant hues. Myanmar is an important source of spinel. The present paper provides a systematic characterization of the gemological features of different color spinels from Myanmar, with a discussion and analysis of their color causes. The results show that complete octahedral crystal forms can be seen in Myanmar spinel, with the appearance of dissolution, growth motifs and cross-growth of crystals visible on the crystal surfaces. The XRF results show that the Myanmar red and orange spinel samples contain high levels of Cr, with the magenta sample having significant levels of Cr and the orange sample having more V. The blue and purple samples have high levels of Fe. The peaks of the infrared spectrum mainly appear around 841 cm−1, 690 cm−1 and 532 cm−1. Raman spectra have peaks mainly around 310 cm−1, 405 cm−1, 663 cm−1 and 764 cm−1. According to the UV-Vis spectrum, the color of Myanmar red and orange spinels is mainly due to Cr3+ and V3+. When the Cr3+ content is higher than the V3+ content, the spinels show a red hue; when the V3+ content is higher than Cr3+, the spinels have an orange hue. Blue color is due to the charge transfer between Fe2+ and Fe3+. The research in this paper has enriched the gemological characteristics of Myanmar spinel and can provide a theoretical basis for its investigation, marketability, design and utilization.
1. Introduction
Spinel is a highly prized gemstone variety that is often featured in major jewelry exhibitions and auctions. In recent years, spinel has gained a great deal of popularity in the market thanks to its colorful and relatively low prices, and it has also attracted the attention of gemologists around the world [1,2,3]. The composition of the material and its cation distribution have a strong influence on the physical properties of spinel minerals [4]. The crystal structure of spinel belongs to the cubic crystal system, where the divalent oxygen ions contained within the structure are stacked in three dimensions, in a close-packed ionic array with filled one-eighth of tetrahedral and one-half of octahedral interstices [5]. The general formula of spinel can be expressed by AB2O4 [1], among which ‘A’ ions are filled in the tetrahedral vacancies, such as Mg2+, Fe2+, Mn2+, Zn2+, Co3+ and Ni2+; B ions are in octahedral vacancies; and trivalent cations are the main ions constituting group ‘B’, such as Al3+, Fe3+ and Cr3+ [2]. The spinel-type structure can be subdivided into three subtypes according to the distribution of group A and B cations in the structure: ortho-spinel, represented by the general formula A[B2]O4; 8 group A divalent cations occupy tetrahedral positions and 16 group B trivalent cations occupy octahedral positions in the unit cell; anti-spinel, represented by the general formula B[AB]O4; 1/2 of the group B trivalent cations occupy the tetrahedral gap, and the remaining 1/2 of the group B trivalent cations and all of the group A divalent cations jointly occupy the octahedral position; mixed type, expressed by the general formula A1−xBx[AxB2−x] [6].
The current gemological research on spinel mainly covers the production origin, gemological characteristics, inclusions, synthetic and heat treatment characteristics identification, spectral characteristics and color genesis of spinel. Most gem-quality spinel deposits can be classified as metamorphic or magmatic by their production. Metamorphic deposits are in most cases formed by contact metamorphism of molten magma intruding into tuffs or dolomites containing inclusions, and are often syngenetic with corundum group minerals. Spinel is often syngenetic with magnesian olivine and diopside. Magmatic deposits spinel occurs mainly in aluminum-rich basic magmatic rocks and is often syngenetic with pyroxene, olivine, magnetite, chromite and platinum group minerals [7]. Most gem spinel are found in impact deposits (secondary deposits). The main sources of spinel are Myanmar, Vietnam, Thailand, Tanzania, Tajikistan, Sri Lanka, Pakistan, Afghanistan, Kenya, Madagascar, Australia, the United States, and Brazil. Among them, and the most famous are red spinel and blue spinel from Myanmar, Thailand and Sri Lanka [8]. Spinel contains numerous inclusions, including solid inclusions (dolomite, magnetite, chromite, flake graphite, columnar apatite, quartz, titanite, zircon, rutile, olivine, pyrrhotite, rutile, epidote) [9]. In addition to inclusions, raw spinel crystals are also commonly found with unhealed cleavage or healed cleavage (fingerprint-like gas-liquid inclusions), growth features (development of growth color bands along octahedral crystal faces), etc. As the value of gem-quality spinel has gone up in the jewelry market, heat treatment techniques for spinel have also come into being. The Gemological Institute of America (GIA) and the Swiss Gemological Research Laboratory (GRS) [10] conducted studies on the heat treatment of spinel in 2004 and 2015, respectively, and the GRS report contained a detailed demonstration of the heat treatment process of spinel. The results showed heat treatment is detectable by Raman spectroscopy and can be semi-quantitatively characterized by the spectral peak parameters (half-height width, spectral peak).
Current research on spinel is focused on chromogenic elements [11,12,13,14]. Pure spinel (MgAl2O4) is colorless. Due to the abundance of trace elements (transition elements Cr3+, Fe2+, Fe3+, Co2+), spinel displays different colors. The color of the orange and red spinels is mainly attributed to the presence of V3+ and Cr3+ in the octahedral voids within the structure [15]. Purple spinel is mainly blue (containing Fe and Co) mixed with pink/red (containing Cr); the gray tone of spinel is caused by Fe (Fe2+); green spinel is rare, often blue-green or gray-green, and its main color-causing element is Fe. The blue color of spinel is generally caused by the internal presence of the elements Co or Fe [12]. When the Co and Fe contents are comparable, the effect of Co electron leap on the color is greater than that of Fe. The absorption bands at 545 nm, 550 nm, 580 nm and 625 nm, and the two absorption bands at 556 nm and 588 nm, overlap with those of Fe ion electron leap, resulting in a more intense blue color of spinel [13]. When the Co content is negligible (e.g., <10 ppm), the different shades of gray-blue (from blue-violet to blue-green) are related to the valence and position distribution of Fe ions: when only TFe2+ (T means that the ion is in a tetrahedral structure while M means in octahedral) is present, the spinel is violet-blue due to the electron leap; when the concentration of MFe3+ increases, the absorption at 588 nm makes the spinel pure blue, and when the concentration of MFe2+ and MFe3+ increases, the spinel is greenish-blue due to the charge transfer of Fe2+-Fe3+ at 667 nm. Completely colorless spinel is rare, often with pinkish tones due to Cr content or grayish tones due to Fe2+ content [16]. The type of spinel optical absorption spectrum is largely determined by these specific elements. For example, the blue, pink and green iron-rich spinel crystals, which despite the wide variation in their colors produce relatively similar spectra from optical absorption, all have strong UV-edge absorption and a range of weaker absorption bands. Besides this, the variance in color from pink to blue and green spinel samples depends on the increase in Fe2+ (primary) and Fe3+ content (secondary), which is responsible for the enhanced absorption in the UV-edge.
Myanmar is the most famous source for medium/small-sized red spinels [1], so studies on Myanmar spinels have focused on the red variety ‘Jedi’ [3,8]. Higher levels of Zn compared to other origins give the Myanmar ‘Jedi’ spinel a more fluorescent appearance, giving it a neon and hot pink tint [3]. The geological deposits of spinel in Myanmar have a long history and are mainly found in the three production areas of Mogok, Ywathit and Namya. The ‘Mogok Stone Tract’ in Mandalay District is the main spinel-producing area in Myanmar and includes several areas around Mogok. Spinels are found in abundance in corundum deposits [17]. The Mogok metamorphic belt is known geotectonically for its high temperature plastic deformation, which was formed around the Oligocene and post-Miocene and is associated with the oblique collision of the India-Eurasia plate [18]. Spinel often occurs with rubies in mines, and many co-occurring minerals can be found in the deposit, including various mica minerals, marble, graphite, pyrite, sphene and so on [19,20]. Studies on the geology of spinel deposits in Myanmar are well-established and much research has been carried out on the red spinels of Myanmar; however, there remains a relative lack of comparative studies on the different colors of spinel from Myanmar.
In the present study, seven raw spinels of different colors from Myanmar were selected, and their surface morphology and crystal shape were observed under the microscope. An X-ray fluorescence spectrometer (EDXRF), Fourier transform infrared spectrometer (FTIR), UV-Vis spectrophotometer and Raman spectroscopy were employed to obtain a systematic examination of the color causes in natural spinel samples from Myanmar. This paper enriches the theoretical study of the different colors of Myanmar spinel by examining the chromogenic elements and characteristic spectra of Myanmar spinel. In addition, this study provides a theoretical basis for the identification and classification of Myanmar spinels by observing and collating their crystallographic characteristics.
2. Materials and Methods
2.1. Materials
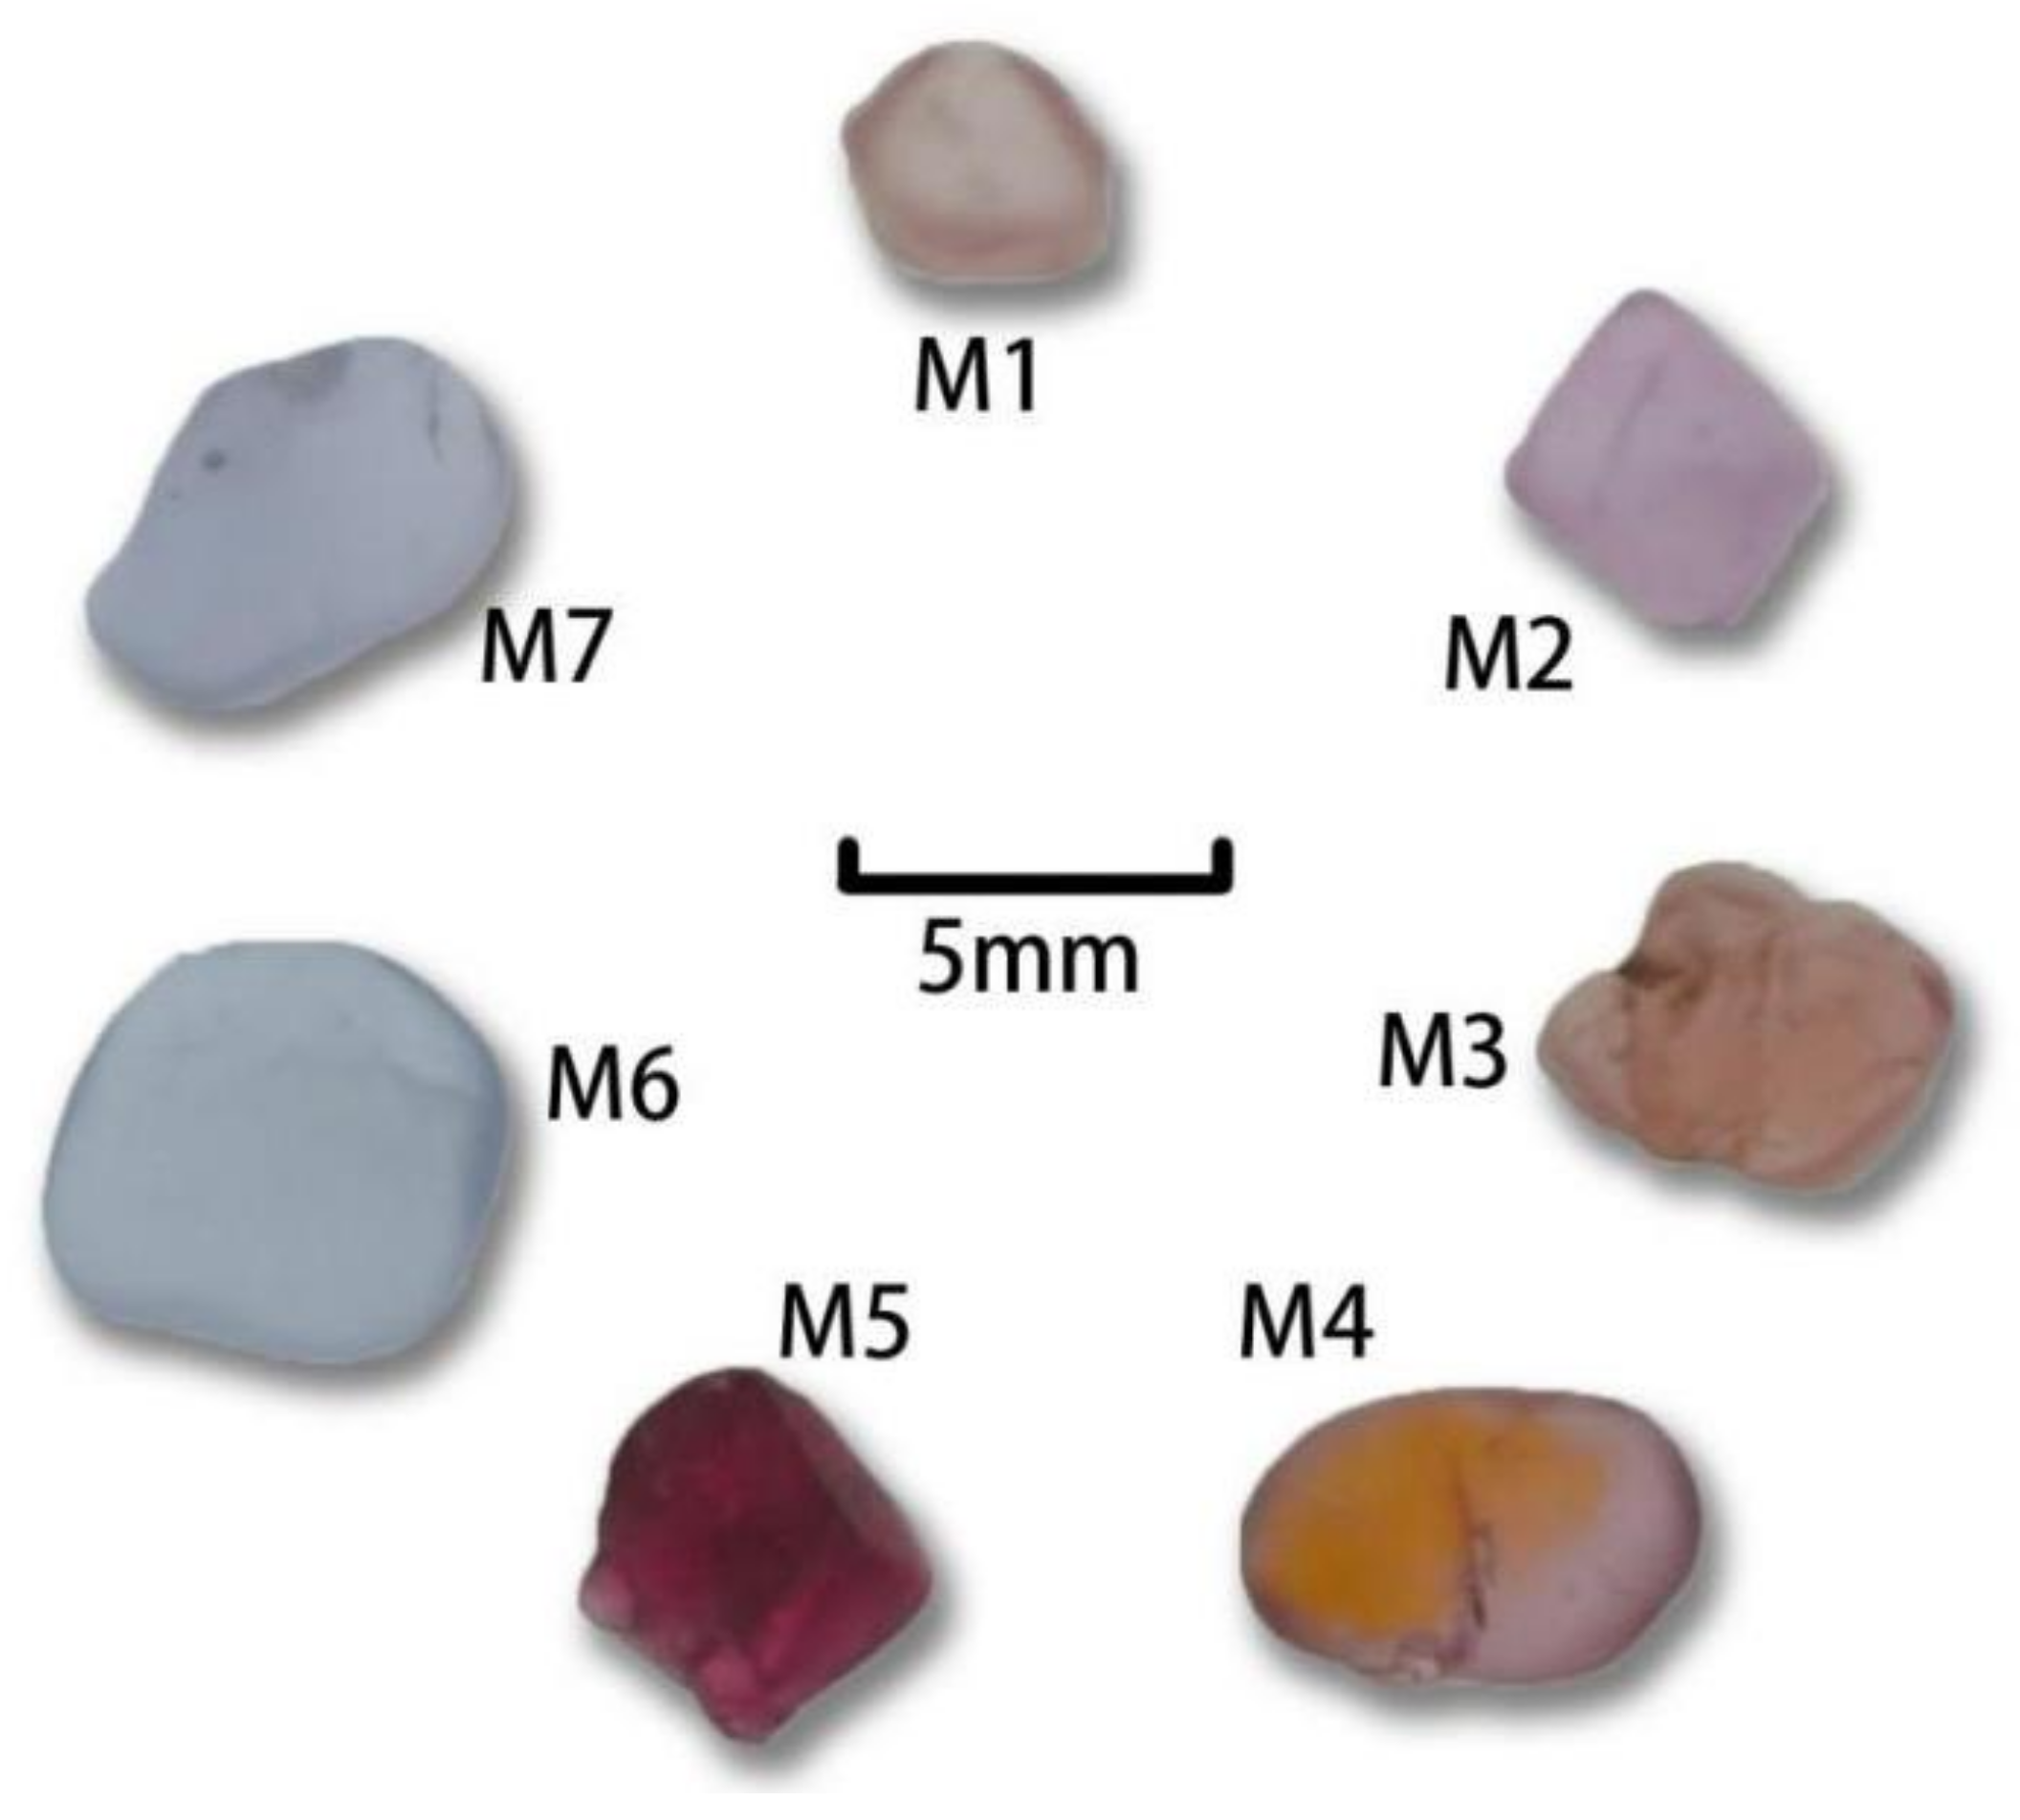
Figure 1 shows seven samples of natural spinel from Myanmar in pink (M1), violet (M2), orange (M3,) orange-violet (M4), red (M5) and blue (M6, M7). Samples M1 and M2 have a very complete octahedral crystal shape. M3 and M5 have a fragmentary appearance with some internal fissures. M4, M6 and M7, which have undergone longer river transport, are better-rounded and have a pebbly appearance.
2.2. Methods
Conventional gemological features were measured at China University of Geosciences Beijing (CUGB) Gemological Experimental Teaching Centre. Measure the specific gravity with the hydrostatic weighing method. The samples were observed under LW and SW using UV fluorescent lamps, and the luminescence of the samples under LW was photographed using Diamond View. Microscopic observation was carried out using a GI-MP22 gemological photographic microscope.
The data of energy dispersive X-ray fluorescence (XRF) were measured at China University of Geosciences Beijing (CUGB) Gemological Experimental Teaching Centre. The instrument used was EDX-7000 energy dispersive X-ray Fluorescence Spectrometer produced by Shimadzu manufacturer in Japan. The experimental test conditions were: element analysis range was (13)Al-(92)U, accuracy 0.1 ppm, and the test environment was vacuumized before the test.
A UV-Vis spectrophotometer of the model UV-3000 produced by the Shimadzu company in Japan was used, situated in the Gemological Experimental Teaching Centre of the China University of Geosciences Beijing (CUGB). The experimental test method was the transmission method, the test range was 200–900 nm, the light source conversion wavelength was 310 nm, the grating conversion wavelength was 720 nm, and the sampling interval was 0.1 s.
Fourier transform infrared spectroscopy was performed at the China University of Geosciences Beijing (CUGB) Gemological Experimental Teaching Centre. The instrument used for the experiment was the BRUKER Fourier transform infrared spectrometer-Bruker Tensor 27, manufactured by BRUKER Spectrometer, Germany. The experimental conditions were as follows: Using the reflection method for testing, temperature range: 18~35 ℃, humidity range: less than 70%, resolution: 4 cm−1, grating set to 6 mm, 10 KHz, spectral range: 400~2000 cm−1, number of scans per sample: 32.
Raman spectroscopy was performed at the China University of Geosciences Beijing (CUGB) Gemological Experimental Teaching Centre, using a HORIBA LabRAM HR-Evolution Raman spectrometer. Microscope with ×50 objectives was used to focus on the samples. The sample was not polished due to its small size, but a smoother surface was sought for the actual inspection. The laser beam was perpendicular to the surface of the sample. The Raman spectrometer recorded in the 200–1000 cm−1 range and with 4 cm−1 resolution, with an excitation light source λ = 532 nm and 3 s exposure time.
3. Results and Discussion
3.1. Gemological and Crystallographic Characteristics
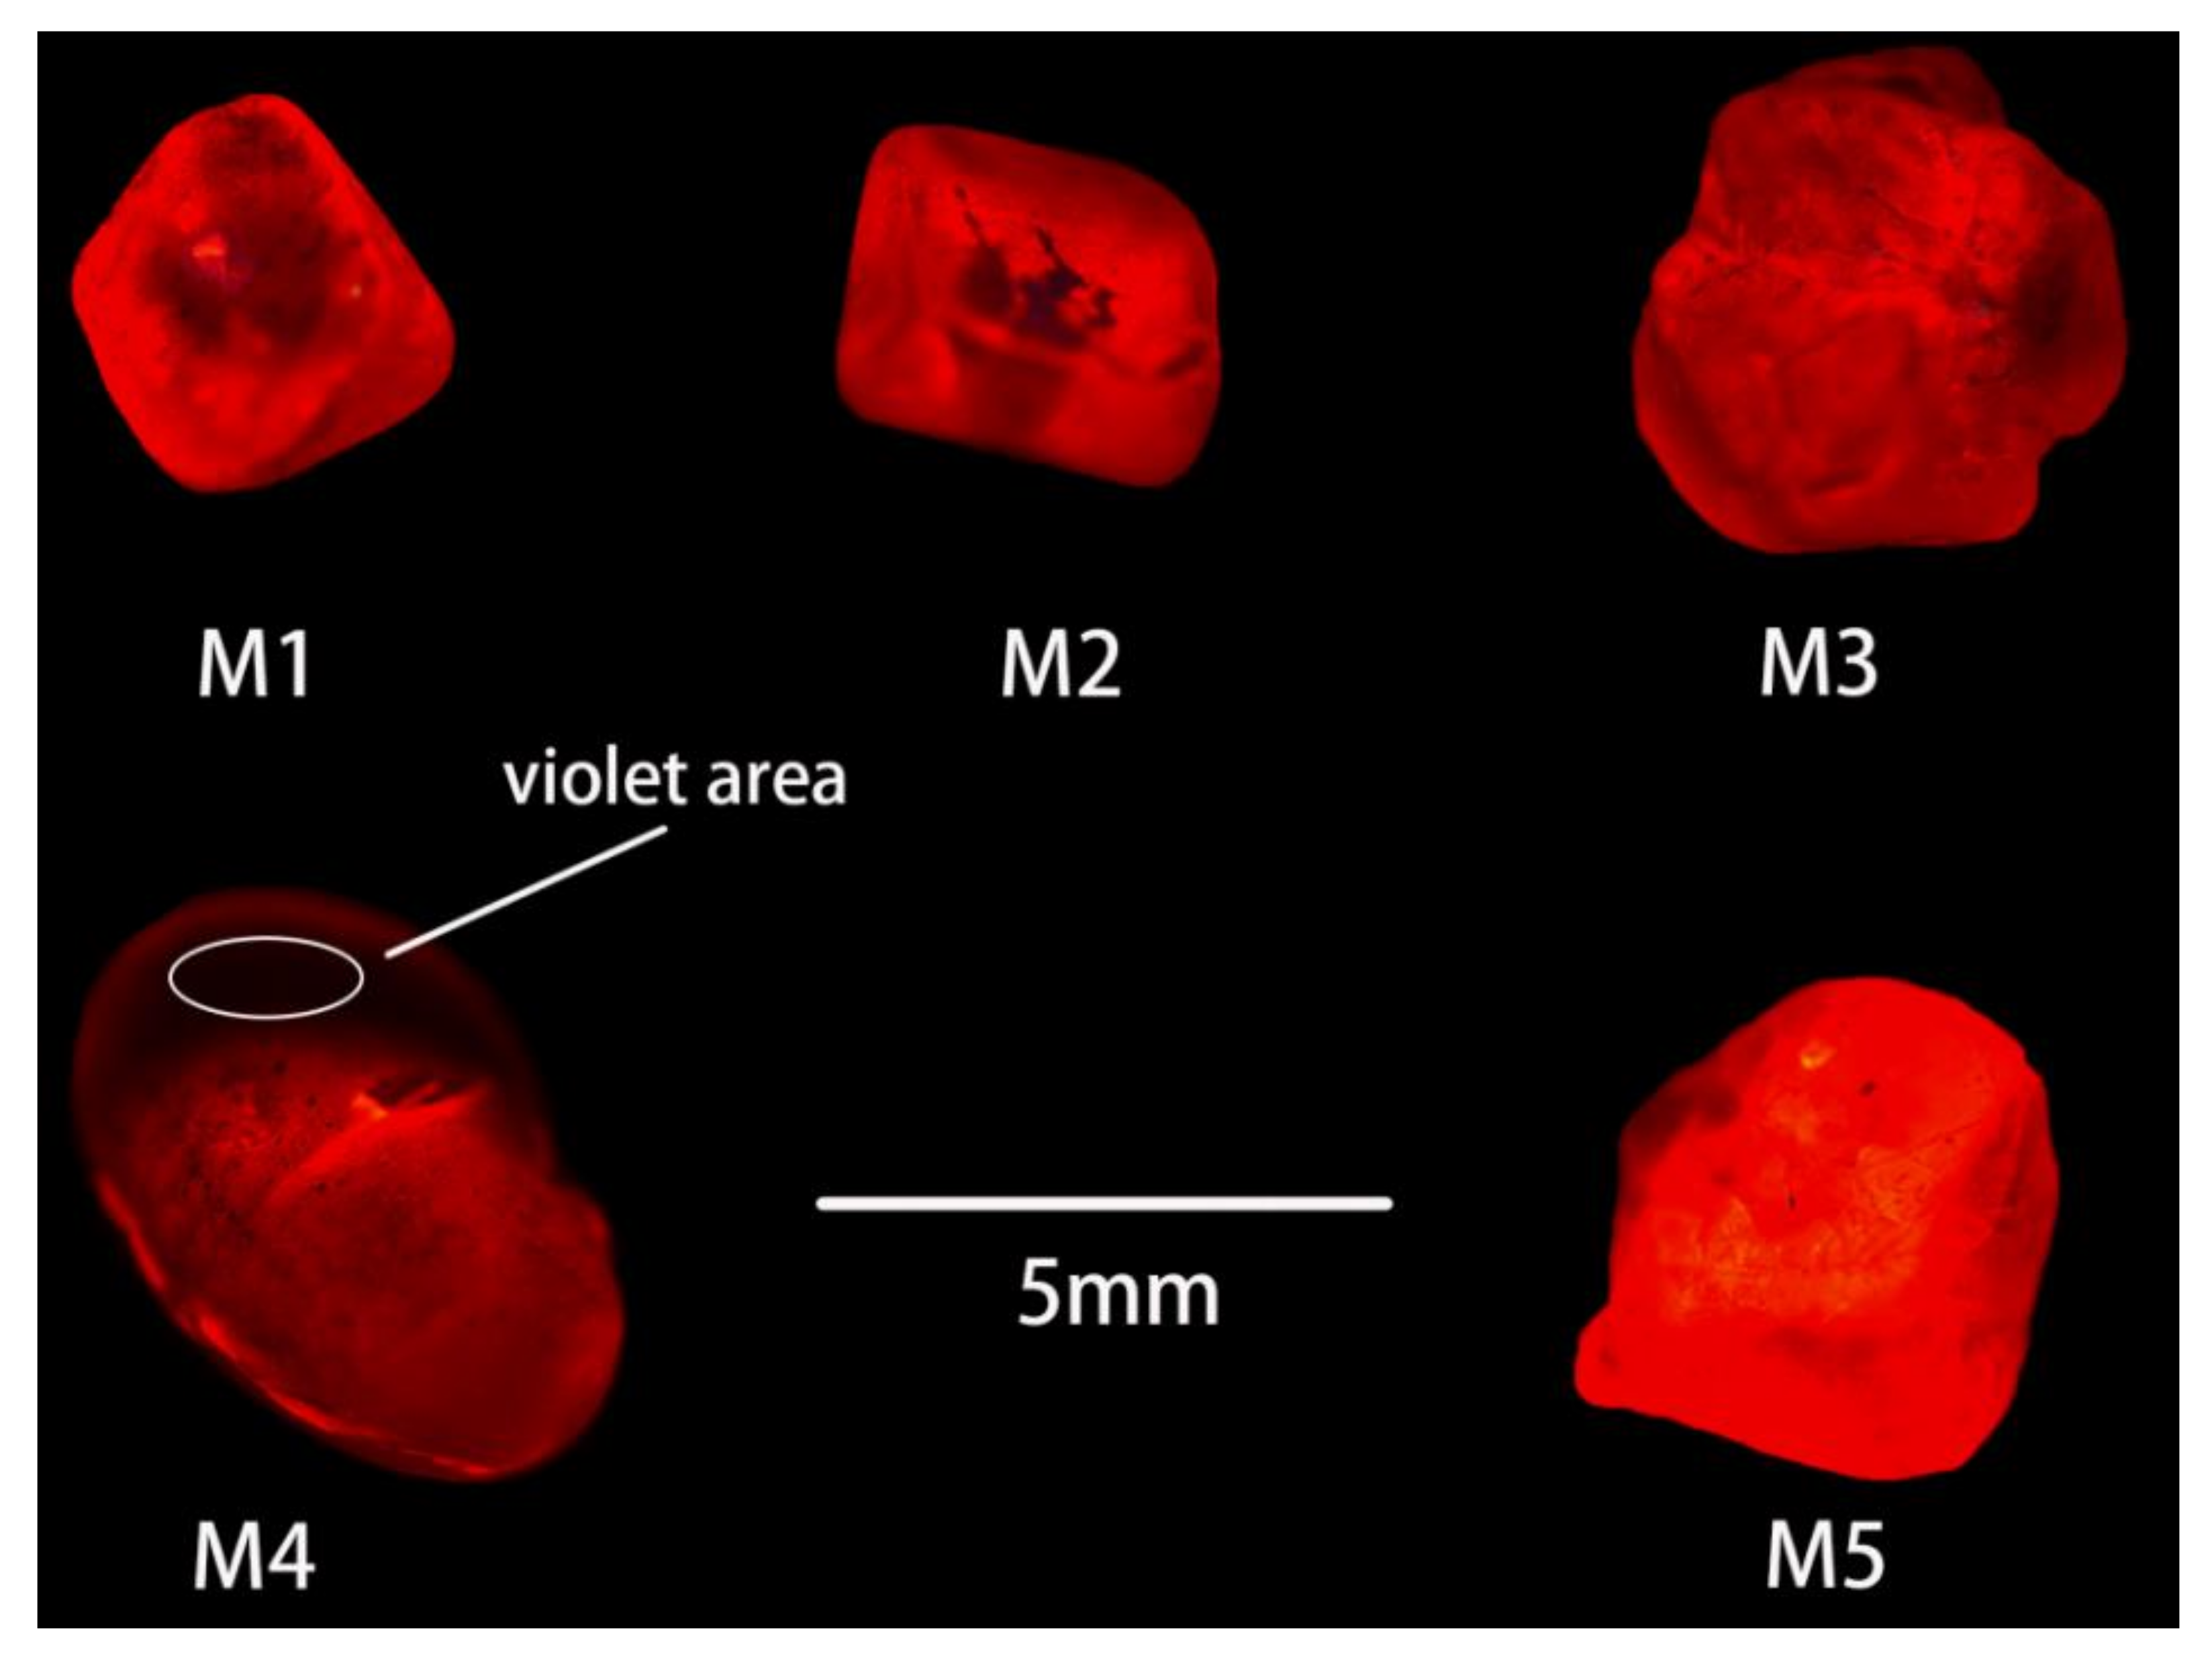
The conventional gemological characteristics of Myanmar spinels are shown in Table 1. Seven spinel samples were tested, and the specific gravity of the samples ranged from 3.45 to 3.58. The luminescence of the samples under long-wave UV radiation was observed under the Diamond View. As shown in Figure 2, an intense red fluorescence was observed for the pink, red and orange samples. The red sample M5 had the most intense red fluorescence, indicating a high Cr content. The violet sample showed low fluorescence, especially the violet part of the bi-color sample M4, which was barely visible. The blue samples showed an absence of fluorescence under the Diamond View.
As shown in Table 1, seven samples of Myanmar spinel were observed under the Chelsea color filter and subtle hue variations were observed in some samples. For example, the violet sample M2 shows a pinkish tint under the Chelsea color filter. It should be noted that the red sample M5 shows a bright-red hue under the Chelsea color filter. This feature can be used to quickly distinguish spinel from ruby samples, as ruby with a similar color does not usually show such an intense red hue under the Chelsea color filter. The remaining samples M1, M3, M4, M6 and M7 show no significant hue change under the Chelsea color filter. Using a grating spectroscope (hand-held), the sample was observed to have a distinct Cr absorption spectrum in the red sample M5, as evidenced by two distinct absorption lines in the red region at approximately 686 nm and 675 nm, and a broader absorption band in the green and violet regions. Using a hand-held spectroscope to observe samples M6 and M7, a Fe absorption pattern can be observed, demonstrated by some distinct absorption lines in the purple spectral region. No significant absorption lines are observed using a hand-held spectroscope in the other samples due to their too-light color and too-small size.
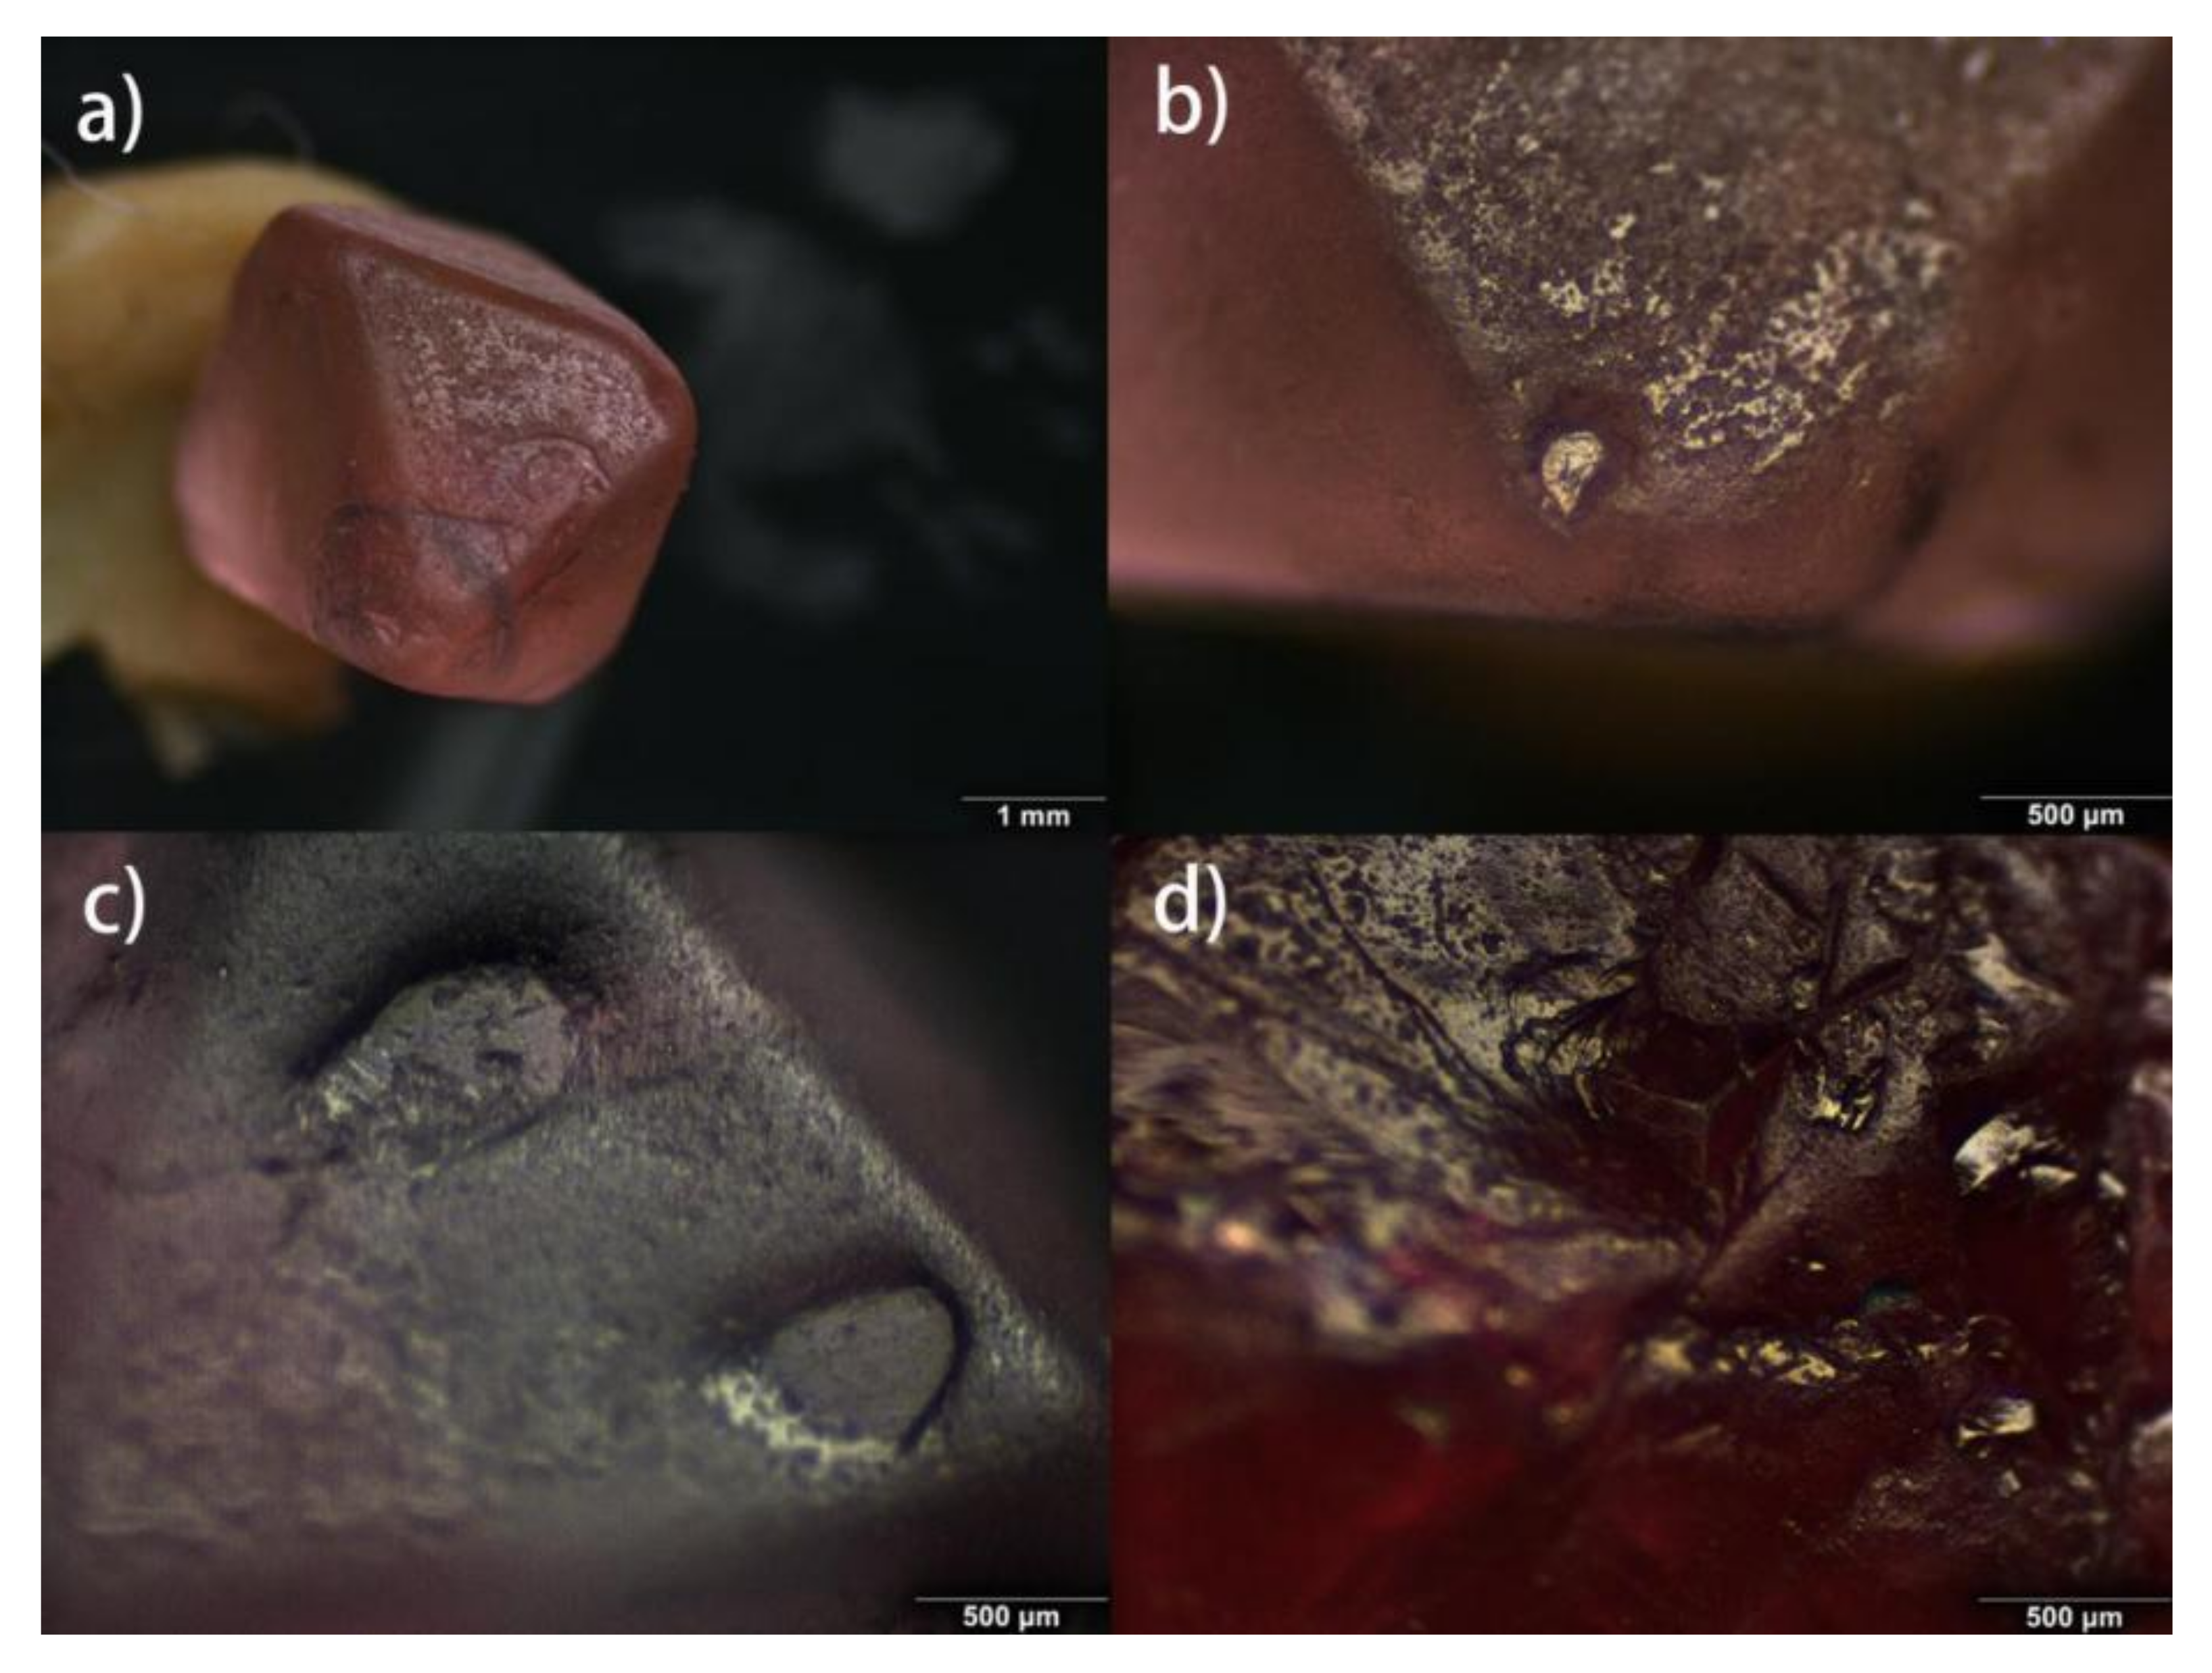
As shown in Figure 3a, the typical octahedral crystal shape of spinel can be seen when sample M1 is viewed under the microscope. Figure 3b demonstrated a distinctly soluble appearance and the peculiar triangular growth motifs of spinel crystals that are on the surface of M1. In Figure 3c, it can be clearly observed that inverted triangular-shaped growth pits are distributed on the crystal surface of sample M2. In Figure 3d, M5 can be observed with a tetrahedral angular inward concavity that results from the intercalated growth of the spinel crystal.
3.2. Composition Analysis of Myanmar Spinel
X-ray Fluorescence Spectroscopy (XRF)
According to Table 2, the main elements of Myanmar spinel are Mg and Al, and the trace elements are mainly Cr, Fe, V, Ti, Mn, Ni and Zn, with Mn and Ti at a lower level. The Al2O3 content is around 65%, while the MgO content is around 30%. The main determinant of the color of Myanmar spinel is the content of elemental Cr, followed by the concentration of Fe and V. Cr was the element that mainly caused the red color, with the red sample M5 having much higher levels of Cr than the other samples. The orange sample M3 has a slightly higher V content, while the blue samples M6 and M7 have significantly higher levels of Fe to the other samples. In short, the test results show that the trace element content of the samples varies by colors, the red-orange spinel containing more Cr and V while the blue-violet has a higher Fe content [21].
3.3. Spectroscopy Analysis of Myanmar Spinel
3.3.1. Fourier Transform Infrared Spectroscopy (FTIR)
It is the highly symmetrical group of cubic centroids that gives spinel its structure, which is due to the fact that spinel belongs to the fully symmetrical isometric crystal system. This is why only four vibrational modes appear in the infrared spectrum of spinel in the range from 400 to 1000 cm−1 [22]. In the structure of spinel, one tetrahedron shares oxygen atoms with three octahedra, so that neither the oxygen tetrahedron nor the octahedron vibrations can occur independently. The two higher-frequency vibrations in the spinel infrared spectrum do not correlate well with the mass of the spinel cations, while the two lower-frequency vibrations correlate closely with the relative displacement between the cations. All four vibrational modes are affected by Al3+-O bonding forces, with the F31u and F21u frequencies being affected by the Al mass-due to the larger Al3+ mass, it will be more involved in the F21u vibration. In addition, F41u will be more sensitive to the mass of Mg [23].
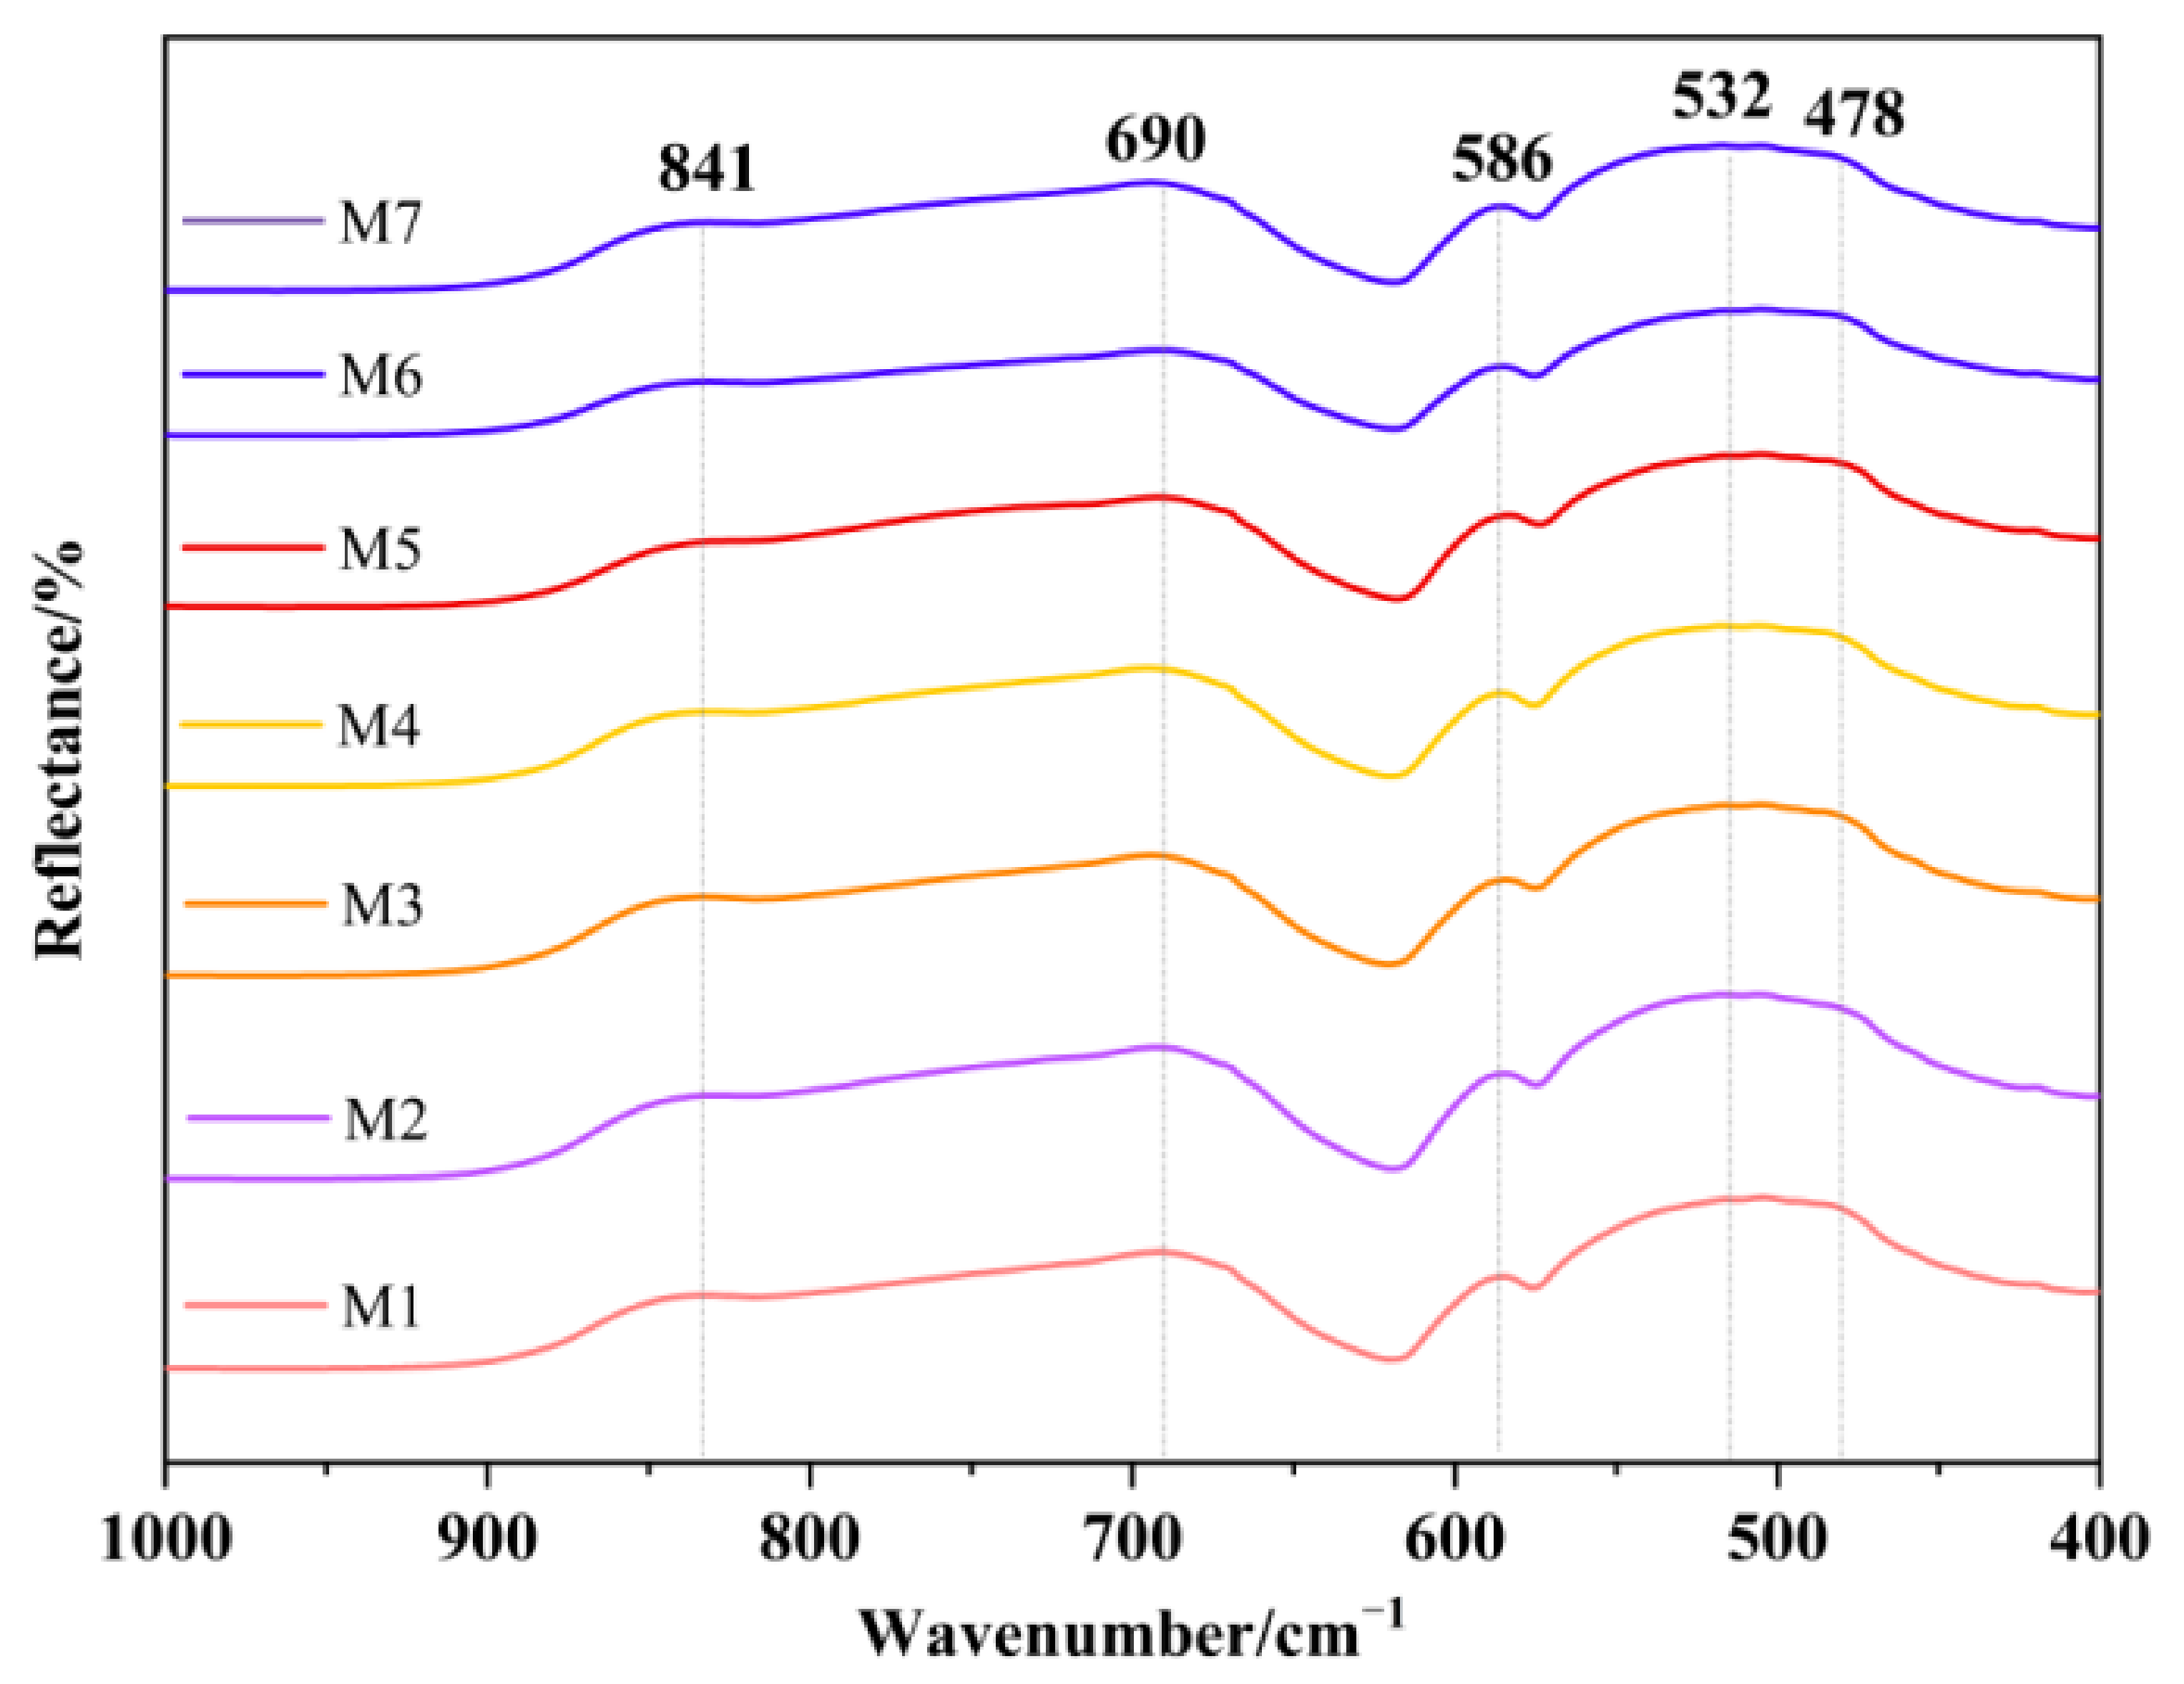
Seven samples were pretreated by surface smoothing and then tested by FTIR spectroscopy; the results are illustrated in Figure 4. As shown in Figure 4, the infrared spectra of the different colors of Myanmar spinel have similar peaks at 478 cm−1, 532 cm−1, 586 cm−1, 690 cm−1 and 841 cm−1, respectively. Near 841 cm−1 is a high frequency band caused by oxygen ion vibrations [24]. Peaks at 532 cm−1 and 586 cm−1 are vibrations from Al-O bond stretching. It is notable that the FTIR spectra of the seven different colored samples show a high degree of consistency, with similar peak and trough positions, from which it can be deduced that color has no effect on their FTIR spectra.
3.3.2. Raman Spectra
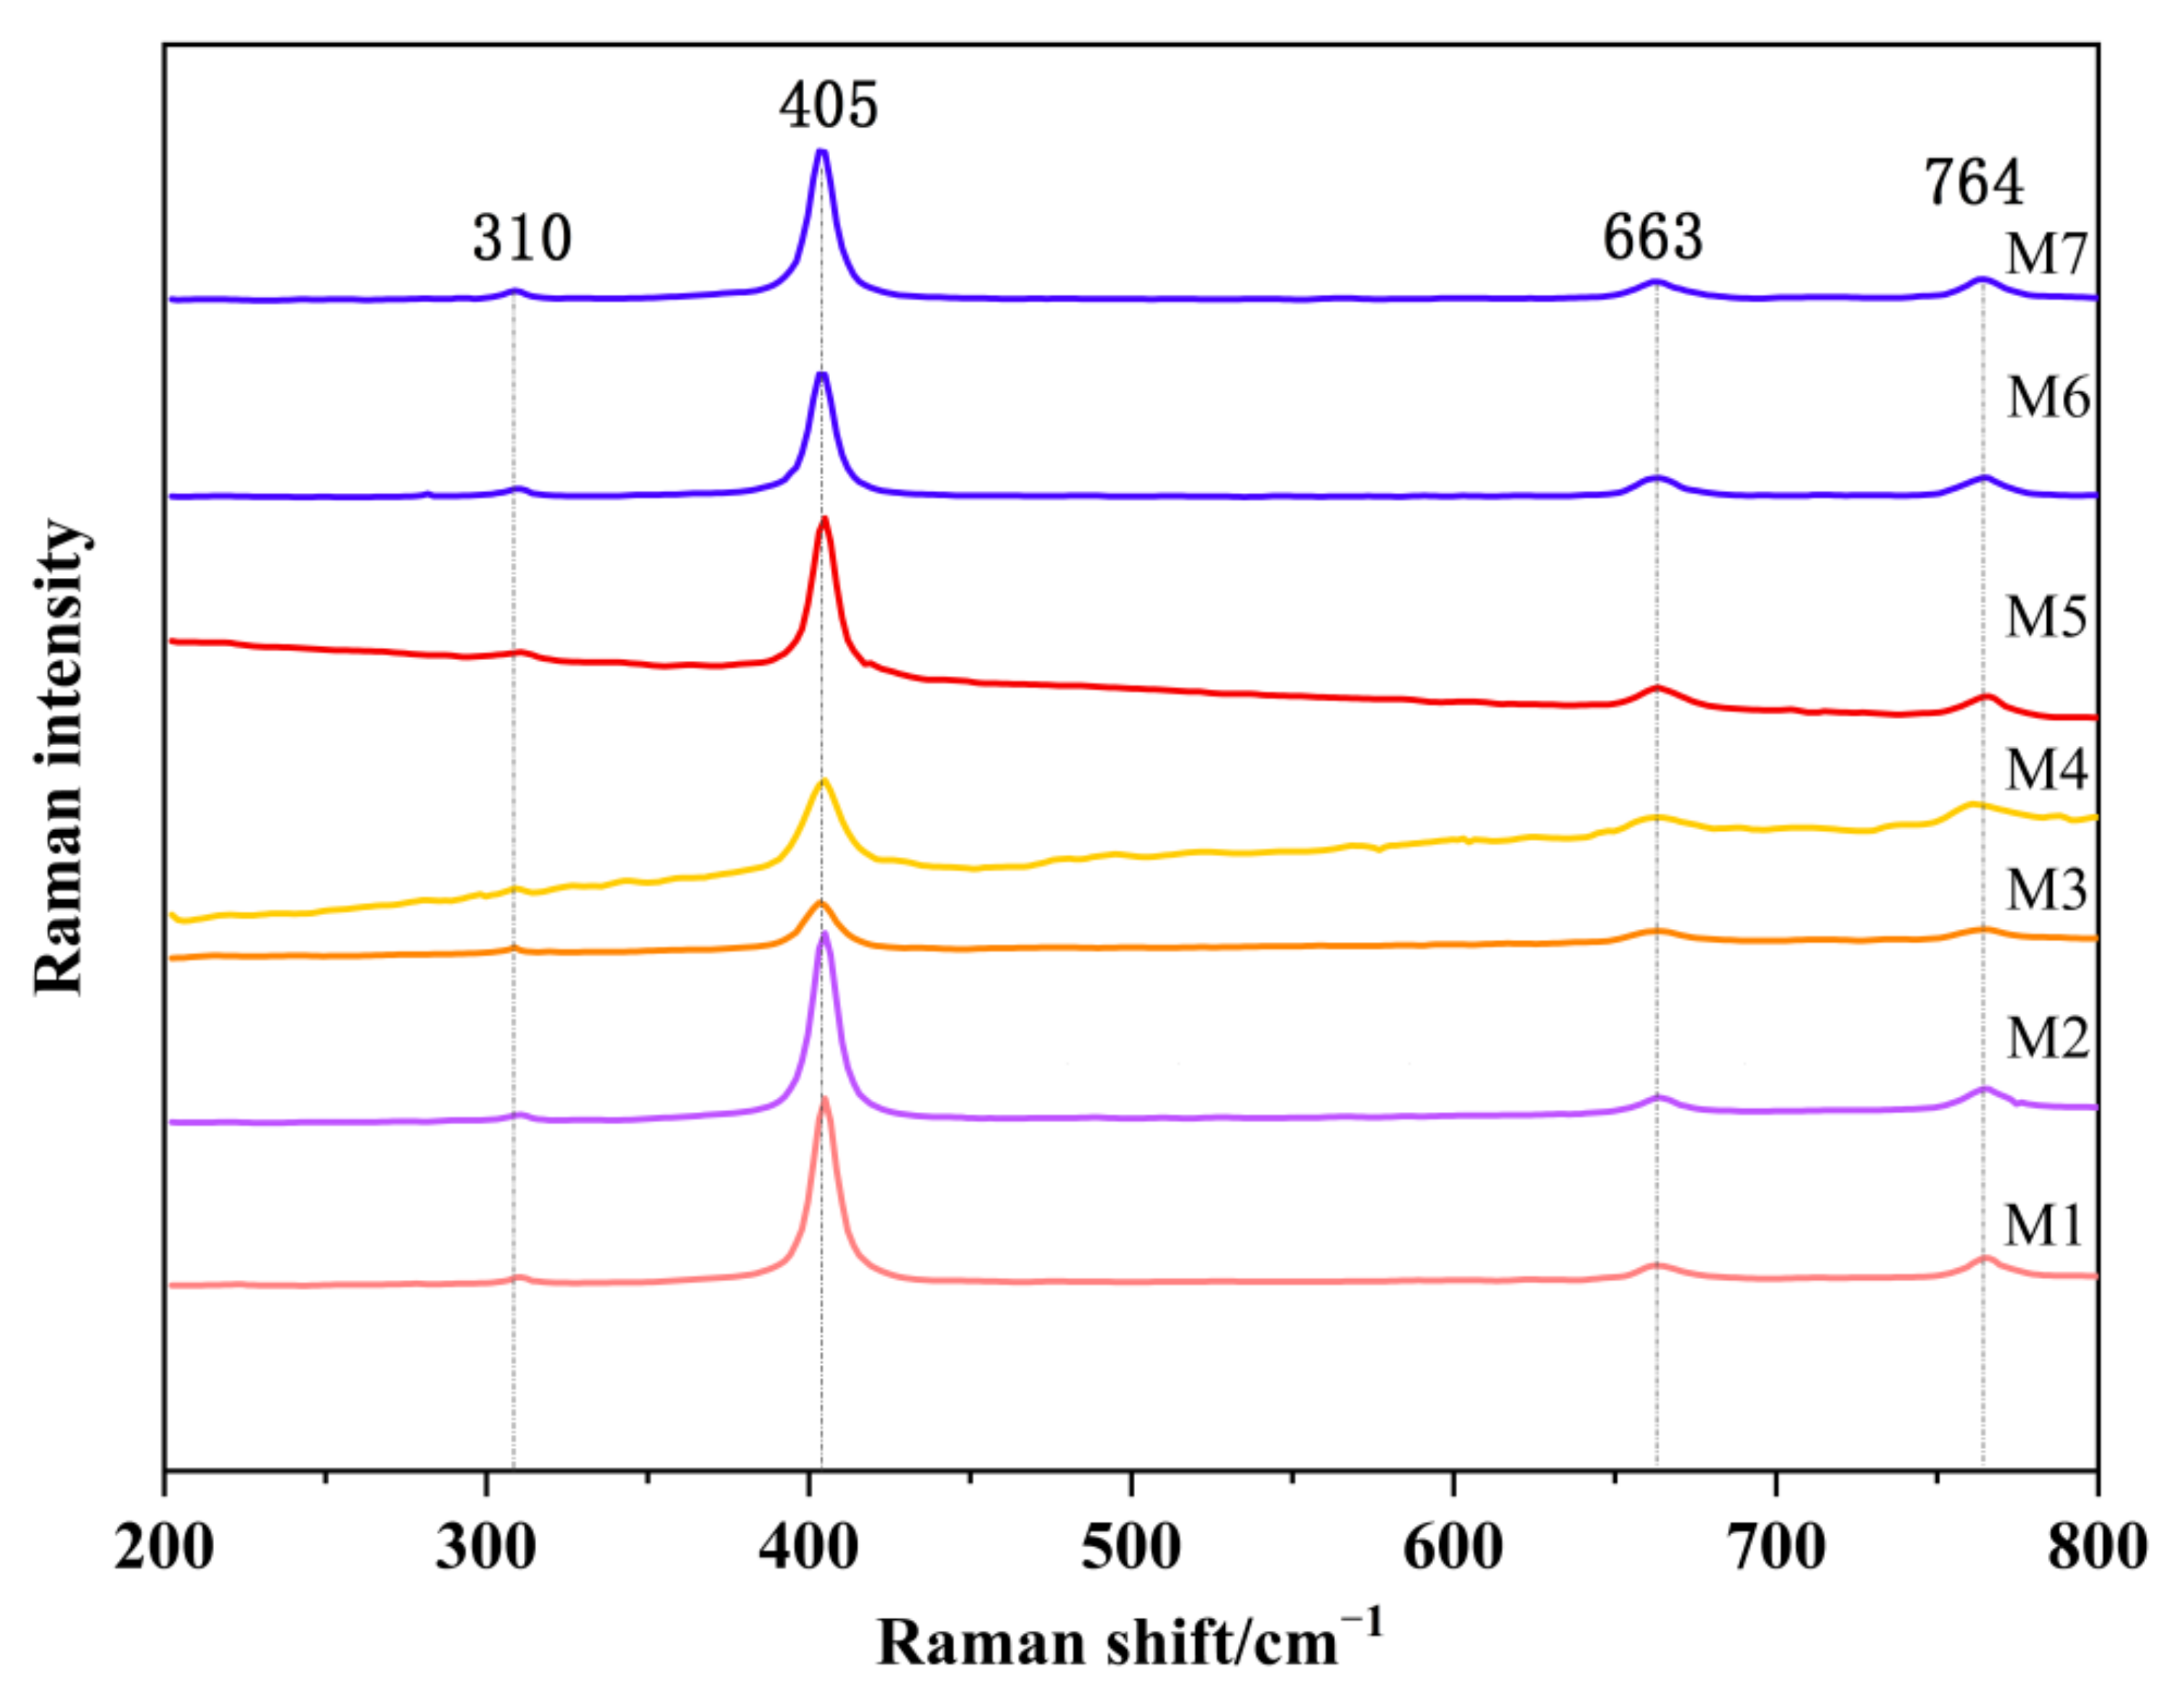
Figure 5 demonstrates the Raman spectroscopy profiles of the seven samples. As shown in Figure 5, the Raman spectra of the seven spinel samples showed a consistent pattern, composed mainly of four intense and well-defined bands, which were situated at 310 cm−1, 405 cm−1, 663 cm−1 and 764 cm−1. The peak Eg at 405 cm−1 shows that all seven samples are Mg-Al spinel [25]. In addition, the residual peaks at 310 cm−1, 663 cm−1 and 764 cm−1 correspond to the signature peaks of T2g(1), T2g(2), A1g, respectively [26,27,28].
3.3.3. UV-Vis Spectroscopy
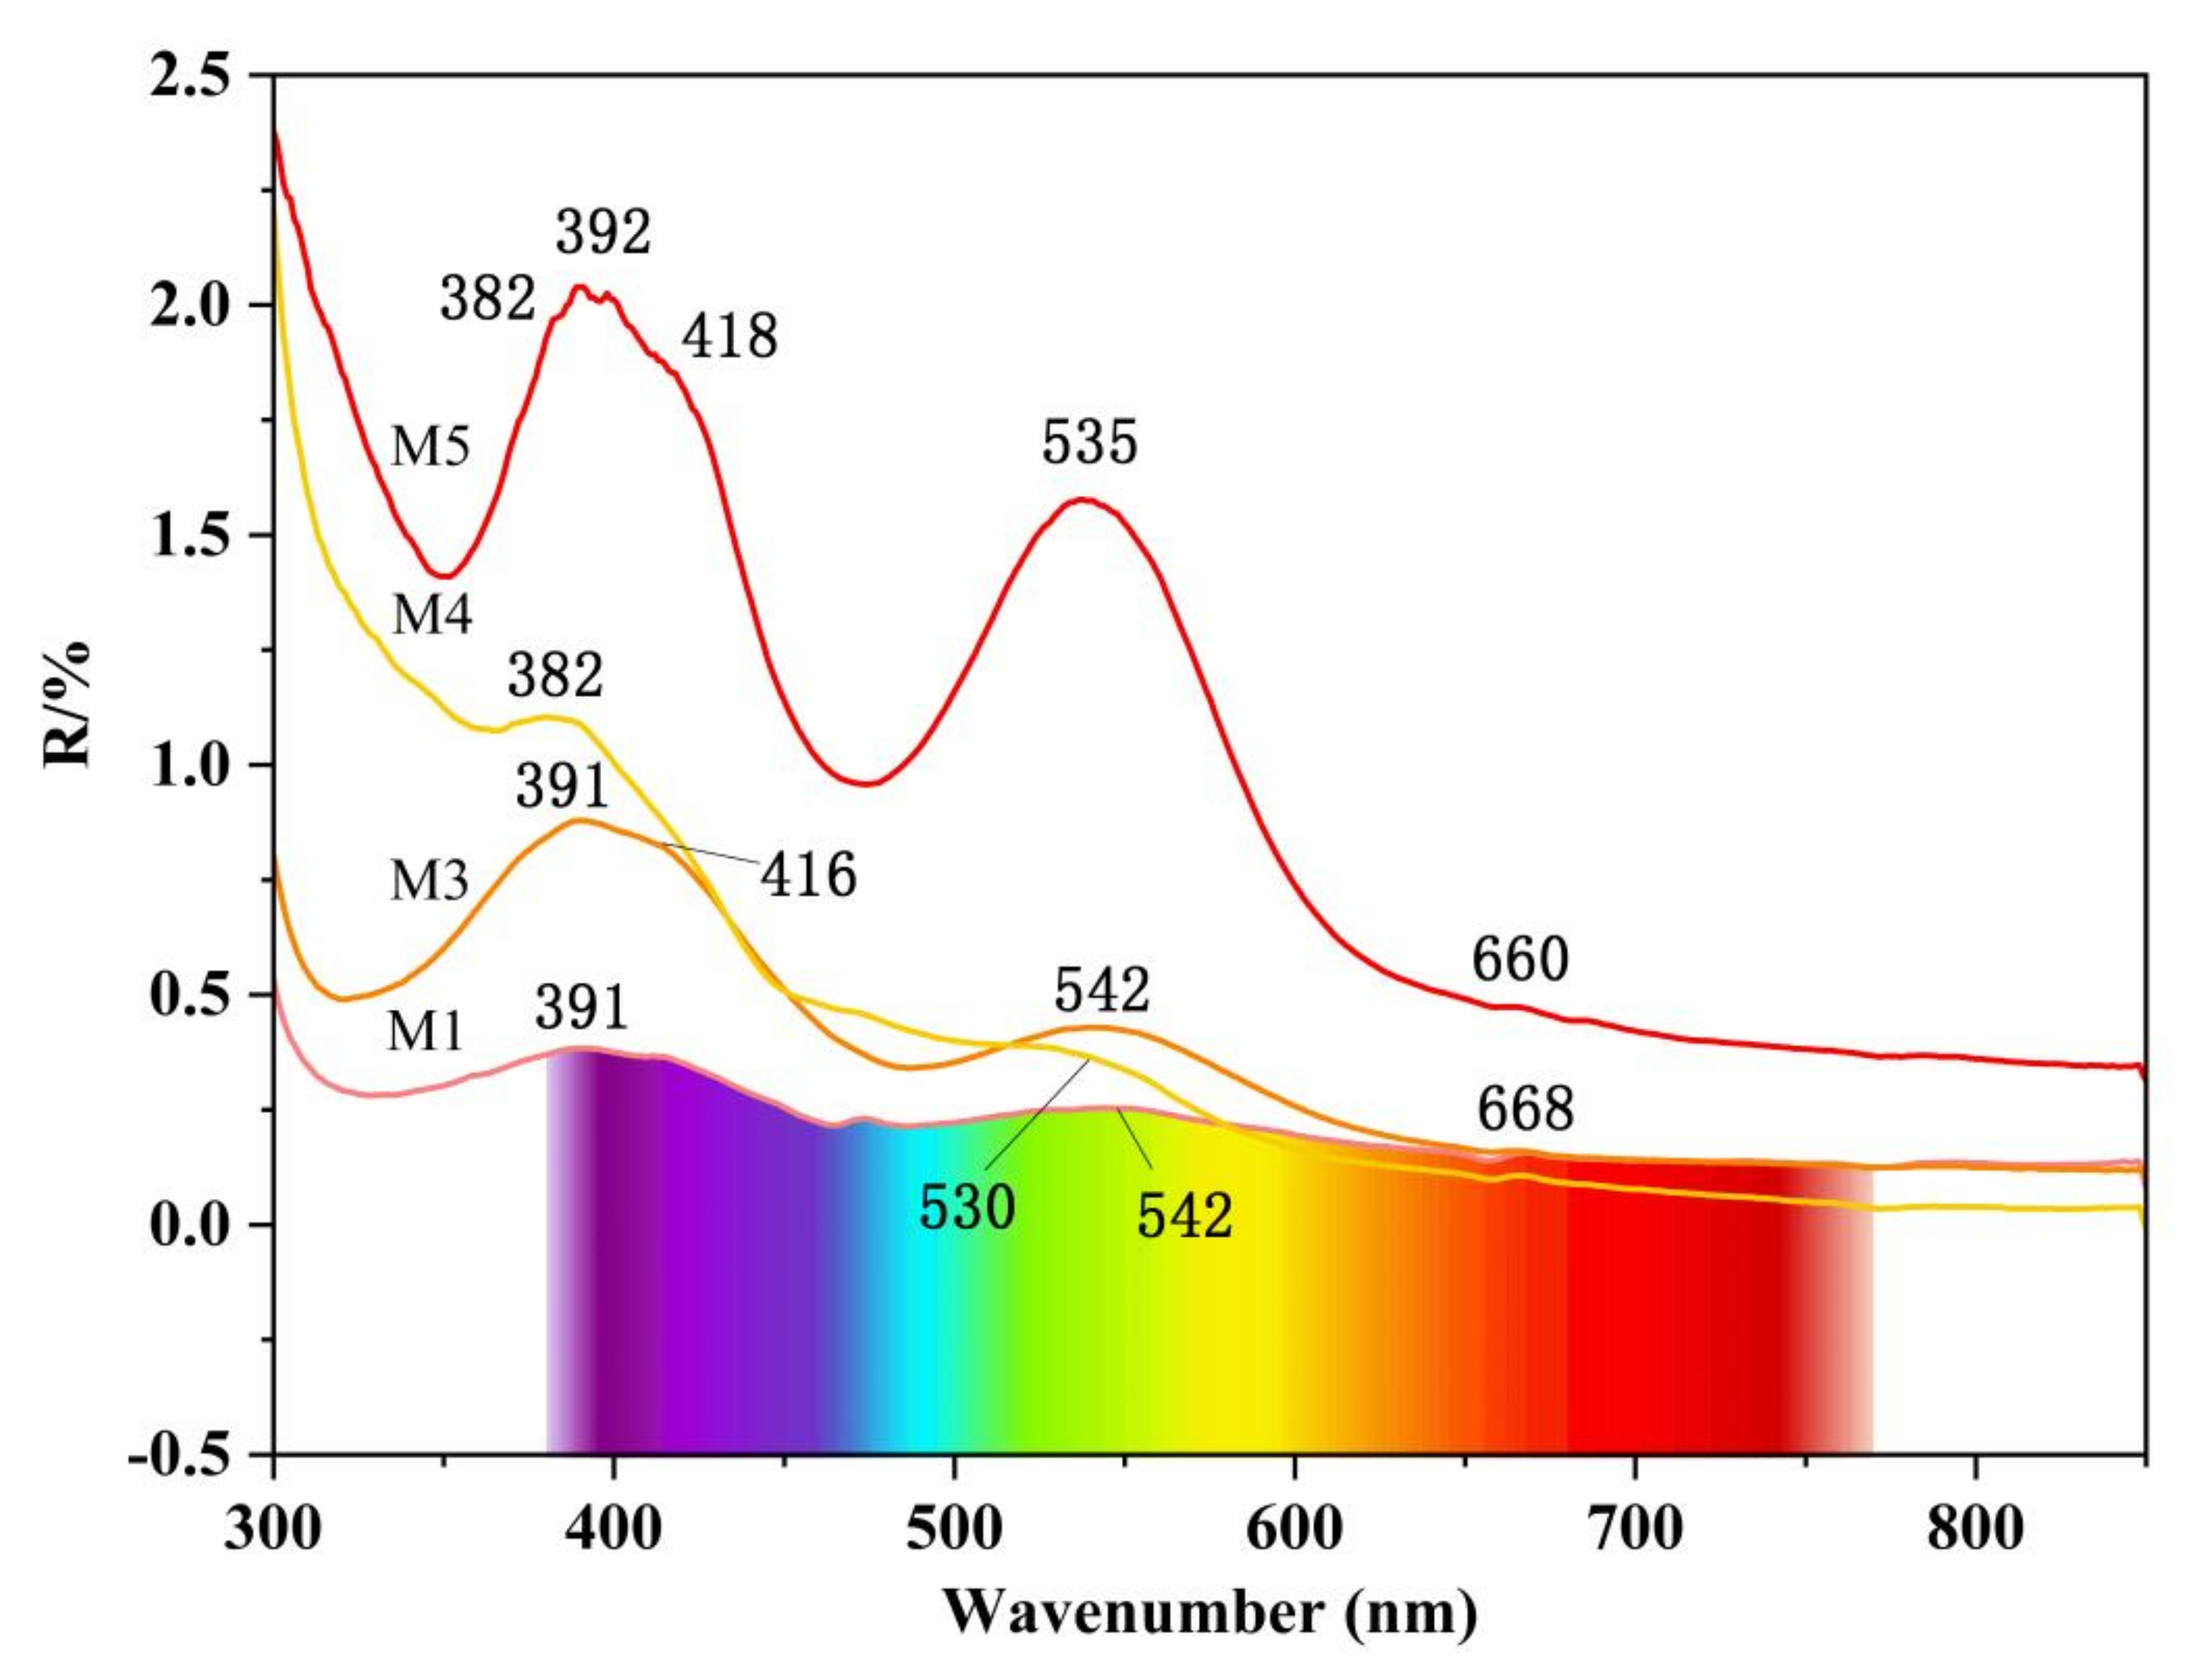
The UV-Vis spectrophotometer was used to test the pink-red spinel samples (M1 M3 M4 M5), and Figure 6 shows the absorption of the samples.
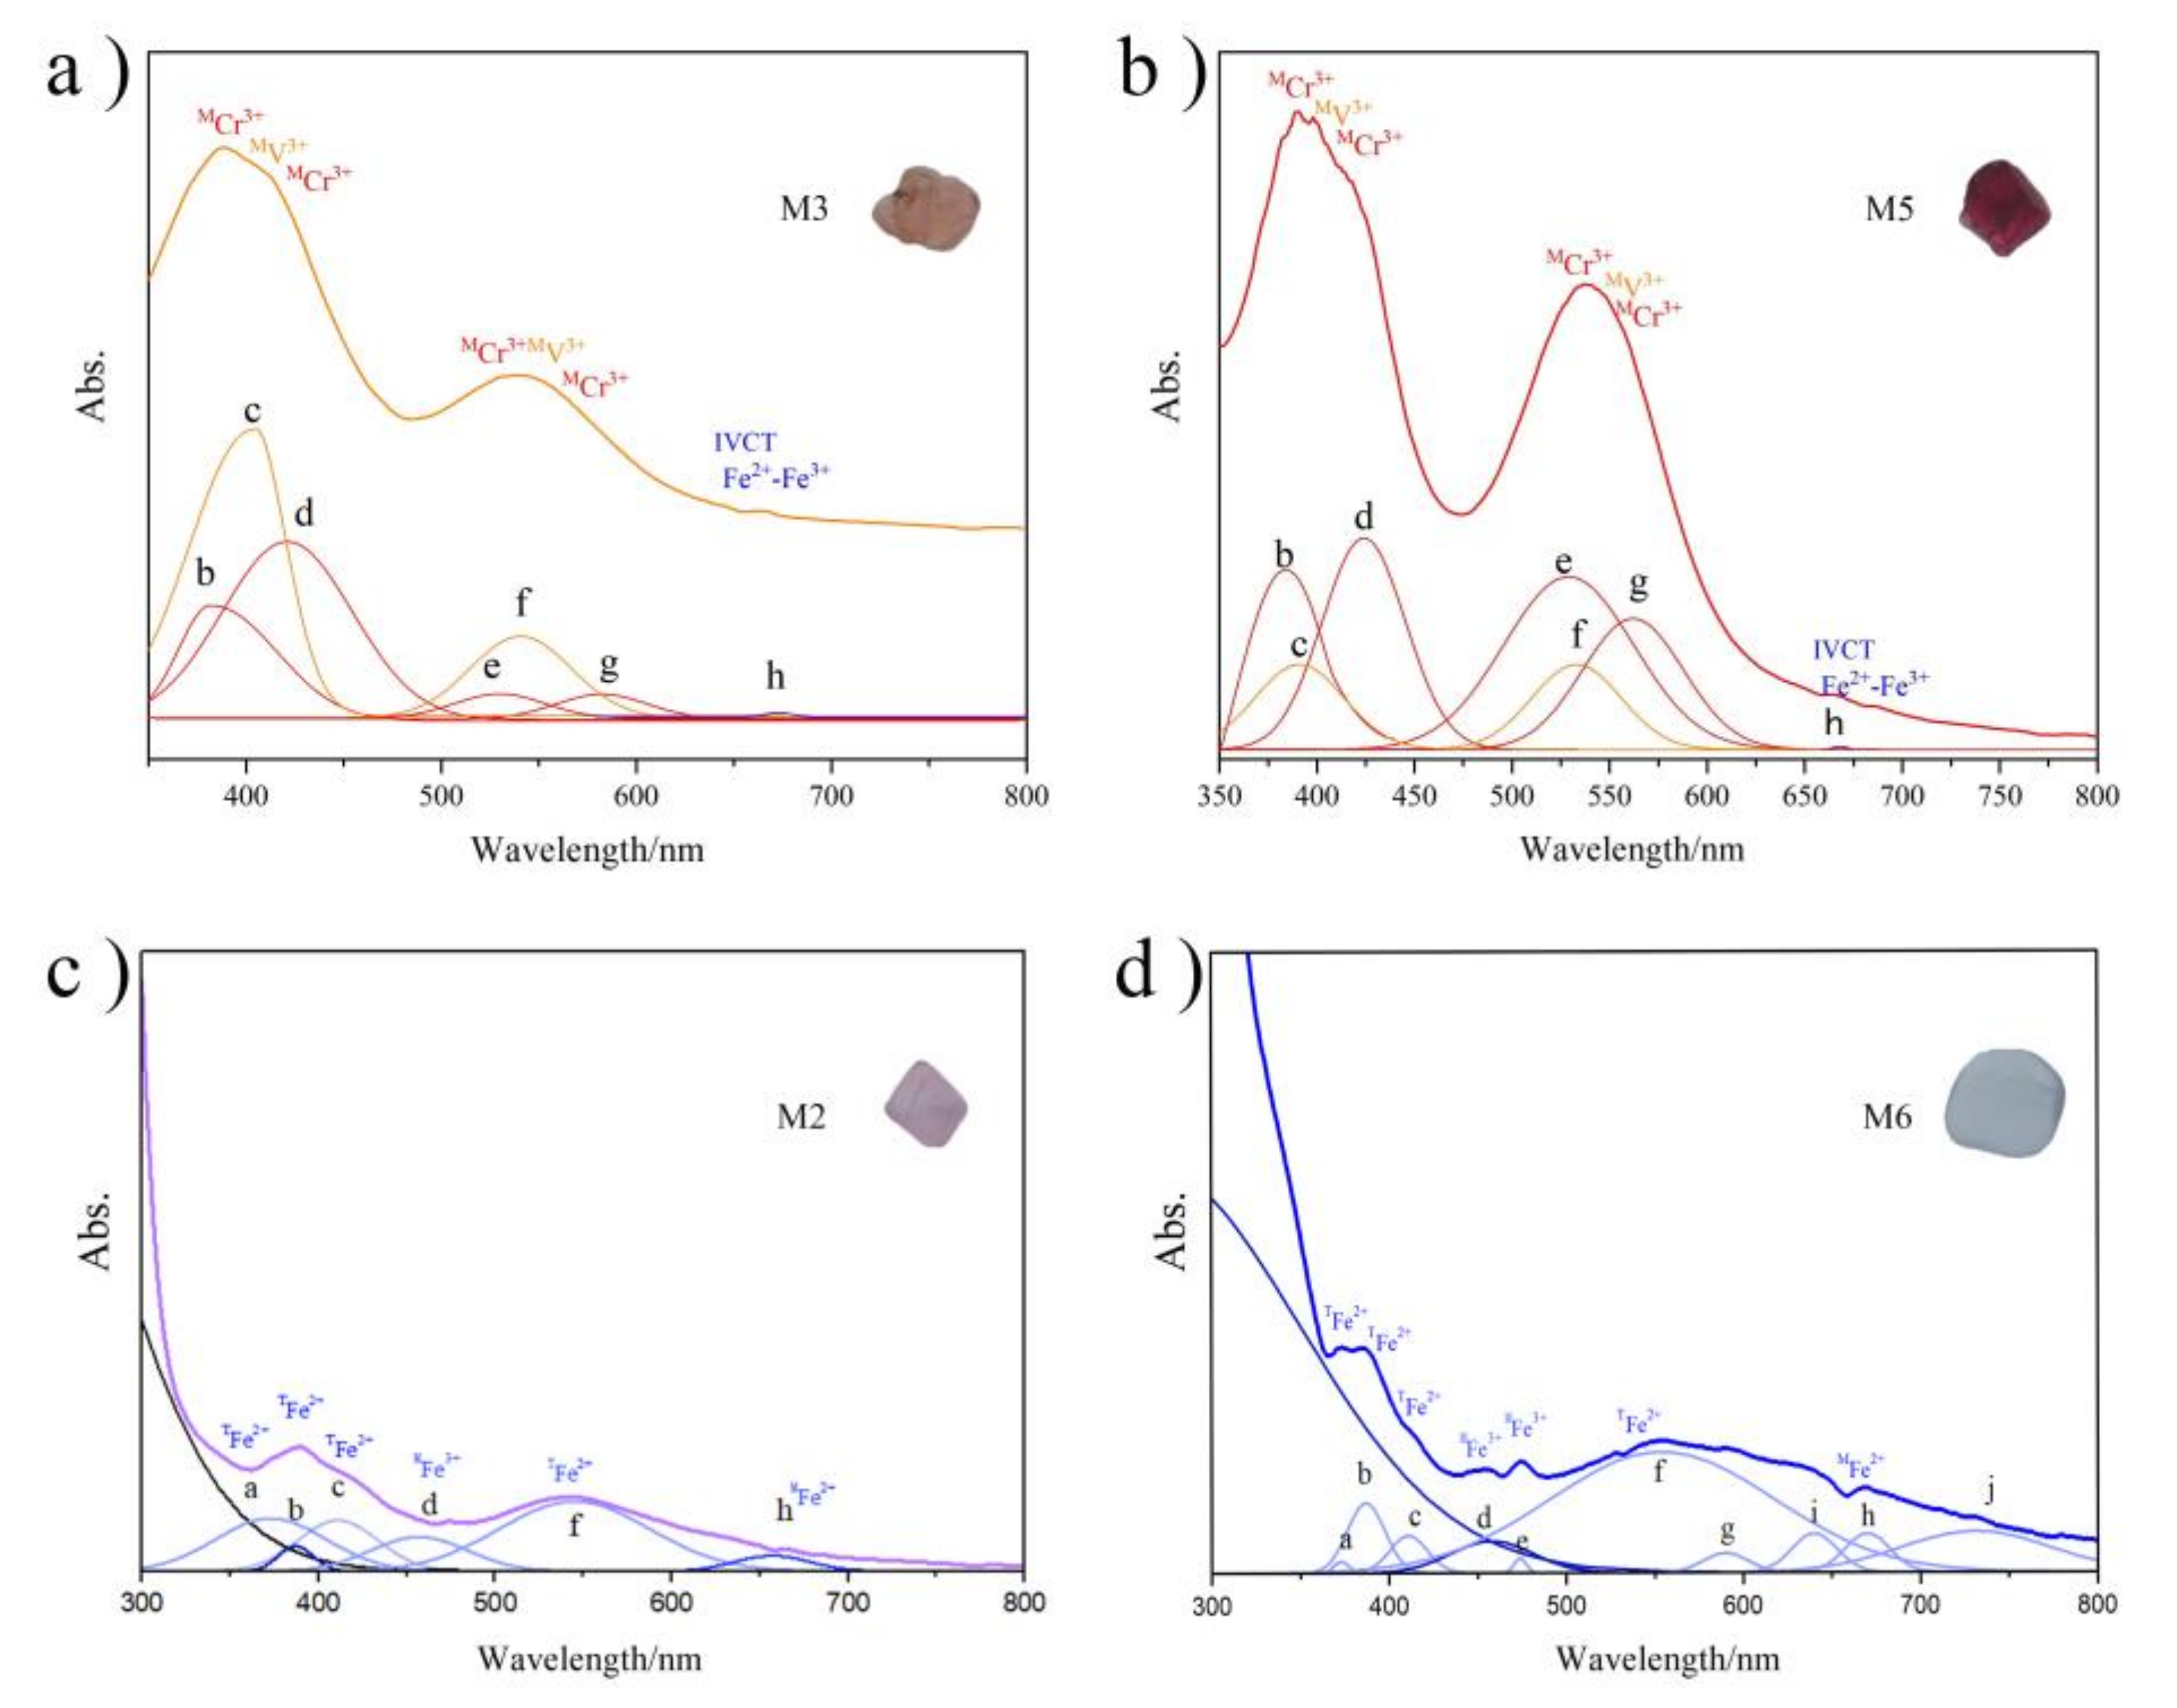
Pink sample M1 shows a similar position of the absorption peak to the red sample M5, but the intensity is weaker. Table 3 shows the Electronic transition for different positions of UV-Vis absorption. Comparing Table 3, it can be seen that the absorption peaks of the red sample M5 belonging to Cr3+ are obvious, with three peaks attributed to spin-allowed leap at 4A2g→2T1g(F) 382 nm (b), spin-allowed leap4A2g→2T1g(F) at 418 nm (d) and spin-allowed leap 4A2g→2T2g(F) at 535 nm (e). The UV-Vis absorption spectra of the orange samples M3 and M4 have a weak absorption band in the blue-violet and green regions, meaning that more red-to-yellow-orange light passes through relative to the UV-blue region, giving the sample an orange-yellow color. Figure 7 a,b shows the Band analysis, which used the Gaussian splitting function, of the UV-Vis spectra of M3 (a) and M5 (b). As in shown in Figure 7, the c and f absorption bands are more pronounced in the orange sample, suggesting that the orange color shown by the Myanmar spinel is mainly due to the higher V3+ content in the composition, which may have been greater than that of the Cr3+. In short, the presence of Cr3+ and V3+ ions gives spinel a red or orange color. At higher levels of Cr3+, the spinel appears pink-red; however, when the concentration of V3+ is high, the absorption in the yellow-green light region diminishes and the spinel develops an orange hue.
The UV-Vis spectra of purple sample M2, blue sample M6 and the results of the peak splitting process are shown in Figure 7c,d, and the corresponding attribution of each peak position is shown in Table 4. According to Figure 7c,d, the blue and purple spinels have a different UV-Vis spectral pattern to the red series of spinels. In the 330 nm–400 nm region, corresponding to the blue and purple regions of visible light, a more intense absorption is seen, which is due to the charge transfer leap from O2− to Fe2+ and O2− to Fe3+. According to Figure 7c, the absorption band f at 555 nm is dominant in purple sample M2. According to Figure 7d, the blue sample M6 has a more pronounced absorption band f at 554 nm, which is attributed to Fe2+ in the T site, causing strong absorption in the green-yellow region and more visible light passing through in the blue region, making the sample a blue color.
4. Conclusions
In summary, the gemological, crystallographic, compositional and spectral characteristics of the Myanmar spinel samples were systematically analyzed using basic gemological instruments and modern testing techniques. Complete octahedral crystal morphology is visible in some samples, with the appearance of dissolution, growth motifs and cross-growth of crystals visible on the crystal surfaces. The average specific gravity of spinel from Myanmar is 3.551, and under long-wave ultraviolet light the red series shows significant fluorescence, while the blue-violet series shows no significant fluorescence. In contrast to existing scholarly studies of spinel (Andreozzi et al. 2019 [15]), this paper focuses on the spectroscopic and gemological characteristics of different colors of spinel from Myanmar-including red, orange, purple and blue, systematically discussed the spectra and chromogenic elements of them. The infrared spectra (FTIR) of the different colors of Myanmar spinel samples have similar peaks at 478 cm−1, 532 cm−1, 586 cm−1, 690 cm−1 and 841 cm−1, respectively. Raman spectra of the seven spinel samples also showed a consistent pattern, which was situated at 310 cm−1, 405 cm−1, 663 cm−1 and 764 cm−1. The UV-Vis spectra of the different colored samples varied considerably, indicating a strong correlation between the color of the sample and the particular element. According to the UV-Vis spectrum, the color of Myanmar red and orange spinels was mainly due to Cr3+ and V3+. When the Cr3+ content was higher than the V3+ content, the spinels showed a red hue; when the V3+ content was higher than Cr3+, the spinels had an orange hue. The causes of blue and purple are mainly attributed to the charge transfer between Fe2+ and Fe3+. This is very different from the Vietnam blue spinel, whose blue color is caused by Co2+. The conclusions of this paper facilitate the regulation of the different colors of spinel in Myanmar and can be used as a theoretical foundation for the grading or origin tracing of Myanmar spinel.
Author Contributions
L.Z., writing-original draft preparation and formal analysis; K.H., review and editing; Q.G., review and editing; All authors have read and agreed to the published version of the manuscript.
Funding
This research received no external funding.
Institutional Review Board Statement
Not applicable.
Informed Consent Statement
Not applicable.
Data Availability Statement
Not applicable.
Conflicts of Interest
The authors declare no conflict of interest.
References
- Zhang, Y.; Zhu, J.R.; Yu, X.Y. A Comparative Study of the Gemological Characteristics and Inclusions in Spinels from Myanmar and Tajikistan. Crystals 2022, 12, 617. [Google Scholar] [CrossRef]
- Pluthametwisute, T.; Wanthanachaisaeng, B.; Saiyasombat, C.; Sutthirat, C. Minor Elements and Color Causing Role in Spinel:Multi-Analytical Approaches. Minerals 2022, 12, 928. [Google Scholar] [CrossRef]
- Zhao, L.P.; Li, G.; Weng, L.Q. Gemological and Spectroscopic Characteristics of “Jedi” Spinel from Man Sin, Myanmar. Minerals 2022, 12, 1359. [Google Scholar] [CrossRef]
- Bosi, F.; Biagioni, C.; Pasero, M. Nomenclature and classification of the spinel supergroup. Eur. J. Mineral. 2019, 31, 183–192. [Google Scholar] [CrossRef] [Green Version]
- Hill, R.J.; Craig, J.R.; Gibbs, G.V. Systematics of the spinel structure type. Phys. Chem. Miner. 1979, 4, 317–339. [Google Scholar] [CrossRef]
- Li, S.R. Crystallgraphy and Mineralogy; Geological Publishing House: Beijing, China, 2008. [Google Scholar]
- Wang, C.Q.; Zhang, L.K. Gemmology; Geological Publishing House: Beijing, China, 2017; p. 380. [Google Scholar]
- Vincent, P. Hunting for “Jedi” Spinels in Mogok. Gems Gemol. 2014, 50, 46–57. [Google Scholar]
- Günelin, E.J.; Koivula, J.I. Photoatlas of Inclusion in Gemstones; Da Zhi Publishing House: Taiwan, China, 1995; Volume 372–382, pp. 662–714. [Google Scholar]
- Peretti, A.; Günther, D.; Graber, A.L. The Beryllium Treatment of Fancy Sapphires with a New Heat-treatment Technique (Part B). Contrib. Gemol. 2003, 8, 21–34. [Google Scholar]
- Taran, M.N.; Koch-Müller, M.; Langer, K. Electronic absorption spectroscopy of natural (Fe2+, Fe3+)-bearing spinels of spinel s.s.-hercynite and gahnite-hercynite solid solutions at different temperatures and high-pressures. Phys. Chem. Miner. 2005, 32, 175–188. [Google Scholar] [CrossRef]
- Fregola, R.A.; Skogby, H.; Bosi, F.; D’Ippolito, V.; Andreozzi, G.B.; Halenius, U. Optical absorption spectroscopy study of the causes for color variations in natural Fe-bearing gahnite: Insights from iron valency and site distribution data. Am. Miner. 2014, 99, 2187–2195. [Google Scholar] [CrossRef]
- D’Ippolito, V.; Andreozzi, G.B.; Hålenius, U.; Skogby, H.; Hametner, K.; Günther, D. Color mechanisms in spinel: Cobalt and iron interplay for the blue color. Phys. Chem. Miner. 2015, 42, 431–439. [Google Scholar] [CrossRef]
- Gorghinian, A.; Mottana, A.; Rossi, A.; Oltean, F.M.; Esposito, A.; Marcelli, A. Investigating the colour of spinel: 1. Red gem-quality spinels (“balas”) from Ratnapura (Sri Lanka). Rend. Lincei 2013, 24, 127–140. [Google Scholar] [CrossRef]
- Andreozzi, G.B.; D’Ippolito, V.; Skogby, H.; Halenius, U.; Bosi, F. Color mechanisms in spinel: A multi-analytical investigation of natural crystals with a wide range of coloration. Phys. Chem. Miner. 2019, 46, 343–360. [Google Scholar] [CrossRef]
- Boris, C.; Benjamin, R.; Emmanuel, F.; Phillipe, R.; Jean-Luc, D. Blue spinel from the Luc Yen District of Vi-etnam. Gems Gemol. 2015, 51, 2–17. [Google Scholar]
- Kane, R.E.; Kammerling, R.C. Status of Ruby and Sapphire Mining in the Mogok Stone Tract. Gems Gemol. 1992, 28, 152–174. [Google Scholar] [CrossRef]
- Mitchell, A.H.G.; Htay, M.T.; Htun, K.M.; Win, M.N.; Oo, T.; Hlaing, T. Rock relationships in the Mogok metamorphic belt, Tatkon to Mandalay, central Myanmar. J. Asian Earth Sci. 2007, 29, 891–910. [Google Scholar] [CrossRef]
- Keller, P.C. The Rubies of Burma: A Review of the Mogok Stone Tract. Gems Gemol. 1983, 19, 209–219. [Google Scholar] [CrossRef]
- Giuliani, G.; Fallick, A.E.; Boyce, A.J.; Pardieu, V.; Pham, V.L. Pink and Red Spinels In Marble: Trace Elements, Oxygen Isotopes, and Sources. Can. Miner. 2017, 55, 743–761. [Google Scholar] [CrossRef]
- Palke, A.C.; Sun, Z.Y. What Is Cobalt Spinel Unraveling the Causes of Color in Blue Spinels. Gems Gemol. 2018, 54, 262. [Google Scholar]
- White, W.B.; DeAngelis, B.A. Interpretation of the vibrational spectra of spinels. Spectrochim. Acta Part A 1967, 23, 985–995. [Google Scholar] [CrossRef]
- Farmer, V.C. The Infrared Spectra of Minerals; Mineralogical Society: Chantilly, VA, USA, 1974. [Google Scholar]
- Vernidub, N.M.; Pasechnik, Y.A.; Shportko, K.V. Reststrahlen Spectroscopy of MgAl2O4 Spinel. Semicond. Phys. Quantum Electron. Optoelectron. 2002, 5, 95–100. [Google Scholar]
- O’Horo, M.P.; Frisillo, A.L.; White, W.B. Lattice vibrations of MgAl2O4 spinel. J. Phys. Chem. Solids 1973, 34, 23–28. [Google Scholar] [CrossRef]
- Shebanova, O.N.; Lazor, P. Raman study of magnetite (Fe3O4): Laser-induced thermal effects and oxidation. J. Raman Spectrosc. 2003, 34, 845–852. [Google Scholar] [CrossRef]
- D’Ippolito, V.; Andreozzi, G.B.; Bersani, D. Raman fingerprint of chromate, aluminate and ferrite spinels. J. Raman Spectrosc. 2015, 46, 1255–1264. [Google Scholar] [CrossRef]
- Lenaz, D.; Lughi, V. Raman study of MgCr2O4–Fe2+ Cr2O4 and MgCr2O4–MgFe23+ O4 synthetic series: The effects of Fe2+ and Fe3+ on Raman shifts. Phys. Chem. Miner. 2013, 40, 491–498. [Google Scholar] [CrossRef]
- Schmetzer, K.; Haxel, C.; Bank, H. Colour of natural spinels, gahnospinels and gahnites. Neues Jahrb. Fur Mineral. 1989, 160, 159–180. [Google Scholar]
- Lenaz, D.; Skogby, H.; Princivalle, F.; Halenius, U. Structural changes and valence states in the MgCr2O4–FeCr2O4 solid solution series. Phys. Chem. Miner. 2004, 31, 633–642. [Google Scholar] [CrossRef]
- Halenius, U.; Andreozzi, G.B.; Skogby, H. Structural relaxation around Cr3+ and the red-green color change in the spinel (sensu stricto)-magnesiochromite (MgAl2O4–MgCr2O4) and gahnitezincochromite (ZnAl2O4–ZnCr2O4) solid-solution series. Am. Miner. 2010, 95, 456–462. [Google Scholar] [CrossRef]
- Malsy, A.K.; Karampelas, S.; Schwarz, D.; Klemm, L.; Armbruster, T. Tuan DA Orangey-red to orangey-pink gem spinels from a new deposit at Lang Chap (Tan Huong-Truc Lau), Vietnam. J. Gemmol. 2012, 33, 19–27. [Google Scholar] [CrossRef]
Figure 1.
Spinel samples from Myanmar.

Figure 2.
Fluorescence of samples under the Diamond View. (M means “Myanmar”).

Figure 3.
(a) Octahedral crystal (M1) (b); abraded appearance (M1); (c) inverted triangular growth pits (M2); (d) cross-growth phenomenon of crystals (M5).
Figure 3.
(a) Octahedral crystal (M1) (b); abraded appearance (M1); (c) inverted triangular growth pits (M2); (d) cross-growth phenomenon of crystals (M5).

Figure 4.
FTIR spectra of different colored spinels from Myanmar.

Figure 5.
Raman spectra of different colored spinels from Myanmar.

Figure 6.
UV-Vis spectra of pink-red spinels. (M means “Myanmar”).

Figure 7.
Band analysis of UV-Vis spectra of M3 (a), M5 (b), M2 (c) and M6 (d).


Table 1.
Gemological characteristics of the samples.
| Sample | Color | Weight (c t) | Specific Grsavity | Fluorescence (LW) | Chelsea Color Filter | Grating Spectroscope (Hand-Held) |
|---|---|---|---|---|---|---|
| M1 | Pink | 0.228 | 3.45 | Dark red | No change | / |
| M2 | Light violet | 0.338 | 3.56 | Dark red | Pink tones | / |
| M3 | Orange | 0.586 | 3.55 | Red | No change | / |
| M4 | Orange-Violet | 0.727 | 3.55 | Bright Red | No change | / |
| M5 | Red | 0.377 | 3.59 | Bright Red | Bright red tones | Chromium absorption |
| M6 | Light blue | 0.515 | 3.58 | None | No change | / |
| M7 | Blue | 0.394 | 3.58 | None | No change | Ferrum absorption |
Table 2.
X-ray fluorescence spectral analysis data of different colored Myanmar spinels (wt %).
| Sample Number | Color | Al2O3 | MgO | Cr2O3 | V2O5 | Fe2O3 | ZnO | SiO2 | SO3 | TiO2 |
|---|---|---|---|---|---|---|---|---|---|---|
| M1 | pink | 68.311 | 28.501 | 0.161 | 0.173 | 0.118 | 0.087 | 1.667 | 0.917 | ND |
| M2 | violet | 57.808 | 25.346 | 0.297 | 0.181 | 0.739 | 1.980 | 2.504 | 0.956 | ND |
| M3 | orange | 66.665 | 30.3271 | 0.076 | 0.489 | 0.077 | 0.084 | 1.260 | 0.939 | ND |
| M4 | orange-violet | 67.507 | 29.809 | 0.148 | 0.038 | 0.399 | 0.079 | 1.079 | 0.822 | ND |
| M5 | red | 65.668 | 30.229 | 1.537 | 0.277 | 0.124 | 0.051 | 1.852 | ND | 0.149 |
| M6 | blue | 69.355 | 18.028 | 0.230 | 0.046 | 1.559 | 0.610 | 5.162 | 4.666 | 0.081 |
| M7 | blue | 69.576 | 16.238 | ND | 0.312 | 1.901 | 0.159 | 5.284 | 6.340 | 0.044 |
| Sample | M1 Pink | M3 Orange | M4 Orange | M5 Red | Assignment | Electronic Transition |
|---|---|---|---|---|---|---|
| a | / | / | / | / | MCr3+ | Spin-forbidden 4A2g(4F) → 2T1g(2G) |
| b | / | / | 382 | 382 | MCr3+ | Spin-allowed 4A2g → 2T1g(F) |
| c | 391 | 391 | 390 | 392 | MV3+ | Spin-allowed 3T1g(F) → 3T1g(P) |
| d | 410 | 416 | / | 418 | MCr3+ | Spin-allowed 4A2g → 2T1g(F) |
| e | / | / | 530 | 535 | MCr3+ | Spin-allowed 4A2g → 2T2g(F) |
| f | 542 | 542 | / | / | MV3+ | Spin-allowed 3T1(F) → 3T2(F) |
| g | / | / | / | / | MCr3+ | Spin-allowed 4A2g → 2T2g(F) |
| h | 669 | 668 | 668 | 660 | Fe2+-Fe3+ | Fe2+-Fe3+ charge transfer |
| i | / | / | / | / | MFe2+ | Spin-allowed 5T2g → 5Eg |
| Sample | M2 Violet | M6 Blue | Assignment | Electronic Transition |
|---|---|---|---|---|
| a | 373 | 373 | TFe2+ | Spin-forbidden5E → 3E |
| b | 387 | 387 | TFe2+ | Spin-forbidden 5E → 3T1, 3T2 |
| c | 411 | 411 | TFe2+ | Spin-forbidden 5E → 3T1 |
| d | 457 | 458 | MFe3+ | 6A1g → 4A1g, 4Eg |
| e | / | 474 | MFe3+ | |
| f | 555 | 554 | TFe2+ | Spin-forbidden 5E → 3T2 |
| g | / | 590 | TFe2+ | Spin-forbidden 5E → 3T2 |
| h | 657 | 670 | MFe2+ | Fe2-Fe3+ charge transfer |
Disclaimer/Publisher’s Note: The statements, opinions and data contained in all publications are solely those of the individual author(s) and contributor(s) and not of MDPI and/or the editor(s). MDPI and/or the editor(s) disclaim responsibility for any injury to people or property resulting from any ideas, methods, instructions or products referred to in the content. |
© 2023 by the authors. Licensee MDPI, Basel, Switzerland. This article is an open access article distributed under the terms and conditions of the Creative Commons Attribution (CC BY) license (https://creativecommons.org/licenses/by/4.0/).
Share and Cite
MDPI and ACS Style
Zhang, L.; He, K.; Guo, Q. Spectroscopic Characteristics and Coloring Mechanisms of Different Colored Spinels from Myanmar. Crystals 2023, 13, 575. https://doi.org/10.3390/cryst13040575
AMA Style
Zhang L, He K, Guo Q. Spectroscopic Characteristics and Coloring Mechanisms of Different Colored Spinels from Myanmar. Crystals. 2023; 13(4):575. https://doi.org/10.3390/cryst13040575
Chicago/Turabian StyleZhang, Lei, Kui He, and Qingfeng Guo. 2023. "Spectroscopic Characteristics and Coloring Mechanisms of Different Colored Spinels from Myanmar" Crystals 13, no. 4: 575. https://doi.org/10.3390/cryst13040575
Note that from the first issue of 2016, this journal uses article numbers instead of page numbers. See further details here.