Article

Comparison of Corrosion Behavior of WE43 and AZ80 Alloys in NaCl and Na2SO4 Solutions

1
School of Chemical Engineering, Zhengzhou University, Zhengzhou 450001, China
2
College of Materials Engineering, Henan University of Engineering, Zhengzhou 451191, China
3
School of Materials Science and Engineering, Zhengzhou University, Zhengzhou 450001, China
*
Authors to whom correspondence should be addressed.
Crystals 2023, 13(3), 506; https://doi.org/10.3390/cryst13030506
Submission received: 11 February 2023 / Revised: 2 March 2023 / Accepted: 7 March 2023 / Published: 15 March 2023
(This article belongs to the Special Issue Advances in Magnesium Alloys: Microstructure, Coating, and Machining)

Abstract

:
The corrosion behavior and corrosion resistance of WE43 and AZ80 immersed in NaCl and Na2SO4 solutions were investigated, respectively. Two alloys were immersed in 0.6 M NaCl and Na2SO4 solution to observe the corrosion morphologies. Hydrogen evolution and weight loss experiments were conducted to obtain the corrosion rates. Electrochemical tests were used to characterized detailed corrosion situation. The results show that, when immersed in Na2SO4 solution, WE43 alloy shows a unique micro-galvanic corrosion behavior. On the other hand, the corrosion rate of WE43 in Na2SO4 solution is much faster than that in NaCl solution, which is the direct opposite of AZ80 and most magnesium alloys. The protection of the surface film maybe the key factor to the unexpected phenomena.

1. Introduction

Magnesium and its alloys have excellent mechanical properties, high specific strength and high thermal conductivity [1,2]. As a result, magnesium alloys are used in various industries [3,4]. Magnesium can be doped with many elements to form magnesium alloys to improve mechanical properties, such as Al, Zn, rare earth elements and so on [4,5,6,7,8]. AZ series was the most widely studied and used in daily life, especially AZ31 [9] and AZ80 [10]. Nevertheless, the mechanical property of AZ alloys declines rapidly with the temperature increasing [7]. As the result, the magnesium rare earth alloys were born at the right moment. Sanchez et al. [11] came to the conclusion that the addition of Y and Ca could improve the properties of the alloys under high temperature. Y and Ca could also improve the microstructure and mechanical properties of magnesium alloys [3]. WE series was a representative because of its low strain rate sensitivities and high yield stress. The alloying elements of AZ and WE are different: the elements doped in AZ are Al, Zn and Mn, while the alloying elements in WE are mainly rare earth elements including Y, Gd, Nd, Zr and so on [12]. The different elements lead to different corrosion behavior [10,13]. The heat treatment may influence the corrosion behavior. Chu [1] researched that the second phase, especially after heat treatment, could improve the corrosion resistance of WE43. Mościcki [14] compared the corrosion situation in Na2SO4 solution between WE43 alloys and AE44 alloys which indicated that the intermetallic phases formed by Al and rare earth elements would cause negative influence on corrosion performance. Michal [15] found that WE43 formed a protective film on the surface compared with pure magnesium. Cao [16] also found that Y-containing film formed by corrosion products could improve the corrosion resistance. To further improve the corrosion resistance of WE43, Kharitonov [17] found Aqueous molybdate could provide the alloy effective corrosion inhibition. While Jin [2] found ion implantation could improve the corrosion resistance also. Heat treatment is also an efficient way to influence corrosion resistance. Wang [18,19] studied the corrosion and mechanical phenomenon of magnesium alloys contain Zn Y, Zr elements after heat treatment, due to the existence of Zn, the precipitates of Mg3Zn6Y could improve the corrosion resistance, especially in NaCl solution. In the research [20,21], Wang studied the influence of heat treatment on as-forged Mg alloys, the results indicated that heat treatment was effective in improving the corrosion and mechanical properties. In study [22], the effective way to improve corrosion and mechanical performance also works. The corrosion of magnesium alloys has been studied for several years, and the effect of second phases had been revealed preliminarily [23].
Due to the difference of electric potential of second phases and magnesium matrix, when immersed magnesium alloys in solution, the micro-galvanic corrosion happens and then influences corrosion behavior. The second phases of AZ series alloys are mainly Mg17Al12 and MnAl2 phases, and the existence of these phases trigger the micro-galvanic corrosion in solution between them and Mg matrix [10]. On the other hand, the existence of these phases retards the extension of the corrosion as barriers. Ubeda et al. [8] found Mg17Al12 phase might decrease the dissolution rate of Mg matrix under anodic polarization. Likely, the second phases in WE43 can also influence the corrosion behavior. Interestingly, Feng [24] and Liu et al. [25] found that the second phases in magnesium rare earth alloy participate in micro-galvanic corrosion as anode. The corrosion behavior of WE and AZ series in solution were found to be different [26].
It is well known that NaCl solution is the typical corrosion media in corrosion research. Most metals including Mg alloys show very poor corrosion resistance in Cl solution. Traditional Mg alloys such as AZ80 showed high corrosion rate in Cl solution, and pitting corrosion appeared widely in the corrosion process. On the contrary, SO42− was not that much of a threat. SO42− is always known as a kind of corrosion inhibitor, AZ80 and other Mg alloys showed better corrosion resistance in SO42− than in Cl solution. However, magnesium rare earth alloy WE43 showed unique micro-galvanic corrosion phenomenon in this work. In the same immersion time, the hydrogen evolution rate of WE43 in SO42− solution was about five times as much as that in Cl solution. It meant that WE43 alloy corroded much faster in SO42− solution than in Cl solution. Meanwhile, it was found that the second phases of WE43 alloy were dissolved in SO42−, which means second phases acted as anode; on the contrary, when immersed in Cl solution, the magnesium matrix around the second phases dissolved because the second phases acted as cathode.
In this research, the differences of corrosion behavior and micro-galvanic phenomenon in solution between WE43 and AZ80 were studied. The reason why hydrogen evolution rate had such considerable difference was studied.

2. Materials and Methods

2.1. Sample Preparation

The as-cast WE43 alloy used in this work were provided by Yueyang, China, Yuhua Metallurgical New Materials Co., Ltd. Before all the experiments, the specific composites of AZ80 and WE43 were measured by ICP, the result was presented in following Table 1 and Table 2. In the immersion experiments, the samples were all cubic, whose three-dimensional sizes were 10 × 10 × 10 mm3. While in the Hydrogen evolution experiment, the sizes of samples were 30 × 30 × 10 mm3. All samples were prepared by grinding on the SiC abrasive paper from P200 to P5000, and then the samples were polishing on the polishing cloth. The whole grinding and polishing stage was conducted on machine-YMP-2A produced by Shanghai, China Metallographic Machinery Co., Ltd. During grinding and polishing, the samples were usually washed by absolute ethyl alcohol, to avoid metal granule impacting the polished surface. The compositions of the alloys are shown in the Table 1 and Table 2.

2.2. Immersion Test

The solution used were prepared in beakers with deionized water, and reagents were provided by Shanghai, China Aladdin Biochemical Technology Co., Ltd. All the reagents used in this work were A.R. grade. Then samples were, respectively, soaked in solution of 3.5 wt.% sodium chloride or 3.5 wt.% sodium sulfate for 10 h at room temperature to observe the dissolve situation of second phase. Meanwhile, a 7 d immersion was conducted to obtain macro corrosion rate. The cross-section morphology illustrates whether the second phases are dissolved or not. After being soaked in the solution, the corrosion products needed to be removed and immersed in a chromic acid solution containing 180 g/L CrO3 for 5 min. Then, the samples, after being immersed in solutions, needed to be sealed in resin to observe their transversal section. The samples for cross-section were also grinded and polished.

2.3. Microstructure Characterizations

The microstructure images and elements distribution of the surface were all characterized by field emission scanning electron microscopy (SEM; Hillsboro, OR, USA, FEI Quanta 250 FEG) equipped with energy-dispersive spectrometry (EDS) with an acceleration voltage of 20 kV. The cross-section morphologies were investigated by SEM-BSE and EDS. The SEM images were intended to characterize the elementary composition of magnesium alloys, and cross-section morphologies were used to illustrate the corrosion situation of the second phases in the alloys. In cross-section images, the relatively height between second phases and magnesium matrix were clear.

2.4. Hydrogen Evolution

To get the macro corrosion rate for 7 days, hydrogen evolution experiments were essential. The hydrogen evolution experiments were conducted in a beaker with 1.8 L solution of 0.6 M NaCl and Na2SO4, respectively, the samples were hanged up with a cotton thread in funnel so that the samples could be suspended in the solution. The gas collection device was a burette connected with funnel by rubber hose, the amount of hydrogen could be gotten from the scale of the burette. After being immersed in the solution for 7 days, the corrosion products were removed by immersing in the solution of CrO3 for half an hour. Then, we weighed the samples by digital balance-JA3003 produced by Shanghai, China, Precision Instrument Co., Ltd. Compared with the weight before immersion, the weight loss could be calculated with the formula Pm = (3.66 × ΔWm)/ρ, which could stand the corrosion situation to a certain degree. Then, the corrosion rate could be calculated by means of hydrogen evolution data.

2.5. Electrochemical Measurements

We used a CHI660D electrochemical workstation with a standard three electrodes to conduct electrochemical measurements in this work. The standard three electrodes system used a platinum sheet as the counter electrode, an R232 saturated calomel electrode (SCE) (+0.242 V vs. standard hydrogen electrode (SHE)) as the reference electrode, and the samples were sealed in epoxy resin with an area of 1 cm2 exposed to the solution as the working electrode. When we measured the open-circuit potential, the measurement needed to last for at least 5 min to obtain more accurate results. After confirming the OCP value, cathodic polarization could be measured begin at the OCP value and terminated at −250 mV vs. OCP. The anodic polarization started at the OCP value as well and stopped when current density reached 1 mA/cm2. Before cathodic and anodic polarization measurement, we stabilized the working electrode for 5 min. During the whole polarization measurement stage, the scan rate was 0.5 mV/s. After the polarization experiments, the Ecorr and icorr could be obtained. Then, the Pi, which means corrosion rate, could be calculated by icorr with the formula: Pi = (3.28 × M × icorr)/(n × ρ). The Pi could be compared with Pm, to get a rough corrosion tendency. In virtue of polarization curves and tafel extrapolation, the polarization resistance could be obtained by the equation Icorr = (ba × bc)/[2.303(ba + bc)Rp] [27,28].
The immersion time of EIS (electrochemical impendence spectroscopy) were 5 min to ensure a stable testing system in 0.6 M NaCl and 0.6 M Na2SO4 solution, respectively. The EIS parameters were setting AC voltage disturbance and frequency ranged. The AC voltage disturbance and frequency range were 5 mV and 100 kHz to 0.01 Hz. After measuring the EIS spectra, we used the ZSimpWin 3.20 software (AMETEK SI, Berwyn, PA, USA) to fit.

3. Results and Discussion

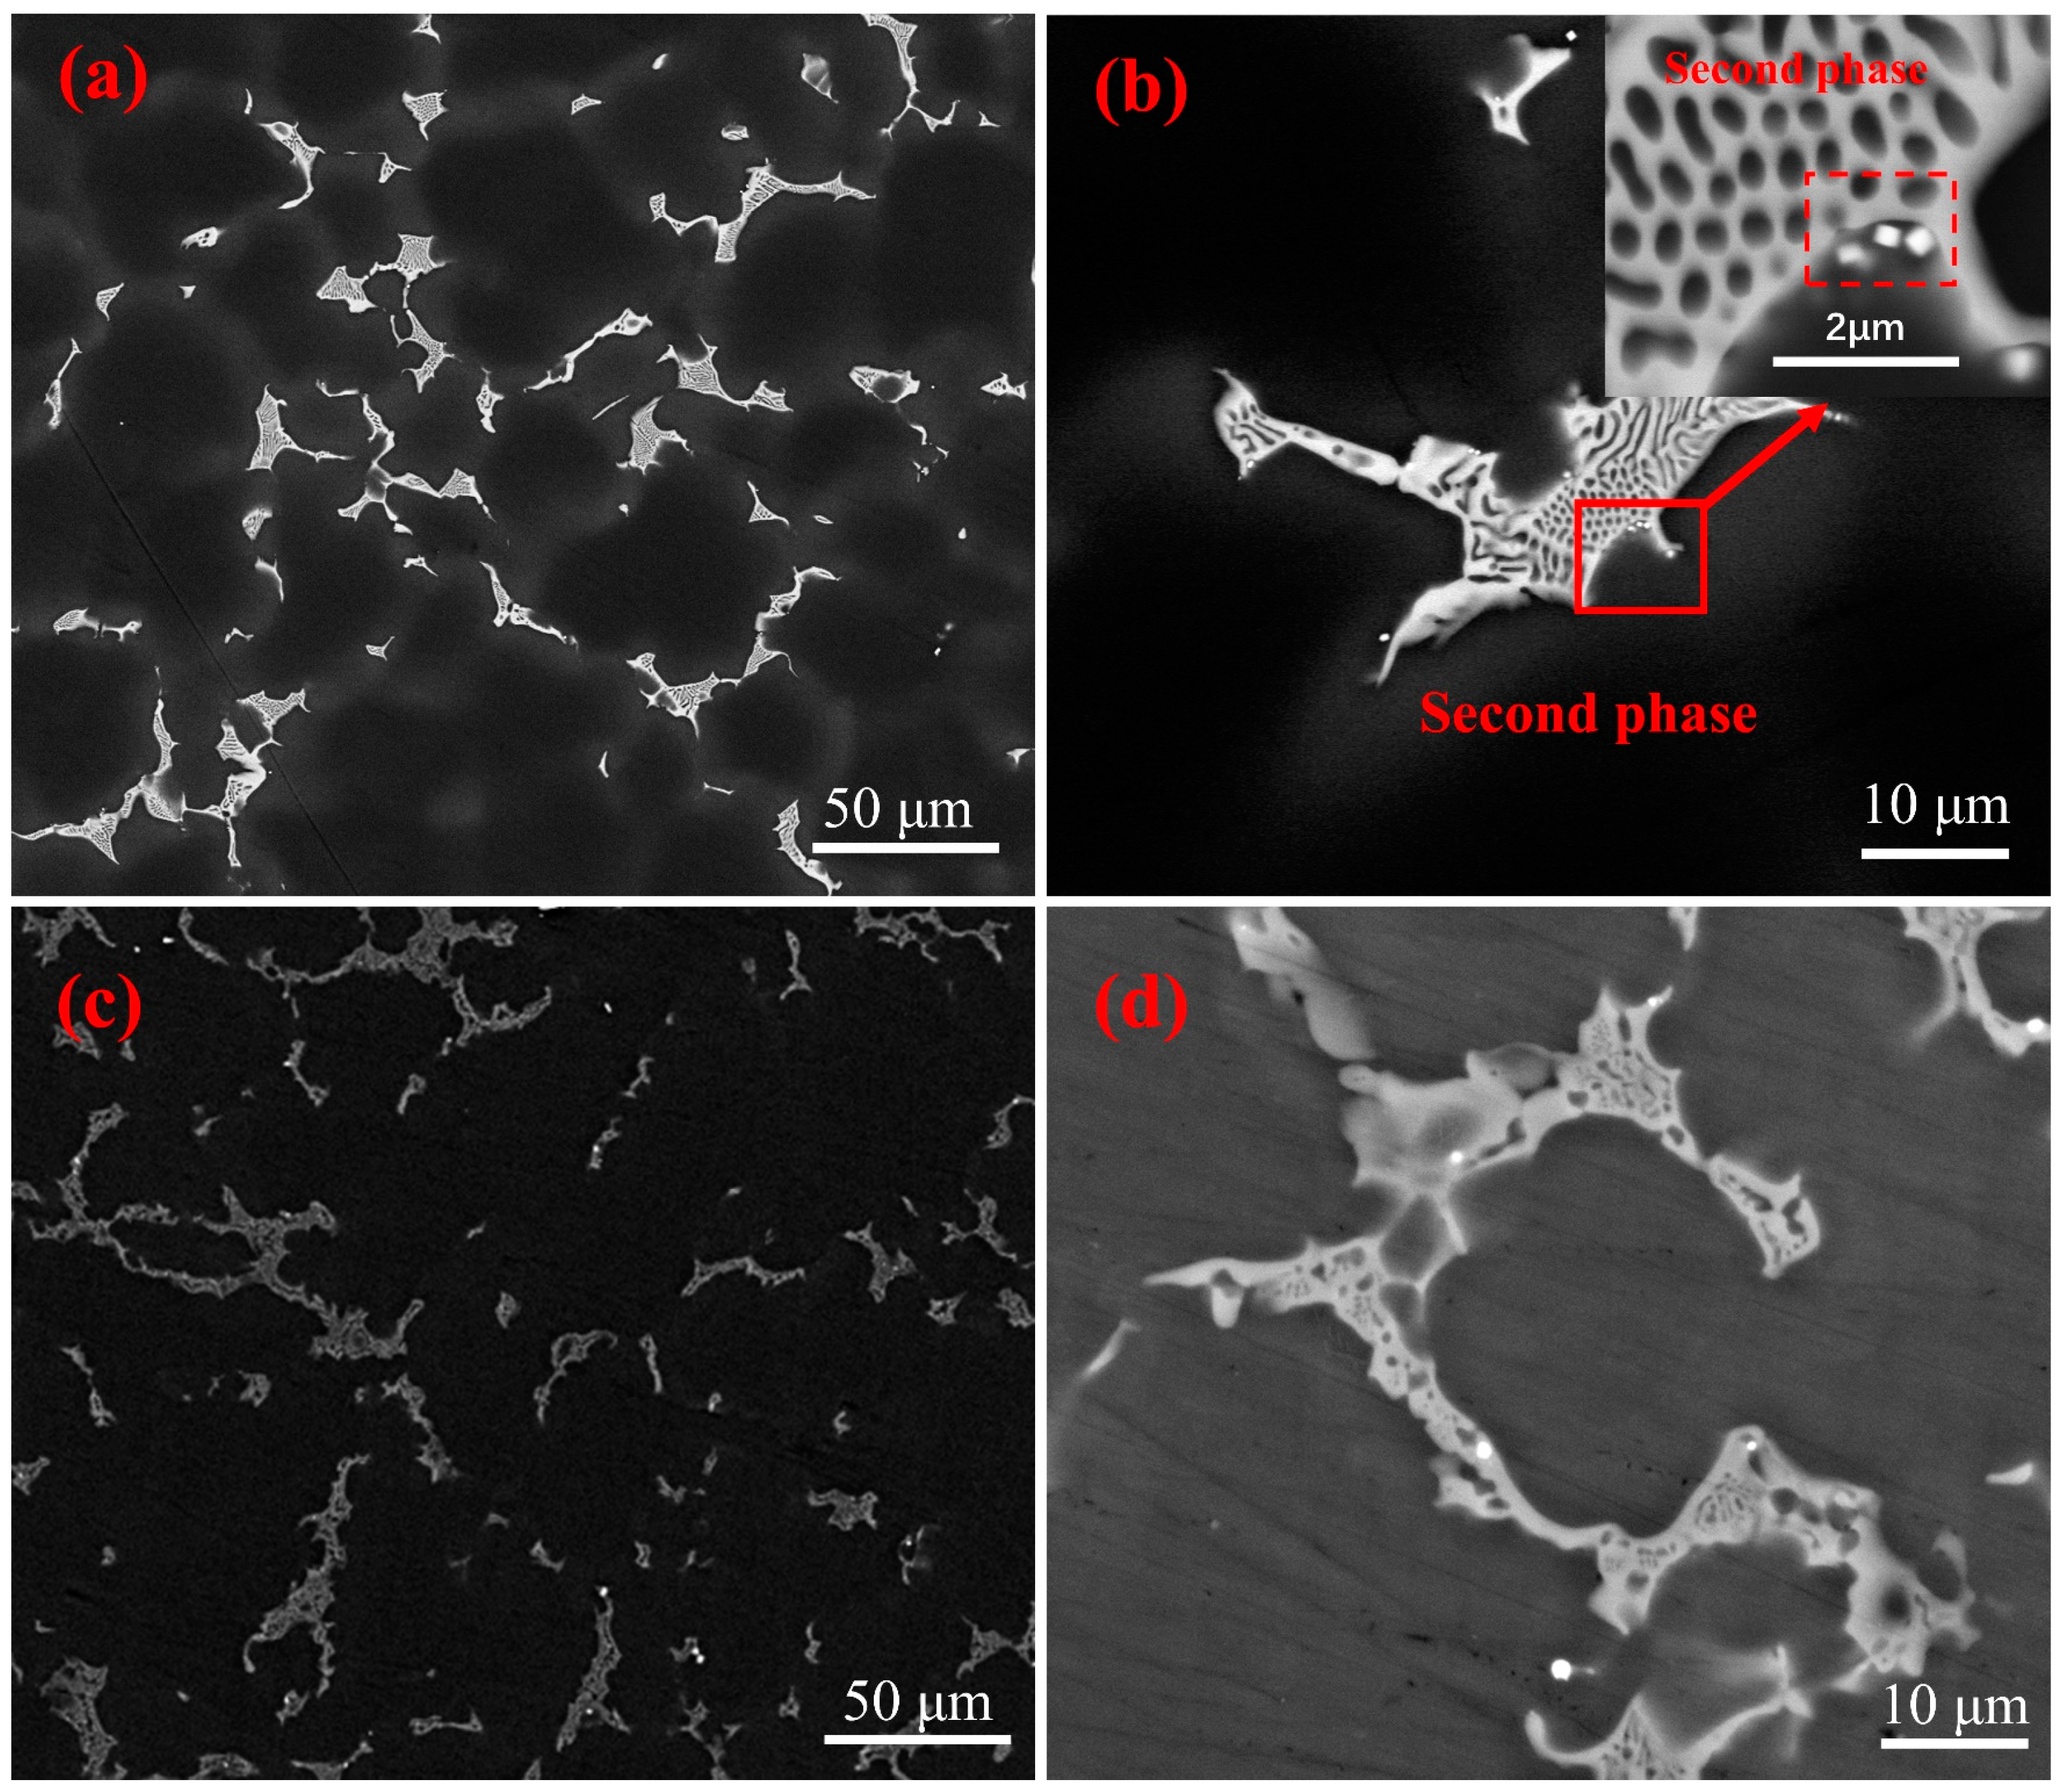
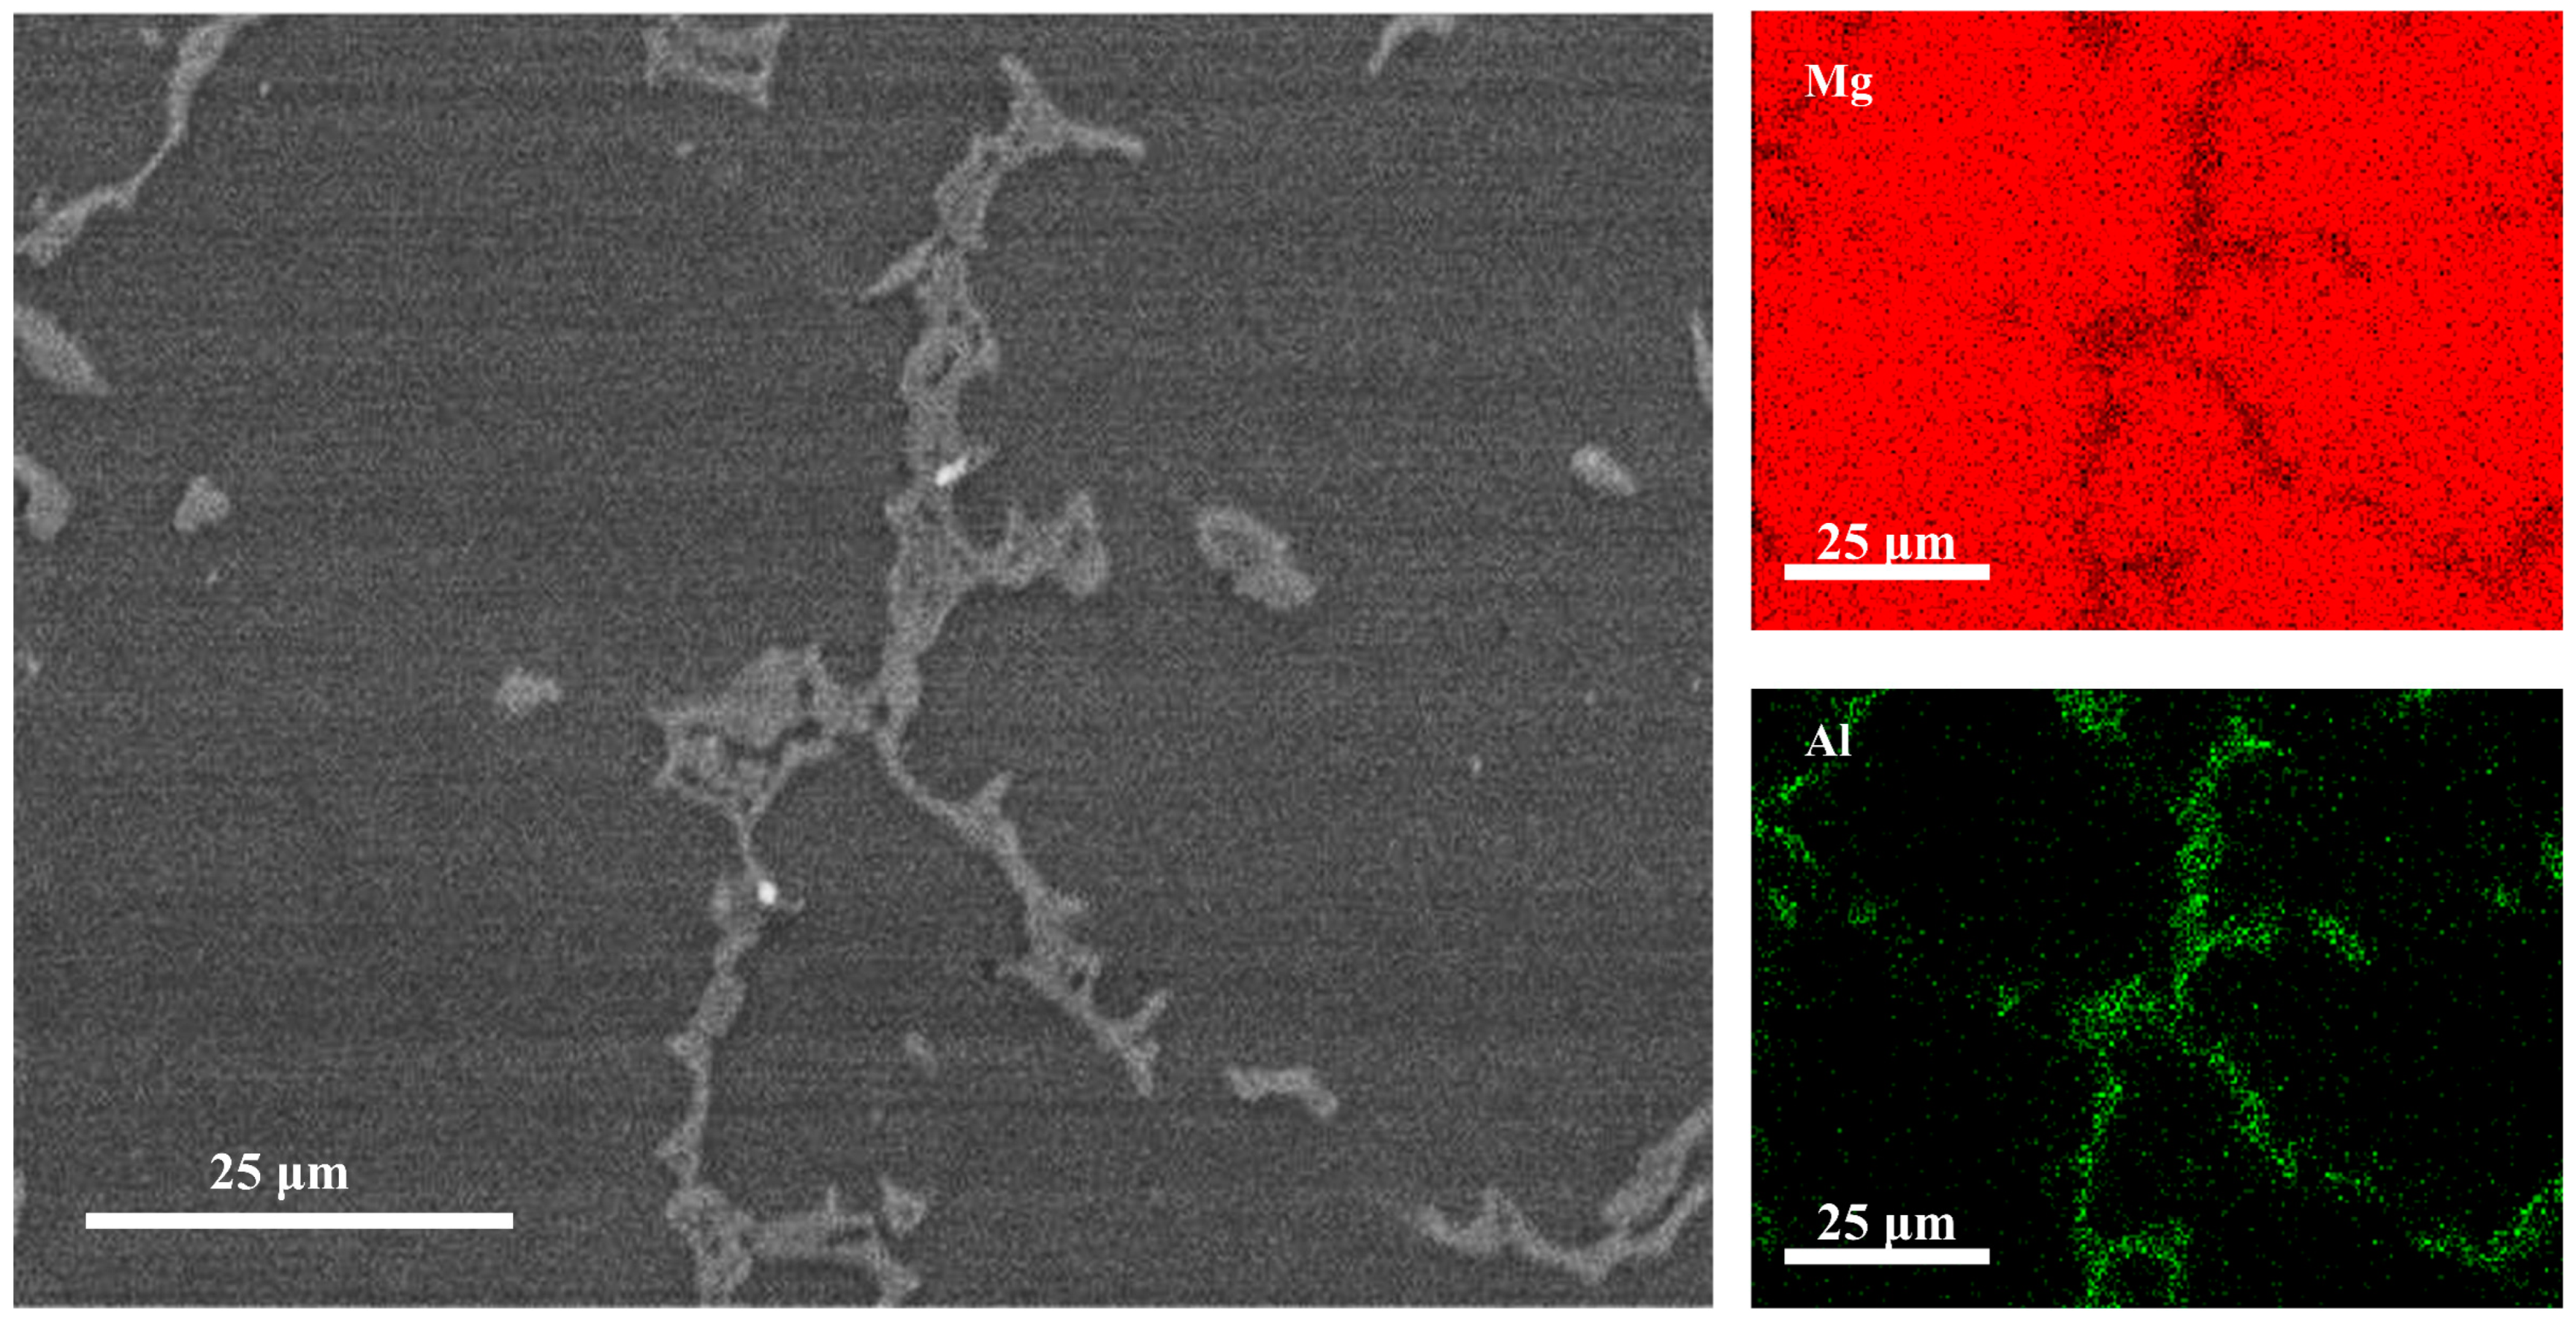
3.1. Microstructure Characterization

The XRD patterns of representative magnesium alloys AZ80 and WE43 are shown in Figure 1. The second phases in WE43 were mainly Mg24Y5, Mg41Nd5, and Mg5Gd. The second phases in AZ80 were mainly Mg17Al12 and MnAl2 [8,10]. Although MnAl2 was too little to be expressed by XRD, by combining SEM images and EDS with formers’ research, the existence of MnAl2 could also be verified. Surface morphologies of WE43 and AZ80 are shown in Figure 2, which exhibited that the morphologies of second phases were similar. They were both reticular. However, the elements were different, which led to different dissolving behavior.
The darker area in Figure 2a is Mg matrix which is α-Mg phase, while the lighter area are second phases in WE43. As shown in the high magnification Figure 2b, the second phases in WE43 were reticular in the eutectic structure, and there were some square phases around the second phases. As the amounts of the square phases were very little, the study mainly focused on the eutectic phases. Then, the second phases in AZ80 are shown in Figure 2c,d. A few white sphere phases also appeared around the reticular phases in AZ80. The reticular eutectic second phases were Mg17Al12, and the white sphere phases were MnAl2 [17].
The EDS mapping of second phases in WE43 are shown in Figure 3. As shown in the figures, the alloying elements were Nd, Y, Gd. The matrix of WE43 alloy was mainly magnesium, and the rare earth elements mainly concentrated in the second phases. The EDS mapping of AZ80 alloy is shown in Figure 4. The composites of second phases were mostly Mg and Al, Mn and Zn and were too little to be expressed in the mapping. The existence of Mn and Zn were verified by ICP before the experiments.

3.2. Immersion Tests

3.2.1. Surfaces Characterization

After immersion in NaCl and Na2SO4 solution, WE43 and AZ80 alloys showed different morphologies, which are shown in Figure 5. When WE43 was immersed in NaCl solution for 10 h, micro-galvanic corrosion was severe, as expressed in Figure 5a. The bright second phase in WE43 still existed, and the adjacent Mg matrix was corroded, so that a gully could be found along the second phase. Similarly, in NaCl solution, as presented in Figure 5c the Mg matrix of AZ80 was corroded severely, the surface was full of holes and the second phase was left. In NaCl solution, the micro-galvanic corrosion between the second phase and Mg matrix dominated the corrosion process. The second phase acted as the cathode, and the Mg matrix acted as the anode. Of course, the second phase in AZ80 could also block the extension of corrosion, which is shown in Figure 5c.
Interestingly, when these two alloys were immersed in Na2SO4 solution, as shown in Figure 5b,d, different phenomena were presented. In Figure 5b, the bright aera should be the eutectic structure, including the second phase and Mg. After immersion in Na2SO4 solution for 10 h, the second phase was missing, and the Mg matrix in the eutectic structure was left. It was a typical galvanic corrosion phenomenon. Thus, it could be concluded that, in Na2SO4 solution, the second phase in WE43 acts as the anode and dissolves preferentially. The Mg in the eutectic structure and the Mg matrix adjacent to the second phase has been protected as the cathode. As for AZ80, although the corrosion phenomenon in Figure 5d had some difference with that in Figure 5c, they followed the same micro-galvanic corrosion mechanism. In NaCl and Na2SO4 solution, the second phase in AZ80 always acted as the cathode and accelerated the dissolution of Mg matrix.

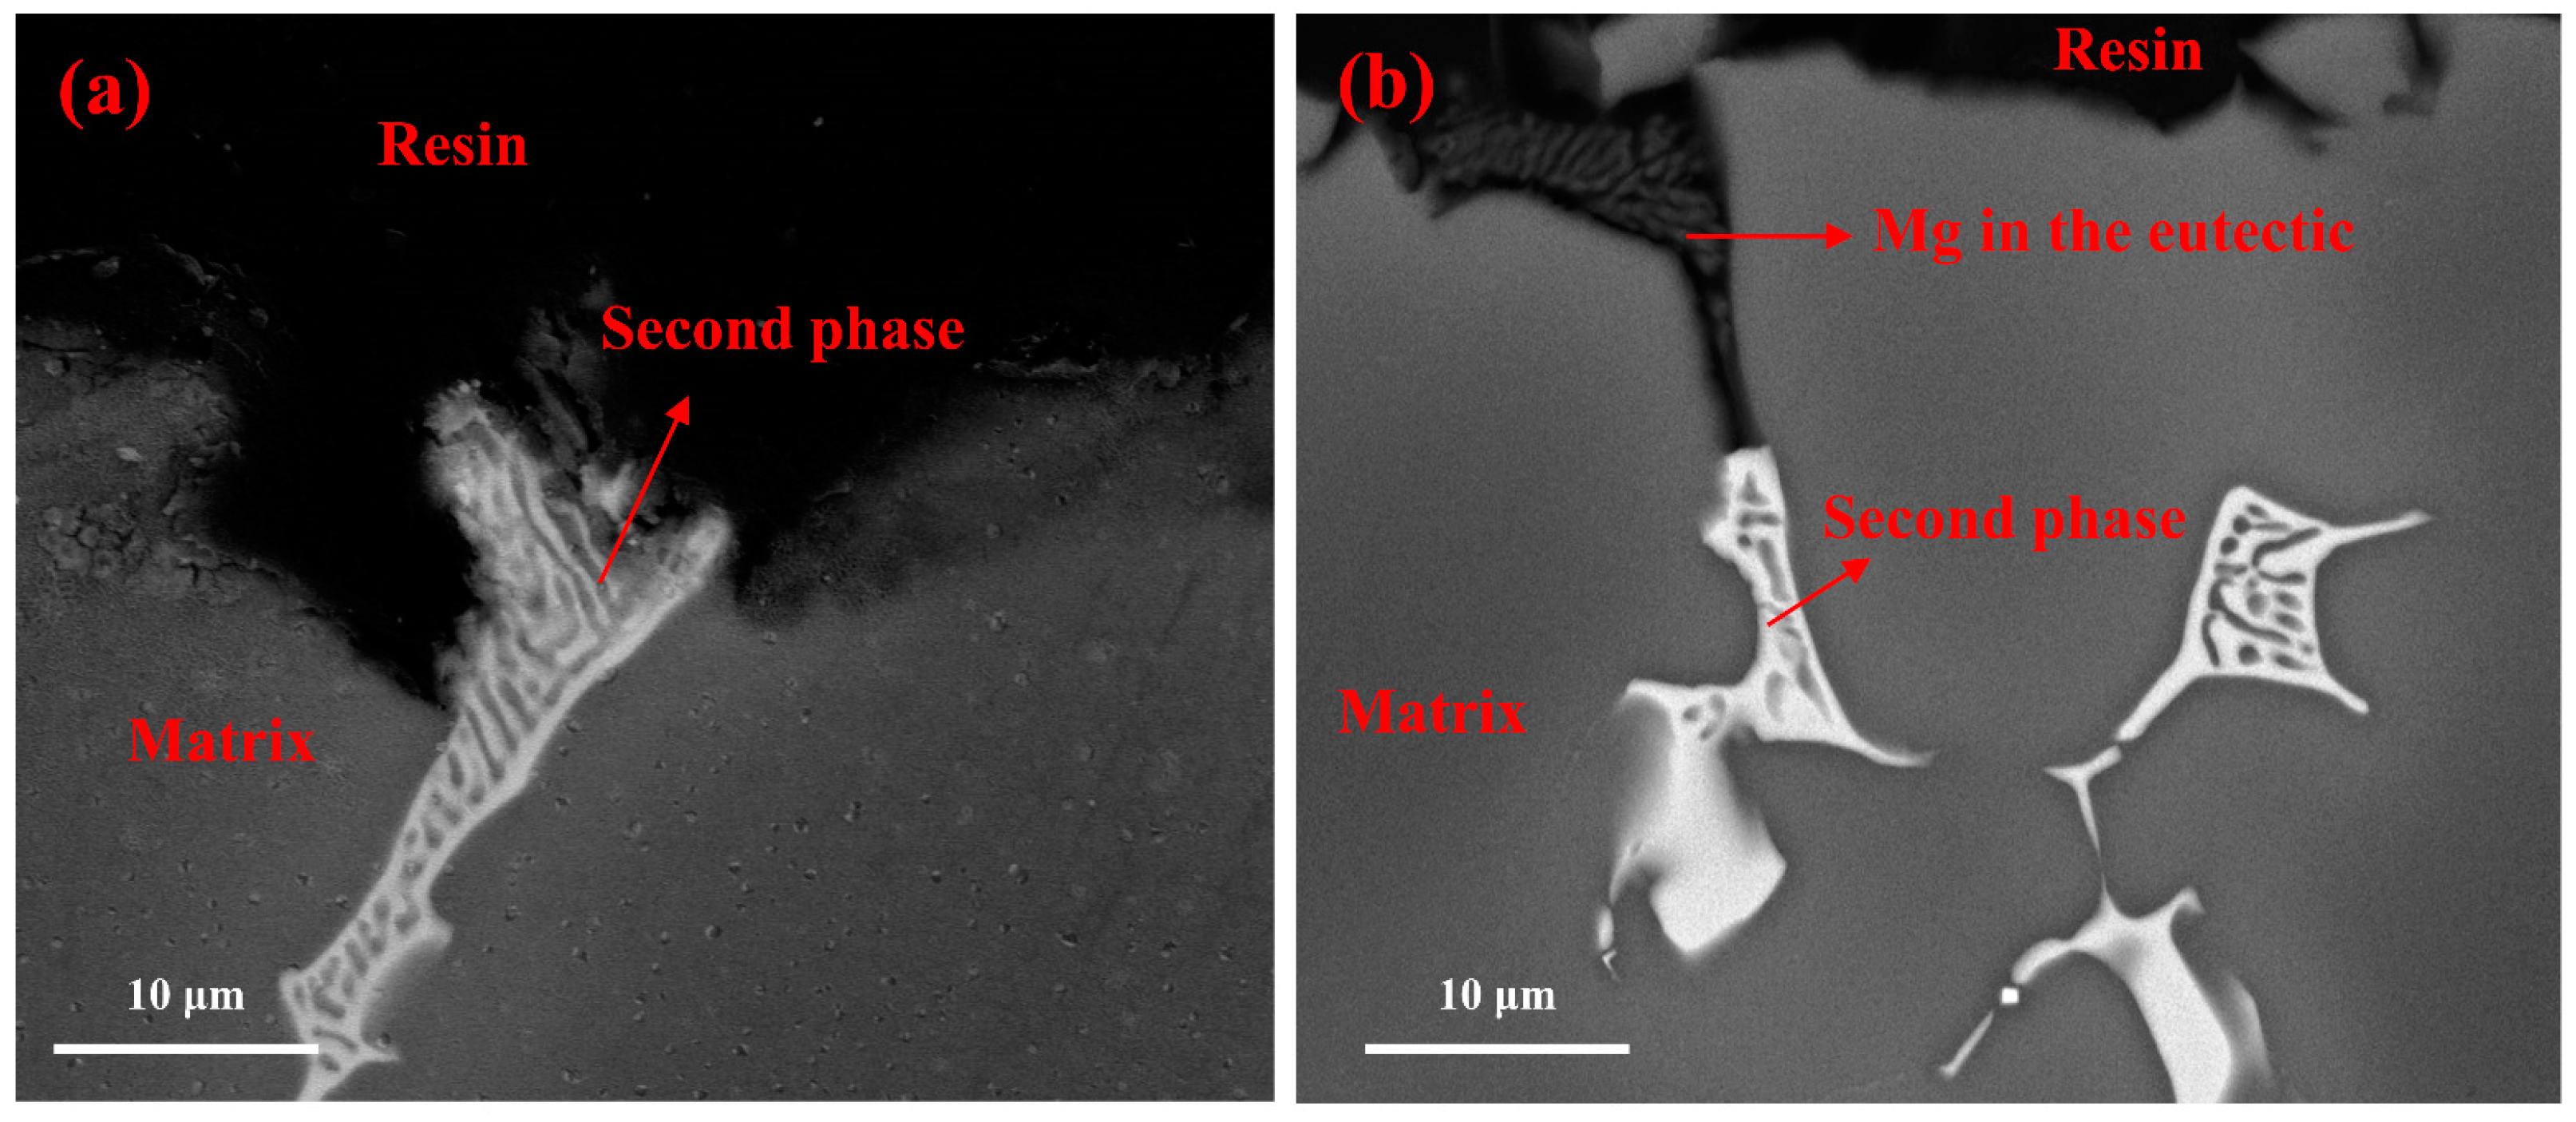
3.2.2. Cross-Section Morphology Characterization

To get a clearer view of the dissolution situation, the cross-section morphology was necessary. In this way, the situation of dissolution could be presented more directly. The surface of WE43 and AZ80 samples were etched by chromic acid to get rid of corrosion products layer. As shown in Figure 6a, it can be found that, in WE43 alloy, the second phase was higher than the adjacent Mg matrix, which means that Mg matrix around the second phase was dissolved because of the micro-galvanic corrosion. Nevertheless, in Figure 6b, the second phase was lower than Mg matrix, and the Mg in the eutectic structure was left in the corroded area, which suggests the dissolution of second phases. The phenomenon indicated that in NaCl solution, due to the micro-galvanic corrosion, the second phase was protected as cathode with Mg matrix as anode. On the contrary, in Na2SO4 solution the Mg matrix was protected as cathode with the second phase as anode.
The cross-section morphologies of AZ80 are shown in Figure 7a,b. The figures show that the second phases in AZ80 alloys were both higher than Mg matrix. The phenomenon indicates that the second phases were protected by matrix. The reason is that the second phases in AZ80 played a role of cathode in NaCl and Na2SO4 solution, so that magnesium matrix would dissolve preferentially.
Most metallic materials are sensitive to Cl, including AZ80. However, WE43 is special, as was revealed, it showed more sensitivity to SO42− than Cl. The different roles of second phases in micro-galvanic corrosion were caused by different components. The rare earth elements in WE43 were more sensitive in certain solutions, which could be attributed to the surface oxide film. The property of surface oxide film would affect the corrosion resistance of alloy, which are shown in the hydrogen evolution and weight loss experiments.

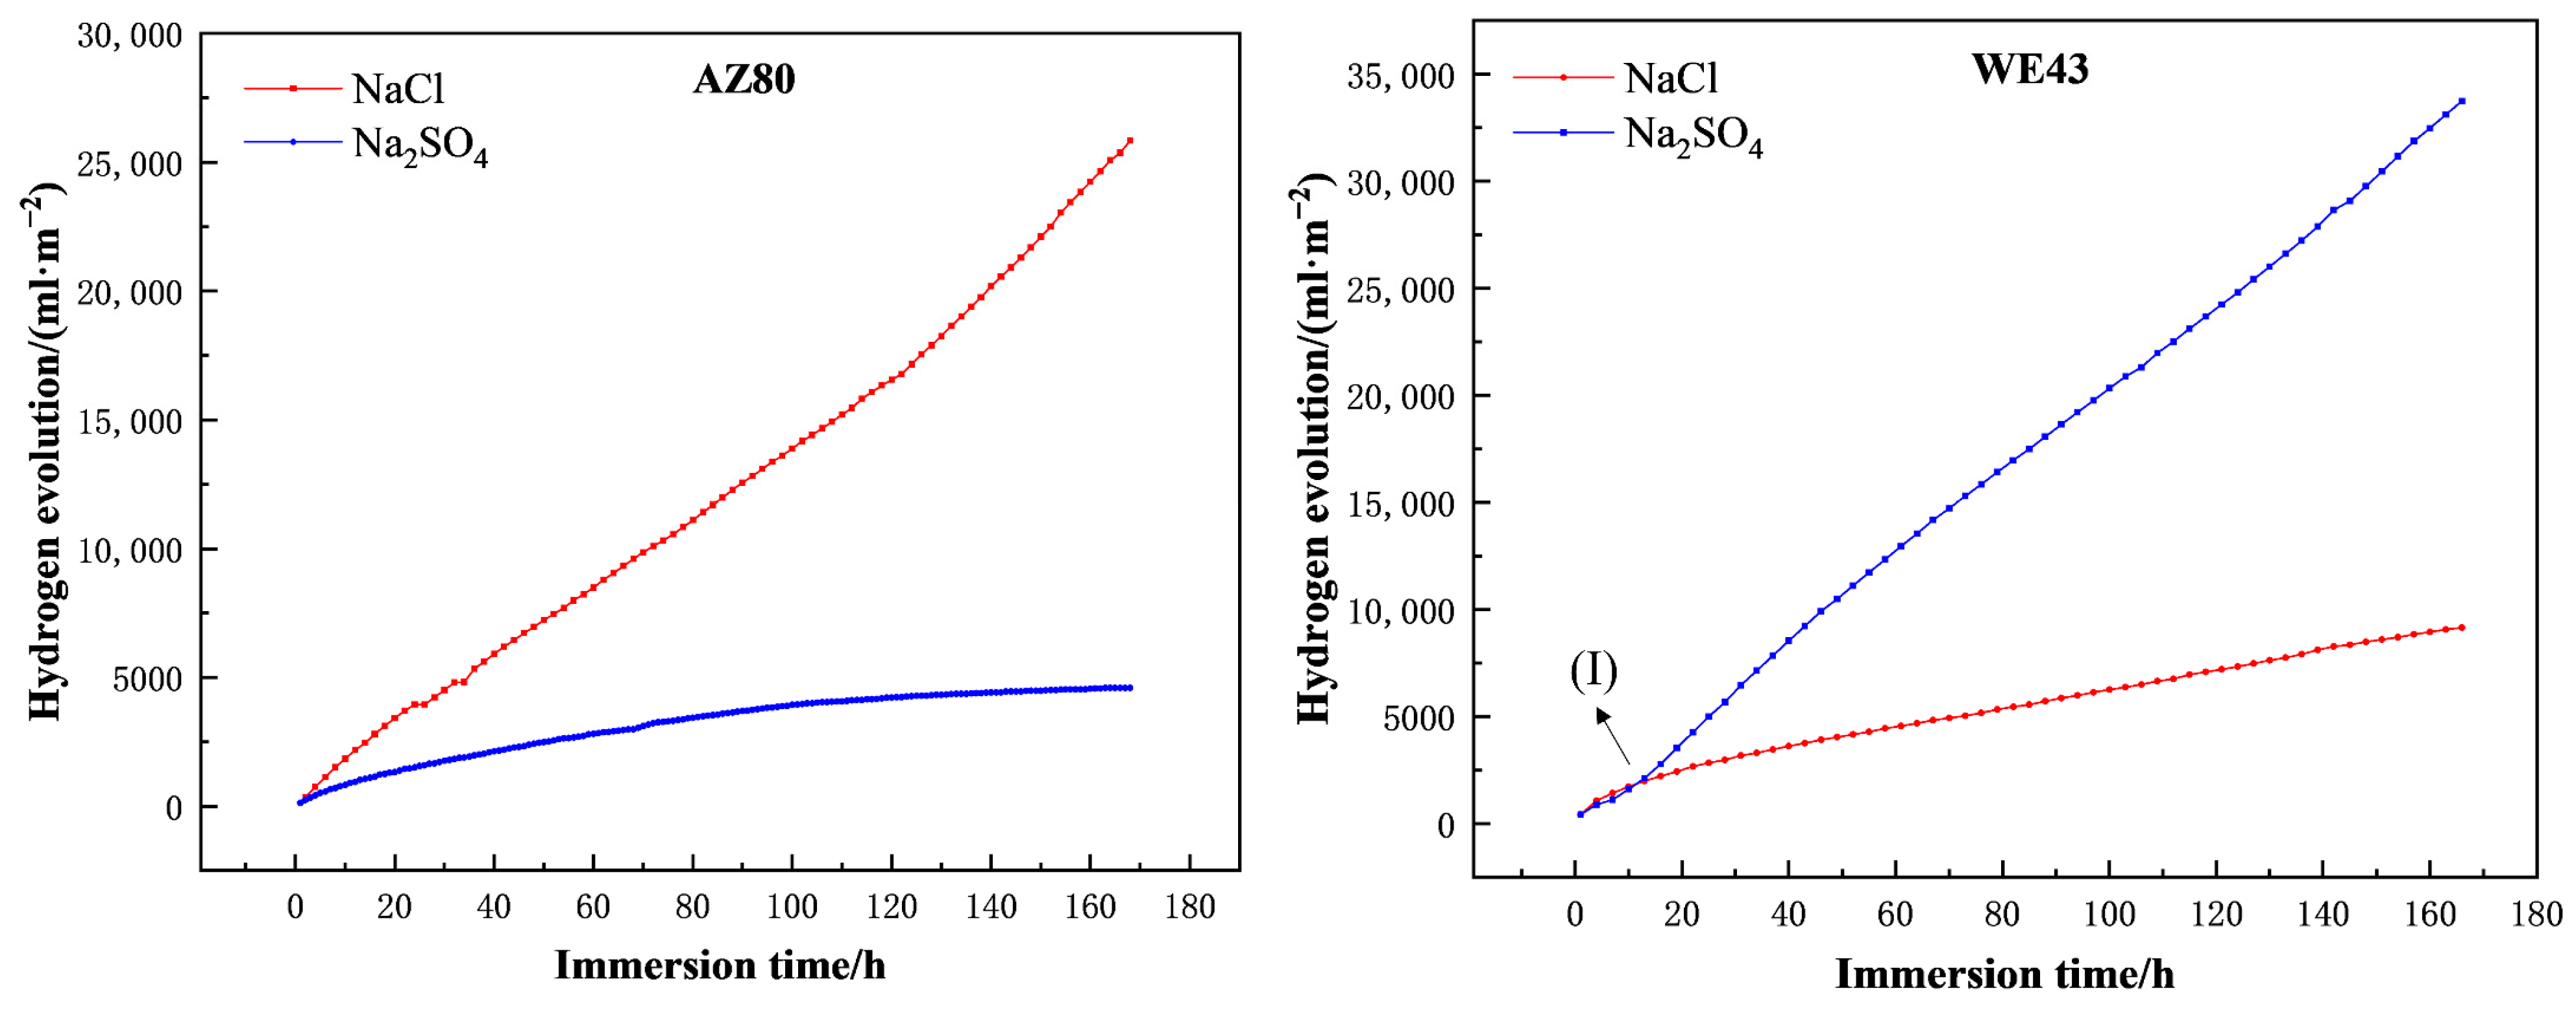
3.3. Hydrogen Evolution and Weight Loss Measurements

Hydrogen evolution experiments can characterize the corrosion rate of alloys. As shown in Figure 8, WE43 and AZ80 were immersed in NaCl and Na2SO4 solution for 7 days, respectively. It can be clearly observed that the hydrogen evolution rates were different. The hydrogen evolution amount of AZ80 in NaCl solution was about 8 times as much as AZ80 immersed in Na2SO4 solution, while WE43 is at opposite poles. The hydrogen evolution amount of WE43 in Na2SO4 solution was 4.6 times as much as that in NaCl solution. The hydrogen evolution indicates that the corrosion resistance of these two alloys in different solutions were different. The corrosion resistance of AZ80 in Na2SO4 solution was much better than that in NaCl solution, and the corrosion resistance of WE43 in NaCl solution was much better than that in Na2SO4 solution. Meanwhile, at the initial immersion term (marked as (Ⅰ) in Figure 8), the hydrogen evolution amount of WE43 in NaCl solution was more than that in Na2SO4 solution. Then, the hydrogen evolution of WE43 in Na2SO4 solution clearly increased and the total hydrogen evolution in Na2SO4 solution was much larger than in NaCl solution. It should be attributed to the situation that the surface film of WE43 alloy loses protection. This phenomenon could also happen in polarization experiments.
The weight loss results are shown in Figure 9, they also indicate the same conclusion that WE43 alloy was corroded more severely in Na2SO4 solution than in NaCl solution. The weight loss rate of WE43 in Na2SO4 solution was about 1.3 mm/year, which was about 2 times more than that in NaCl solution. While the weight loss of AZ80 in NaCl solution was about 1.55 mm/year, which was 2.6 times more than that in Na2SO4 solution.

3.4. Electrochemical Measurements Results

3.4.1. Potential Dynamic Polarization Curves
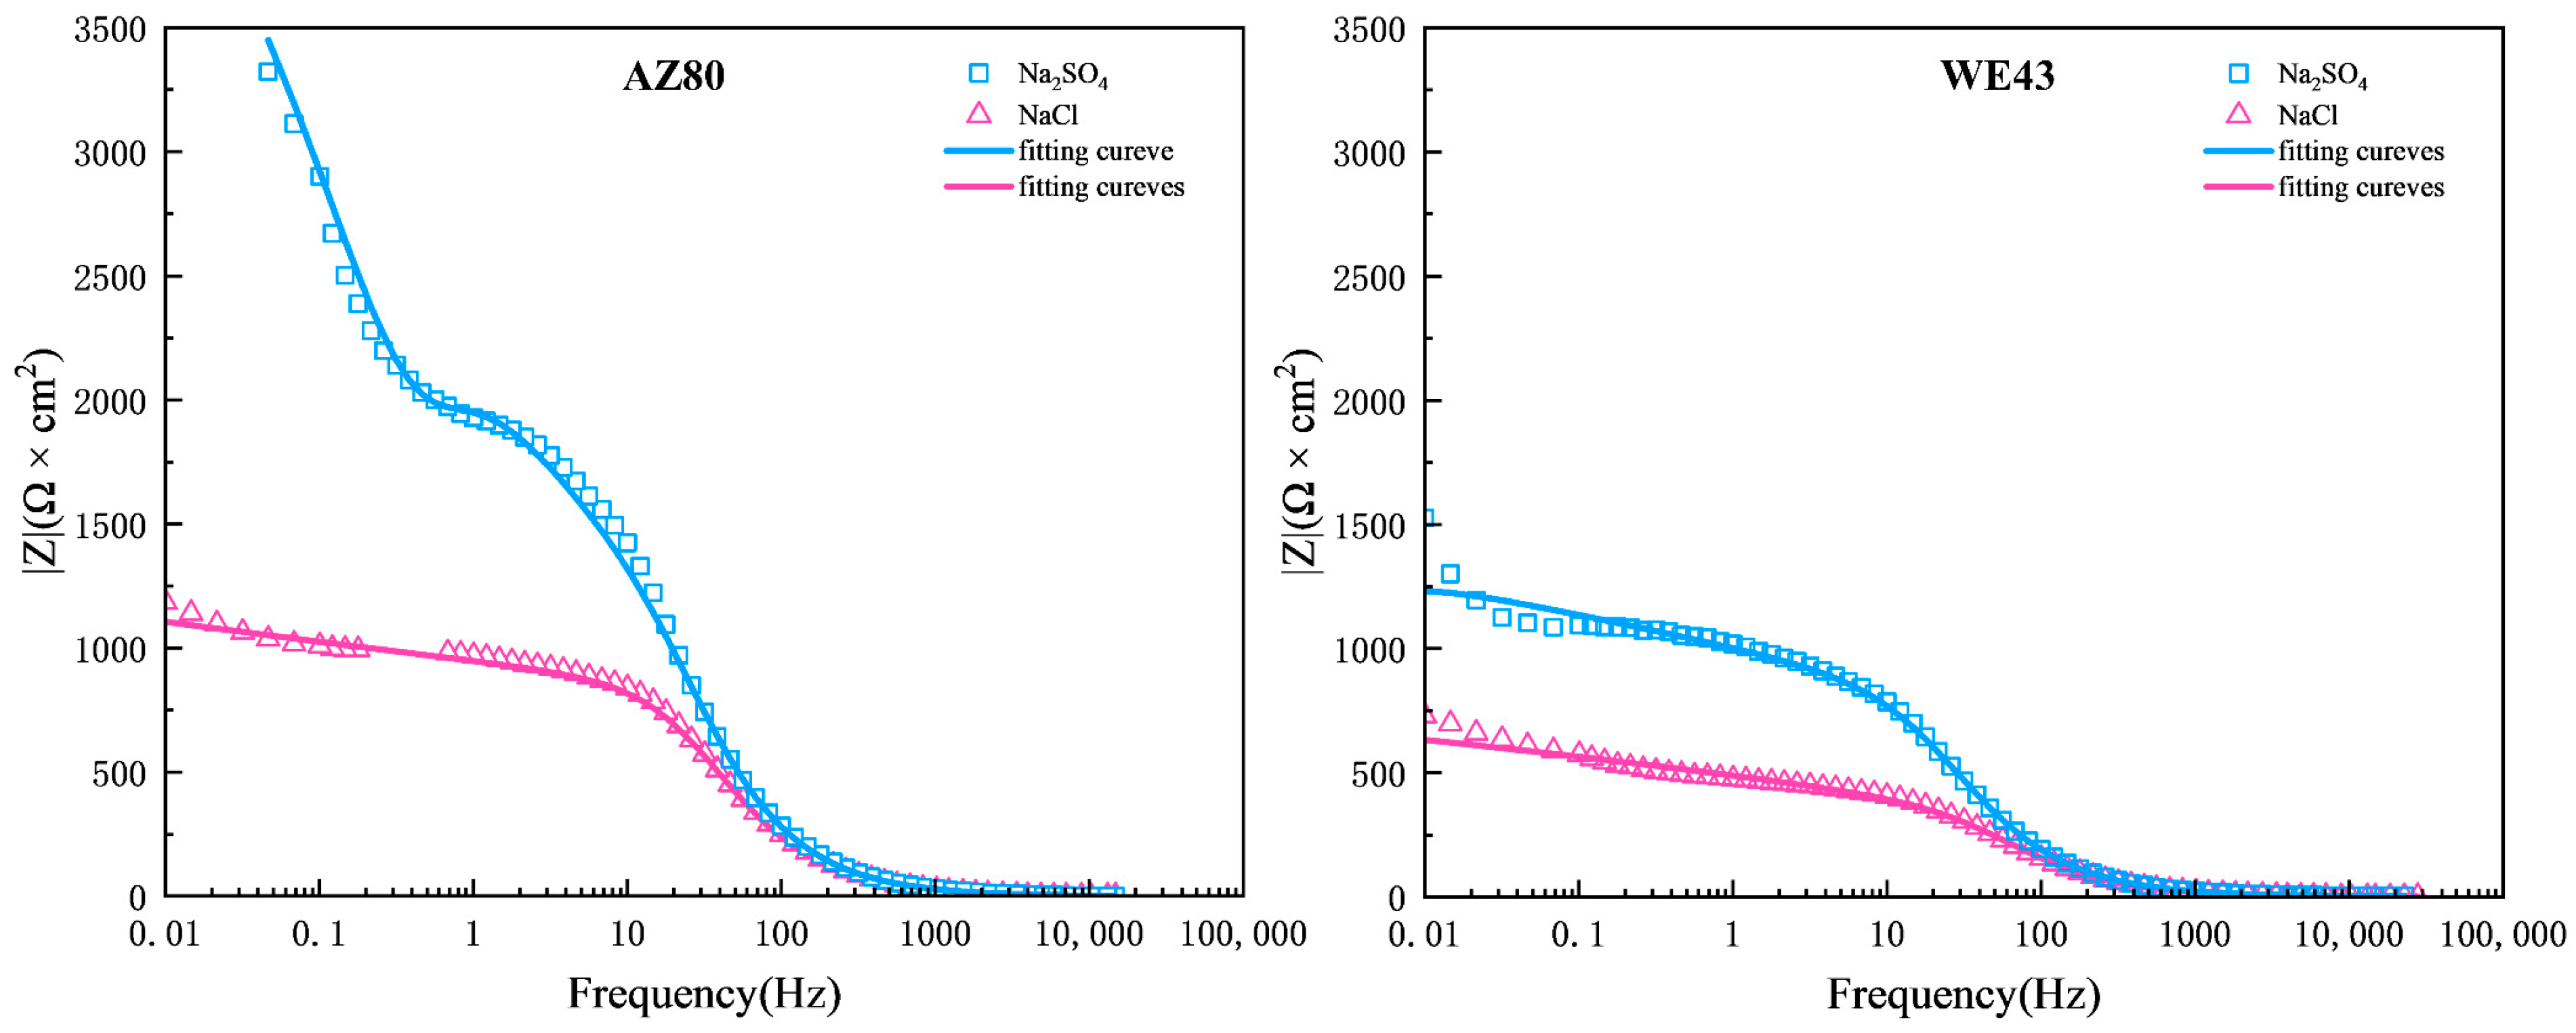
The electrochemical measurements mainly contain polarization curves and EIS (electrochemical impedance spectroscopy). The cathodic and anodic polarization were measured from the OCP separately and plotted together. Figure 10 shows the polarization curves of WE43 and AZ80 in Na2SO4 and NaCl solution, respectively. When WE43 was immersed in NaCl solution, the inflection point could be found in the anodic curve, which means the breakdown of film formed on WE43 alloy in solution. While in Na2SO4 solution, the anodic curve showed the active dissolution of the alloy, which indicates poor protection of the surface film. Without a protective surface film in Na2SO4 solution, WE43 corrodes much faster than in NaCl solution, shown by the results of hydrogen evolution and weight loss tests. The fitting results of the polarization curves are shown in Table 3. According to the fitting results, the value of the icorr in NaCl solution was higher than in Na2SO4 solution, which agrees with the hydrogen evolution test at the initial immersion term. The anodic curves of AZ80 show the inflection points in both solutions. Considering the results of immersion tests in Figure 5, Figure 6 and Figure 7, it can be found that the alloy showed a poor protective surface film when the second phase acted as anode in the micro-galvanic corrosion. In Table 3 and Table 4, the Pi was calculated by icorr and the formula mentioned in Section 2.5. In the case of AZ80 alloy, the Pm and Pi in NaCl solution was higher than in the Na2SO4 solution. While the Pi in Table 4 were different with the Pm of WE43 in Figure 9. The calculated results Pi of NaCl solution were larger than Na2SO4 solution which was in accordance with the phenomenon (Ⅰ). Rp is polarization resistance which could be calculated by equation, and the value of Rp could express the corrosion situation to some extent. The Rp of the alloys in two solutions showed a similar rule. The Rp of AZ80 in NaCl solution was smaller than in the Na2SO4 solution, which was same as WE43 alloys. Electrochemical methods, especially polarization experiments, reflect the initial stage of corrosion. As a result, the corrosion rate of WE43 in NaCl solution was faster than that in Na2SO4 solution at the beginning. While, as the immersion time increased, the corrosion film generated in Na2SO4 solution was no longer protective, which finally caused the larger Pm in Na2SO4 solution than in NaCl solution.

3.4.2. EIS Test

The Nyquist plots are shown in Figure 11. Figure 12 and Figure 13 are amplitude diagram (|Z| vs. f) and phase angle diagram (phase angle vs. f), respectively. In the Nyquist plots, the high frequency capacitance loop is on the left, which is related to the electric double layer, while the low frequency capacitance loop is on the right, which is in connection with the surface film. The equivalent circuit shown in Figure 14 was used to fit the results. As shown in Table 5, Rs is the impendence of solution; Rct is the charge transfer resistance; Qdl is the double layer capacitance; Rf is the impendence of film; Qf is the surface film capacitance; L is the inductance at the interface of film and substrate; RL is impendence of inductance. It can be found that both AZ80 and WE43 presented a larger Nyquist plot scale and Rct and Rf values. This means that, at the initial immersion time, the corrosion resistance of two alloys in Na2SO4 solution were better than that in NaCl solution. The Rct value of WE43 in Na2SO4 solution was much larger than that in NaCl solution. On the other hand, the Rf value of WE43 in Na2SO4 solution was smaller. In accordance with the results of polarization curves, the surface film of WE43 in Na2SO4 solution lacked enough protective effect. Bode plots, which are presented in Figure 12 and Figure 13, were divided into two parts, amplitude diagram and Phase angle diagram. They showed the same rule as Nyquist curves. As shown in Figure 11 and Figure 12, when immersed AZ80 in Na2SO4 solution, the radius of the blue curve was larger than that of pink curve. The value of |Z| in Figure 12 had the same rule: the blue one is higher than pink one. The rules between the curves of WE43 were similar with AZ80. The blue curves in EIS and Amplitude diagram of WE43 were both higher than pink curves, which means that the corrosion resistance of AZ80 in Na2SO4 solution was better than in NaCl solution.
In this work, by comparing the corrosion behavior of WE43 and AZ80 in NaCl and Na2SO4 solution, two unexpected phenomena have been exhibited. One is the micro-galvanic corrosion behavior of WE43 alloy in Na2SO4 solution, in which second phase acted as the anode and dissolved preferentially. The other one was the better corrosion resistance of WE43 alloy in NaCl solution than in Na2SO4 solution, which was different from AZ80 and most of the magnesium alloys.
The electrochemical measurements results indicate that the surface film of WE43 in Na2SO4 solution did not have enough of a protective effect. The Pi of WE43 in NaCl solution was larger than in Na2SO4, but Pm was to the contrary. The higher weight loss rate in Na2SO4 indicates a worse protective film than the film in NaCl solution. The different roles of the second phase led to different micro-galvanic corrosion behavior shown in the immersion tests. Due to the not protective surface film and unique micro-galvanic corrosion behavior, the corrosion rate of WE43 alloy in Na2SO4 solution was much faster than that in NaCl solution, shown in the hydrogen evolution and weight loss measurements. The unexpected phenomena were explained.

4. Conclusions

WE43 and AZ80 showed different micro-galvanic corrosion behavior when immersed in NaCl and Na2SO4 solution, respectively. The second phase in WE43 acted as the anode and dissolved preferentially when immersed in Na2SO4 solution, while in AZ80 it showed a cathodic role. WE43 would be corroded more severely in Na2SO4 solution than in NaCl. While at the beginning of the corrosion, two alloys were more fragile to Cl than SO42−. However, as the immersion time increased, WE43 showed different phenomenon compared with AZ80 because of there being no protective film on WE43 in SO42−, which can be observed in hydrogen evolution and electrochemical measurements. The reason is that the film of WE43 immersed in Na2SO4 solution was not protective. The characterization of the relationship between rare earth elements and product film on WE43 needs to be strengthened, which may explain the corrosion mechanism of magnesium alloys in different solution.

Author Contributions

Conceptualization, Y.Z. and J.L.; Methodology, Validation, Investigation, Writing—Original Draft, C.L. and Y.Z.; Writing-Review and Editing, J.X., D.G., H.Z. and X.Z.; Supervision, P.Y.; Project administration, Funding acquisition, J.L. and S.Z. All authors have read and agreed to the published version of the manuscript.

Funding

This work was funded by the China Postdoctoral Science Foundation (Grant No. 2020M682337), Certificate of Postdoctoral Research Grant in Henan Province (Grant No. 201903011).

Data Availability Statement

All data used to support the findings of this study are included within the article.

Conflicts of Interest

The authors declare that they have no known competing financial interest or personal relationships that could have appeared to influence the work reported in this paper.

References

  1. Chu, P.-W.; Marquis, E.A. Linking the microstructure of a heat-treated WE43 Mg alloy with its corrosion behavior. Corros. Sci. 2015, 101, 94–104. [Google Scholar] [CrossRef]
  2. Jin, W.; Wu, G.; Feng, H.; Wang, W.; Zhang, X.; Chu, P.K. Improvement of corrosion resistance and biocompatibility of rare-earth WE43 magnesium alloy by neodymium self-ion implantation. Corros. Sci. 2015, 94, 142–155. [Google Scholar] [CrossRef]
  3. Gneiger, S.; Papenberg, N.; Frank, S.; Gradinger, R. Investigations on Microstructure and Mechanical Properties of Non-flammable Mg–Al–Zn–Ca–Y Alloys. In Magnesium Technology 2018; The Minerals, Metals & Materials Series; Springer: Berlin, Germany, 2018; pp. 105–113. [Google Scholar]
  4. Esmaily, M.; Svensson, J.E.; Fajardo, S.; Birbilis, N.; Frankel, G.S.; Virtanen, S.; Arrabal, R.; Thomas, S.; Johansson, L.G. Fundamentals and advances in magnesium alloy corrosion. Prog. Mater. Sci. 2017, 89, 92–193. [Google Scholar] [CrossRef]
  5. Pan, F.S.; Yang, M.B.; Ma, Y.L. Development of New Types of Magnesium Alloys Containing Sr or RE Elements. Mater. Sci. Forum 2007, 561–565, 191–197. [Google Scholar] [CrossRef]
  6. Cheng, C.; Lan, Q.; Liao, Q.; Le, Q.; Li, X.; Chen, X.; Cui, J. Effect of Ca and Gd combined addition on ignition temperature and oxidation resistance of AZ80. Corros. Sci. 2019, 160, 108176. [Google Scholar] [CrossRef]
  7. Cheng, C.; Li, X.; Le, Q.; Guo, R.; Lan, Q.; Cui, J. Effect of REs (Y, Nd) addition on high temperature oxidation kinetics, oxide layer characteristic and activation energy of AZ80 alloy. J. Magnes. Alloy 2020, 8, 1281–1295. [Google Scholar] [CrossRef]
  8. Ubeda, C.; Garces, G.; Adeva, P.; Llorente, I.; Frankel, G.S.; Fajardo, S. The role of the beta-Mg17Al12 phase on the anomalous hydrogen evolution and anodic dissolution of AZ magnesium alloys. Corros. Sci. 2020, 165. [Google Scholar] [CrossRef]
  9. Wang, L.; Shinohara, T.; Zhang, B.-P.; Iwai, H. Characterization of surface products on AZ31 magnesium alloy in dilute NaCl solution. J. Alloys Compd. 2009, 485, 747–752. [Google Scholar] [CrossRef]
  10. Pardo, A.; Merino, M.C.; Coy, A.E.; Arrabal, R.; Viejo, F.; Matykina, E. Corrosion behaviour of magnesium/aluminium alloys in 3.5wt.% NaCl. Corros. Sci. 2008, 50, 823–834. [Google Scholar] [CrossRef]
  11. Sanchez, C.; Nussbaum, G.; Azavant, P.; Octor, H. Elevated temperature behaviour of rapidly solidified magnesium alloys containing rare earths. Mater. Sci. Eng. A 1996, 221, 48–57. [Google Scholar] [CrossRef]
  12. Liu, L.J.; Schlesinger, M. Corrosion of magnesium and its alloys. Corros. Sci. 2009, 51, 1733–1737. [Google Scholar] [CrossRef]
  13. Zucchi, F.; Grassi, V.; Frignani, A.; Monticelli, C.; Trabanelli, G. Electrochemical behaviour of a magnesium alloy containing rare earth elements. J. Appl. Electrochem. 2005, 36, 195–204. [Google Scholar] [CrossRef]
  14. Mościcki, A.; Chmiela, B.; Sozańska, M. Corrosion of WE43 and AE44 Magnesium Alloys in Sodium Sulfate Solution. Solid State Phenom. 2015, 227, 91–94. [Google Scholar] [CrossRef]
  15. Knapek, M.; Minárik, P.; Čapek, J.; Král, R.; Kubásek, J.; Chmelík, F. Corrosion of pure magnesium and a WE43 magnesium alloy studied by advanced acoustic emission analysis. Corros. Sci. 2018, 145, 10–15. [Google Scholar] [CrossRef]
  16. Cao, F.; Zheng, D.; Song, G.-L.; Shi, Z.; Atrens, A. The Corrosion Behavior of Mg5Y in Nominally Distilled Water. Adv. Eng. Mater. 2018, 20, 1700986. [Google Scholar] [CrossRef]
  17. Kharitonov, D.S.; Zimowska, M.; Ryl, J.; Zieliński, A.; Osipenko, M.A.; Adamiec, J.; Wrzesińska, A.; Claesson, P.M.; Kurilo, I.I. Aqueous molybdate provides effective corrosion inhibition of WE43 magnesium alloy in sodium chloride solutions. Corros. Sci. 2021, 190, 109664. [Google Scholar] [CrossRef]
  18. Wang, S.D.; Xu, D.K.; Chen, X.B.; Han, E.H.; Dong, C. Effect of heat treatment on the corrosion resistance and mechanical properties of an as-forged Mg–Zn–Y–Zr alloy. Corros. Sci. 2015, 92, 228–236. [Google Scholar] [CrossRef]
  19. Wang, S.D.; Xu, D.K.; Wang, B.J.; Sheng, L.Y.; Qiao, Y.X.; Han, E.-H.; Dong, C. Influence of phase dissolution and hydrogen absorption on the stress corrosion cracking behavior of Mg-7%Gd-5%Y-1%Nd-0.5%Zr alloy in 3.5 wt.% NaCl solution. Corros. Sci. 2018, 142, 185–200. [Google Scholar] [CrossRef]
  20. Wang, S.D.; Xu, D.K.; Wang, B.J.; Sheng, L.Y.; Han, E.H.; Dong, C. Effect of solution treatment on stress corrosion cracking behavior of an as-forged Mg-Zn-Y-Zr alloy. Sci. Rep. 2016, 6, 29471. [Google Scholar] [CrossRef] [Green Version]
  21. Wang, S.D.; Xu, D.K.; Wang, B.J.; Han, E.H.; Dong, C. Effect of solution treatment on the fatigue behavior of an as-forged Mg-Zn-Y-Zr alloy. Sci. Rep. 2016, 6, 23955. [Google Scholar] [CrossRef] [Green Version]
  22. Wang, S.D.; Xu, D.K.; Wang, B.J.; Han, E.H.; Dong, C. Effect of corrosion attack on the fatigue behavior of an as-cast Mg–7%Gd–5%Y–1%Nd–0.5%Zr alloy. Mater. Des. 2015, 84, 185–193. [Google Scholar] [CrossRef]
  23. Kalb, H.; Rzany, A.; Hensel, B. Impact of microgalvanic corrosion on the degradation morphology of WE43 and pure magnesium under exposure to simulated body fluid. Corros. Sci. 2012, 57, 122–130. [Google Scholar] [CrossRef]
  24. Feng, B.; Liu, G.; Yang, P.; Huang, S.; Qi, D.; Chen, P.; Wang, C.; Du, J.; Zhang, S.; Liu, J. Different role of second phase in the micro-galvanic corrosion of WE43 Mg alloy in NaCl and Na2SO4 solution. J. Magnes. Alloy 2021, 10, 1598–1608. [Google Scholar] [CrossRef]
  25. Liu, J.; Song, Y.; Shan, D.; Han, E.-H. Different Microgalvanic Corrosion Behavior of Cast and Extruded EW75 Mg Alloys. J. Electrochem. Soc. 2016, 163, C856–C863. [Google Scholar] [CrossRef] [Green Version]
  26. Unocic, K.A.; Elsentriecy, H.H.; Brady, M.P.; Meyer, H.M.; Song, G.L.; Fayek, M.; Meisner, R.A.; Davis, B. Transmission Electron Microscopy Study of Aqueous Film Formation and Evolution on Magnesium Alloys. J. Electrochem. Soc. 2014, 161, C302–C311. [Google Scholar] [CrossRef]
  27. Burduhos-Nergis, D.P.; Vizureanu, P.; Sandu, A.V.; Bejinariu, C. Phosphate Surface Treatment for Improving the Corrosion Resistance of the C45 Carbon Steel Used in Carabiners Manufacturing. Materials 2020, 13, 3410. [Google Scholar] [CrossRef]
  28. Yu, S.; Jia, R.-L.; Zhang, T.; Wang, F.-H.; Hou, J.; Zhang, H.-X. Effect of Different Scale Precipitates on Corrosion Behavior of Mg–10Gd–3Y–0.4Zr Alloy. Acta Metall. Sin. 2018, 32, 433–442. [Google Scholar] [CrossRef] [Green Version]
Figure 1. The XRD pattern of (a) WE43 and (b) AZ80.
Crystals 13 00506 g001
Figure 2. The surface morphology of (a,b) WE43 and (c,d) AZ80.
Crystals 13 00506 g002
Figure 3. The EDS mapping of the second phases in WE43.
Crystals 13 00506 g003
Figure 4. The EDS mapping of the second phases in AZ80.
Crystals 13 00506 g004
Figure 5. WE43 immersed in: (a) NaCl solution for 10 h, (b) Na2SO4 solution for 10 h; AZ80 immersed in: (c) NaCl solution for 10 h, (d) Na2SO4 solution for 10 h.
Crystals 13 00506 g005
Figure 6. The cross-section morphology of WE43 immersed in NaCl (a) and Na2SO4 (b) for 10 h.
Crystals 13 00506 g006
Figure 7. The cross-section morphology of AZ80 immersed in NaCl (a) and Na2SO4 (b) for 10 h.
Crystals 13 00506 g007
Figure 8. The hydrogen evolution of AZ80 and WE43 in NaCl and Na2SO4.
Crystals 13 00506 g008
Figure 9. The weight loss rate (Pm) of AZ80 and WE43.
Crystals 13 00506 g009
Figure 10. Comparison of polarization curves of WE43 and AZ80 alloys in 0.6 M NaCl and Na2SO4 solution. The anodic and cathodic polarization curves were scanned from the OCP separately.
Crystals 13 00506 g010
Figure 11. Nyquist curves of AZ80 and WE43 alloys in 0.6 M NaCl and Na2SO4 solution.
Crystals 13 00506 g011
Figure 12. Amplitude diagram (|Z| vs. f) of AZ80 and WE43 alloys in 0.6 M NaCl and Na2SO4 solution.
Crystals 13 00506 g012
Figure 13. Phase angle diagram (Phase angle vs. f) of AZ80 and WE43 alloys in 0.6 M NaCl and Na2SO4 solution.
Crystals 13 00506 g013
Figure 14. Equivalent circuit of EIS spectra.
Crystals 13 00506 g014
Table 1. The compositions of the WE43 alloys.
WE43GdYNdZr
wt.%1.553.792.430.5
Table 2. The compositions of the AZ80 alloys.
AZ80AlZnMn
wt.%8.50.40.2
Table 3. The fitting result of the AZ80 cathode polarization curve.
SolutionEcorr (VSCE)icorr (μA·cm−2)ba (mV/dec)bc (−mV/dec)Rp (Ω·cm2)Pi (mm/Year)
NaCl−1.58112.21153.6203.422.312.762
Na2SO4−1.66412.18187.7196.5149.422.755
Table 4. The fitting result of the WE43 cathode polarization curve.
SolutionEcorr (VSCE)icorr (μA·cm−2)ba (mV/dec)bc (−mV/dec)Rp (Ω·cm2)Pi (mm/Year)
NaCl−1.72165.91135.5189.63.121.491
Na2SO4−1.82350.33156.7178.311.161.138
Table 5. The fitting EIS results of AZ80 and WE43 alloys immersed in NaCl and Na2SO4 solution.
AlloySolutionRsQdlndlRctQfnfRf
Ω·cm2μS·cm−2·S−1Ω·cm2μS·cm−2·S−1Ω·cm2
AZ80Na2SO40.896.45 × 10−60.9816896.47 × 10−40.862155
NaCl0.513.67 × 10−40.99202.16.40 × 10−60.98820
WE43Na2SO43.991.11 × 10−50.96764.12.55 × 10−30.88311
NaCl0.816.42 × 10−40.86171.69.27 × 10−60.95363
Disclaimer/Publisher’s Note: The statements, opinions and data contained in all publications are solely those of the individual author(s) and contributor(s) and not of MDPI and/or the editor(s). MDPI and/or the editor(s) disclaim responsibility for any injury to people or property resulting from any ideas, methods, instructions or products referred to in the content.

