
Size Effect on the Thermal Conductivity of a Type-I Clathrate

Abstract
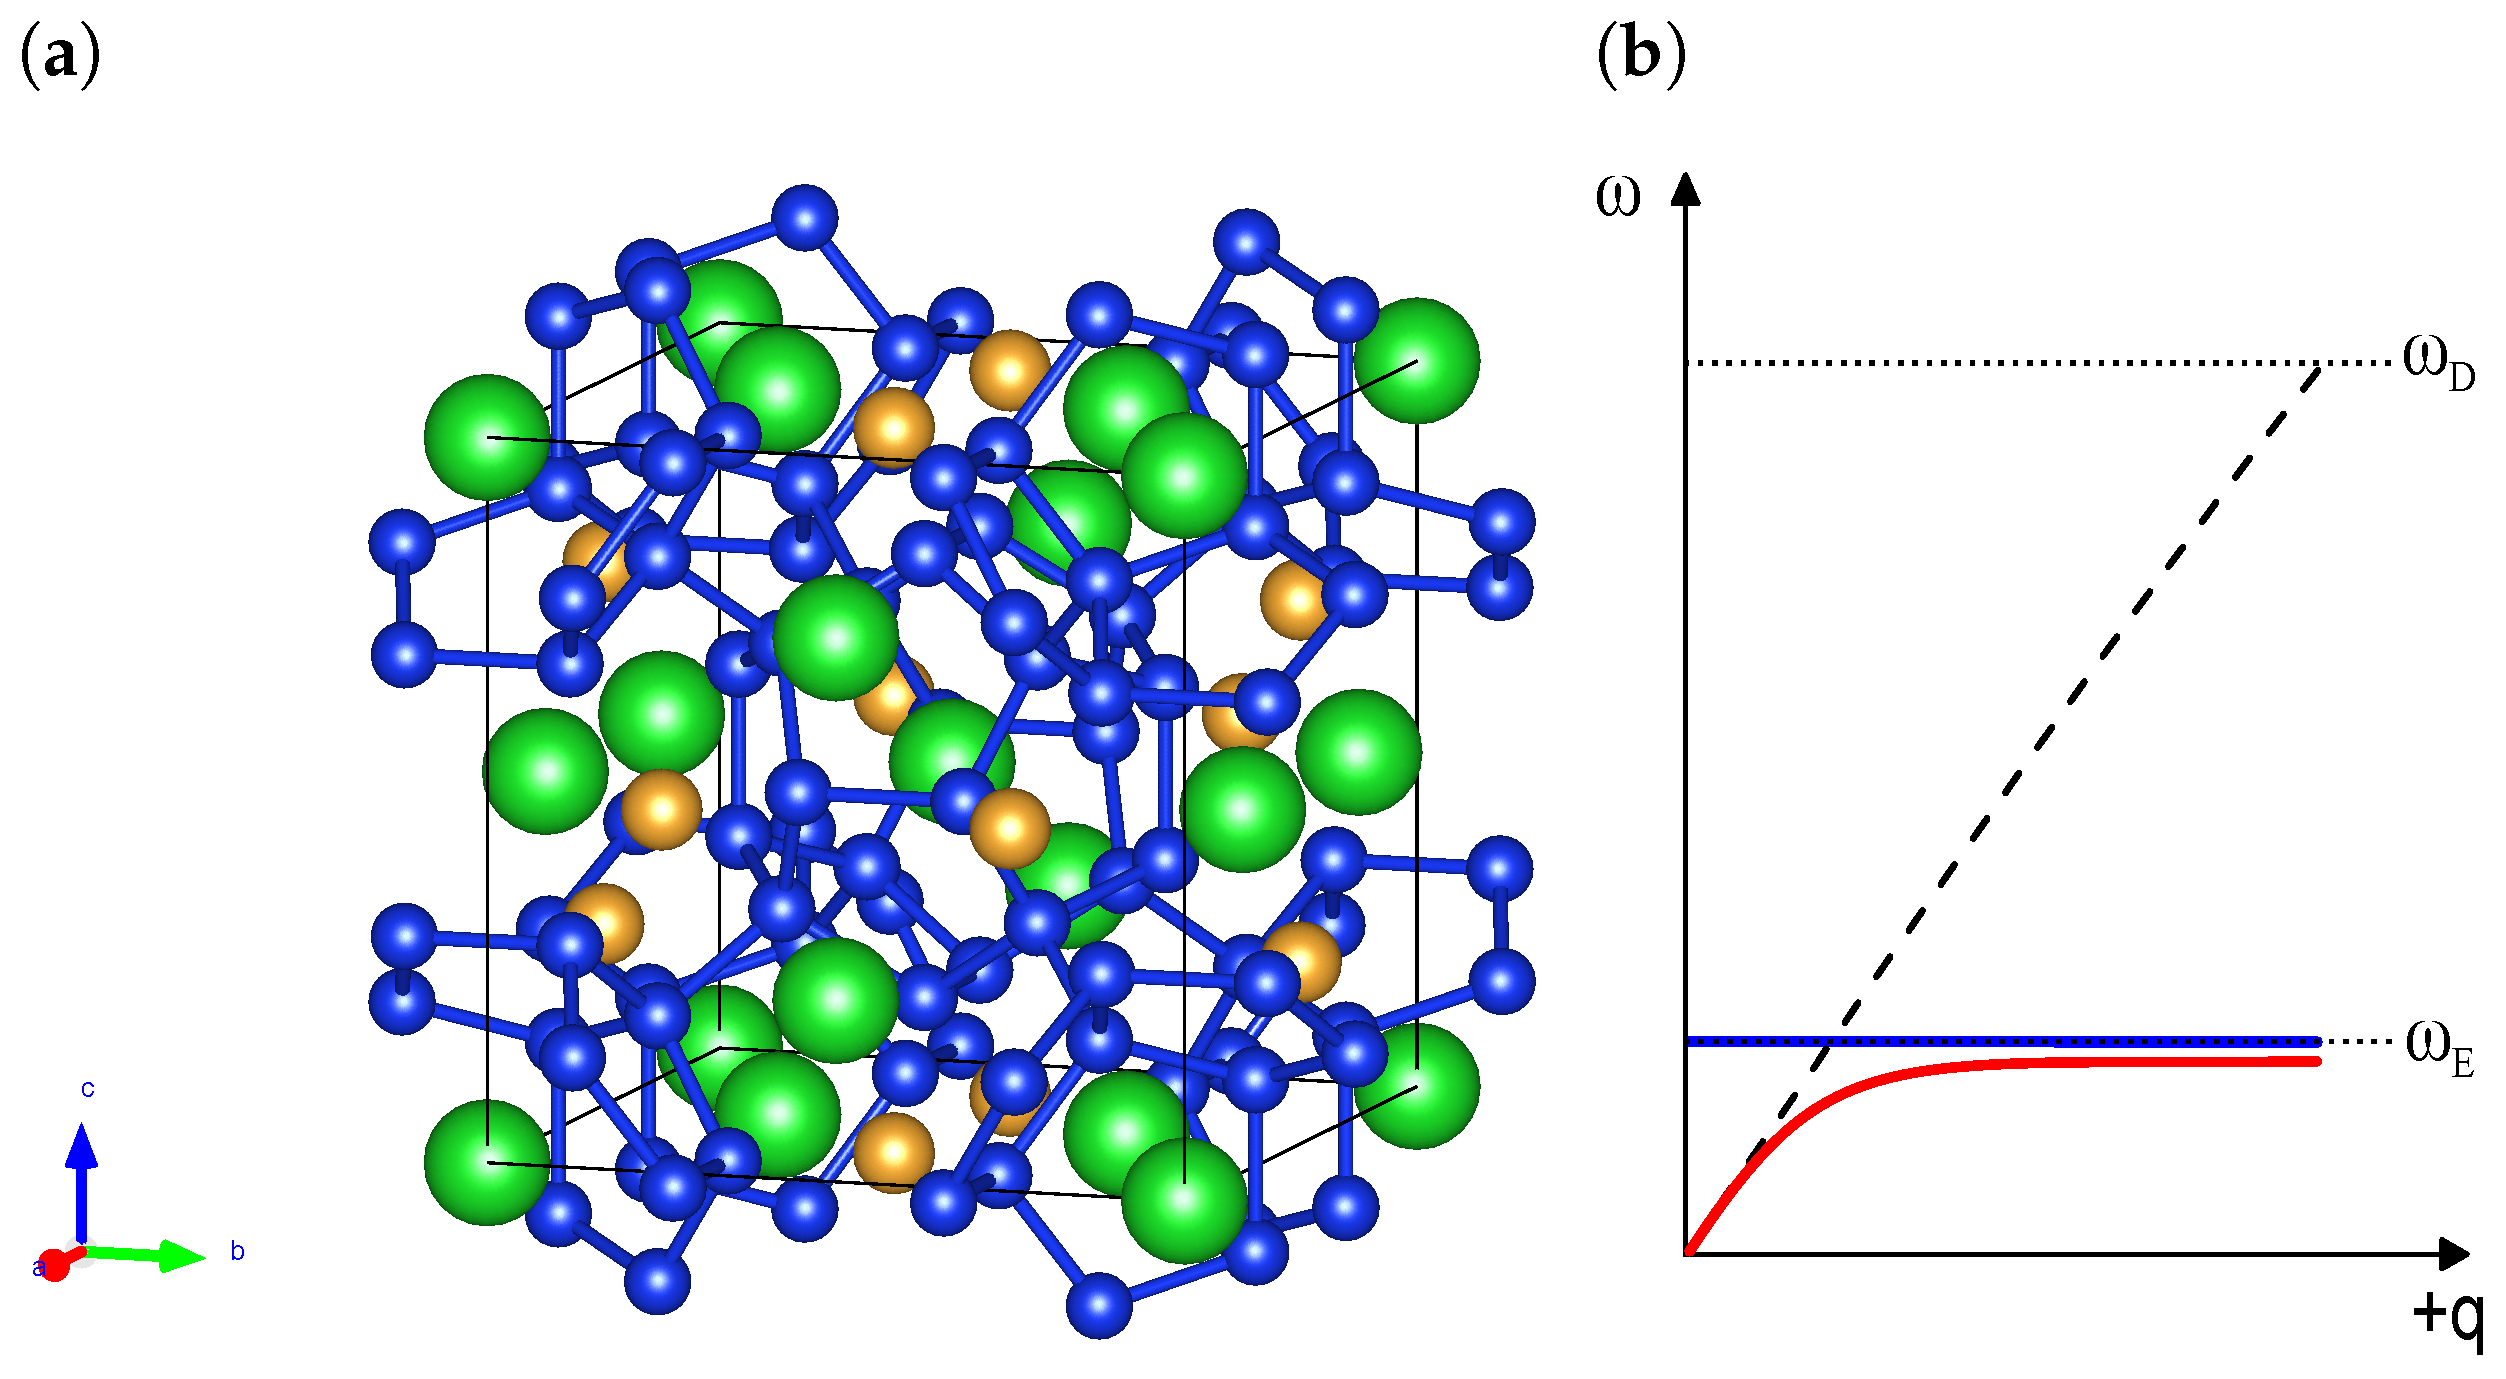
:1. Introduction

2. Materials and Methods
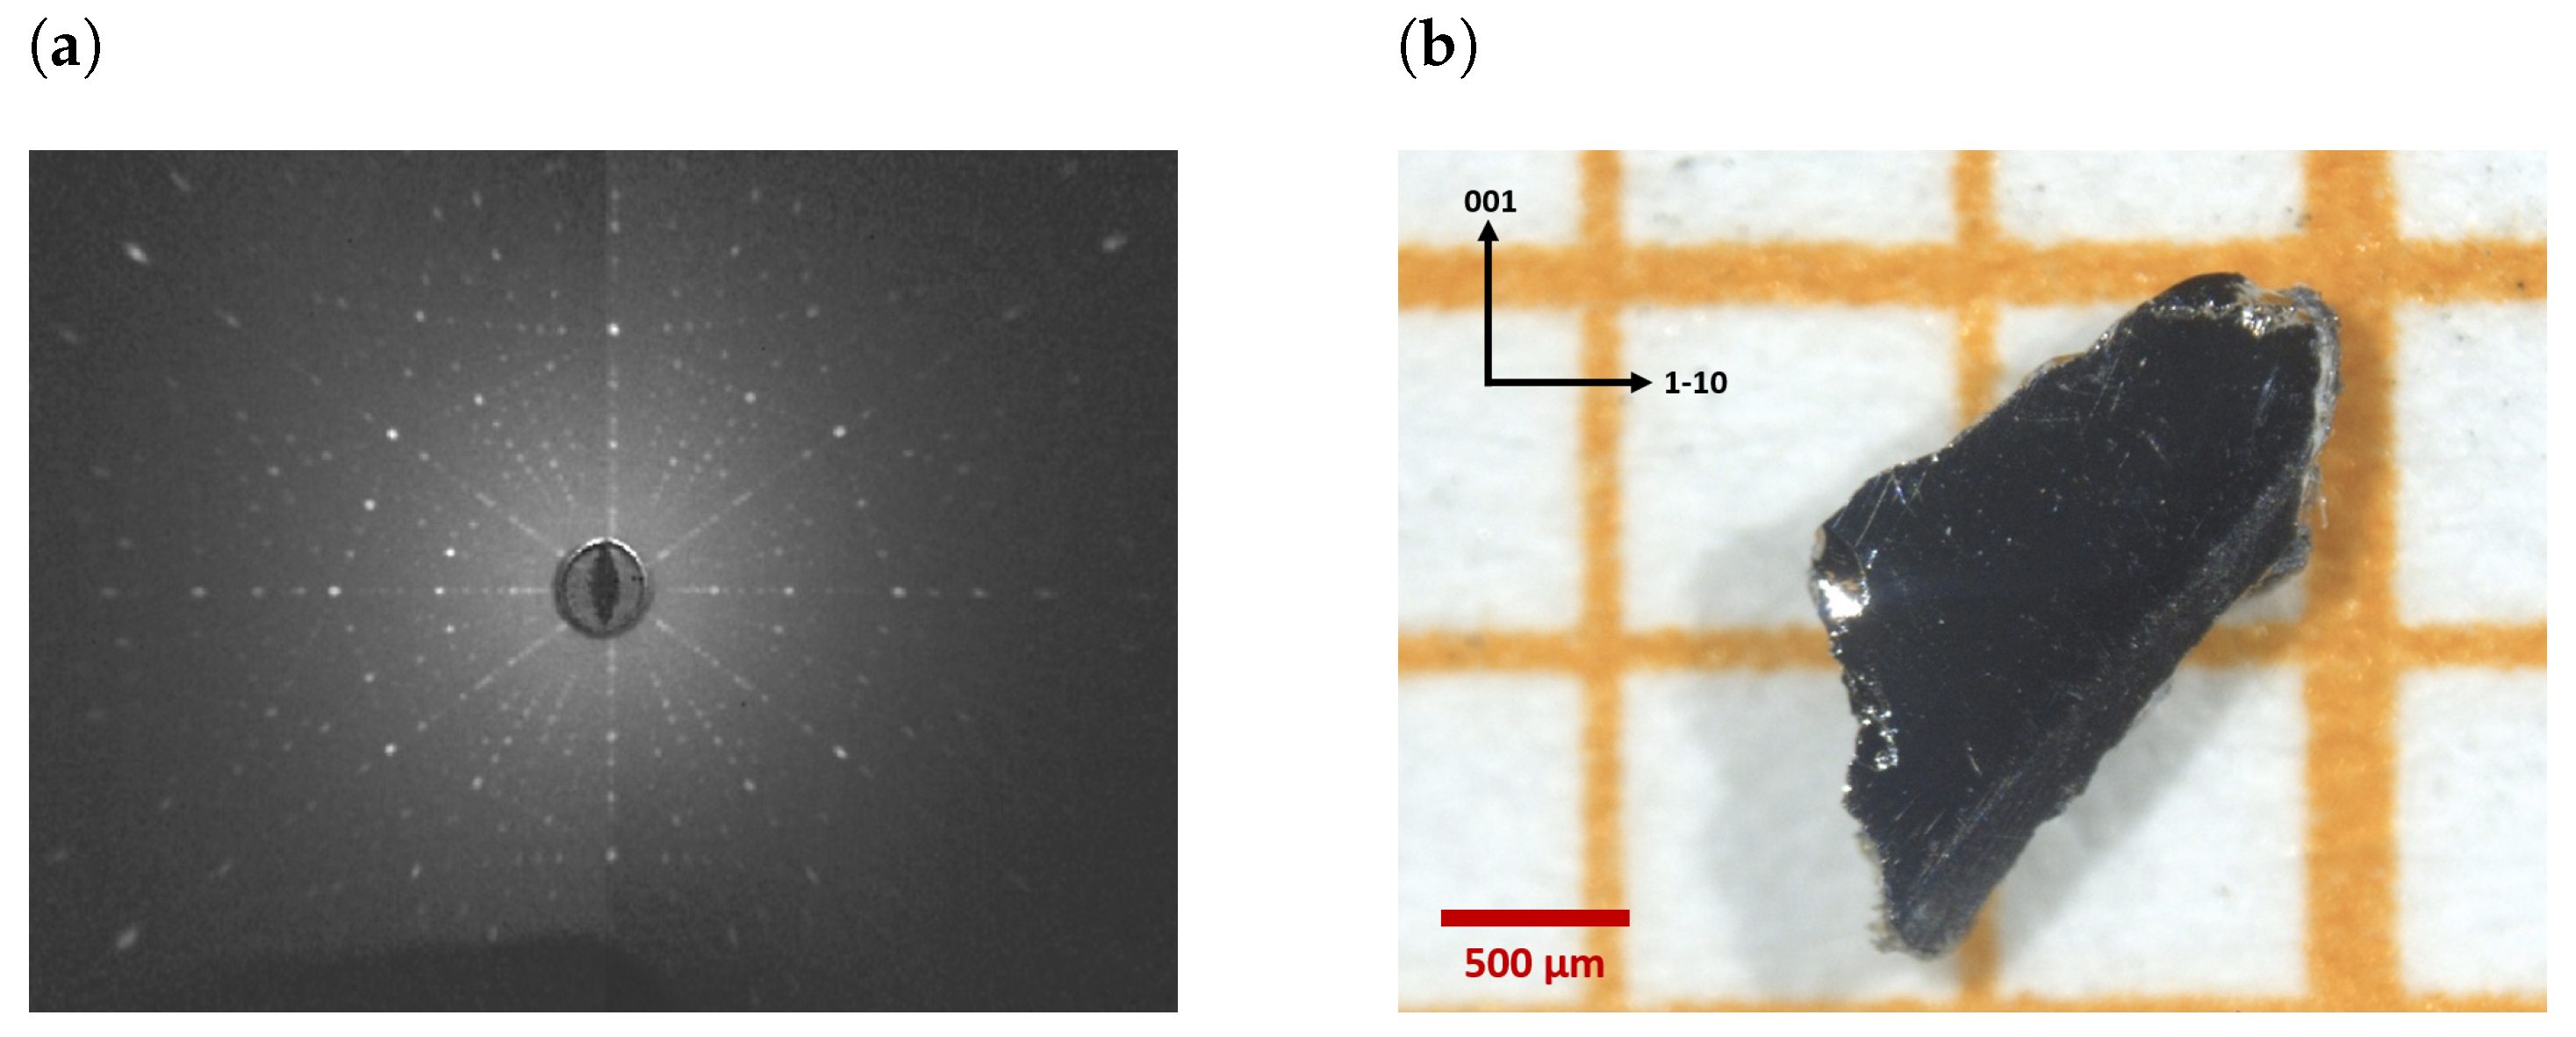
2.1. Samples
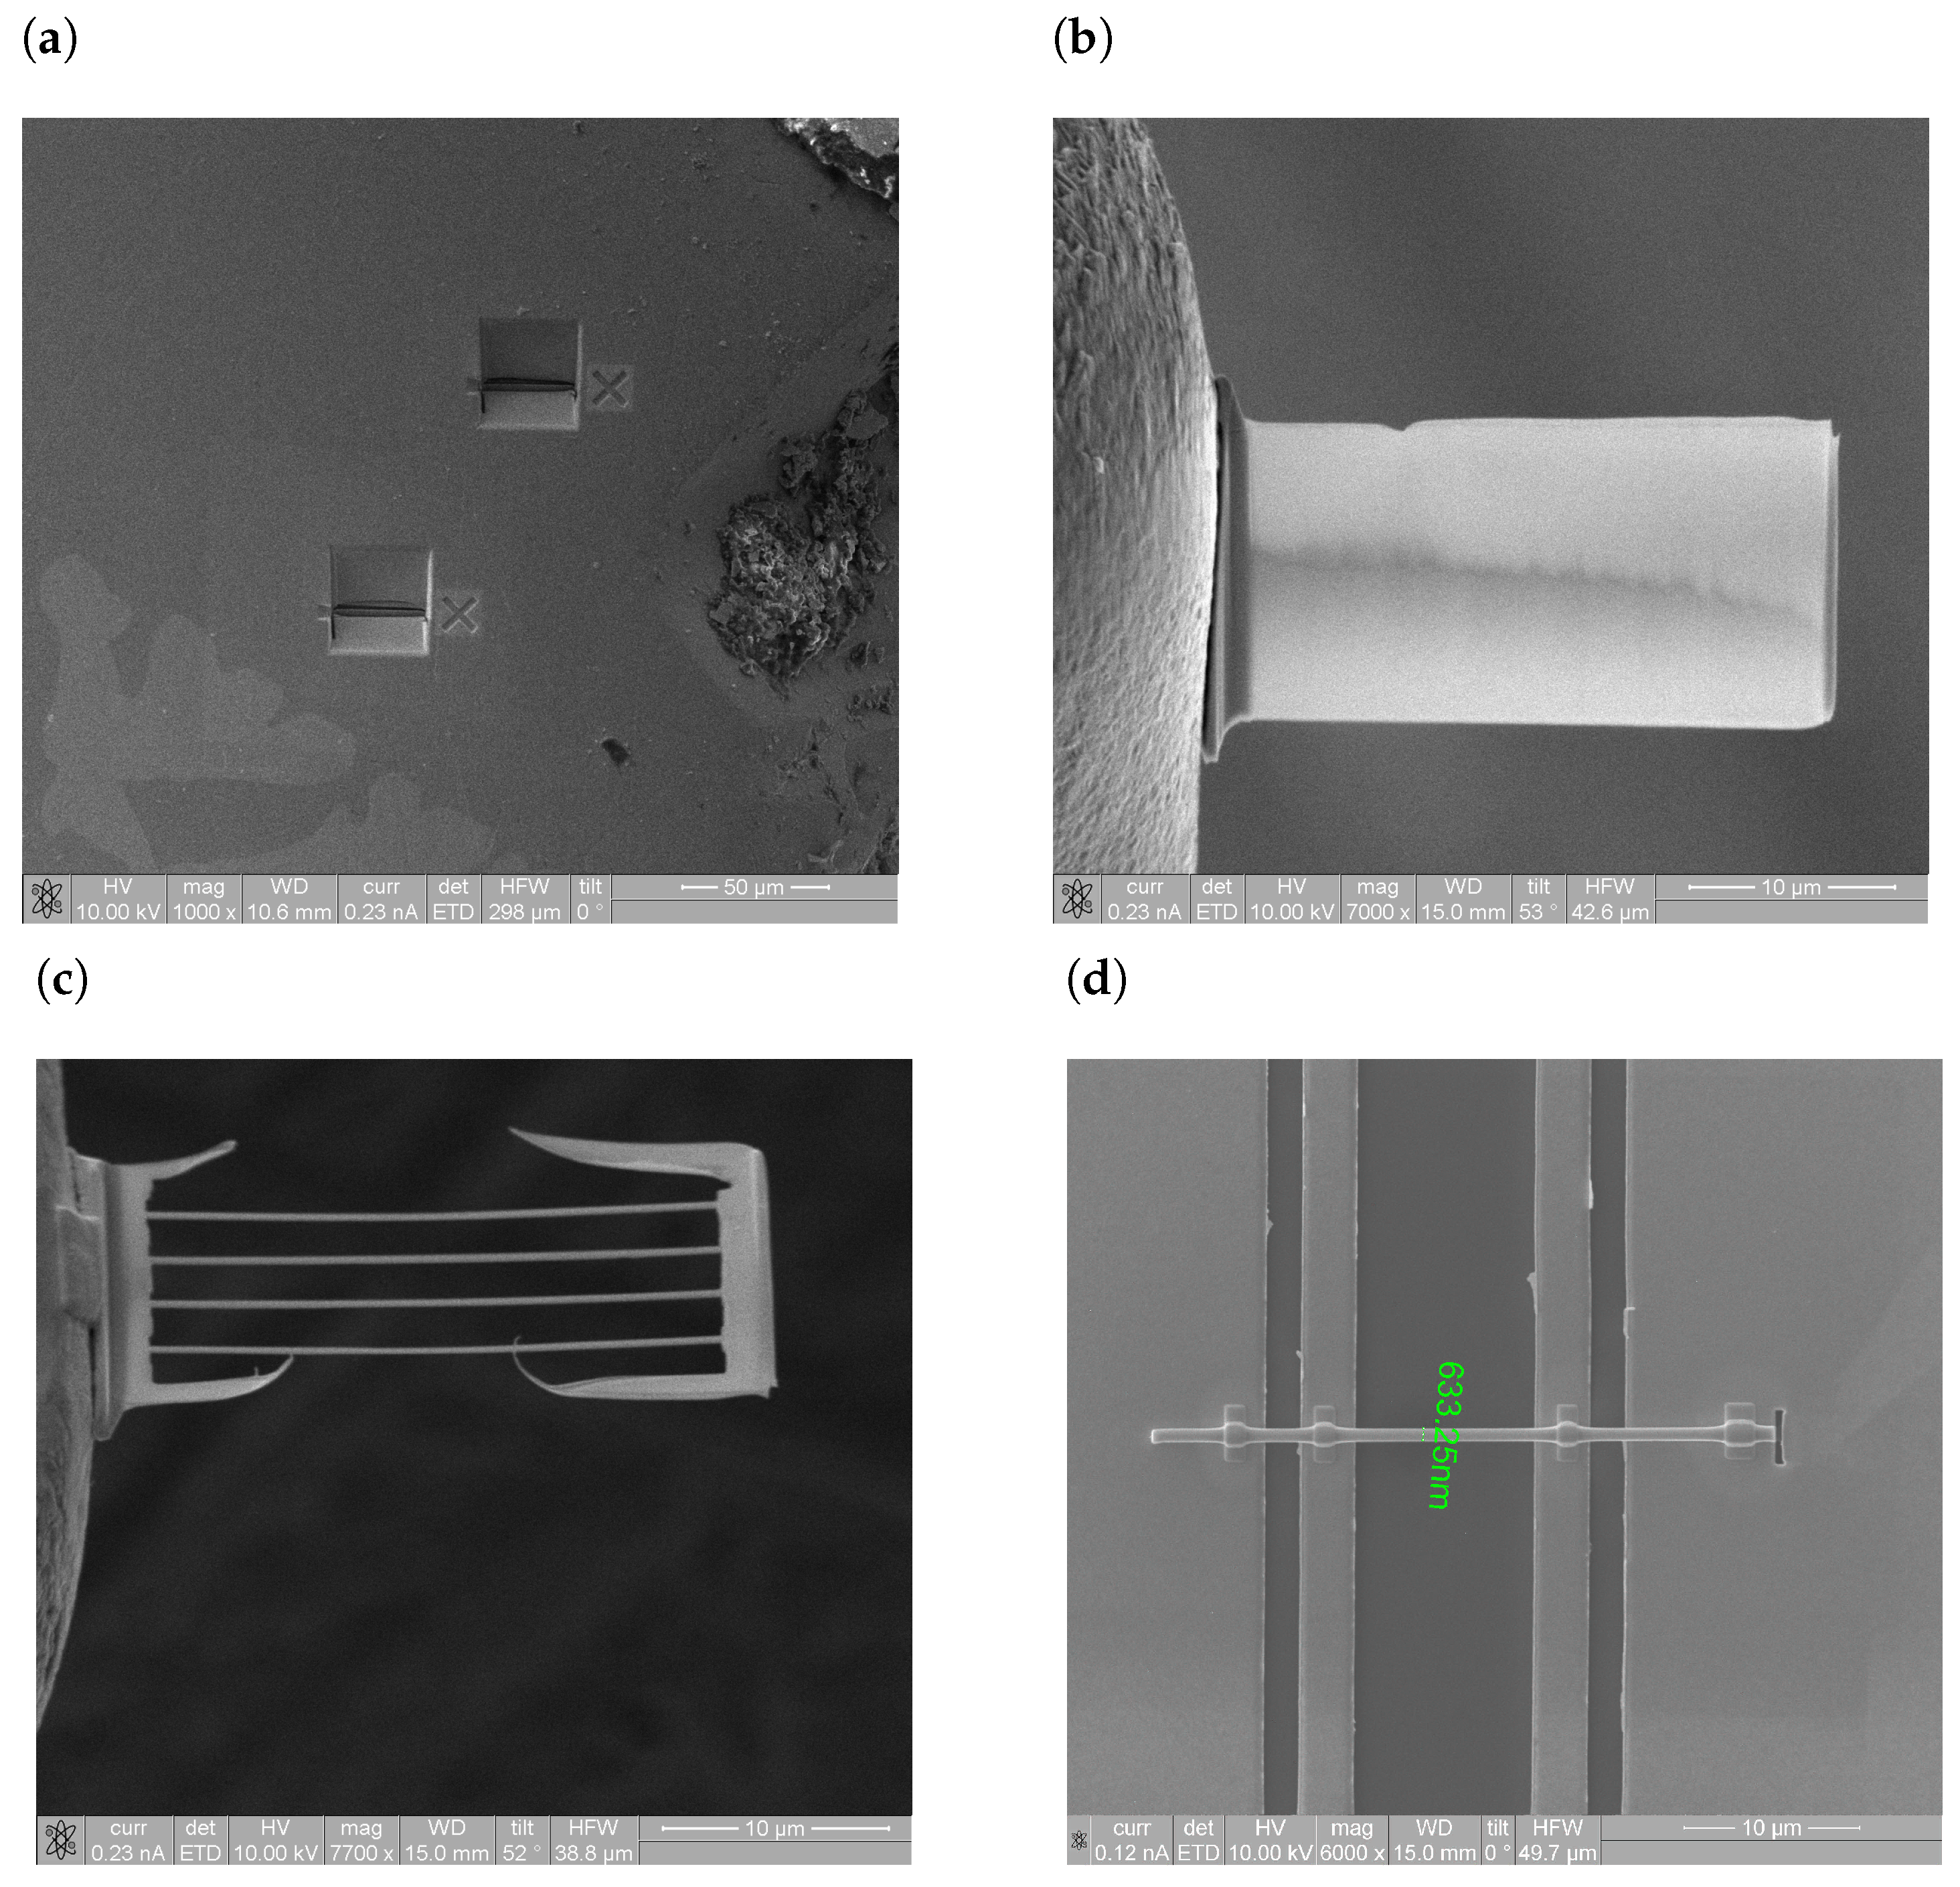
2.2. Nanofabrication Process
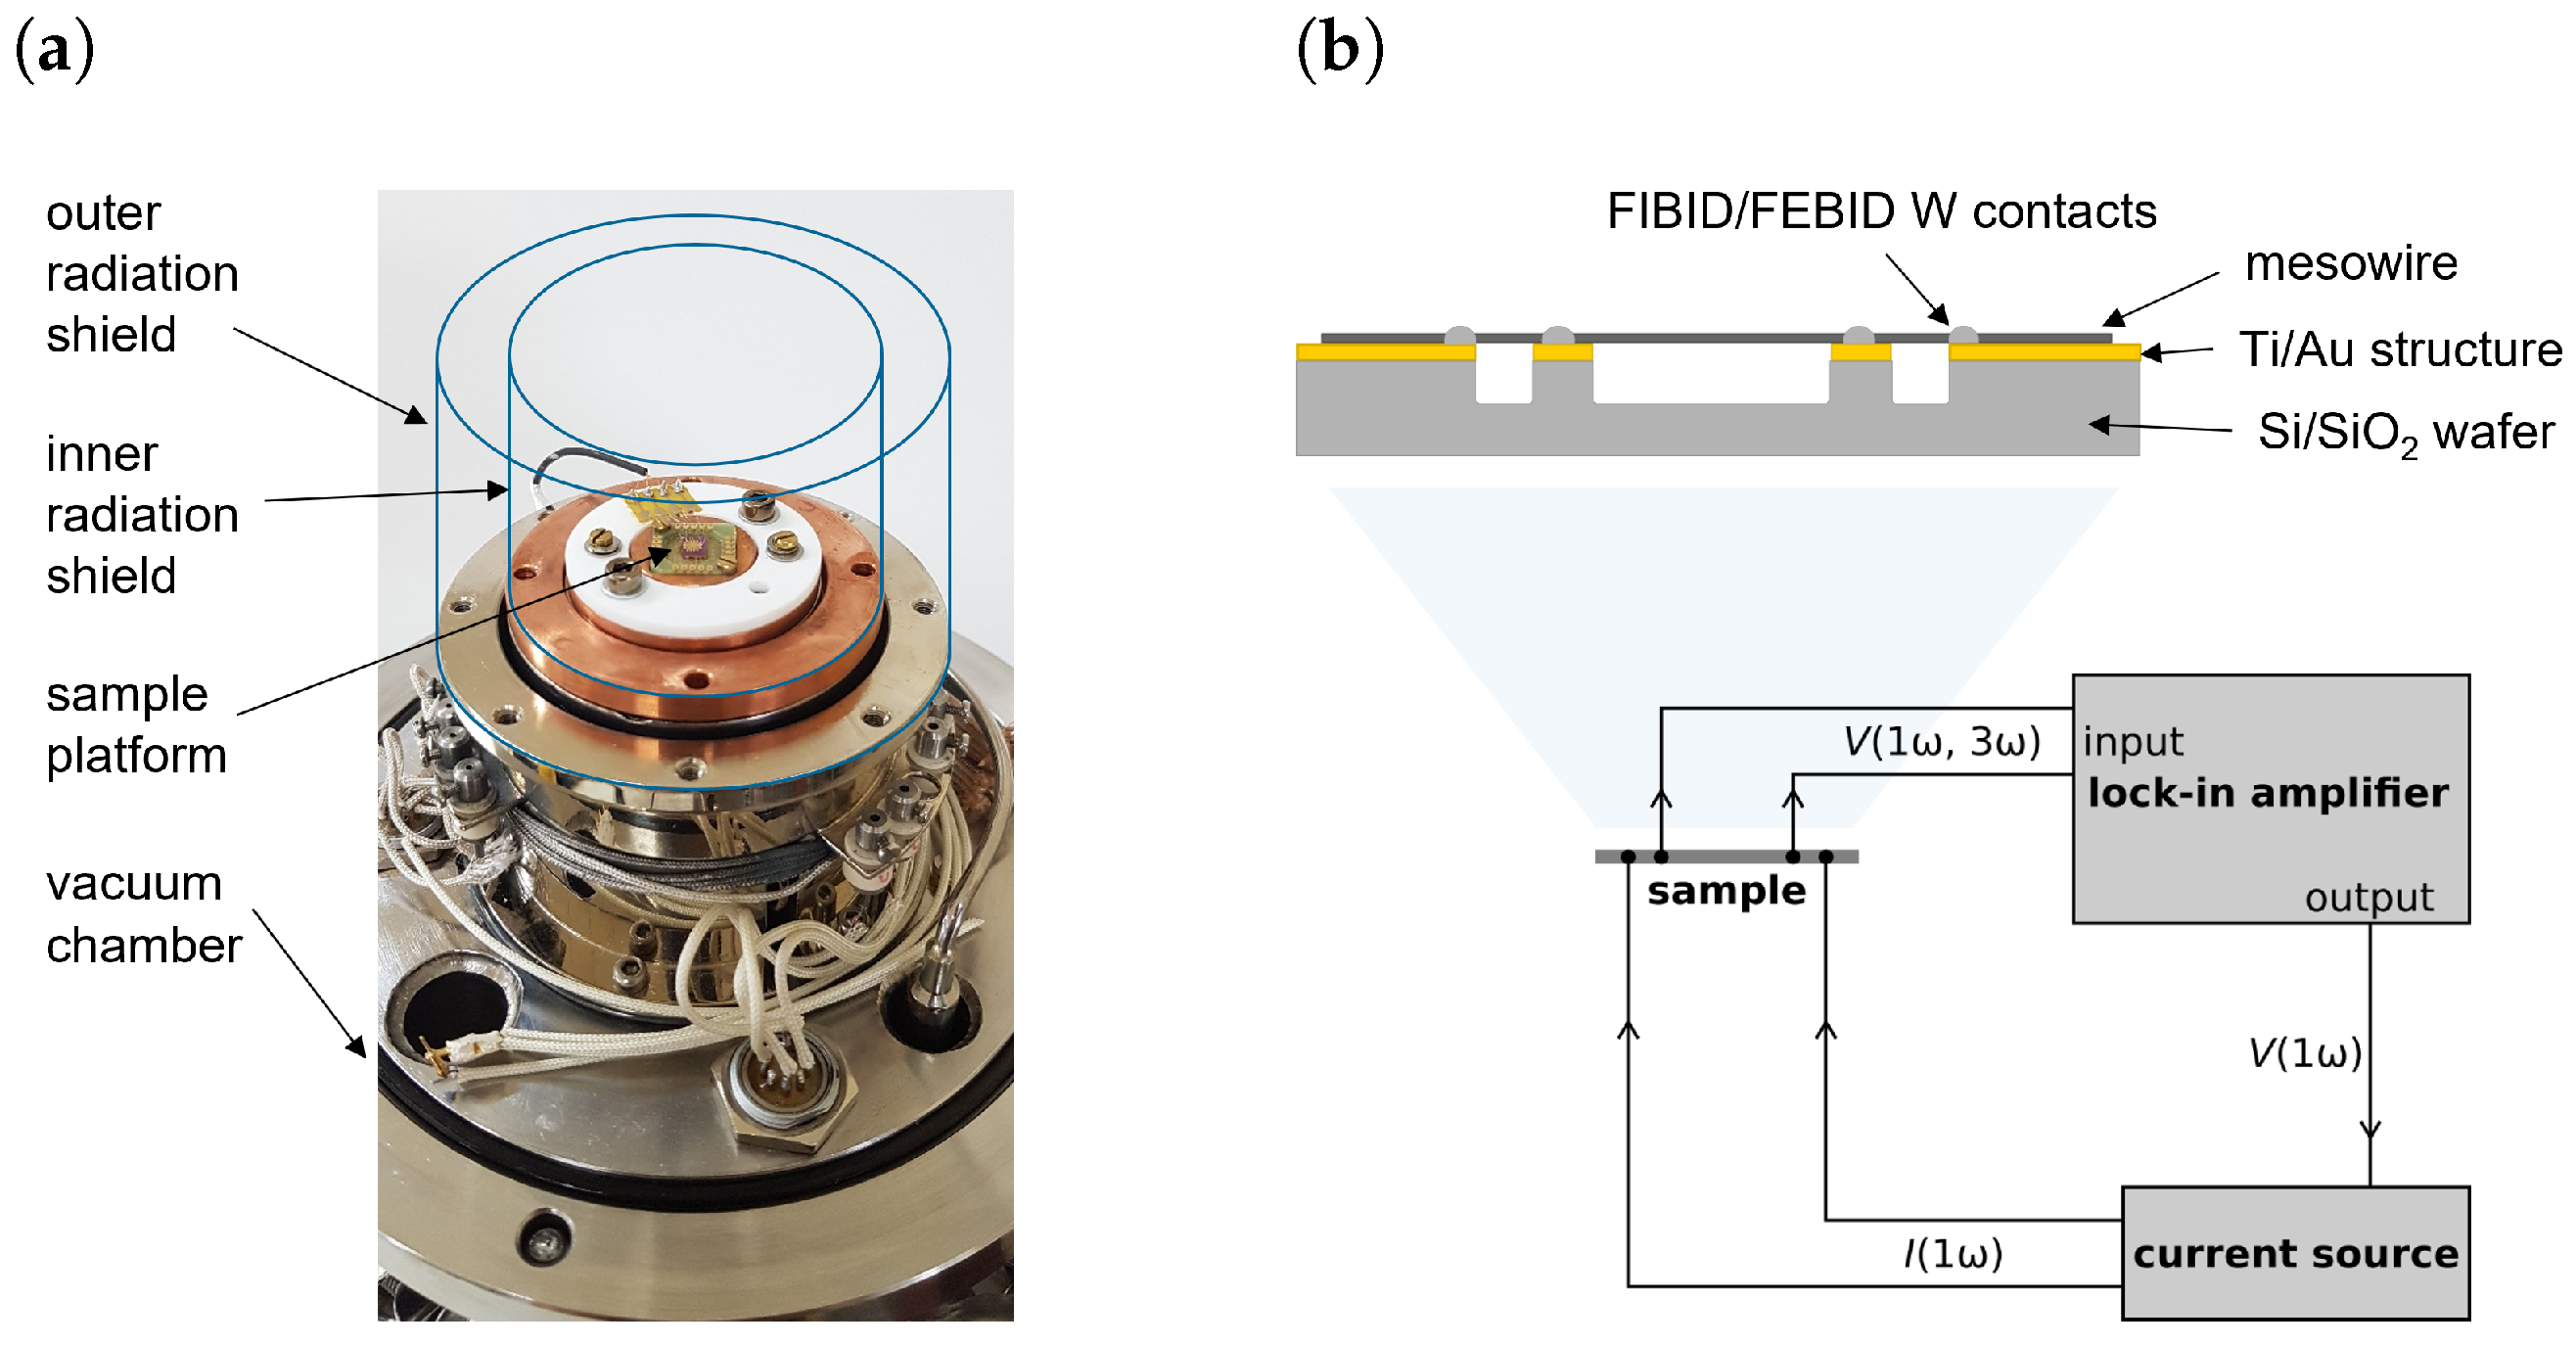
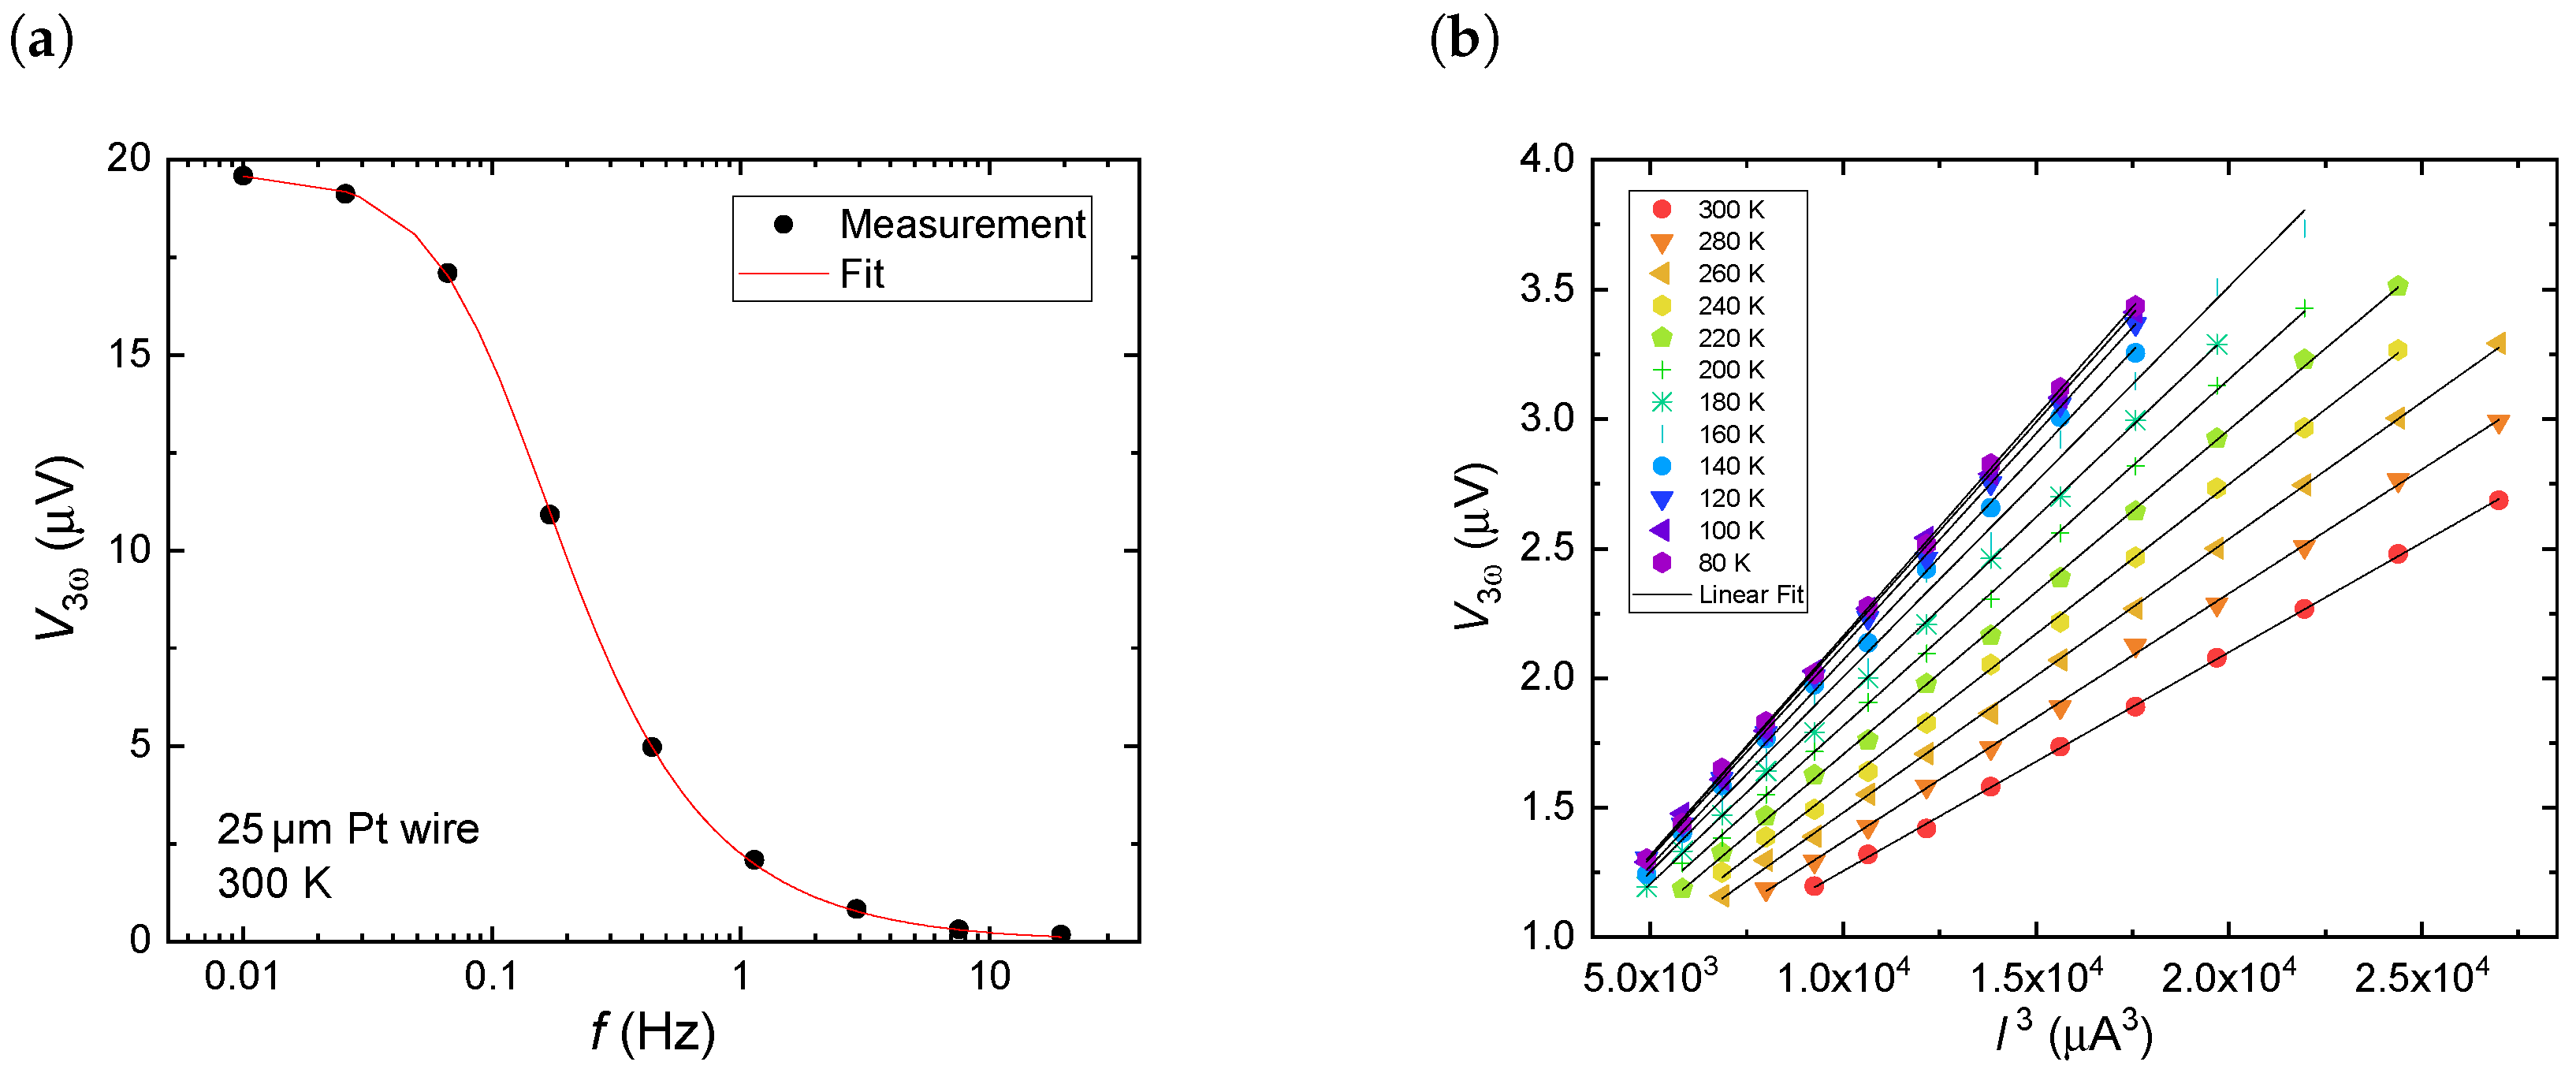
2.3. Measurement Method
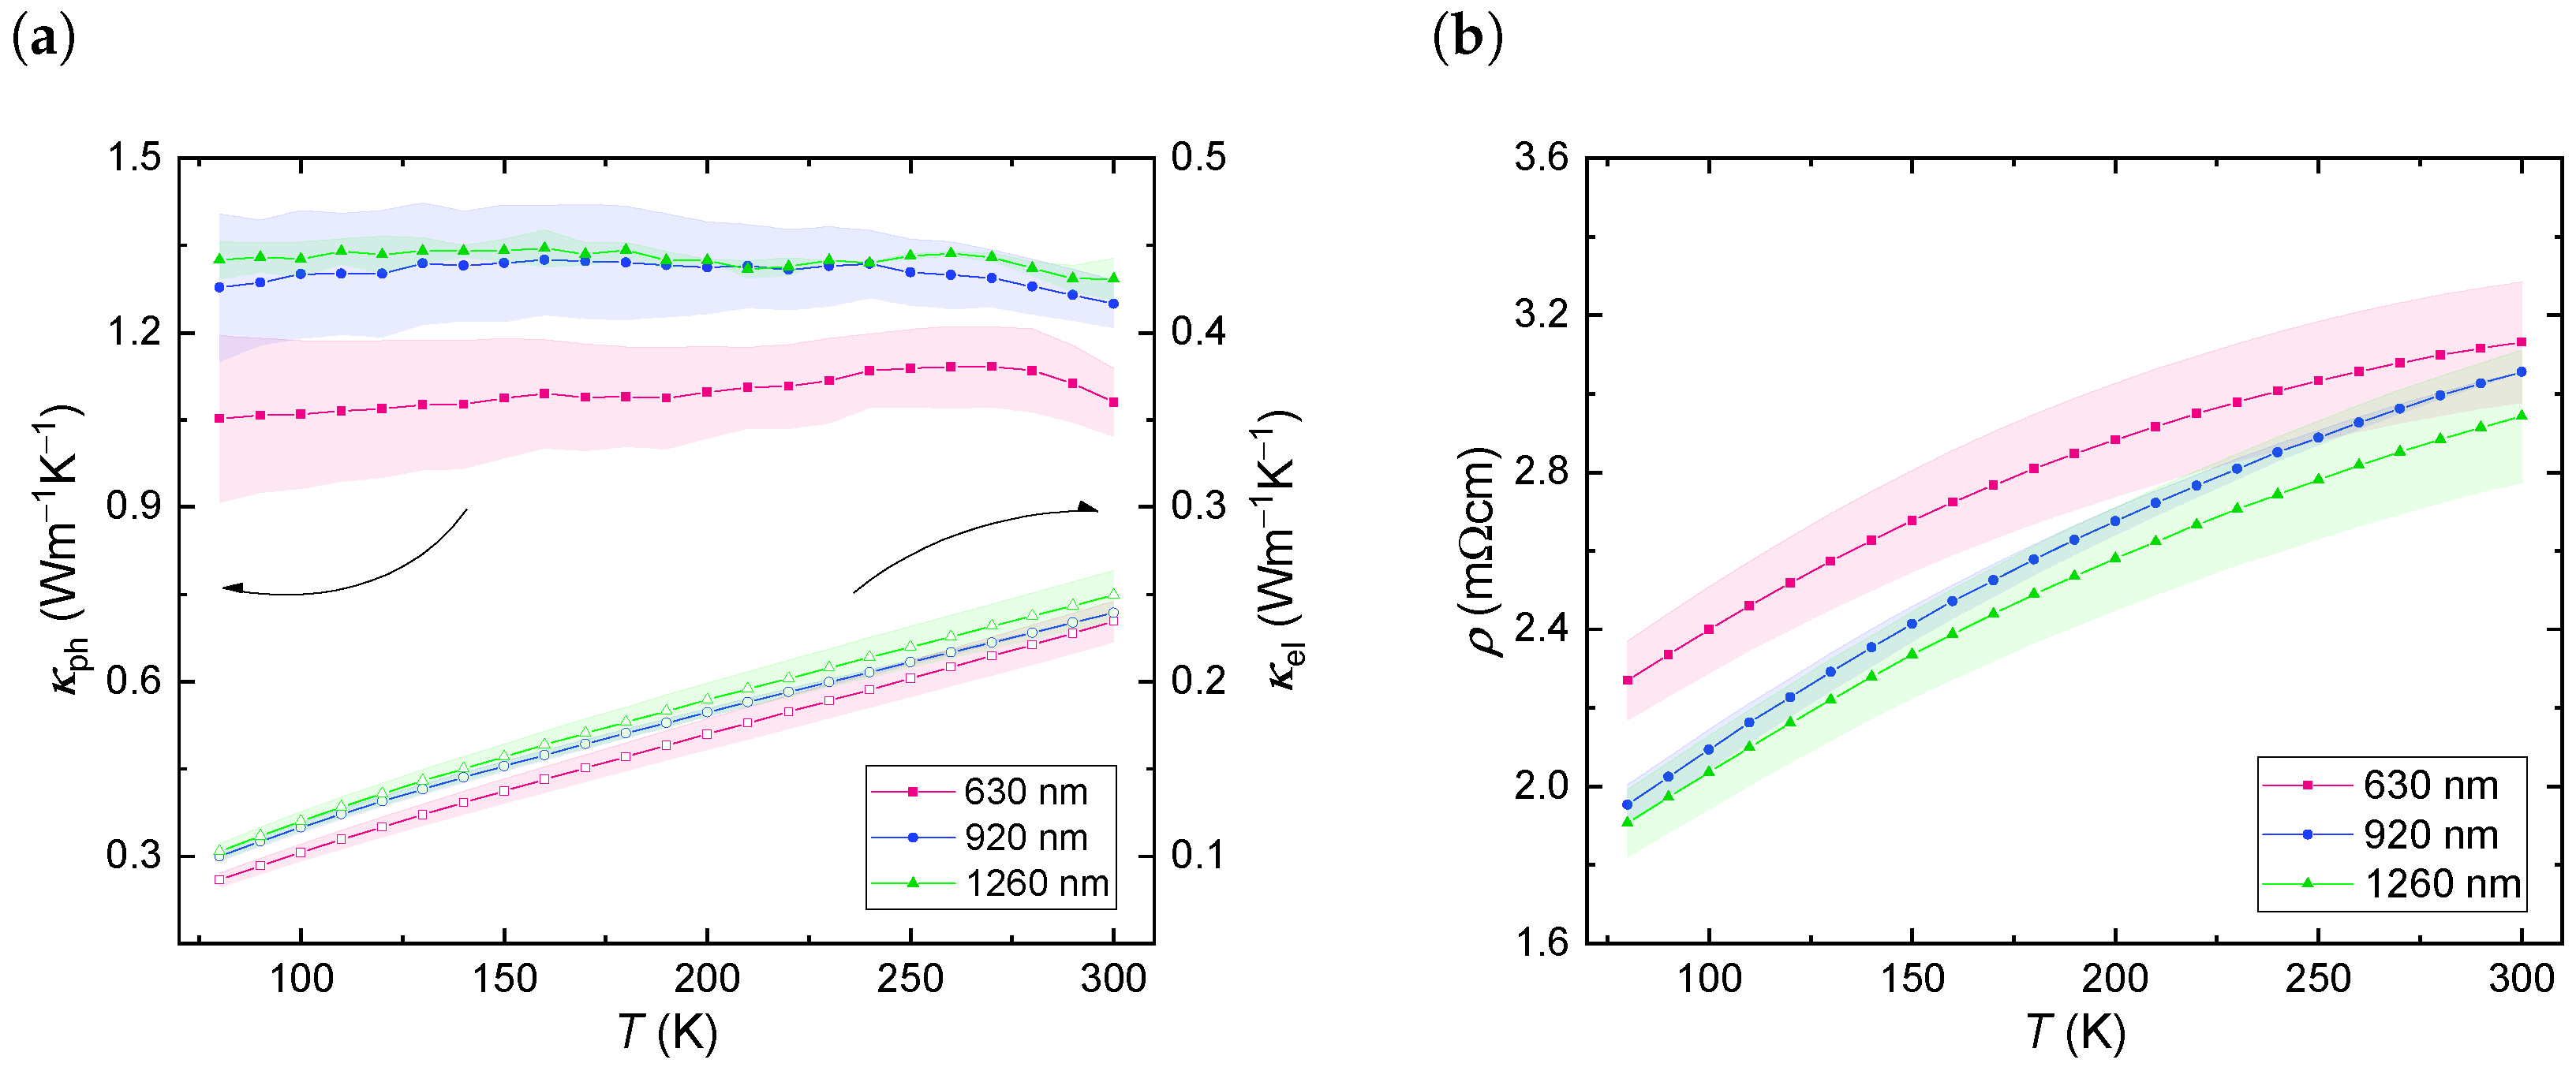
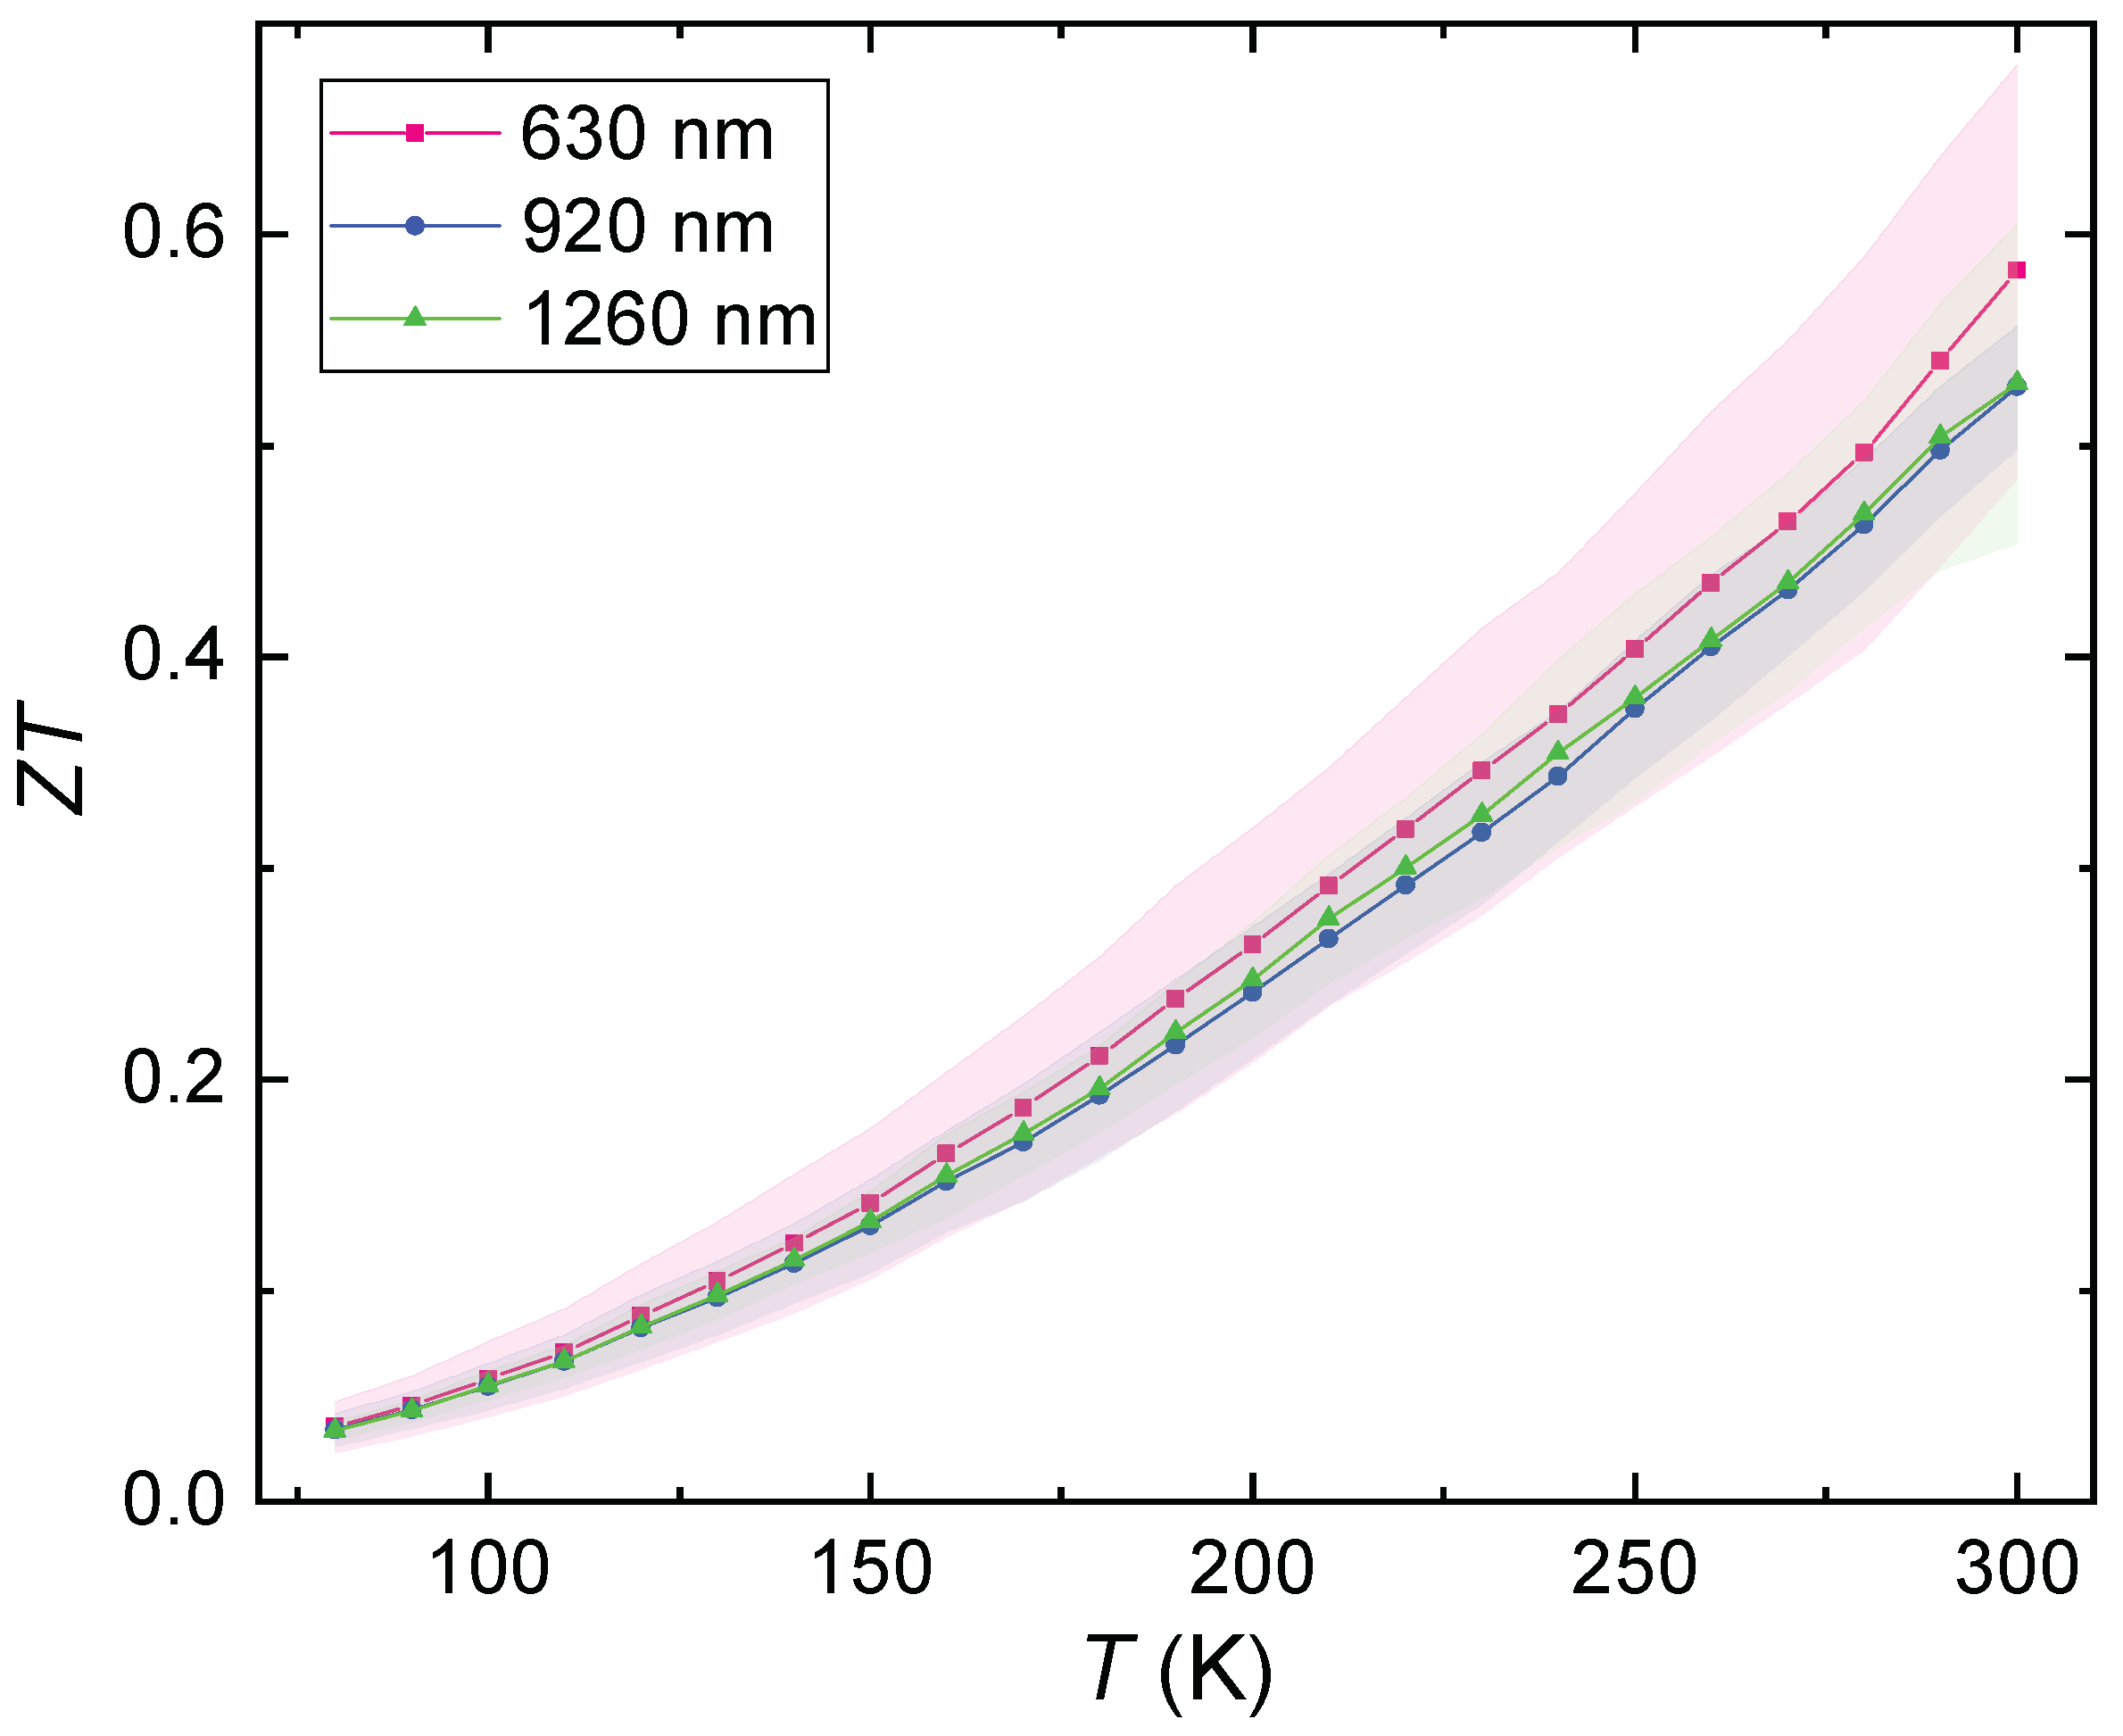
3. Results
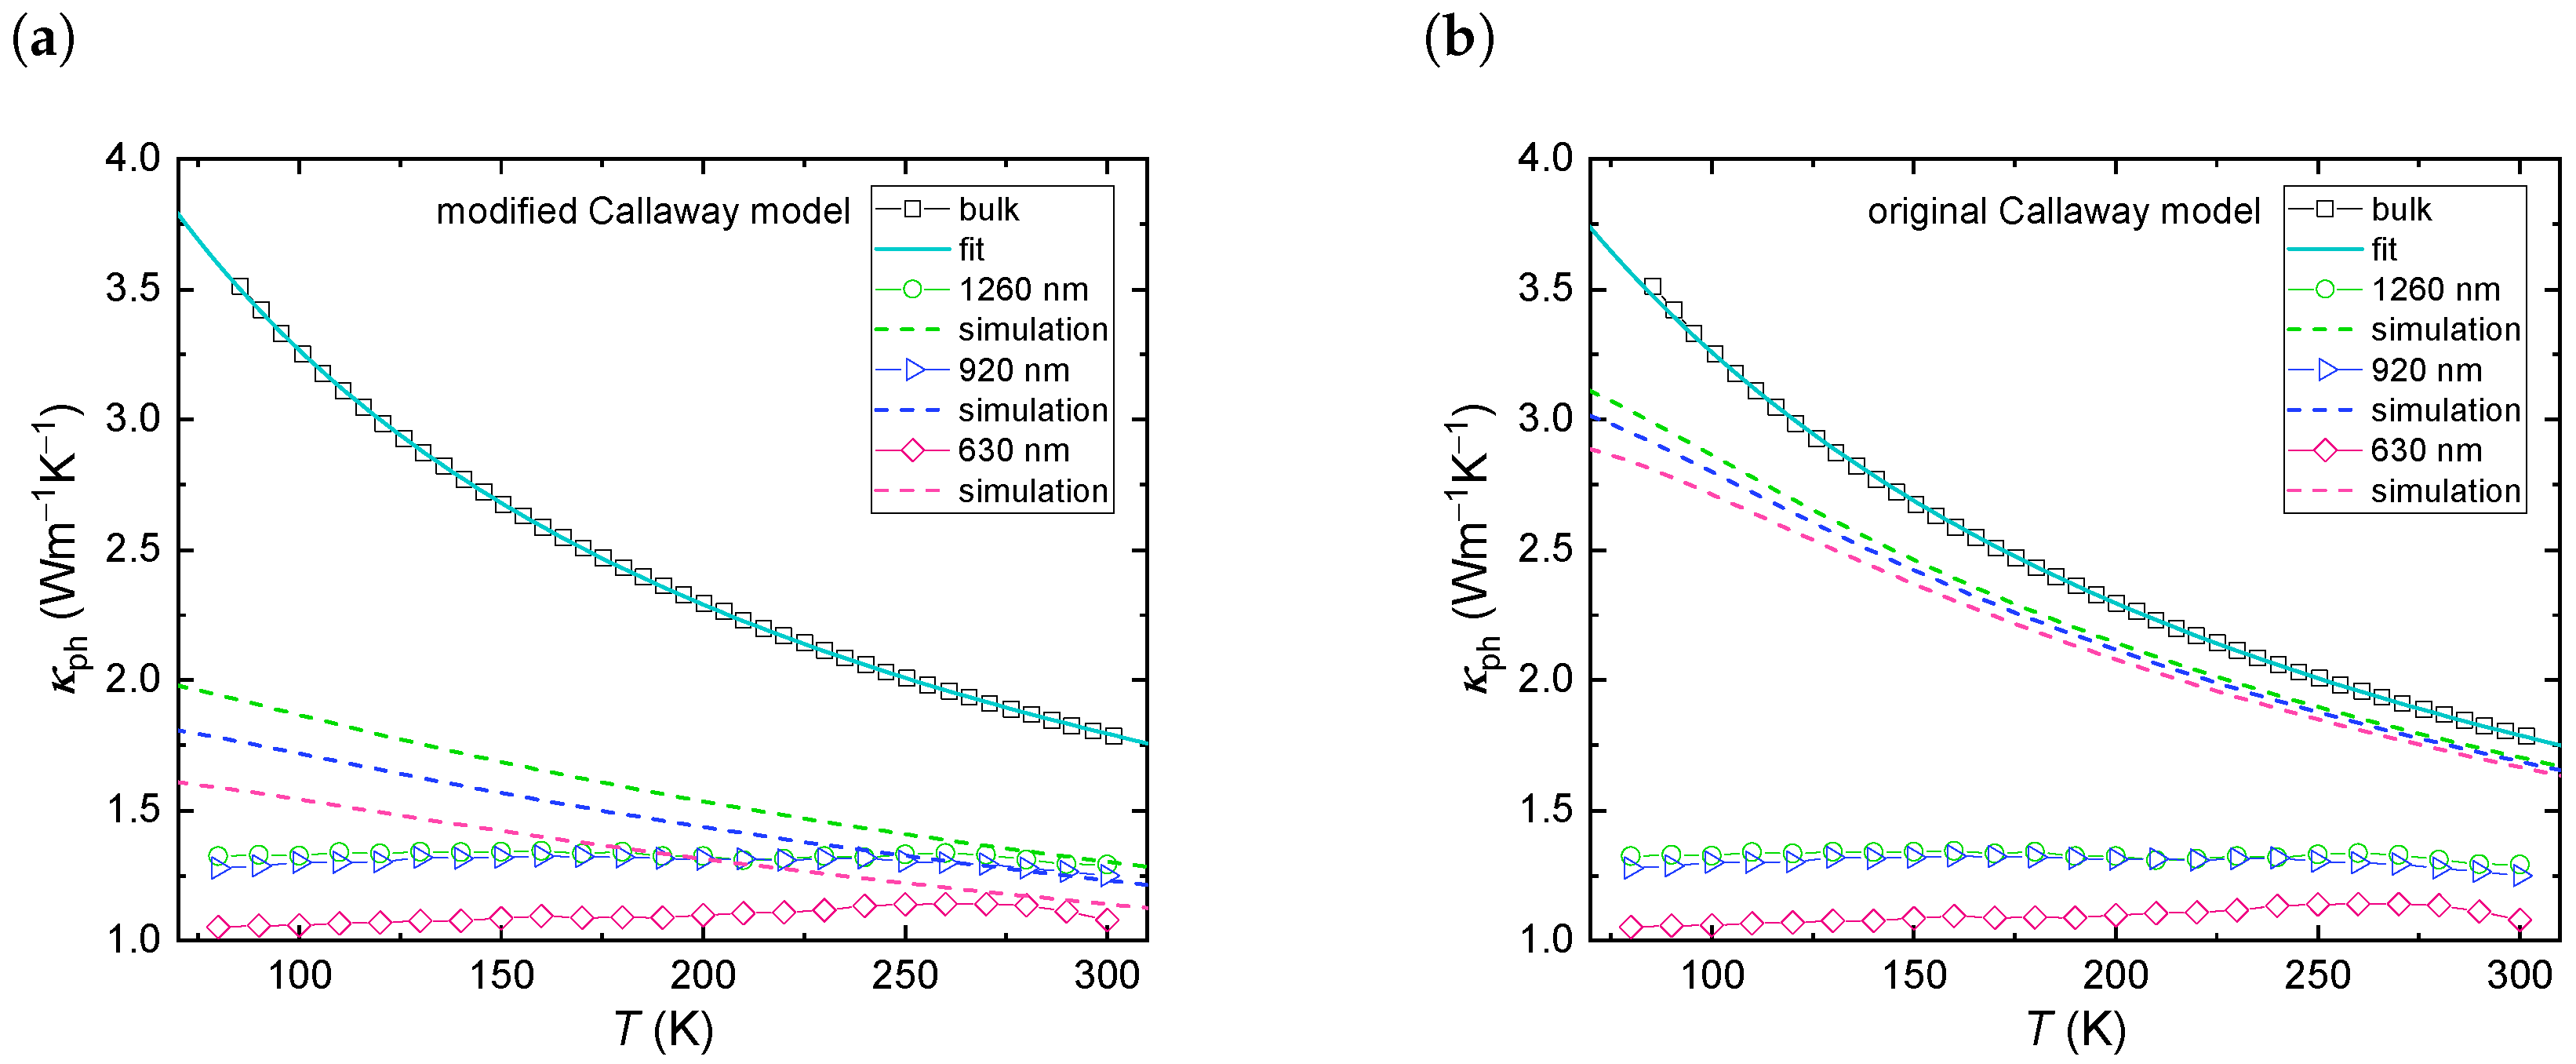
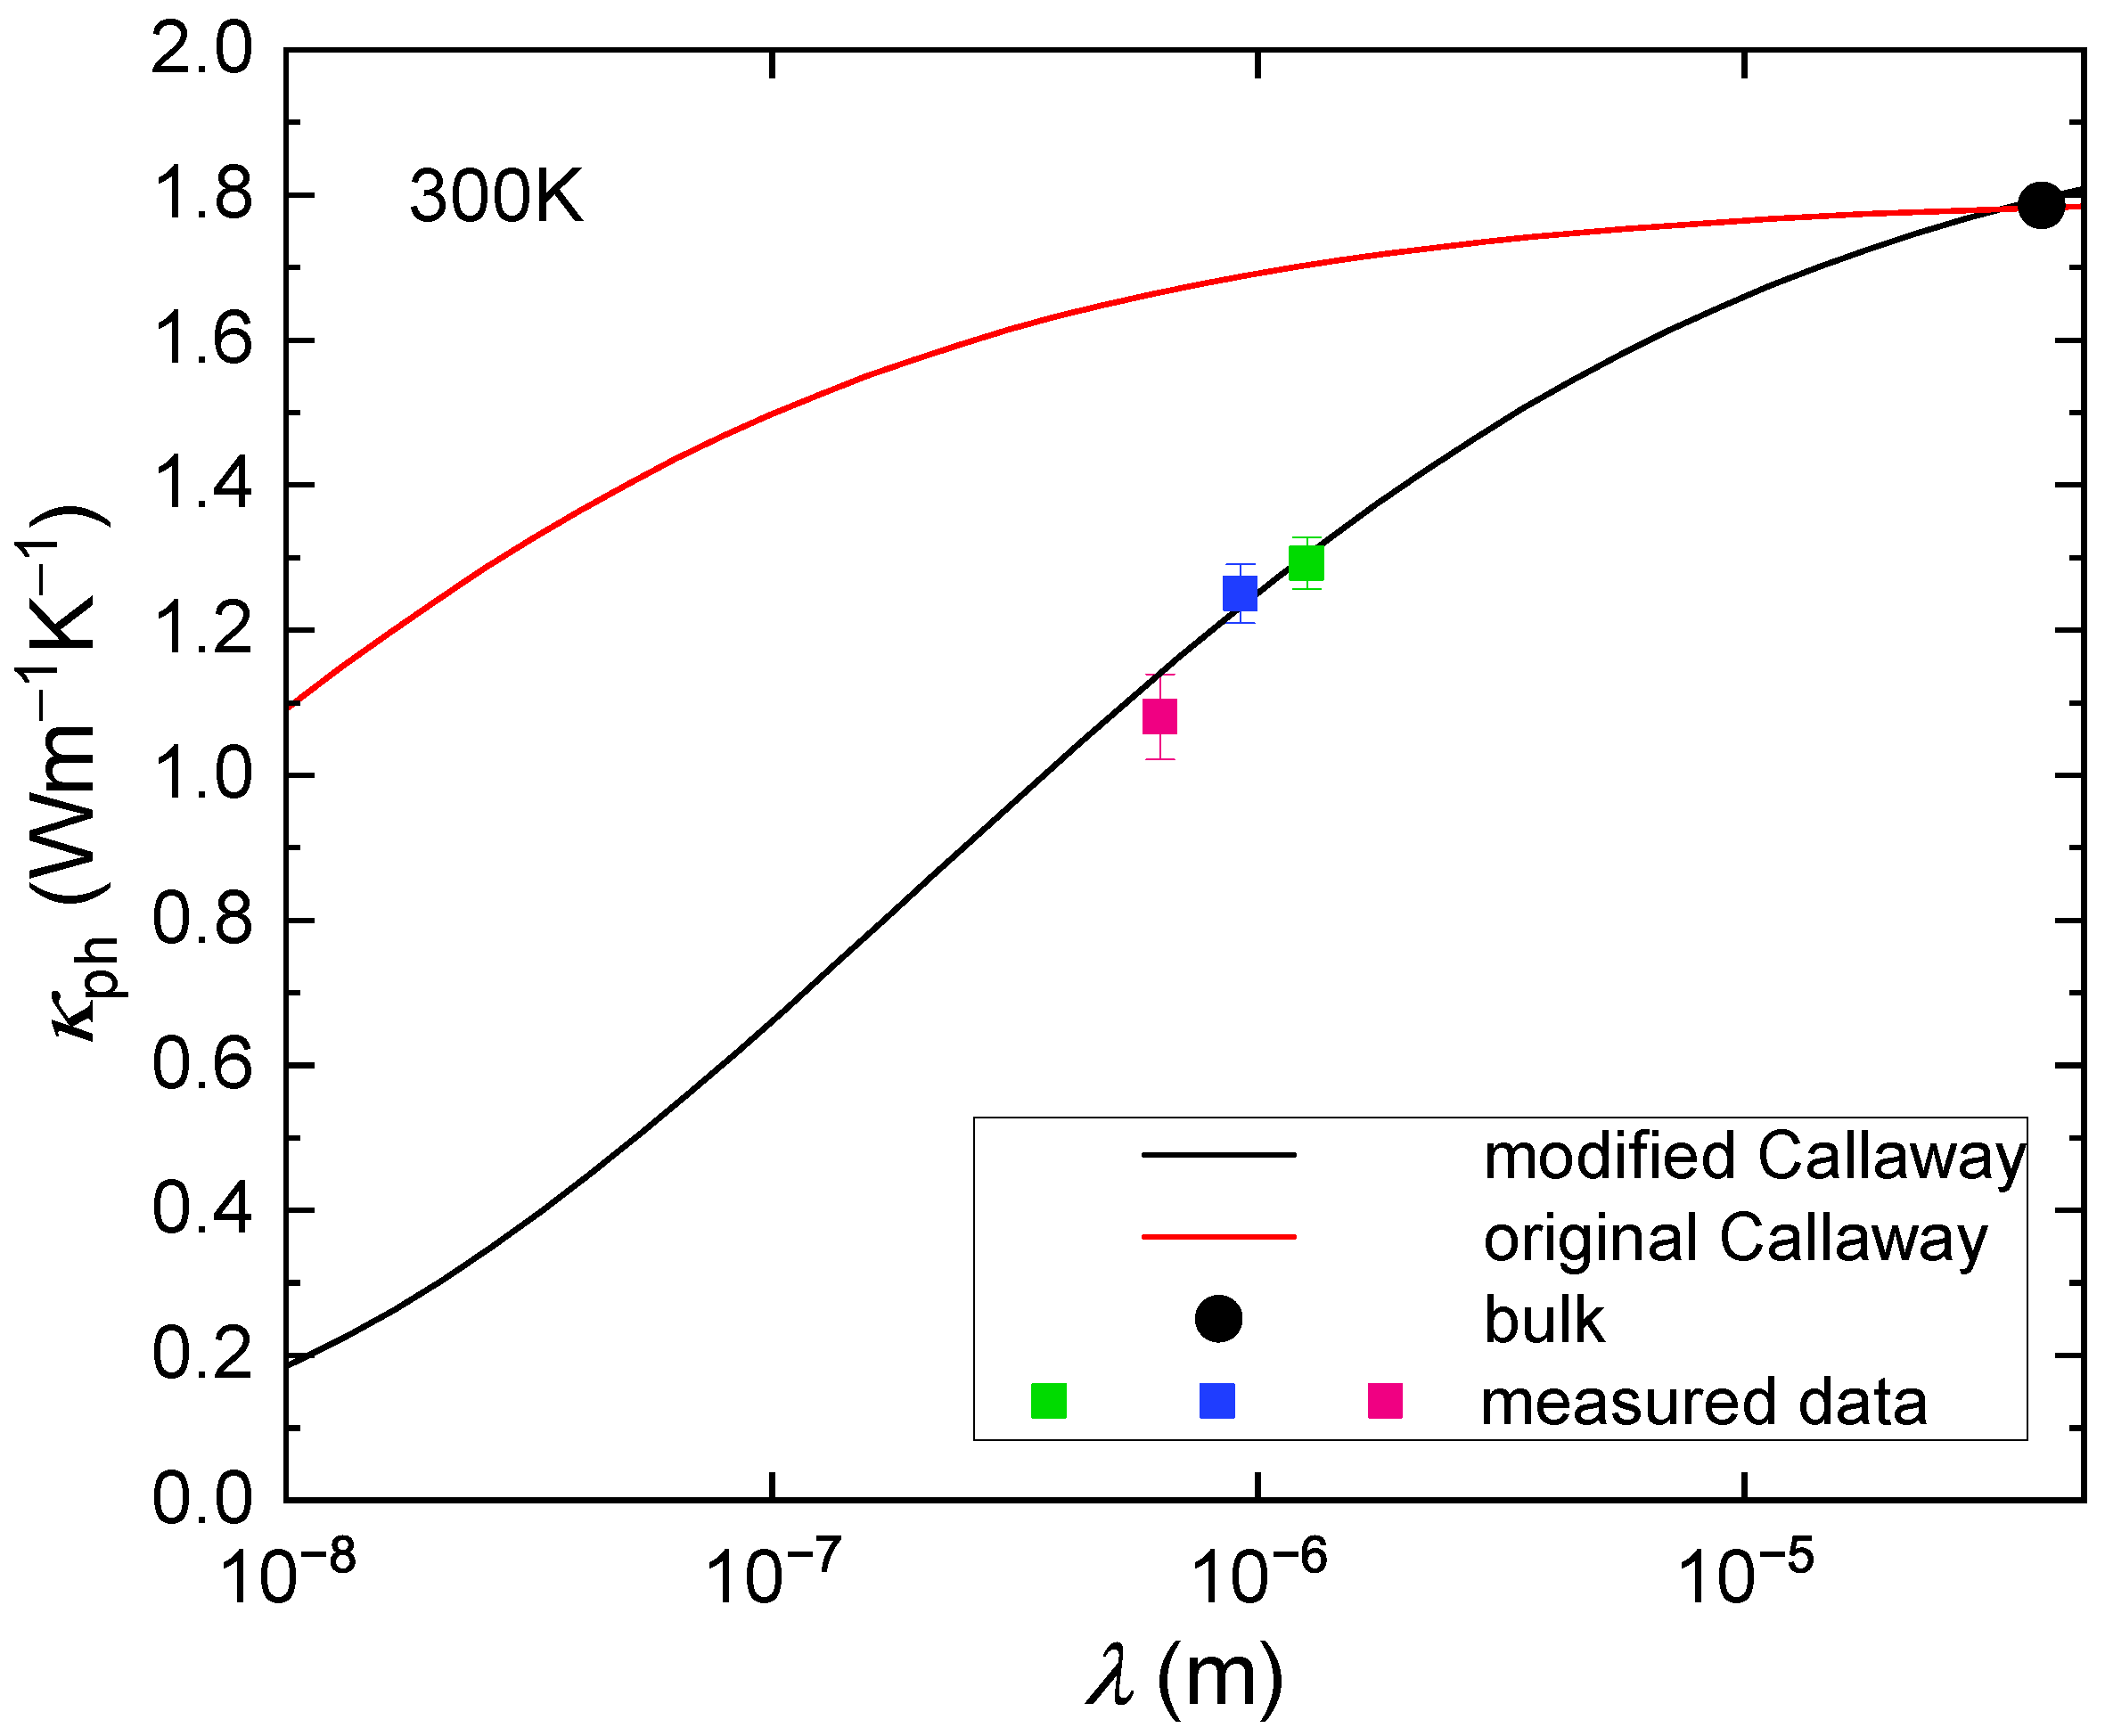
4. Discussion
Author Contributions
Funding
Data Availability Statement
Acknowledgments
Conflicts of Interest
References
- IEA. World Energy Outlook 2022; International Energy Agency: Paris, France, 2022. [Google Scholar]
- Dong, F.; Li, Y.; Gao, Y.; Zhu, J.; Qin, C.; Zhang, X. Energy transition and carbon neutrality: Exploring the nonlinear impact of renewable energy development on carbon emission efficiency in developed countries. Resour. Conserv. Recycl. 2022, 177, 106002. [Google Scholar] [CrossRef]
- Pourkiaei, S.M.; Ahmadi, M.H.; Sadeghzadeh, M.; Moosavi, S.; Pourfayaz, F.; Chen, L.; Pour Yazdi, M.A.; Kumar, R. Thermoelectric cooler and thermoelectric generator devices: A review of present and potential applications, modeling and materials. Energy 2019, 186, 115849. [Google Scholar] [CrossRef]
- Snyder, G.J.; Toberer, E.S. Complex thermoelectric materials. Nat. Mater. 2008, 7, 105–114. [Google Scholar] [CrossRef] [PubMed]
- Nolas, G.S.; Slack, G.A.; Schujman, S.B. Semiconductor clathrates: A phonon glass electron crystal material with potential for thermoelectric applications. Semiconduct. Semimet. 2001, 69, 255. [Google Scholar] [CrossRef]
- Paschen, S.; Carrillo-Cabrera, W.; Bentien, A.; Tran, V.H.; Baenitz, M.; Grin, Y.; Steglich, F. Structural, transport, magnetic, and thermal properties of Eu8Ga16Ge30. Phys. Rev. B 2001, 64, 214404. [Google Scholar] [CrossRef]
- Paschen, S.; Pacheco, V.; Bentien, A.; Sanchez, A.; Carrillo-Cabrera, W.; Baenitz, M.; Iversen, B.B.; Grin, Y.; Steglich, F. Are type-I clathrates Zintl phases and ‘phonon glasses and electron single crystals’? Phys. B Condens. Matter 2003, 328, 39. [Google Scholar] [CrossRef]
- Bentien, A.; Christensen, M.; Bryan, J.D.; Sanchez, A.; Paschen, S.; Steglich, F.; Stucky, G.D.; Iversen, B.B. Thermal conductivity of thermoelectric clathrates. Phys. Rev. B 2004, 69, 045107. [Google Scholar] [CrossRef]
- Takabatake, T.; Suekuni, K.; Nakayama, T.; Kaneshita, E. Phonon-glass electron-crystal thermoelectric clathrates: Experiments and theory. Rev. Mod. Phys. 2014, 86, 669. [Google Scholar] [CrossRef]
- Christensen, M.; Abrahamsen, A.B.; Christensen, N.B.; Juranyi, F.; Andersen, N.H.; Lefmann, K.; Andreasson, J.; Bahl, C.R.H.; Iversen, B.B. Avoided crossing of rattler modes in thermoelectric materials. Nat. Mater. 2008, 7, 811–815. [Google Scholar] [CrossRef]
- Euchner, H.; Pailhès, S.; Nguyen, L.T.K.; Assmus, W.; Ritter, F.; Haghighirad, A.; Grin, Y.; Paschen, S.; de Boissieu, M. Phononic filter effect of rattling phonons in the thermoelectric clathrate Ba8Ge40+xNi6−x. Phys. Rev. B 2012, 86, 224303. [Google Scholar] [CrossRef]
- Pailhès, S.; Euchner, H.; Giordano, V.M.; Debord, R.; Assy, A.; Gomès, S.; Bosak, A.; Machon, D.; Paschen, S.; de Boissieu, M. Localization of propagative phonons in a perfectly crystalline solid. Phys. Rev. Lett. 2014, 113, 025506. [Google Scholar] [CrossRef]
- Ikeda, M.S.; Euchner, H.; Yan, X.; Tomeš, P.; Prokofiev, A.; Prochaska, L.; Lientschnig, G.; Svagera, R.; Hartmann, S.; Gati, E.; et al. Kondo-like phonon scattering in thermoelectric clathrates. Nat. Commun. 2019, 10, 887. [Google Scholar] [CrossRef]
- Kaur, P.; Madsen, G.K.H.; Bera, C. Thermoelectric figure of merit and thermal conductivity of type-I clathrate alloy nanowires. MRS Commun. 2019, 9, 370–374. [Google Scholar] [CrossRef]
- Lu, L.; Yi, W.; Zhang, D.L. 3ω method for specific heat and thermal conductivity measurements. Rev. Sci. Instrum. 2001, 72, 2996–3003. [Google Scholar] [CrossRef]
- Yan, Y.; Tang, X.; Li, P.; Zhang, Q. Microstructure and thermoelectric transport properties of type-I clathrates Ba8Sb2Ga14Ge30 prepared by ultrarapid solidification process. J. Electron. Mater. 2009, 38, 1278–1281. [Google Scholar] [CrossRef]
- Tomeš, P.; Yan, X.; Kastner, R.; Svagera, R.; Waas, M.; Eilertsen, J.; Weidenkaff, A.; Paschen, S. Thermoelectric properties of meltspun Ba8Cu5(Si,Ge,Sn)41 clathrates. J. Alloys Compd. 2016, 654, 300–307. [Google Scholar] [CrossRef]
- Christian, R.; Ikeda, M.; Lientschnig, G.; Prochaska, L.; Prokofiev, A.; Tomeš, P.; Yan, X.; Zolriasatein, A.; Bernardi, J.; Schachinger, T.; et al. Nanostructured clathrates and clathrate-based nanocomposites. Phys. Status Solidi A 2016, 213, 784–801. [Google Scholar] [CrossRef]
- Zolriasatein, A.; Yan, X.; Bauer, E.; Rogl, P.; Shokuhfar, A.; Paschen, S. Influence of PCA on thermoelectric properties and hardness of nanostructured Ba–Cu–Si clathrates. Mater. Des. 2015, 87, 883–890. [Google Scholar] [CrossRef]
- Yan, X.; Falmbigl, M.; Rogl, G.; Grytsiv, A.; Prokofiev, A.; Bauer, E.; Rogl, P.; Zehetbauer, M.; Paschen, S. High-pressure torsion to improve thermoelectric efficiency of clathrates? J. Electron. Mater. 2013, 42, 1330–1334. [Google Scholar] [CrossRef]
- Sun, B.; Jia, X.; Zhao, J.; Li, Y.; Liu, H.; Ma, H. Effects of pressure on the microstructure and simultaneous optimization of the electrical and thermal transport properties of Yb0.5Ba7.5Ga16Ge30. Inorg. Chem. 2018, 57, 3323–3328. [Google Scholar] [CrossRef]
- Sun, B.; Zhao, J.; Li, Y.; Cao, L.; Yang, Y.; Fan, X.; Liu, X.; Wang, C.; Huang, X.; Wang, X.; et al. Effect of HPHT processing on structural and thermoelectric properties of low-cost type-I clathrate Ba8Cu6Si40. J. Phys. Chem. C 2020, 124, 9082–9088. [Google Scholar] [CrossRef]
- Yan, X.; Bauer, E.; Rogl, P.; Bernardi, J.; Prokofiev, A.; Paschen, S. Thermoelectric properties and stability of nanocomposites type-I clathrate Ba-Cu-Si with SiC. Z. Anorg. Allg. Chem. 2020, 646, 1055–1061. [Google Scholar] [CrossRef]
- Momma, K.; Izumi, F. VESTA3 for three-dimensional visualization of crystal, volumetric and morphology data. J. Appl. Crystallogr. 2011, 44, 1272–1276. [Google Scholar] [CrossRef]
- Prokofiev, A.; Sidorenko, A.; Hradil, K.; Ikeda, M.; Svagera, R.; Waas, M.; Winkler, H.; Neumaier, K.; Paschen, S. Thermopower enhancement by encapsulating cerium in clathrate cages. Nat. Mater. 2013, 12, 1096–1101. [Google Scholar] [CrossRef]
- Candolfi, C.; Aydemir, U.; Baitinger, M.; Oeschler, N.; Steglich, F.; Grin, Y. High temperature thermoelectric properties of the type-I clathrate Ba8AuxSi46−x. J. Appl. Phys. 2012, 111, 043706. [Google Scholar] [CrossRef]
- Bhatta, R.P.; Annamalai, S.; Mohr, R.K.; Brandys, M.; Pegg, I.L.; Dutta, B. High temperature thermal conductivity of platinum microwire by 3ω method. Rev. Sci. Instrum. 2010, 81, 114904. [Google Scholar] [CrossRef]
- Choi, T.Y.; Poulikakos, D.; Tharian, J.; Sennhauser, U. Measurement of thermal conductivity of individual multiwalled carbon nanotubes by the 3ω method. Appl. Phys. Lett. 2005, 87, 013108. [Google Scholar] [CrossRef]
- Chien, C.H.; Lee, P.C.; Tsai, W.H.; Lin, C.H.; Lee, C.H.; Chen, Y.Y. In-situ observation of size and irradiation effects on thermoelectric properties of Bi-Sb-Te nanowire in FIB trimming. Sci. Rep. 2016, 6, 23672. [Google Scholar] [CrossRef]
- Li, L.; Jin, C.; Xu, S.; Yang, J.; Du, H.; Li, G. Thermal conductivity of a single Bi0.5Sb1.5Te3 single-crystalline nanowire. Nanotechnology 2014, 25, 415704. [Google Scholar] [CrossRef]
- Properties of solids. In CRC Handbook of Chemistry and Physics; David, R.L. (Ed.) CRC Press: Boca Raton, FL, USA, 2005. [Google Scholar]
- Callaway, J. Model for lattice thermal conductivity at low temperatures. Phys. Rev. 1959, 113, 1046–1051. [Google Scholar] [CrossRef]
- Klemens, P.G. Thermal conductivity and lattice vibrational modes. In Solid State Phys.; Seitz, F., Turnbull, D., Eds.; Academic Press: Cambridge, MA, USA, 1958; Volume 7, pp. 1–98. [Google Scholar] [CrossRef]
- Ikeda, M.S. Mechanism of the Thermal Conductivity of Type-I Clathrates. Ph.D. Thesis, TU Wien, Vienna, Austria, 2015. [Google Scholar]
- Muñoz Rojo, M.; Abad, B.; Manzano, C.V.; Torres, P.; Cartoixà, X.; Alvarez, F.X.; Martín Gonzalez, M. Thermal conductivity of Bi2Te3 nanowires: How size affects phonon scattering. Nanoscale 2017, 9, 6741–6747. [Google Scholar] [CrossRef] [PubMed]
- Dedi; Lee, P.-C.; Wei, P.-C.; Chen, Y.-Y. Thermoelectric characteristics of a single-crystalline topological insulator Bi2Se3 nanowire. Nanomaterials 2021, 11, 819. [Google Scholar] [CrossRef] [PubMed]
- Roh, J.W.; Jang, S.Y.; Kang, J.; Lee, S.; Noh, J.-S.; Kim, W.; Park, J.; Lee, W. Size-dependent thermal conductivity of individual single-crystalline PbTe nanowires. Appl. Phys. Lett. 2010, 96, 103101. [Google Scholar] [CrossRef]
- Liang, W.; Rabin, O.; Hochbaum, A.I.; Fardy, M.; Zhang, M.; Yang, P. Thermoelectric properties of p-type PbSe nanowires. Nano Res. 2009, 2, 394–399. [Google Scholar] [CrossRef]
- Swinkels, M.Y.; van Delft, M.R.; Oliveira, D.S.; Cavalli, A.; Zardo, I.; van der Heijden, R.W.; Bakkers, E.P.A.M. Diameter dependence of the thermal conductivity of InAs nanowires. Nanotechnology 2015, 26, 385401. [Google Scholar] [CrossRef]
- Boukai, A.I.; Bunimovich, Y.; Tahir-Kheli, J.; Yu, J.K.; Goddard Iii, W.A.; Heath, J.R. Silicon nanowires as efficient thermoelectric materials. Nature 2008, 451, 168–171. [Google Scholar] [CrossRef] [PubMed]
- Ju, Y.S. Phonon heat transport in silicon nanostructures. Appl. Phys. Lett. 2005, 87, 153106. [Google Scholar] [CrossRef]


Disclaimer/Publisher’s Note: The statements, opinions and data contained in all publications are solely those of the individual author(s) and contributor(s) and not of MDPI and/or the editor(s). MDPI and/or the editor(s) disclaim responsibility for any injury to people or property resulting from any ideas, methods, instructions or products referred to in the content. |
© 2023 by the authors. Licensee MDPI, Basel, Switzerland. This article is an open access article distributed under the terms and conditions of the Creative Commons Attribution (CC BY) license (https://creativecommons.org/licenses/by/4.0/).
Share and Cite
Lužnik, M.; Lientschnig, G.; Taupin, M.; Steiger-Thirsfeld, A.; Prokofiev, A.; Paschen, S. Size Effect on the Thermal Conductivity of a Type-I Clathrate. Crystals 2023, 13, 453. https://doi.org/10.3390/cryst13030453
Lužnik M, Lientschnig G, Taupin M, Steiger-Thirsfeld A, Prokofiev A, Paschen S. Size Effect on the Thermal Conductivity of a Type-I Clathrate. Crystals. 2023; 13(3):453. https://doi.org/10.3390/cryst13030453
Chicago/Turabian StyleLužnik, Monika, Günther Lientschnig, Mathieu Taupin, Andreas Steiger-Thirsfeld, Andrey Prokofiev, and Silke Paschen. 2023. "Size Effect on the Thermal Conductivity of a Type-I Clathrate" Crystals 13, no. 3: 453. https://doi.org/10.3390/cryst13030453