Article

Investigation of Solid-State Hydrate-Anhydrous Phase Transformations of Dabigatran Etexilate Hemi-Edisylate

1
Medical College, Anhui University of Science and Technology, Huainan 232001, China
2
School of Pharmacy, Jeonbuk National University, Jeonju 54896, Jeonbuk-do, Republic of Korea
3
R&D Center, UniCel Lab, Uiwang 16079, Gyeonggi-do, Republic of Korea
4
Department of Chemistry and Energy Systems Research, Ajou University, Suwon 16499, Gyeonggi-do, Republic of Korea
5
Functional Crystallization Center, Integrated Engineering Program, Department of Chemical Engineering, Kyung Hee University, Yongin 17104, Gyeonggi-do, Republic of Korea
*
Authors to whom correspondence should be addressed.
These authors contributed equally to this work.
Crystals 2023, 13(3), 424; https://doi.org/10.3390/cryst13030424
Submission received: 5 January 2023 / Revised: 23 February 2023 / Accepted: 27 February 2023 / Published: 1 March 2023
(This article belongs to the Special Issue Pharmaceutical Crystal and Process Engineering)

Abstract

:
In this study, a dabigatran etexilate edisylate (DBE) was prepared by the reaction crystallization of dabigatran etexilate (DBG) and edisilic acid. According to single crystal X-ray diffraction (SXRD), it was revealed that two DGB were combined with one edisylate and associated with one water for DBE monohydrate. Additionally, the hot stage microscopy showed that the DBE monohydrate was transformed to DBE amorphous solid and then finally shifted to the DBE anhydrate in solid-state. Using powder X-ray diffraction (PXRD), differential scanning calorimetry (DSC), thermogravimetric analysis (TGA), and a hygroscopic test, it was confirmed that the phase transformation of DBE monohydrate to DBE anhydrate was irreversible. Additionally, any other crystal form of DBE anhydrate was not available because it was the most stable phase.

1. Introduction

In pharmaceutical and fine chemical industries, the crystal form is an important issue because the different crystal form has different physicochemical properties such as solubility, dissolution rate, and crystal potential, which bring great influence on bioavailability and stability which are the most essential factors in the drug design [1,2,3,4,5,6].
There have been several examples that drugs were retrieved from the market due to the generation of new crystal form and phase transform to other crystal form during the manufacturing, selling, and marketing processes. Rotigotine for the treatment of Parkinson’s disease in the late 1980s and Ritonavir to treat HIV in 1992 are typical examples of drug retrieval from the market due to the phase transformation and new crystal form generation on the shelf [7,8,9,10]. These accidents were clearly caused by a lack of comprehensive crystal form screening, characterization, and phase transformation. Therefore, the scrutinization and evaluation of crystal form such as solubility, stability, and dissolution rate are highly required for drug design.
The understanding of principles regarding phase transformation is important to conduct thorough investigation of crystal forms [1,6]. Techniques including the solvent-mediated phase transformation [11,12,13] and solid-state phase transformation [14] are the most widely used methods to induce the phase transformation, namely to induce structural rearrangement of crystal form. The solid-state phase transformation method evaluates the phase transformation based on the thermodynamic energy differences. Therefore, the method is conducted as function of temperature to investigate the crystal form transformation [14]. The method is considered to be easier, as only a few variables are employed to achieve the overall study, although it demands a large energy consumption when compared with the solvent-mediated phase transformation method. In addition, this method could be conducted at any time, even during the crystal forms manufacturing, including the drying, storage, and the analysis period. Solid-state phase transformation method includes several sub-methods to investigate the phase transformation. This includes the grinding process, for which the method uses the energy generated during grinding [15,16,17,18,19], hot-stage microscopy (HSM) analysis method, which allows the monitoring of changes in crystal shape based on heating rate and temperature range [20,21,22], spectroscopic, DSC, TGA, and PXRD analysis methods performed on the basis of temperature changes [23,24,25,26,27,28], the Dynamic Vapor Sorption (DVS) method, which is employed to investigate phase transformation of crystal form such as hydrate and anhydrate through the change in the relative humidity and temperature [29], and so on.
Dabigatran etexilate (DBG) is a double prodrug of Dabigatran developed by Boehringer Ingelheim in 1998. For oral intake, the drug is used as thrombin inhibitor (Figure 1a). DBG is largely prescribed to prevent apoplexy in patients with atrial fibrillation [30,31]. Using mesylate anion, DBG was modified to a salt form of Dabigatran etexilate mesylate (DBM) for market. Among DBM crystal forms, including the hydrate form, the form-I was used for medication [31].
Recently, our group reported a new salt form of DBG, named DBG hemi-edisylate (DBE) [32]. This newly developed salt was produced using edisilic acid (Figure 1b) and has been confirmed to have improved physicochemical properties compared to DBG [32]. However, to the best of our knowledge, there have been no reports on the phase transformation of DBE monohydrate and anhydrate. In this study, we provide further insight into the newly developed DBG hemi-edisylate (DBE), including information on the phase transformation from DBE monohydrate to DBE anhydrate. Accordingly, the single-crystal X-ray diffraction (SXD) was used for the crystal structure of the newly-discovered DBE monohydrate. Additionally, DBE monohydrate and DBE anhydrate were characterized using solution and NMR, PXRD, DSC, and TGA. Finally, this study aimed to investigate and to report the solid-state phase transformation of DBE monohydrate to DBE anhydrate by using HSM.

2. Materials and Methods

2.1. Materials

Dabigatran etexilate (DBG), tetrahydrate, and edisilic acid were kindly provided by J2H Biotech. Co., Ltd. (Republic of Korea). Acetone (ACT) and Methanol (MeOH) were purchased from DaeJung Chem. Co., Ltd. (Republic of Korea). Syringe filters (PTFE, 0.22 Micron, 25 mm) were purchased from Sterlitech (USA).

2.2. Production of DBE through Reaction Crystallization

10 g of DBG tetrahydrate were introduced in a 500 mL reactor and then 300 mL of ACT were added into the reactor to dissolve the content at 25 °C. Afterwards, 2 g of edisilic acid were dissolvent in 6 mL of MeOH, and then added to the DBG/ACT solution contained into the 500 mL reactor. The mixture was stirred at 25 °C and 200 rpm for 5 h. The precipitated powder was collected through vacuum filtration and was assessed as DBE monohydrate though the crystals characterization. DBE monohydrate powder was then dried in the vacuum dryer at 45 °C for 70 h. The crystal analysis result revealed that all dried DBE powder underwent complete conversion to anhydrate. In addition, single crystals of DBE monohydrate were prepared by dissolving 1 g of powder DBE monohydrate into 20 mL MeOH. After the dissolution was completed, the solution was allowed to evaporate slowly at room temperature for 3 days (without stirring) to produce single DBE monohydrate single crystals. Besides, several attempts were made to produce single crystal DBE anhydrate crystals, however they were unsuccessful, because only thin and light dendritic crystals could be obtained.

2.3. Single Crystal X-ray Diffraction (SXD)

The crystal structure of the DBE monohydrate was determined by the single crystal X-ray diffraction method. A preliminary examination and data collection were performed with Mo-K radiation (λ = 0.71073 Å) on a Rigaku R-AXIS RAPID diffractometer (Rigaku Corporation, Tokyo, Japan). The unit cell parameters and the orientation matrix for the data’s collection were obtained from least-squares refinement, using the setting angle of 15530 reflections in the range of 6.0° < 2θ < 52.0°. The crystallographic details are described in Table 1. Further intensity data were collected at 150 (1) K with the w scan technique. The intensity statistics and systematic absences are consistent with the triclinic space group P 1 ¯ . The initial positions for all of the non-hydrogen atoms were obtained by the direct methods of the SHELXS-2013/1 program (2013/1, University of Göttingen, Germany) and Fourier methods. The positions of the hydrogen atoms were idealized with the use of the riding model. The structure was refined by full-matrix least-squares techniques with the use of the SHELXL-2017/1 program (2017/1, University of Göttingen, Göttingen, Germany) in theWinGX program package. A different Fourier synthesis calculated with phases based on the final parameters shows no peak heights greater than 0.333 e/Å3. No unusual trends were found in the goodness-of-fit as a function of Fo, sinθ/λ, and the Miller indices. The final values of the atomic positional parameters, the equivalent isotropic displacement parameters, the anisotropic displacement parameters (ADPs), and complete tabulations on the X-ray studies can be found in CIF format in the Supporting Information.

2.4. Differential Scanning Calorimetry (DSC)

DSC analysis of DBE crystal forms was carried out with a TA instruments DSC Q20 (TA Instruments, Philadelphia, PA, USA) in nitrogen atmosphere using closed sample pans (Tzero pan and Lid, TA Instruments, Philadelphia, PA, USA). The cell constant and enthalpy calibrations were performed with indium in accordance with the manufacturer’s instructions. The DSC thermal profile of DBE crystal forms was recorded from 30 °C to 250 °C with a scan rate of 10 °C/min. In addition, the heating-cooling-heating DSC thermal scanning of DBE monohydrate was also carried out in nitrogen atmosphere. First, DBE monohydrate was heated from 30 °C to 160 °C and then cooled to 30 °C. Then, it was reheated from 30 °C to 200 °C. Here, the scan rate was always fixed at 10 °C/min.

2.5. Thermogravimetric Analysis (TGA)

Thermogravimetric analysis of DBE crystal forms was conducted with TGA Q50 (TA Instruments, Philadelphia, PA, USA) in the nitrogen atmosphere. The temperature ranged from 30 °C to 300 °C at a scan rate of 10 °C/min.

2.6. Powder X-ray Diffraction (PXRD)

The PXRD of DBE crystal forms was analyzed with a Powder X-ray diffractometer (Bruker, D8 Advance, Billerica, MA, USA) equipped with Cu Ka radiation set at 45 kV and 40 mA. The divergence and scattering slits were set as 1°, and the receiving slit was 0.2 mm. The 2θ scanning range was from 5° to 35° with a scanning rate of 3°/min (0.4 s/0.02°).

2.7. Solution-State Nuclear Magnetic Resonance Spectroscopy (Solution-State NMR)

The 1D (1H, 13C) and 2D (COSY, HSQC, HMBC) solution-state NMR spectra were recorded using BRUKER AVANCE-800 (Billerica, MA, USA) to determine the ionic bonding, and to monitor the change in chemical shifts occurring within DBE molecules by comparing with those of DBG. Here, DBE and DBG were dissolved in DMSO-d6 for NMR analysis.

2.8. Solid-State Nuclear Magnetic Resonance Spectroscopy (Solid-STATE CP/MAS 13C-NMR)

The solid-state CP/MAS 13C-NMR spectra of DBE monohydrate and DBE anhydrate were recorded with a 500 MHz solid-state NMR (Avance II, Bruker, Billerica, MA, USA). The spectral acquisition was achieved using the cross polarization (CP)/magic angle spinning (MAS) pulse sequence. Experimental conditions were as follows: spinning 5 KHz; pulse delay, 10 s; contact time, 2 min; analysis time, 24 h.

2.9. Hot-Stage Microscopy (HSM)

The solid-state crystal formic transformation of DBE monohydrate was monitored using a hot-stage microscope. Temperature controller (TMS 94, Linkam Scientific Instruments Ltd., UK) was used for hot-stage and a Zeiss Axioscope (AxioImager MAT Reflected-Light Microscope, Germany) was used as an optical microscope. The heating range of the hot stage was from 30 °C to 200 °C and the heating rate was fixed at 10 °C/min. Here, the software of Linksys 32 (Linkam Scientific Instruments Ltd., UK) was used to record the images at every second. The video record of the crystal formic transformation of DBE monohydrate on the hot stage is provided in Supporting Information.

2.10. Hygroscopic Test

The hygroscopic tester (Quantachrome, Hydrosorb 1000, Boynton Beach, FL, USA) was employed for investigation of phase transformation of DBE under humidity. Samples of DBE anhydrate powder (100 mg) were individually stored under relative humidity (RH) of 53%, 64%, and 75%, respectively, at 25 °C for 3 days. Then, samples were analyzed with TGA and PXRD patterns.

3. Results and Discussion

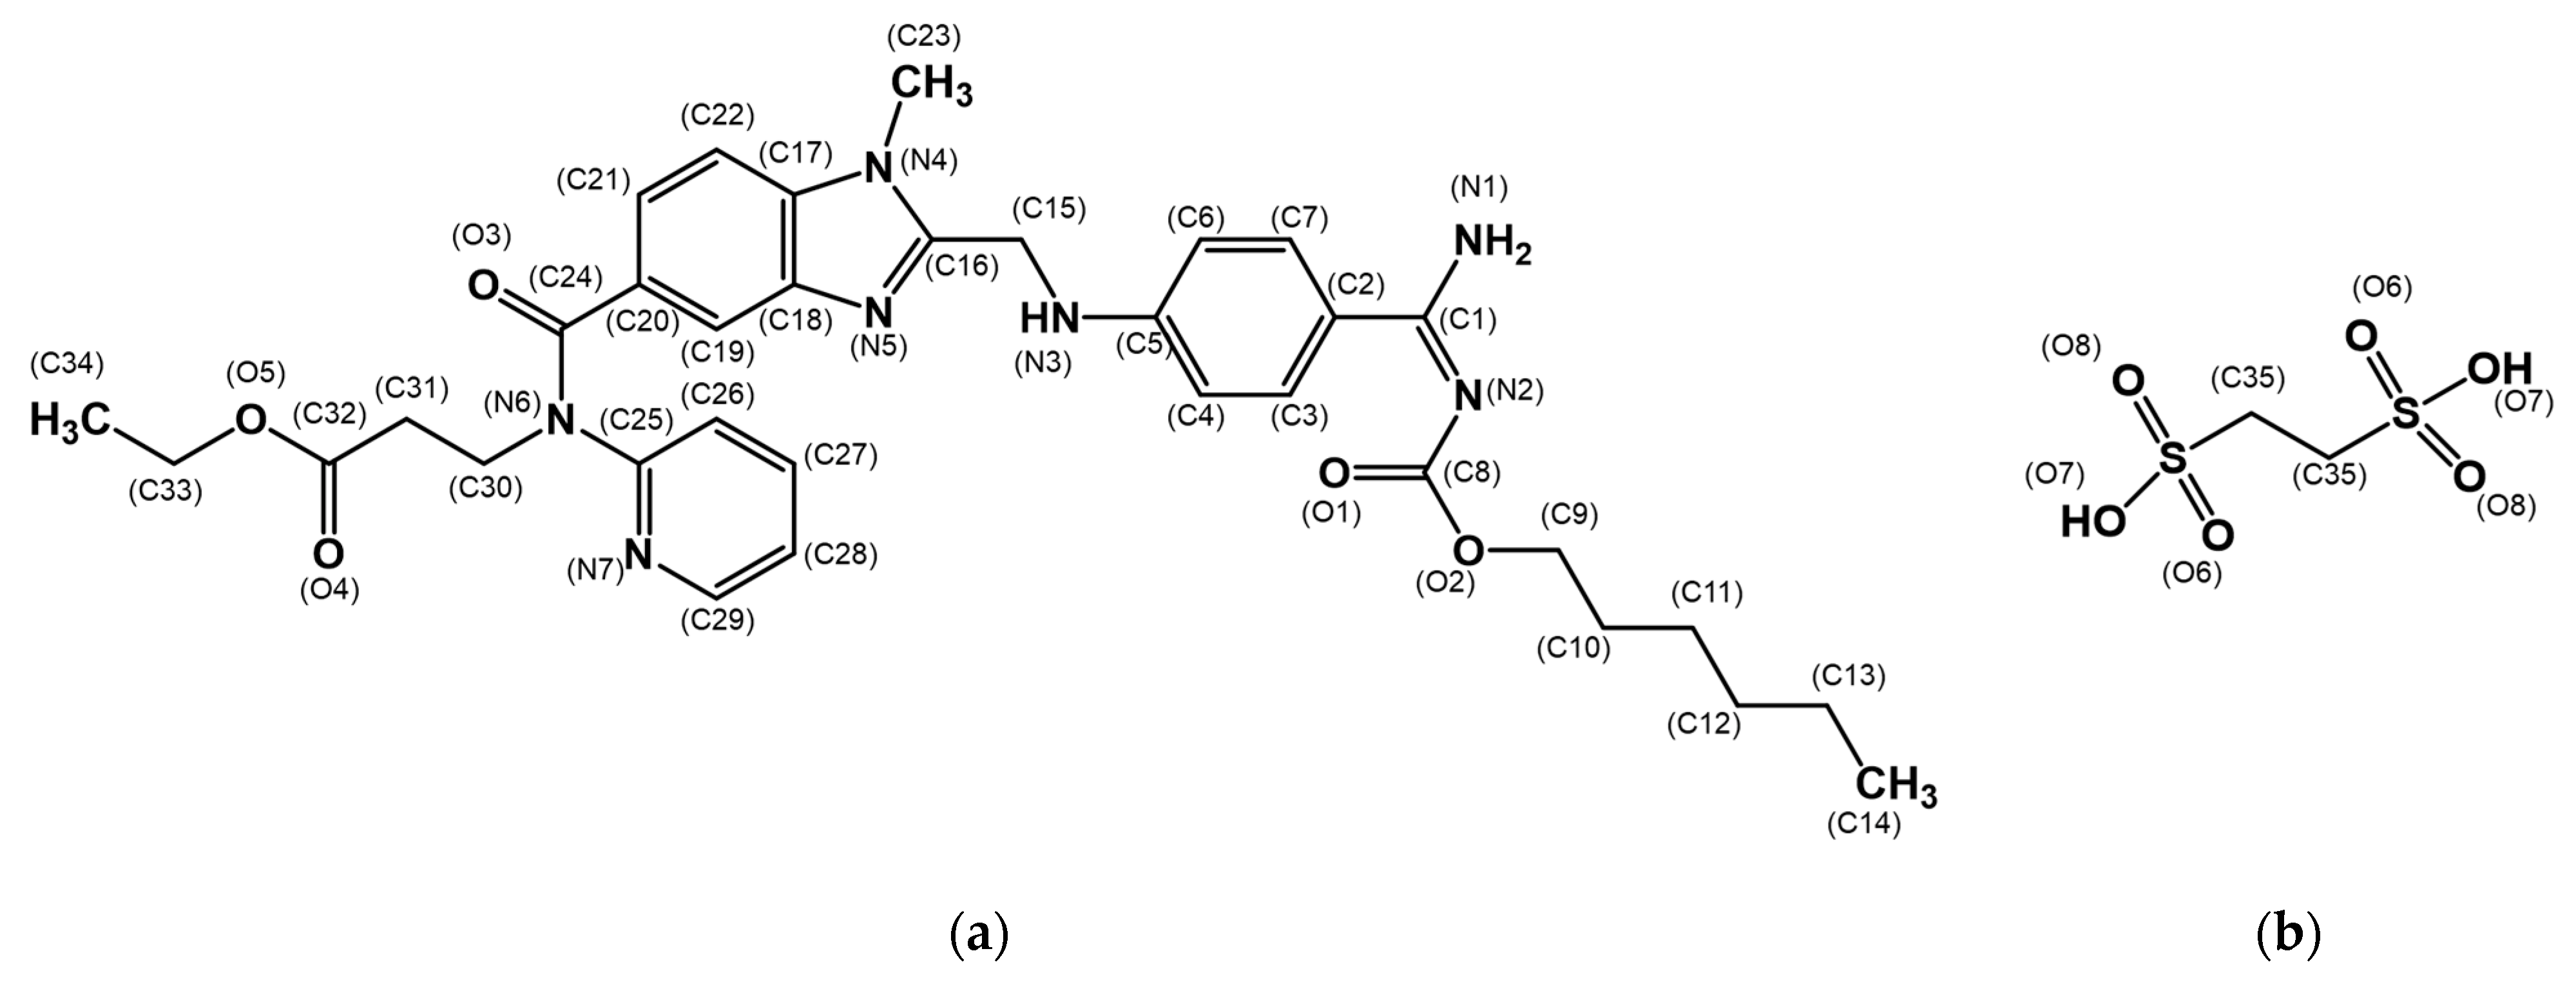
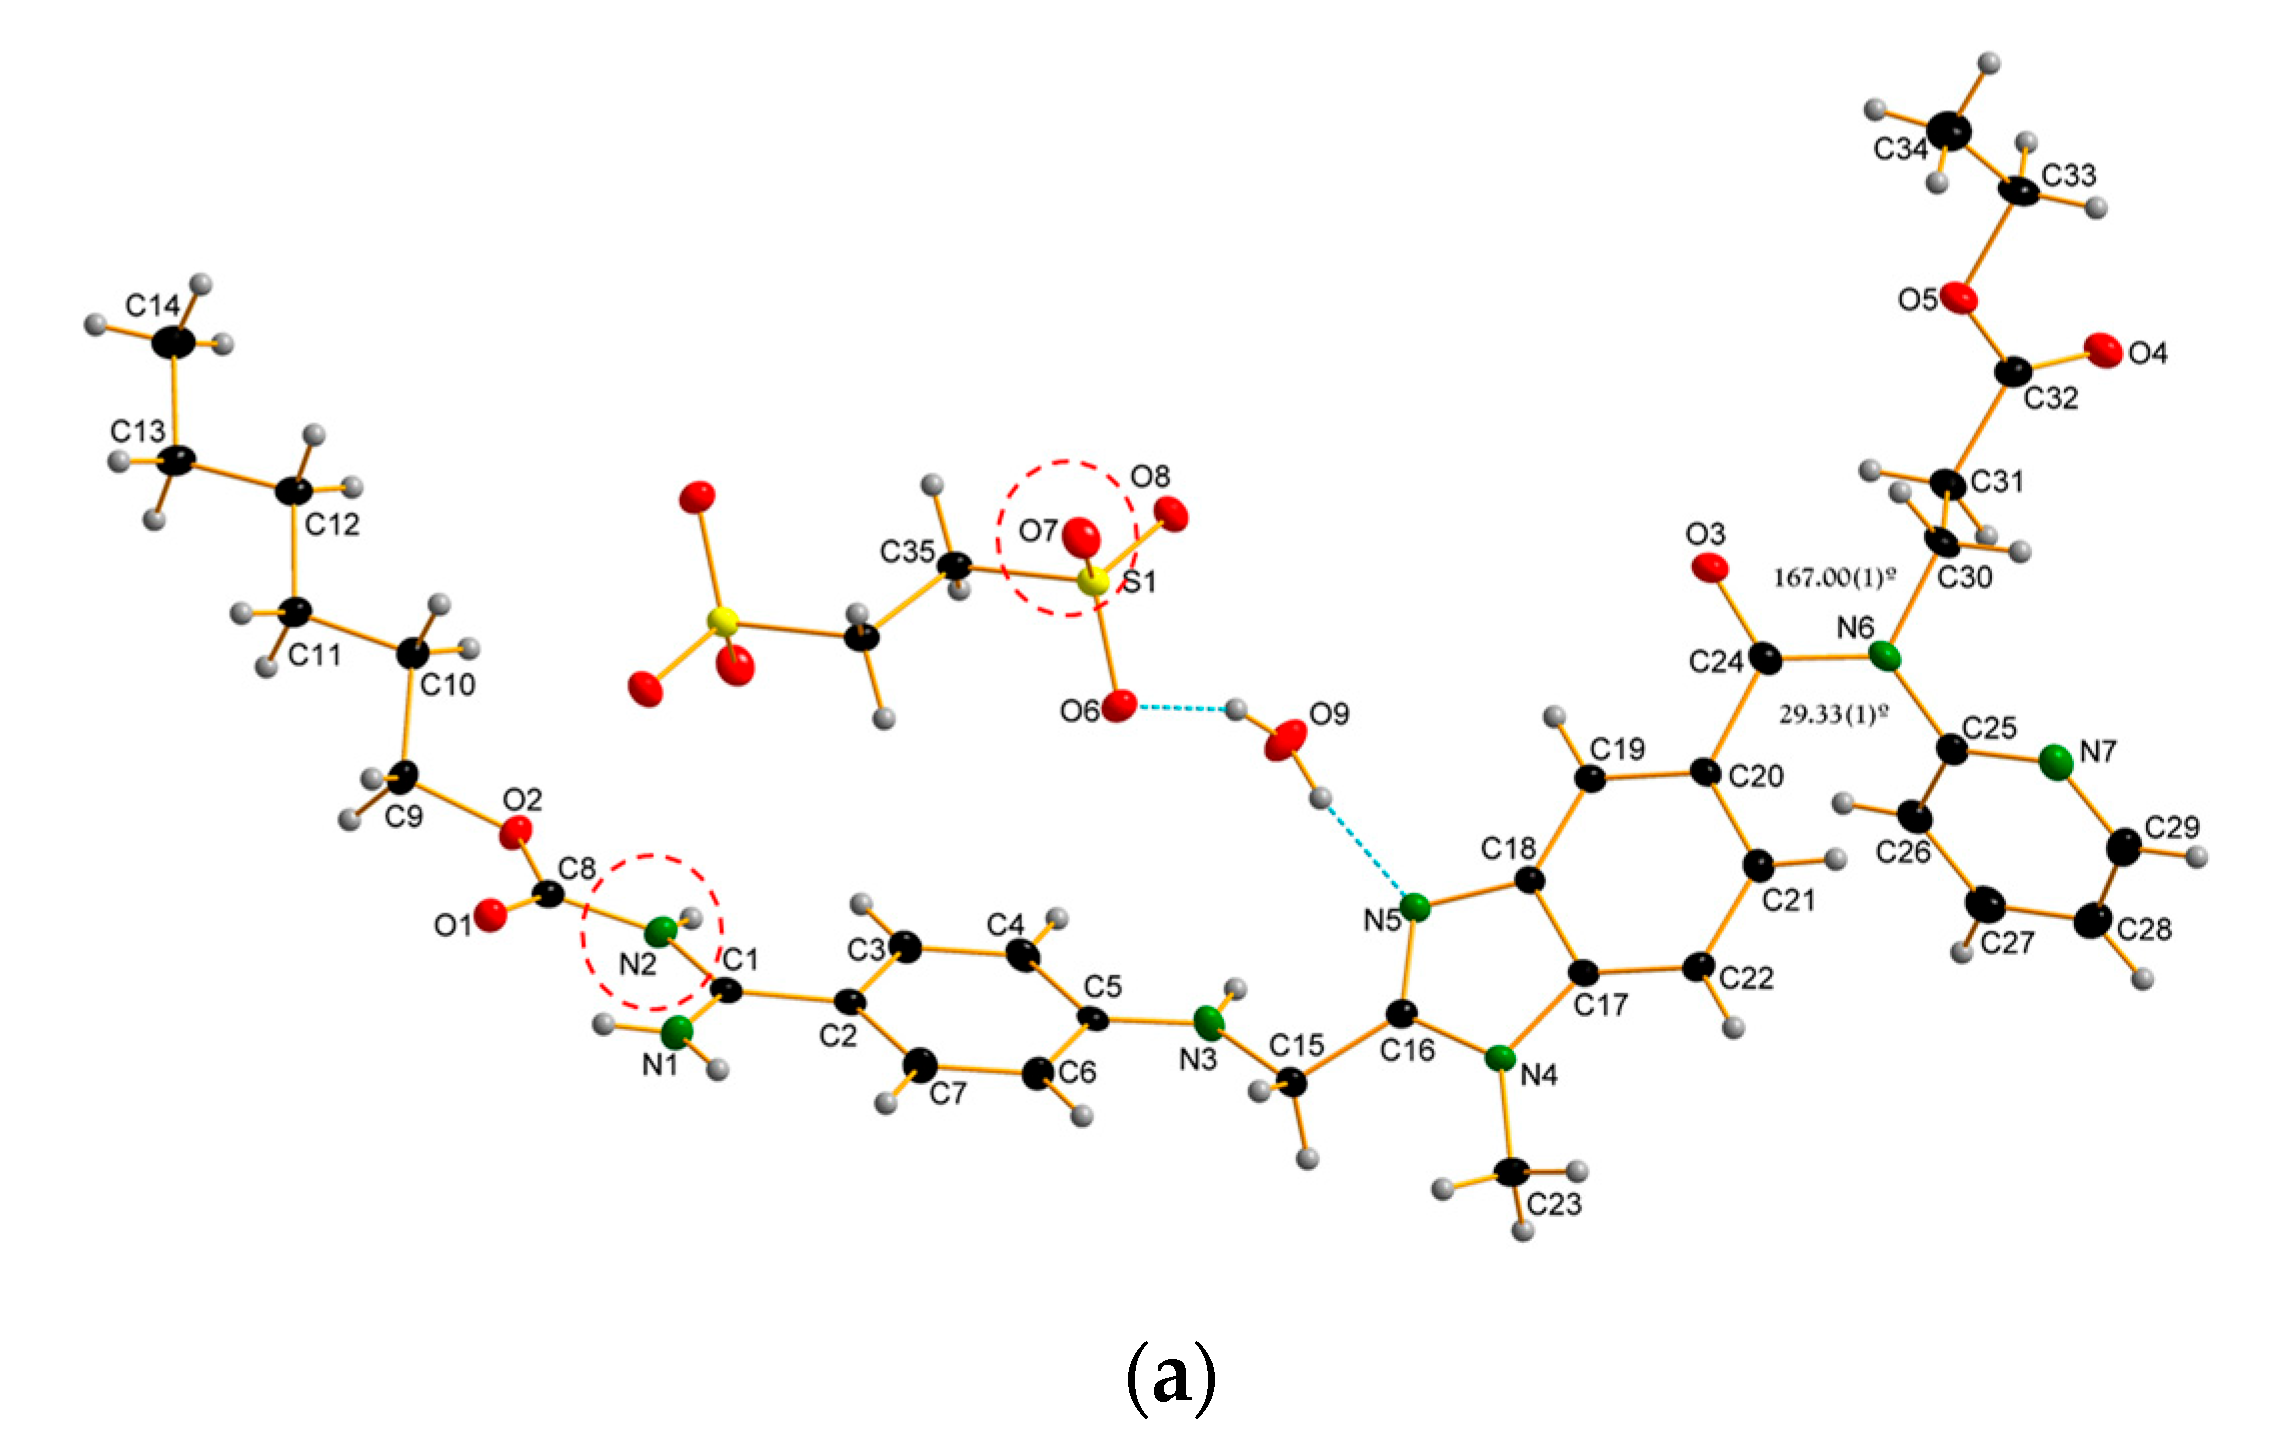
3.1. Crystal Structure of the Dabigatran Etexilate Hemi-Edisylate (DBE) Monohydrate (I)

The crystal structure of DBE monohydrate consists of the two dabigatran etexilate (DBG), one edisylate, and two water molecules [32]. Here, two protons of the O(7) atoms of the edisilic acid were transferred to the N(2) atoms of the DBG to form the ionic pair (Figure 2a). They are connected via various intermolecular hydrogen bonds to form a 2-D network given in Figure 2b and Table 2. Four DBG molecules are connected to an edisylate ion through hydrogen bonds, N(1)–H(1B) … O(6) and N(3)–H(3A) … O(7). In addition, a water molecule bridge the DBG and edisylate, N(2)–H(2) … O(9) and O(9)–H(9D) … O(6) (Figure 2b—blue dotted line). A one-dimensional chain along [ 1 1 ¯ 0 ] was built by these hydrogen bonds (Figure 2c). These chains are linked by the water molecule, O(9)–H(9C) … N(5) (Figure 2a—red dotted line), to complete a two-dimensional layer parallel to the ab-plane. There is no hydrogen bonding interaction, as only van der Waals forces are between the layers (Figure 2d).
The crystal structure of the DBE monohydrate was similar to that of the previously reported [33], except for the conformational differences. While the interplanar angle between the benzene and Pyridine planes with the benzimidazole mean planes of the DBG are 5.4(1) and 43.8(1)º, respectively, they are 40.32(5)° and 63.08(8)° in DBE monohydrate. In addition, free rotation is possible around the single C24-N6 bond. The dihedral angle, C20-C24-N6-C30 and C20-C24-N6-C25, are 167.00(1) and 29.33(1)°, respectively (Figure 3a). In the DBG structure, the position of the C chain and pyridine ring are reversed. They are 24.8(2) and 177.9(1)° (Figure 3b). The PXRD pattern of the powder form of DBE monohydrate possesses the same pattern achieved with PXRD simulation based upon the single crystal structure. Therefore, we believe that the polycrystalline DBE is isostructure with the single crystal (Figure S1).
The solution-state NMR analysis of DBG and DBE display differences in chemical shifts on N(2)H, as shown in Figure S2. However, DBG and DBE possess similar chemical shifts on the other functional groups. A new proton peak appearing at 9.99 ppm in DBE did not exist in DBG. In addition, according to the 2D COSY results on DBE, there is no correlation between C(15)H and the new peak at 9.99 ppm on 1H-NMR results (Figures S2 and S3). The salt formation by the migration of the proton from O(7) to N(2) was found by the difference Fourier synthesis during the X-ray crystallographic investigations, which is supported by the NMR studies. The interpretation of DBG and DBE solution-state NMR are proceeded by 1D (1H, 13C) and 2D NMR (COSY, HSQC, HMBC) analysis based on the DBG solution state NMR results reported by Nagadeep et al. [34] (Figures S2–S6).

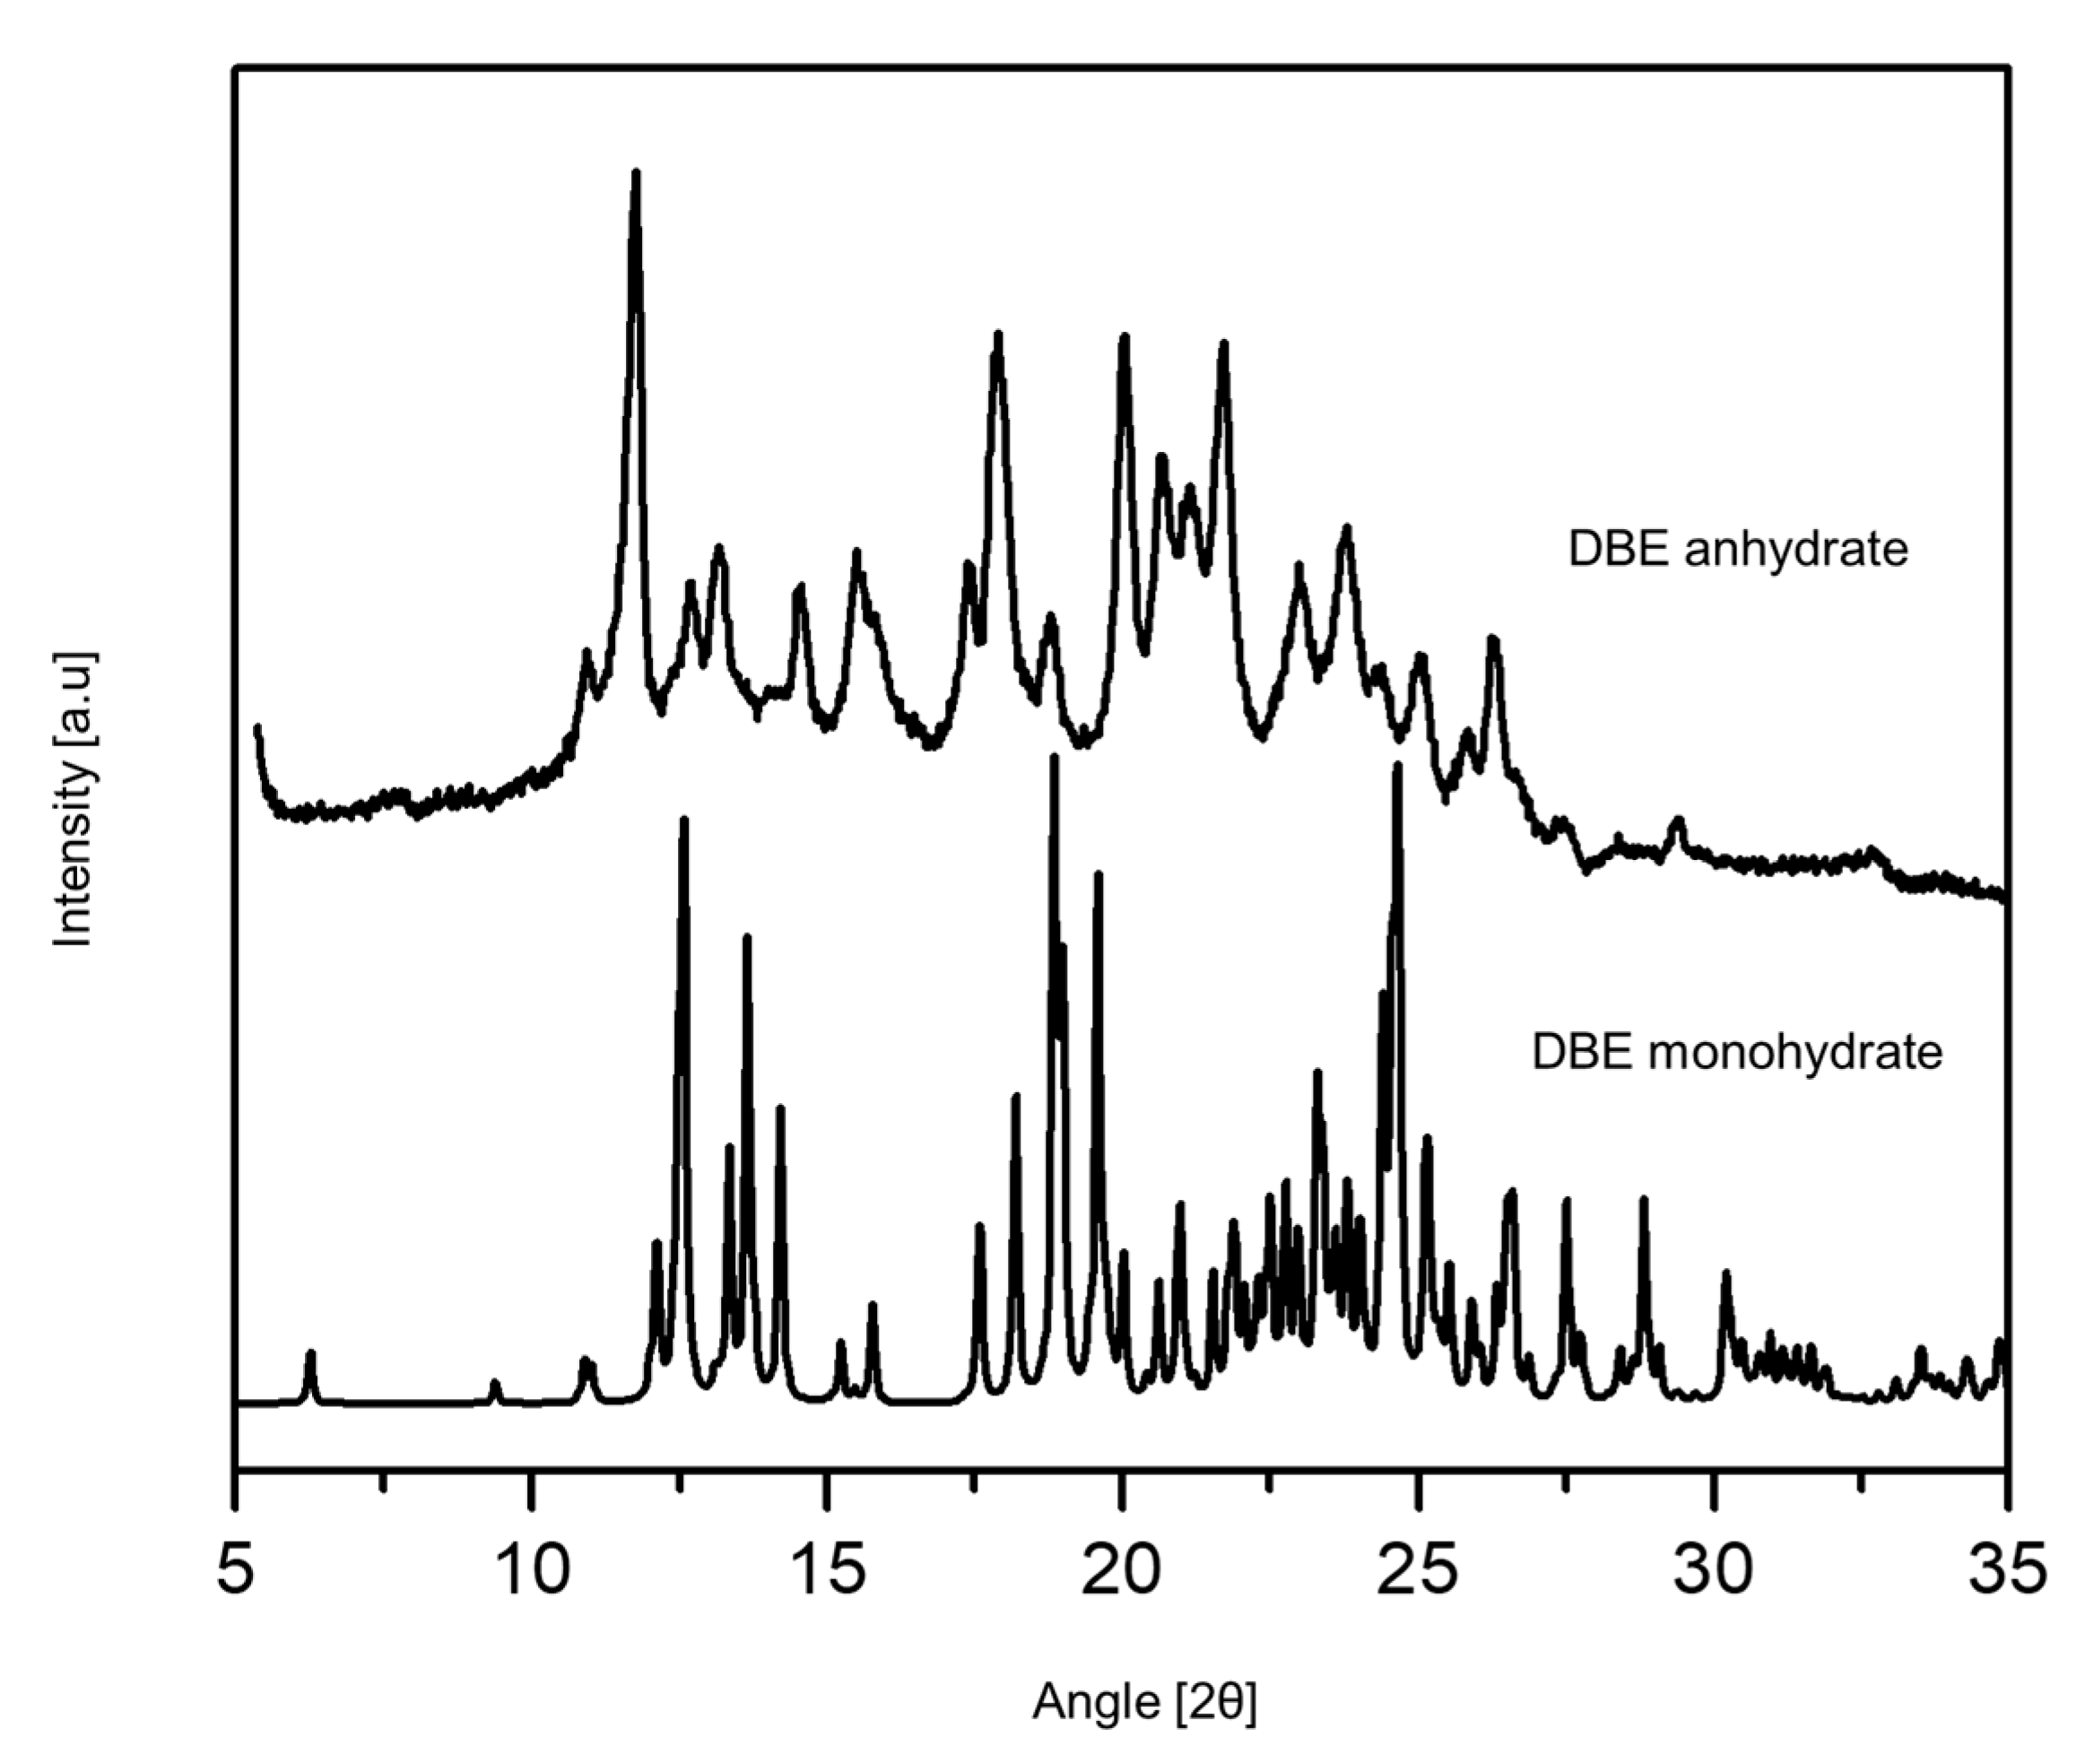
3.2. Characterization of DBE Crystal Forms

DBE monohydrate powder was dried at 45 °C in a vacuum drier for 70 hr. The PXRD pattern of dried DBE powder was different from the PXRD pattern of DBE monohydrate. This change of PXRD pattern suggested that dehydration occurred in DBE monohydrate, generating a new crystal form of DBE by drying (Figure 4). According to DSC thermal scanning, DBE monohydrate possessed a wide dehydration endothermic peak around 90 °C to 150 °C and was melted at 187 °C. Meanwhile, the DSC thermal profile of dried DBE possessed only an endothermic melting peak at 187 °C (Figure 5a). From the same melting peak between DBE monohydrate and dried DBE in DSC, it could be inferred that the DBE monohydrate was shifted to the same crystal structure of dried DBE after the dehydration around 90 °C to 150 °C. Additionally, the single peak in the dried DBE implied that the dried DBE was anhydrate form, which was the most stable. TGA analysis of DBE monohydrate showed 2.269% weight loss by dehydration around 90 °C–150 °C. This weight loss was well matched with the water fraction in the DBE monohydrate crystal. However, the dehydration pattern was not observed with dried DBE (Figure 5b). Therefore, dried DBE was confirmed to be an anhydrate form.
The solution-state 1H-NMR analysis was carried out in order to examine the possibility of thermal decomposition of DBE in drying. As shown in Supporting Information (Figure S2), the NMR spectra of DBE monohydrate and DBE anhydrate were identical. Therefore, it could be confirmed that there was no decomposition of DBE in drying. It should be mentioned that we had many attempts to make a single crystal of DBE anhydrate. Unfortunately, we were not successful at obtaining the single crystal goof enough for single XRD analysis. The thin and fragile properties of DBE anhydrate might be assumed to be a reason for the difficulties in the preparation of single crystal.
Considering the consequences, solid-state CP/MAS 13C-NMR, which allows us to determine the conformation and the hydrogen bonding [35], was incorporated to estimate the characteristics of DBE monohydrate and anhydrate. Figure 6 represents the overlap of the spectra of solid-state CP/MAS 13C-NMR of DBE monohydrate and anhydrate and the solution-state 13C-NMR of DBE. The peaks of DBE alkyl chains, including C(14)H3 peak in the range of 13 ppm–14 ppm, C(10)-C(11)-C(12)-C(13) peaks in the range of 21 ppm–34 ppm, and C(9) peak in the range of 65 ppm–68 ppm, display different splitting patterns for DBE monohydrate and anhydrate. This could be supported by Liu et al. [33], with DBG tetrahydrate crystal structure analysis revealing the conformations of C(9) to C(14) of alkyl chains (Figure 6a). Therefore, the difference in solid-state CP/MAS 13C-NMR spectra of DBE monohydrate and anhydrate in Figure 6a is predicted to be a result of different form of conformational changes. Figure 6b is a spectra of solid-state CP/MAS 13C-NMR of DBE monohydrate and anhydrate between 100 ppm to 210 ppm. Carbon peak of the DBE aromatic rings are visible in the range of 105 ppm to 150 ppm in Figure 6b. As can be seen, the spectra of DBE monohydrate and anhydrate differ greatly within the range. This seems to be a result of different conformation changes of the aromatic ring of DBE. In addition, as presented in Figure 6b, the peak of C(1) attached to the N(1)H2 appears at 161 ppm for the monohydrate and at 164 ppm for the anhydrate, which is located downfield of the monohydrate peak. Figure 2a and Table 2 shows the hydrogen bonding between N(1)H2 and O(6). Consequently, the downshift of C(1) peak of anhydrate when compared with the same peak of monohydrate in Figure 6b is a result of the differences in hydrogen bonding forces. The solid-state CP/MAS 13C-NMR spectra were analyzed through the NMR analysis of solution-state 1D (1H, 13C), 2D (COSY, HSQC, HMBC), and the DBE solution state NMR results reported by Nagadeep et al. [3] (Figures S2–S6). Therefore, through the analysis of DBE monohydrate and anhydrate, each crystal possessing different structures was verified.

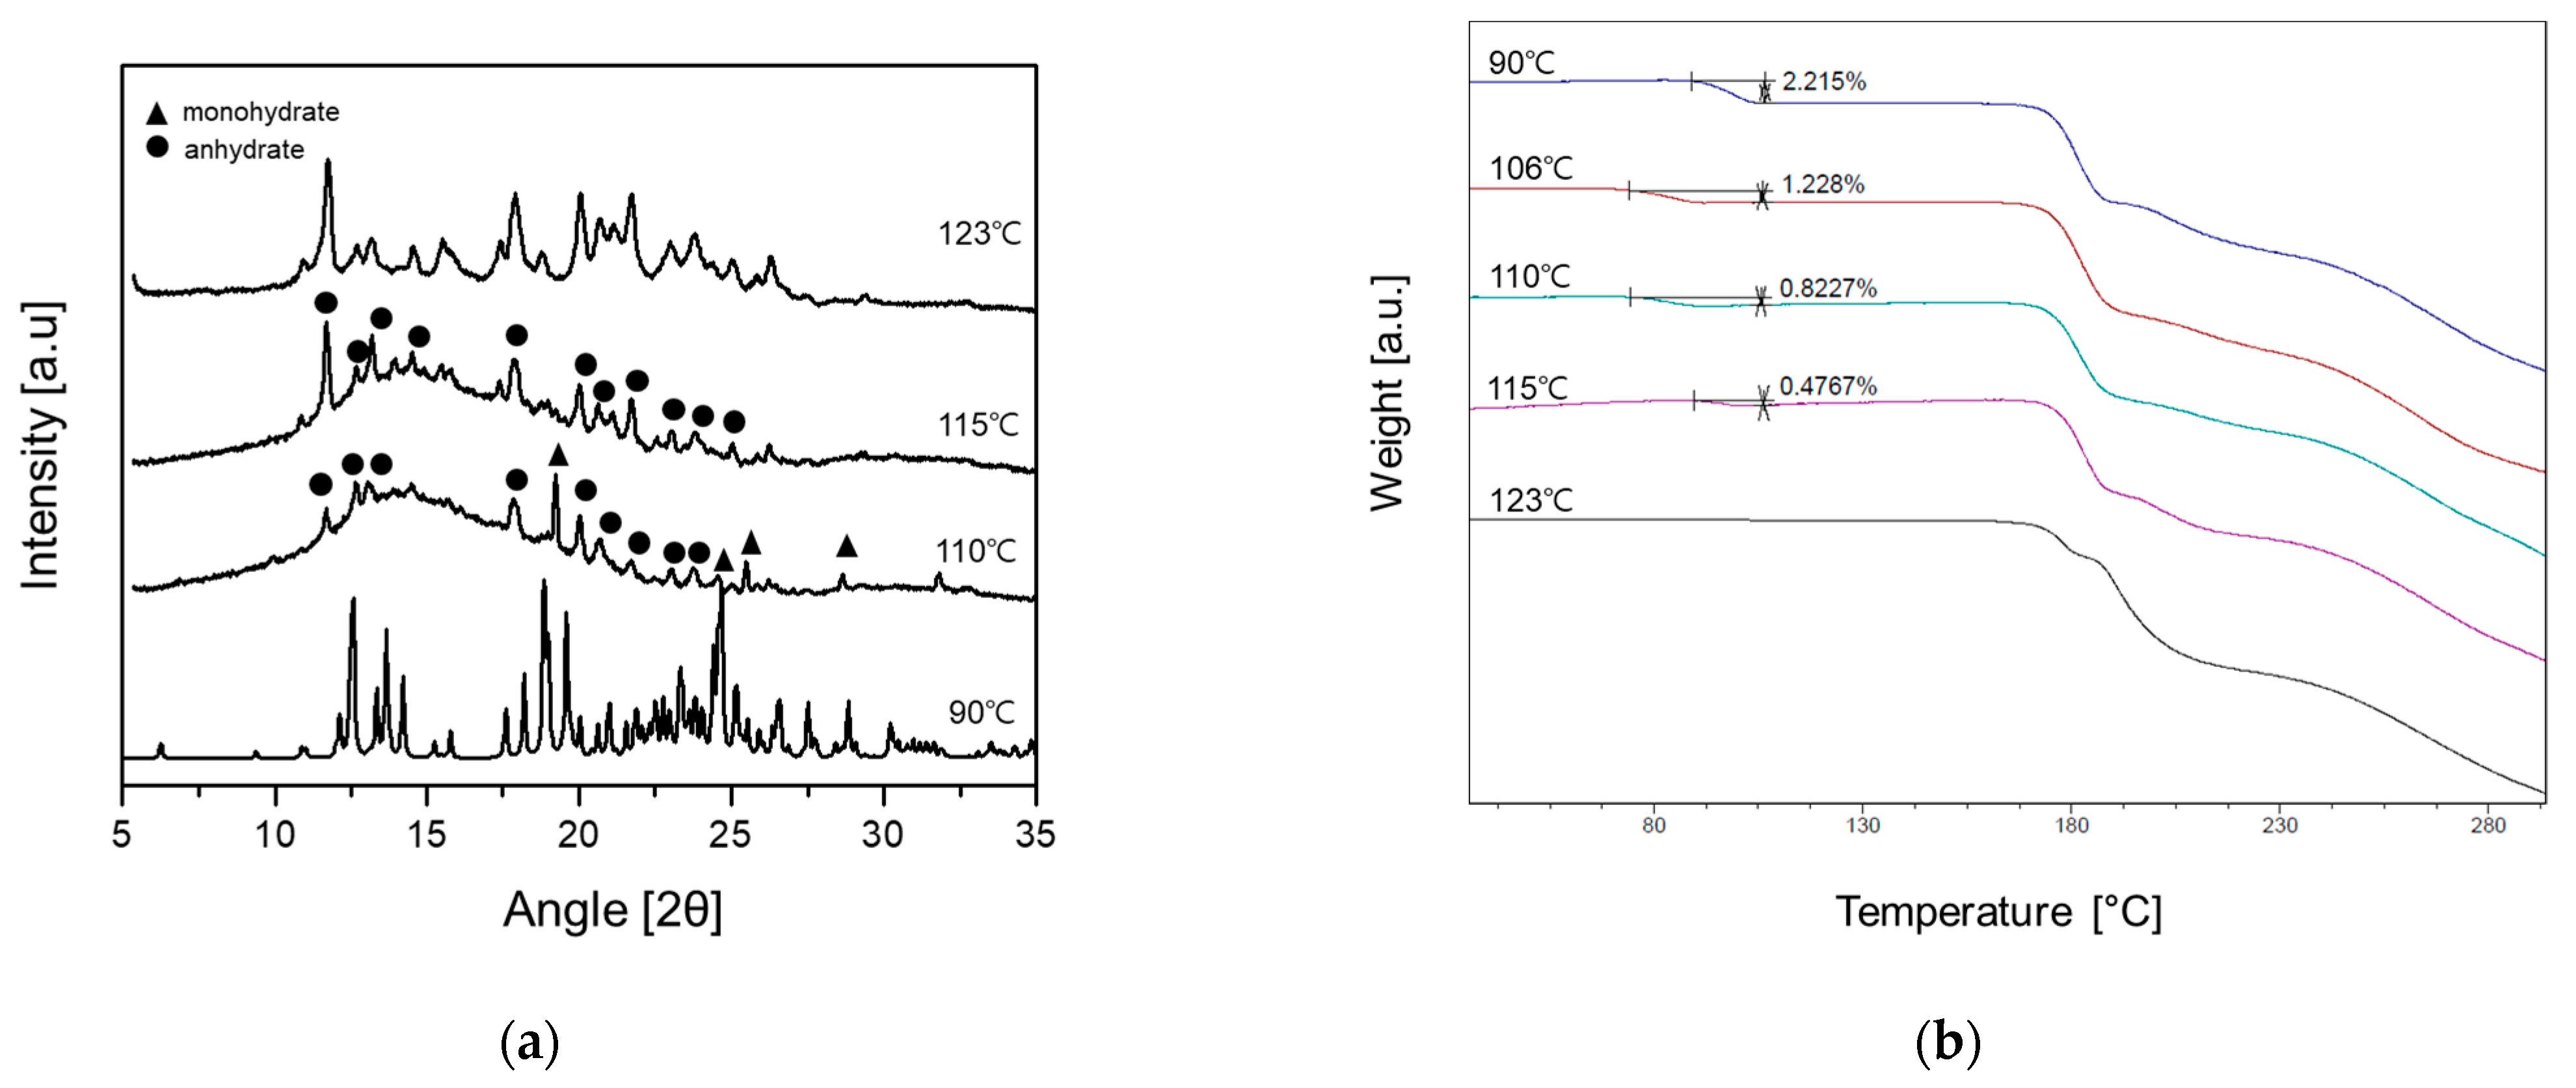
3.3. Solid State Phase Transformation of DBE Crystal Forms

According to the thermal analysis (Figure 5), it was found that the phase transformation of DBE monohydrate into DBE anhydrate occurred via dehydration. For further investigation of phase transformation, heating-cooling-heating scanning (10 °C/min) of DCS was attempted for the DBE monohydrate, as shown in Figure 7. In the heating scan from 30 °C–160 °C (black line), an endothermic peak of DBE monohydrate appeared first at around 150 °C due to dehydration. No peak was observed during the cooling scan from 160 °C to 30 °C (blue line). In the second heating scan from 30 °C to 190 °C (red line), only the endothermic peak occurred at 187 °C. This peak was exactly matched with the melting peak of DBE anhydrate. Therefore, these results supported the phase transformation of the DBE monohydrate to the DBE anhydrate.
To provide more concrete examination of the phase transformation, HSM (heating rate 10 °C/min, temperature range 30 °C–200 °C) was utilized to observe the solid-state phase transformation of DBE monohydrate to anhydrate. Additionally, the temperature range was designated for the monohydrate crystal transformation using the HSM, which was further used in PXRD and TGA analysis. HSM thermal scanning of DBE monohydrate results in the sustenance of rectangular-shaped crystals until 90 °C, then starts to change into thin dendrites in between the 90 °C and 118 °C range. Lastly, at 123 °C, the crystal structure phase transformation finishes as dendrites (Figure 8). Once the temperature was increased from 123 °C up to 185 °C, the dendrites shape remained then turned into liquid after 185 °C (HSM thermal scanning result of DBE monohydrate is attached as a video media file in the Supporting information).
Data in Figure 9a are the PXRD pattern analysis of the crystals retained at 90 °C, 110 °C, 115 °C, and 123 °C conditions during the HSM thermal scanning process of DBE monohydrate. Accordingly, the phase transformation happens as follows: monohydrate (90 °C) → monohydrate/anhydrate/amorphous (110 °C) → anhydrate/amorphous (115 °C) → anhydrate (123 °C). Figure 9b shows the TGA analysis results of the crystal samples obtained at 90 °C, 106 °C, 110 °C, 115 °C, and 123 °C during HSM thermal scanning. According to the analysis, the reduction in mass by water dehydration appears as 2.215% (90 °C) → 1.228% (106 °C) → 0.8227% (110 °C) → 0.4767% (115 °C) → 0% (123 °C). This result verifies the loss of water mass as the HSM temperature increased. Therefore, considering the PXRD and TGA analysis in Figure 9, the reason of the phase transformation from monohydrate to amorphous to anhydrate is the dehydration of water molecules by thermal energy, leading to the rearrangement into the anhydrate crystal structures from monohydrate.
During the dehydration process, DBE crystals exist as amorphous to be rearranged into a new structure. Additionally, the DSC-HSM DBE phase transformation diagram is represented in Figure 10. Lastly, in order to investigate the possibility of a phase transformation into monohydrate or another hydrate from DBE anhydrate by moisture absorption at room temperature, further tests utilizing the hygroscopic testers were pursued. Zhu et al. reported that an increase in relative humidity (RH) to 45% can result in a solid-state transformation of anhydrate within 24 h [29]. Test conditions varied from 53%, 64%, and 75% relative humidity (RH) at 25 °C, and the samples were stored in each condition for 3 days before being analyzed using TGA and PXRD pattern. The result showed no weight gain at any of the test conditions and the DBE maintained its anhydrate form (Figures S7 and S8). In conclusion, the final stable crystal form of DBE is confirmed to be anhydrate, with the monohydrate being the metastable crystal form.
In this study, DBE anhydrate was found during the drying procedure of the monohydrate. Thus, a thorough investigation of phase transformation during the solid-state was inevitable. A understanding of crystal form characterization and the stability of DBE was needed for the new salt form. The investigation of phase transformation is the most basic research to evaluate characteristics such as solubility and bioavailability, and to confirm the stability and safety during manufacturing of the crystal form of APIs. This thorough investigation allows for the controlling of the crystal form of the APIs. Therefore, this research characterization of DBE crystal forms was done, which allowed for the distinguishing of the metastable and stable crystal form.
Given the crucial role of solubility in pharmacokinetic properties, we measured the solubility of DBE monohydrate and anhydrate in water and pH buffers and reported the results in our early patent [32]. The solubilities of DBE in aqueous solutions increased up to 240 times compared to dabigatran etexilate methanesulfonate, a commonly used salt form of DBG [32]. Hence, DBE monohydrate and anhydrate have the potential to replace other salt forms of DBG.

4. Conclusions

In this study, DBG edisylate (DBE) was composed of an antithrombotic active pharmaceutical ingredient (API), Dabigatran etexilate (DBG), and edisilic acid, was developed through a reaction crystallization technique. By means of single crystal X-ray diffraction (SXD) analysis, the crystal structure of the DBE crystal was confirmed to be a monohydrate of hemi-edisylate which DBG molecule and water molecule were attached to by hydrogen bonding and the edisylate, forming an ionic bonding. Then, anhydrate crystals of DBE were obtained after 70 h drying of DBE monohydrate under 40 °C. Through PXRD, DSC, TGA, and solution-state NMR analysis methods, DBE anhydrate and monohydrate crystals were characterized and designated each as monohydrate for DBE monohydrate and anhydrate for DBE anhydrate. Th acquirement of single crystal of DBE anhydrate was impossible due to its thin dendritic crystal form, thus solid-state CP/MAS 13C-NMR was utilized for the prediction of crystal conformation and the formation of hydrogen bonding. Additionally, to examine the solid-state phase transformation of DBE monohydrate and anhydrate, observations were made in hot-state microscopy (HSM) in PXRD and TGA analysis. As a result, the phase transformation from monohydrate → amorphous → anhydrate was confirmed. In addition, DBE anhydrate crystals were stored in hygroscopic tester under RH 53%, 63%, and 75% for 3 days to test moisture absorbance. TGA analysis confirmed that anhydrate does not absorb moisture and exists in an anhydrate form. Hence, DBE monohydrate is the metastable crystal form, and the anhydrate is the stable form. In conclusion, this study provides important basic research to select or to control the novel salt form of DBE crystal form.

Supplementary Materials

The following supporting information can be downloaded at: https://www.mdpi.com/article/10.3390/cryst13030424/s1, Figure S1: Simulated PXRD pattern and Powder PXRD pattern for DBE monohydrate; Figure S2: Solution-state 1H-NMR spectra of DBG and DBE (solvent: DMSO-d6): (a) 1 ppm–5 ppm, (b) 6 ppm–10.5 ppm; Figure S3: Solution-state 13C-NMR spectra of DBG and DBE (solvent: DMSO-d6); Figure S4: Solution-state 2D NMR 1H-1H COSY spectra of DBG and DBE (solvent: DMSO-d6); Figure S5: Solution-state 2D NMR 1H-13C HSQC spectra of DBG and DBE (solvent: DMSO-d6); Figure S6: Solution-state 2D NMR 1H-13C HMBC spectra of DBG and DBE (solvent: DMSO-d6); Figure S7: TGA curves of DBE form-II after 3 days storage at relative humidity (RH) 53%, 64%, 75% conditions (heating rate 10 °C/min, temperature range 30 °C–300 °C); Figure S8. Powder PXRD pattern of DBE anhydrate after 3 days storage at relative humidity (RH) 53%, 64%, 75% conditions; Video S1: HSM thermal scanning result of DBE monohydrate; CCDC 1825363 contains the supplementary crystallographic data for this paper. These data can be obtained free of charge via http://www.ccdc.cam.ac.uk/perl/catreq.cgi (accessed on 1 January 2023) (or from the CCDC, 12 Union Road, Cambridge CB2 1EZ, UK; Fax: +44-1223-336033; E-mail: deposit@ccdc.cam.ac.uk).

Author Contributions

Conceptualization, W.-S.K. and J.-H.A.; methodology, J.F., C.L., S.N., H.Y. and J.-H.A.; investigation, J.F., C.L., S.N., W.Y. and J.-H.A.; visualization, W.Y. and H.Y.; writing—original draft preparation, C.L., H.Y. and J.-H.A.; writing—review and editing, C.L., S.N., W.Y., H.Y., W.-S.K. and J.-H.A. All authors have read and agreed to the published version of the manuscript.

Funding

This research was funded by National Research Foundation of Korea, grant number NRF- Grant NRF-2021R1A5A6002853 and research funds for newly appointed professors of Jeonbuk National University in 2020.

Data Availability Statement

The raw data supporting the conclusions of this article will be made available by the authors upon request.

Conflicts of Interest

The authors declare no conflict of interest. The funders had no role in the design of the study; in the collection, analyses, or interpretation of data; in the writing of the manuscript; or in the decision to publish the results.

References

  1. Hilfiker, R. Polymorphism in the Pharmaceutical Industry; Wiley-VCH: Weinheim, Germany, 2006; Chapter 1; pp. 1–19. [Google Scholar]
  2. Hu, S.; Mishra, M.K.; Sun, C.C. Twistable Pharmaceutical Crystal Exhibiting Exceptional Plasticity and Tabletability. Chem. Mater. 2019, 31, 3818–3822. [Google Scholar] [CrossRef]
  3. Bolla, G.; Sarma, B.; Namgia, A.K. Crystal Engineering of Pharmaceutical Cocrystals in the Discovery and Development of Improved Drugs. Chem. Rev. 2022, 13, 11514–11603. [Google Scholar] [CrossRef] [PubMed]
  4. Zheng, Q.; Unruh, D.K.; Hutchins, K.M. Cocrystallization of Trimethoprim and Solubility Enhancement via Salt Formation. Cryst. Growth Des. 2021, 21, 1507–1517. [Google Scholar] [CrossRef]
  5. Bharate, S.S. Recrnt developments in pharmaceutical aslts: FDA approvals from 2015 to 2019. Drug Discov. Today. 2020, 26, 384–398. [Google Scholar] [CrossRef] [PubMed]
  6. Gunnam, A.; Nangia, A.K. High-Solubility Salts of the Multiple Sclerosis Drug Teriflunomide. Cryst. Growth Des. 2019, 19, 5407–5417. [Google Scholar] [CrossRef]
  7. Chemburkar, S.R.; Bauer, J.; Deming, K.; Spiwek, H.; Patel, K.; Morris, J.; Henry, R.; Spanton, S.; Dziki, W.; Porter, W.; et al. Dealing with the Impact of Ritonavir Polymorphs on the Late Stages of Bulk Drug Process Development. Org. Process Res. Dev. 2000, 4, 413–417. [Google Scholar] [CrossRef]
  8. Rietveld, I.B.; Céolin, R. Rotigotine: Unexpected Polymorphism with Predictable Overall Monotropic Behavior. J. Pharm. Sci. 2015, 104, 4117–4122. [Google Scholar] [CrossRef]
  9. Santos, O.M.M.; Reis, M.E.D.; Jacon, J.T.; Lino, M.E.S.; Simões, J.S.; Doriguetto, A.C. Polymorphism: An evaluation of the potential risk to the quality of drug products from the Farmácia Popular Rede Própria. Braz. J. Pharm. Sci. 2014, 50, 1–24. [Google Scholar] [CrossRef] [Green Version]
  10. Waters, C. The Development of the Rotigotine Transdermal Patch A Historical Perspective. Neurol. Clin. 2013, 31, S37–S50. [Google Scholar] [CrossRef] [Green Version]
  11. An, J.-H.; Jin, F.; Kim, H.S.; Ryu, H.C.; Kim, J.S.; Kim, H.M.; Kim, K.H.; Kiyonga, A.N.; Jung, K. Investigation of the Polymorphic Transformation of the Active Pharmaceutical Ingredient Clopidogrel Bisulfate Using the Ionic Liquid AEImBF4. Cryst. Growth Des. 2016, 16, 1829–1836. [Google Scholar] [CrossRef]
  12. An, J.-H.; Jin, F.; Kim, H.S.; Ryu, H.C.; Kim, J.S.; Kim, H.M.; Kiyonga, A.N.; Min, D.S.; Youn, W.; Kim, K.H.; et al. Application of ionic liquid to polymorphic transformation of antiviral/HIV drug adefovir dipivoxil. Arch. Pharm. Res. 2016, 39, 646–659. [Google Scholar] [CrossRef]
  13. An, J.-H.; Choi, G.J.; Kim, W.S. Polymorphic and kinetic investigation of adefovir dipivoxil during phase transformation. Int. J. Pharm. 2012, 422, 185–193. [Google Scholar] [CrossRef]
  14. Davey, R.; Garside, J. From Molecules to Crystallizers an Introduction to Crystallization; Oxford University Press: Oxford, NY, USA, 2000; Chapter 6; pp. 48–52. [Google Scholar]
  15. Yada, S.; Ohya, M.; Ohuchi, Y.; Hamaura, T.; Wakiyama, N.; Usui, F.; Kusai, A.; Yamamoto, K. Solid phase transition of CS-891 enantiotropes during grinding. Int. J. Pharm. 2003, 255, 69–79. [Google Scholar] [CrossRef]
  16. Mura, P.; Cirri, M.; Faucci, M.; Ginès-Dorado, J.; Bettinetti, G. Investigation of the effects of grinding and co-grinding on physicochemical properties of glisentide. J. Pharm. Biomed. Anal. 2002, 30, 227–237. [Google Scholar] [CrossRef]
  17. Miyamae, A.; Kema, H.; Kawabata, T.; Yasuda, T.; Otsuka, M.; Matsuda, Y. X-ray powder diffraction study on the grinding effect of the polymorphs of a novel and orally effective uricosuric agent: FR76505. Drug Dev. Ind. Pharm. 1994, 20, 2881–2897. [Google Scholar] [CrossRef]
  18. Otsuka, M.; Otsuka, K.; Kaneniwa, N. Relation Between Polymorphic Transformation Pathway During Grinding and the Physicochemical Properties of Bulk Powders for Pharmaceutical Preparations. Drug Dev. Ind. Pharm. 1994, 20, 1649–1660. [Google Scholar] [CrossRef]
  19. Bartolomei, M.; Bertocchi, P.; Ramusino, M.C.; Santucci, N.; Valvo, L. Physico-chemical characterisation of the modifications I and II of (R,S) propranolol hydrochloride: Solubility and dissolution studies. J. Pharm. Biomed. Anal. 1999, 21, 299–309. [Google Scholar] [CrossRef]
  20. Chieng, N.; Rades, T.; Aaltonen, J. An overview of recent studies on the analysis of pharmaceutical polymorphs. J. Pharm. Biomed. Anal. 2011, 55, 618–644. [Google Scholar] [CrossRef]
  21. Puigjaner, C.; Barbas, R.; Portell, A.; Font-Bardia, M.; Alcobé, X.; Prohens, R. Revisiting the Solid State of Norfloxacin. Cryst. Growth Des. 2010, 10, 2948–2953. [Google Scholar] [CrossRef]
  22. Maher, A.; Seaton, C.C.; Hudson, S.; Croker, D.M.; Rasmuson, Å.C.; Hodnett, B.K. Investigation of the Solid-State Polymorphic Transformations of Piracetam. Cryst. Growth Des. 2012, 12, 6223–6233. [Google Scholar] [CrossRef] [Green Version]
  23. Chernyshev, V.V.; Yatsenko, A.V.; Pirogov, S.V.; Nikulenkova, T.F.; Tumanova, E.V.; Lonin, I.S.; Paseshnichenko, K.A.; Mironov, A.V.; Velikodny, Y.A. Two Anhydrous and a Trihydrate Form of Tilorone Dihydrochloride: Hydrogen-Bonding Patterns and Reversible Hydration/Dehydration Solid-State Transformation. Cryst. Growth Des. 2012, 12, 6118–6125. [Google Scholar] [CrossRef]
  24. Teychene, S.; Autret, J.; Biscans, B.J. Determination of solubility profiles of eflucimibe polymorphs: Experimental and modeling. Pharm. Sci. 2006, 95, 871–882. [Google Scholar] [CrossRef] [PubMed]
  25. O’Mahony, M.A.; Maher, A.; Croker, D.M.; Rasmuson, Å.C.; Hodnett, B.K. Examining Solution and Solid State Composition for the Solution-Mediated Polymorphic Transformation of Carbamazepine and Piracetam. Cryst. Growth Des. 2012, 12, 1925–1932. [Google Scholar] [CrossRef] [Green Version]
  26. Bannigan, P.; Zeglinski, J.; Lusi, M.; O’Brien, J.; Hudson, S.P. Investigation into the Solid and Solution Properties of Known and Novel Polymorphs of the Antimicrobial Molecule Clofazimine. Cryst. Growth Des. 2016, 16, 7240–7250. [Google Scholar] [CrossRef]
  27. Nyström, M.; Roine, J.; Murtomaa, M.; Sankaran, R.M.; Santos, H.A.; Salonen, J. Solid state transformations in consequence of electrospraying—A novel polymorphic form of piroxicam. Eur. J. Pharm. Biopharm. 2015, 89, 182–189. [Google Scholar] [CrossRef]
  28. Pallipurath, A.R.; Skelton, J.M.; Warren, M.R.; Kamali, N.; McArdle, P.; Erxleben, A. Sulfamerazine: Understanding the Influence of Slip Planes in the Polymorphic Phase Transformation through X-Ray Crystallographic Studies and ab Initio Lattice Dynamics. Mol. Pharm. 2015, 12, 3735–3748. [Google Scholar] [CrossRef] [Green Version]
  29. Zhu, B.; Wang, J.-R.; Mei, X. Insight into the Phase Transformation among Various Solid Forms of Baicalein. Cryst. Growth Des. 2015, 15, 4959–4968. [Google Scholar] [CrossRef]
  30. Hauel, N.; Priepke, H.; Ries, U.; Stassen, J.M.; Wienen, W. Disubstituted Bicyclic Heterocycles, the Preparations and the Use Thereof as Pharmaceutical Compositions. U.S. Patent 6087380, 11 July 2000. [Google Scholar]
  31. Schmid, R.; Sieger, P.; Sobotta, R. 3-[(2-{[4-(hexyloxycarbonylaminoiminomethyl) phenylamino] methyl}-1-methyl-1h-benzimidazol-5-carbonyl) pyridin-2-ylamino] Propionic Acid Ethylester Methansulfonate and Its Use as a Medicament. U.S. Patent 7932273 B2, 26 April 2011. [Google Scholar]
  32. An, J.-H.; Ko, M.J. The Polymorph of Novel Dabigatran Etexilate Hemi-Salt and the Manufcturung Method Thereof. K.R. Patent 102147600 B1, 25 August 2020. [Google Scholar]
  33. Liu, H.-Q.; Zhang, W.-G.; Cai, Z.-Q.; Xu, W.-R.; Shen, X.-P. Dabigatran etexilate tetrahydrate. Acta Crystallogr. Sect. E. Struct. Rep. Online 2012, E68, o3385. [Google Scholar] [CrossRef]
  34. Nagadeep, J.; Kamaraj, P.; Arthanareeswari, M. Gradient RP-HPLC method for the determination of potential impurities in dabigatran etexilate in bulk drug and capsule formulations. Arab. J. Chem. 2019, 12, 3431–3443. [Google Scholar] [CrossRef] [Green Version]
  35. Harris, R.K. Applications of solid-state NMR to pharmaceutical polymorphism and related matters. J. Pharm. Pharmacol. 2007, 59, 225–239. [Google Scholar] [CrossRef]
Figure 1. Molecular structure with atom numbers: (a) Dabigatran Etexilate (DBG), (b) Edisilic acid.
Crystals 13 00424 g001
Figure 2. Crystal structure of DBE monohydrate: (a) Protons of the O(7) atoms of the edisilic acid were transferred to the N(2) atoms; (b) Intermolecular hydrogen bonds between DBE and water molecules; (c) Intermolecular hydrogen bonds between DBE molecules; (d) Crystal structure of DBE showing the 3-D network.
Crystals 13 00424 g002aCrystals 13 00424 g002b
Figure 3. Conformation of DBG molecule with respect to C20-C24-N6-C30 and C20-C24-N6-C25 rotations. (a) DBE monohydrate, (b) DBG tetrahydrate.
Crystals 13 00424 g003
Figure 4. Powder X-ray diffraction (PXRD) pattern of DBE crystal forms.
Crystals 13 00424 g004
Figure 5. Results of thermal analysis of DBE crystal forms (10 °C/min): (a) Differential Scanning Calorimetry (DSC), (b) Thermogravimetric Analysis (TGA).
Crystals 13 00424 g005
Figure 6. Solution-state 13C-NMR (DMSO-d6) and Solid-State CP/MAS 13C-NMR data of DBE crystal forms (a) 0 ppm–80 ppm, (b) 100 ppm–210 ppm (Numbers on the peaks are related to numbers in Figure 1 structure and peak location).
Crystals 13 00424 g006
Figure 7. DSC heating-cooling-heating scanning (10 °C/min) curve of DBE monohydrate crystal: first-heating (black, temperature range: 30 °C–160 °C), first-cooling (blue, temperature range: 160 °C–30 °C), second-heating (red, temperature range: 30 °C–190 °C).
Crystals 13 00424 g007
Figure 8. Hot-stage microscopy (HSM) thermal scanning (heating rate 10 °C/min, temperature range: 30 °C–200 °C) of DBE monohydrate: (a) 90 °C, (b) 106 °C, (c) 110 °C, (d) 112 °C, (e) 113 °C, (f) 115 °C, (g) 118 °C, (h) 123 °C.
Crystals 13 00424 g008
Figure 9. Phase transformation analysis of DBE monohydrate crystals obtained during HSM thermal scanning at 90 °C, 110 °C, 115 °C, 123 °C: (a) Powder X-ray diffraction (PXRD) pattern, (b) Thermogravimetric Analysis (TGA) data (heating rate 10 °C/min, temperature range: 30 °C–300 °C).
Crystals 13 00424 g009
Figure 10. DBE phase transformation diagram utilizing DSC-HSM (heating rate 10 °C/min, temperature range 30 °C–220 °C).
Crystals 13 00424 g010
Table 1. Crystal data and structure refinement for DBE monohydrate [32].
ParameterDBE Hydrate Crystal
Chemical formula sumC35 H46 N7 O9 S
Formula weight, amu740.85
Crystal systemTriclinic
Space groupP 1 ¯
a, Å7.7793 (4)
b, Å8.7050 (5)
c, Å28.3967 (15)
α (°)84.172 (2)
β (°)88.831 (1)
γ (°)69.599 (2)
Cell volume (Å3)1792.83 (17)
Z2
Temperature, K150 (1)
RadiationGraphite monochromated MoKα (λ = 0.71073 Å)
Linear absorption coefficient, mm−10.155
Crystal size, mm30.50 × 0.38 × 0.08
Scan typeΩ
θ limits, deg.3.0° < θ < 26.00°
No. unique data7025
No. unique data with I > 2σ(I)5228
wR2 (all data)0.1328
R (on F o for I > 2σ(I))0.0492
Goodness-of-fit on F21.079
Min. and Max. residual electron density (e/Å3)−0.746 and 0.333
Table 2. Inter- and intra-molecular hydrogen bond in DBE monohydrate 1,2.
TypeDonor–H…AcceptorD–H (Å)H…A (Å)D…A (Å)D–H…A (°)
InterDN(1)–H(1B) … EO(6)i0.862.022.8299(2)156
DN(2)–H(2) … WO(9)iii0.861.952.7670(2)158
DN(3)–H(3A) … EO(7)v0.862.182.9450(2)148
WO(9)–H(9C) … DN(5)ii0.87(3)2.00(3)2.8552(2)168(3)
WO(9)–H(9D) … EO(6)0.94(6)2.04(5)2.9339(2)159(4)
IntraDN(1)–H(1A) … DO(1)0.862.032.6643(2)130
1 Symmetry codes: (i) 2−x, −y, 1−z; (ii) x, −1 + y, z; (iii) 1−x, 1−y, 1−z; (iv) 1−x, 3−y, -z; (v) −1 + x, 1 + y, z. 2 Molecule codes: (D) DBG; (E) Edisylate; (W) Water.
Disclaimer/Publisher’s Note: The statements, opinions and data contained in all publications are solely those of the individual author(s) and contributor(s) and not of MDPI and/or the editor(s). MDPI and/or the editor(s) disclaim responsibility for any injury to people or property resulting from any ideas, methods, instructions or products referred to in the content.

