Article

On the Oscillating Course of dhkl−sin2ψ Plots for Plastically Deformed, Cold-Rolled Ferritic and Duplex Stainless Steel Sheets

1
Institute for Applied Materials (IAM-WK)—Karlsruhe Institute of Technology (KIT), 76131 Karlsruhe, Germany
2
German Engineering Materials Science Center at DESY, Helmholtz-Zentrum Hereon, 22607 Hamburg, Germany
*
Author to whom correspondence should be addressed.
Crystals 2023, 13(3), 419; https://doi.org/10.3390/cryst13030419
Submission received: 8 February 2023 / Revised: 22 February 2023 / Accepted: 24 February 2023 / Published: 28 February 2023
(This article belongs to the Special Issue X-ray Diffraction on Crystalline Materials)

Abstract

:
This work deals with non-linear d h k l sin 2 ψ distributions, often observed in X-ray residual stress analysis of plastically deformed metals. Two different alloys were examined: duplex stainless steel EN 1.4362 with an austenite:ferrite volume ratio of 50:50 and ferritic stainless steel EN 1.4016. By means of an in situ experiment with high-energy synchrotron X-ray diffraction, the phase-specific lattice strain response under increasing tensile deformation was analysed continuously with a sampling rate of 0.5 Hz. From Debye–Scherrer rings of nine different lattice planes {hkl}, the d h k l sin 2 ψ distributions were evaluated and the phase-specific stresses were calculated. For almost all lattice planes investigated, oscillating courses in the d h k l sin 2 ψ distributions were observed, already occurring below the macro yield point and increasing in amplitude within the elasto-plastic region. By comparing the loaded and the unloaded state after deformation, the contribution of crystallographic texture and plastically induced intergranular strains to these oscillations could be separated. For the given material states, only a minor influence of crystallographic texture was observed. However, a strong dependence of the non-linearities on the respective lattice plane was found. In such cases, a stress evaluation according to the sin 2 ψ method leads to errors, which increase significantly if only a limited ψ range is considered.

1. Introduction

Duplex stainless steels are widely used in mechanical and chemical engineering due to their excellent combination of properties in terms of strength, ductility, and corrosion resistance. These advantageous material properties are achieved via the interaction of two phases, ferrite and austenite, which both exist in large volume fractions. Many manufacturing processes of metal components involve non-uniform plastic deformations and thereby cause the development of residual stresses. These ‘internal stresses’ are superimposed on the external loads during operation and can decisively influence the material behaviour, for example the service life of components subjected to cyclic loads [1]. In plastically deformed duplex stainless steels, phase-specific micro-residual stresses are observed, which are superimposed on the macro-residual stresses. These kinds of microstresses develop because the ferritic and austenitic phases differ in their mechanical behaviour. The sign and magnitude of the phase-specific micro-residual stresses are affected by the degree of plastic deformation and the phase-specific elasto-plastic behaviour, which depends, i.e., on the specific material composition, crystallographic texture, and previous heat treatments [2].
The most widely used method for the analysis of phase-specific residual stresses on polycrystalline materials is the sin 2 ψ method using X-ray diffraction [3]. The method is based on the measurement of diffraction lines from specific lattice plane families of type { h k l } of one phase under various sample inclinations ψ for a fixed azimuthal direction φ 
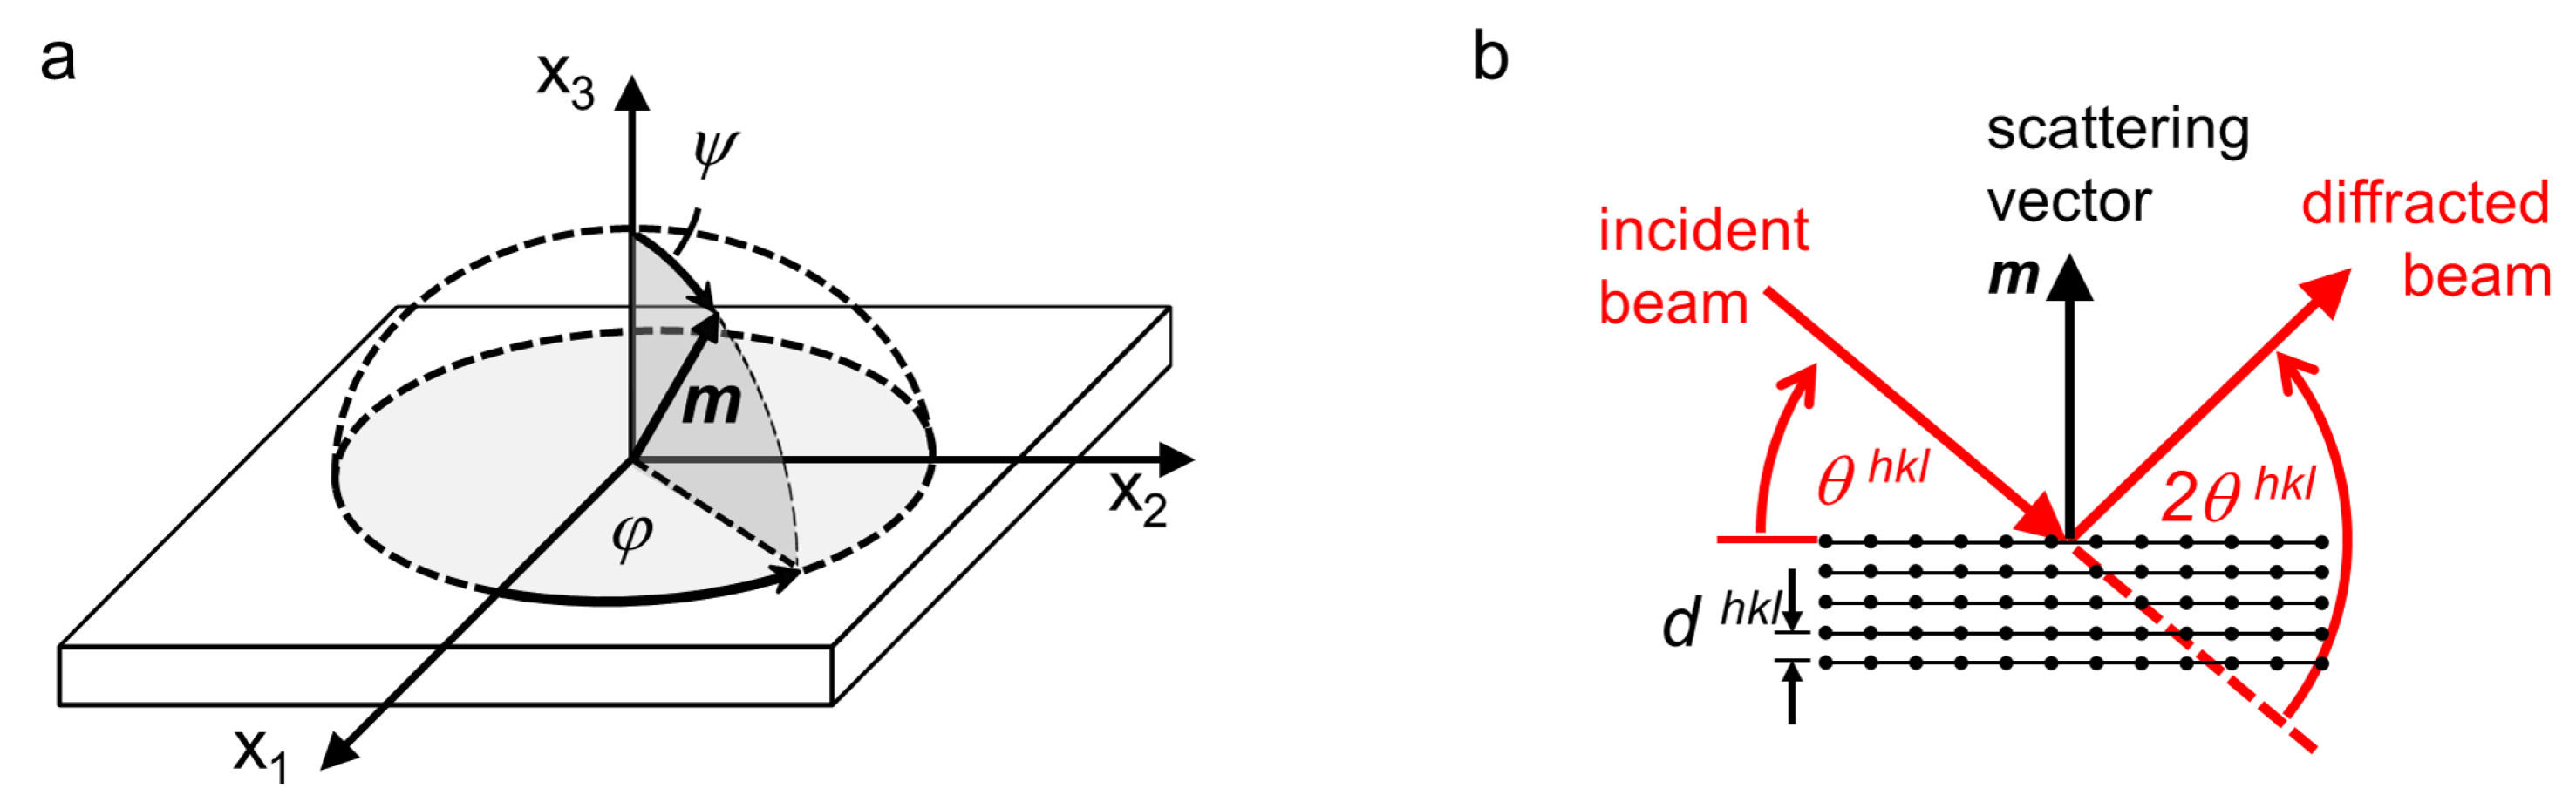
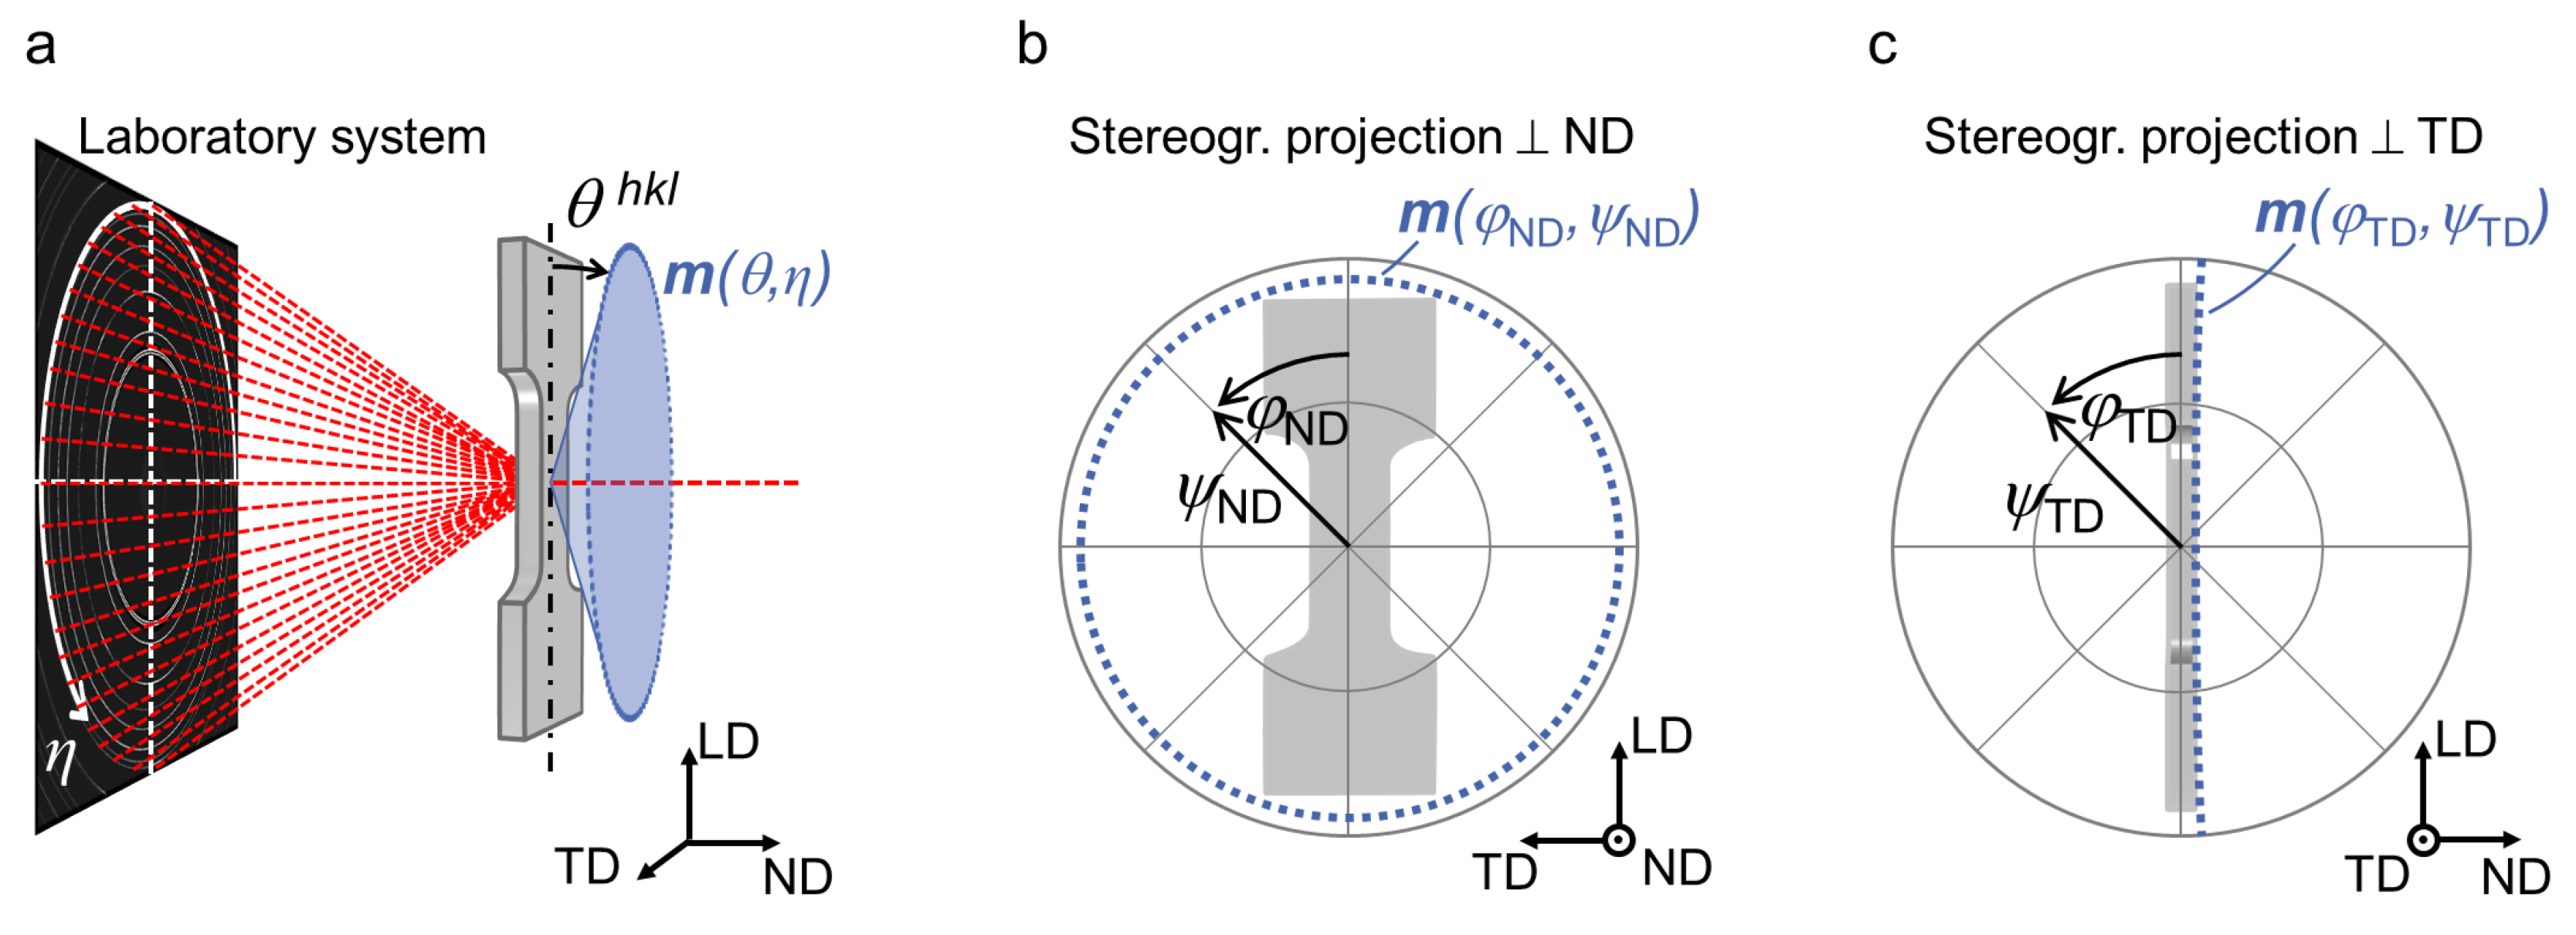
. A classical sample-fixed coordinate system, indicating angles ψ and φ , is shown in Figure 1a. Following Bragg’s law
d h k l = 1 2 n λ sin θ h k l , with n = 1 ,
the lattice spacing d h k l in the direction of the scattering vector m ( φ , ψ ) can be determined from the X-ray wavelength λ and diffraction angle θ h k l , as schematically depicted in Figure 1b. From d h k l , the lattice strain ε h k l is derived considering the lattice spacing d 0 h k l corresponding to the stress-free state.
In general, the stress calculation from the measured strain data is based on the assumption that the stress tensor, averaged over the measurement volume, causes a linear d h k l sin 2 ψ distribution. Linear distributions occur when there is a surface-parallel, uniaxial or biaxial stress state which is sufficiently homogeneous, i.e., shows no steep in-depth gradient within the information depth. Furthermore, the material volume irradiated by the X-rays must contain a sufficient number of randomly oriented grains, i.e., the grain sizes are very small in comparison to the irradiated sample volume [4]. If shear stresses are present normal to the specimen surface, the d h k l sin 2 ψ distribution shows an elliptical course. However, in cold-formed polycrystalline materials, pronounced non-linearities, i.e., oscillating courses in the d h k l sin 2 ψ plots, can occur. This is due to the phase-specific crystallographic texture (elastic anisotropy) and the plastically induced microstresses (plastic anisotropy), which are also denoted as intergranular stresses [5]. In situations that pronounced oscillations are observed, the sin 2 ψ method can lead to erroneous results and should no longer be applied. It is known that near-surface residual stress depth gradients can also cause non-linear d h k l sin 2 ψ distributions [1]. Because in-depth stress gradients play no role in this study, this is not further discussed.
The lattice spacing d h k l , determined by diffraction methods, always represents a selective mean value of those crystallite orientations whose lattice planes { h k l } are perpendicular to the respective measurement direction m ( φ , ψ ) . In terms of strain, this mean value can be separated into two parts: a mean strain part ε ¯ φ , ψ h k l , which is related to the mean stress tensor σ ¯ i j , and a second part ε φ , ψ h k l , pl . , which is related to orientation-dependent microstresses caused by previous plastic deformations [6]. At this point, it should be emphasised that the superscript ‘pl.’ does not indicate plastic strain; instead, it indicates elastic intergranular strain induced by plastic deformation. Generally, the relation between σ ¯ i j and ε ¯ h k l is described by stress factors F i j h k l , which can be calculated with knowledge of the single-crystal elastic anisotropy and the orientation distribution function (ODF) [7]. The crystallite coupling within the polycrystal is thereby taken into account using appropriate mathematical models, e.g., according to Voigt [8], Reuss [9] or Eshelby/Kröner [10,11]. A detailed description of the F i j calculation approaches following different models is given in [12]. The measured strain ε φ , ψ h k l in the direction m ( φ , ψ ) of a plastically deformed, polycrystalline material is calculated as follows [6]:
ε φ , ψ h k l = d φ , ψ h k l d 0 h k l d 0 h k l = i , j F i j h k l ( φ , ψ ) σ ¯ i j + ε φ , ψ h k l , pl . .
Thus, the plastically induced intergranular strains ε φ , ψ h k l , pl . are independent from the acting mean stress tensor and are instead due to the history of plastic deformation, which is usually not known.
Several works have already dealt with the experimental analysis of phase-specific stresses in plastically deformed duplex stainless steels, e.g., [13,14,15,16,17,18,19,20]. Although materials with comparable chemical compositions and similar phase fractions were examined, different conclusions were drawn regarding the phase-specific yield strength and the formation of phase-specific microstresses. On the one hand, this can be attributed to the fact that phase-specific strength is affected by the specific crystallographic texture (orientation strengthening) and by the differences in the precise phase-specific chemical composition (solid solution strengthening). On the other hand, different measurement and evaluation approaches were used, which can also lead to different stress results for such complex material states. A systematic study on the evolution of non-linear d h k l sin 2 ψ distributions for several lattice planes { h k l } caused by plastic deformation and the accompanying error in residual stress evaluation has not yet been performed. Usually, only the residual stress state is analysed. Without a comparison of the same material state under additional external loading, the influences of texture and intergranular strains cannot be easily separated. Furthermore, the data are frequently obtained by diffraction experiments using conventionally generated X-rays (lab X-ray applications) in reflection mode. In this case, mostly only a limited sin 2 ψ range is accessible due to the absorption at high inclination angles ( ψ ) or simply due to the geometric constraints of the applied measurement setup, and the oscillatory courses of d h k l vs. sin 2 ψ are not necessarily visible.
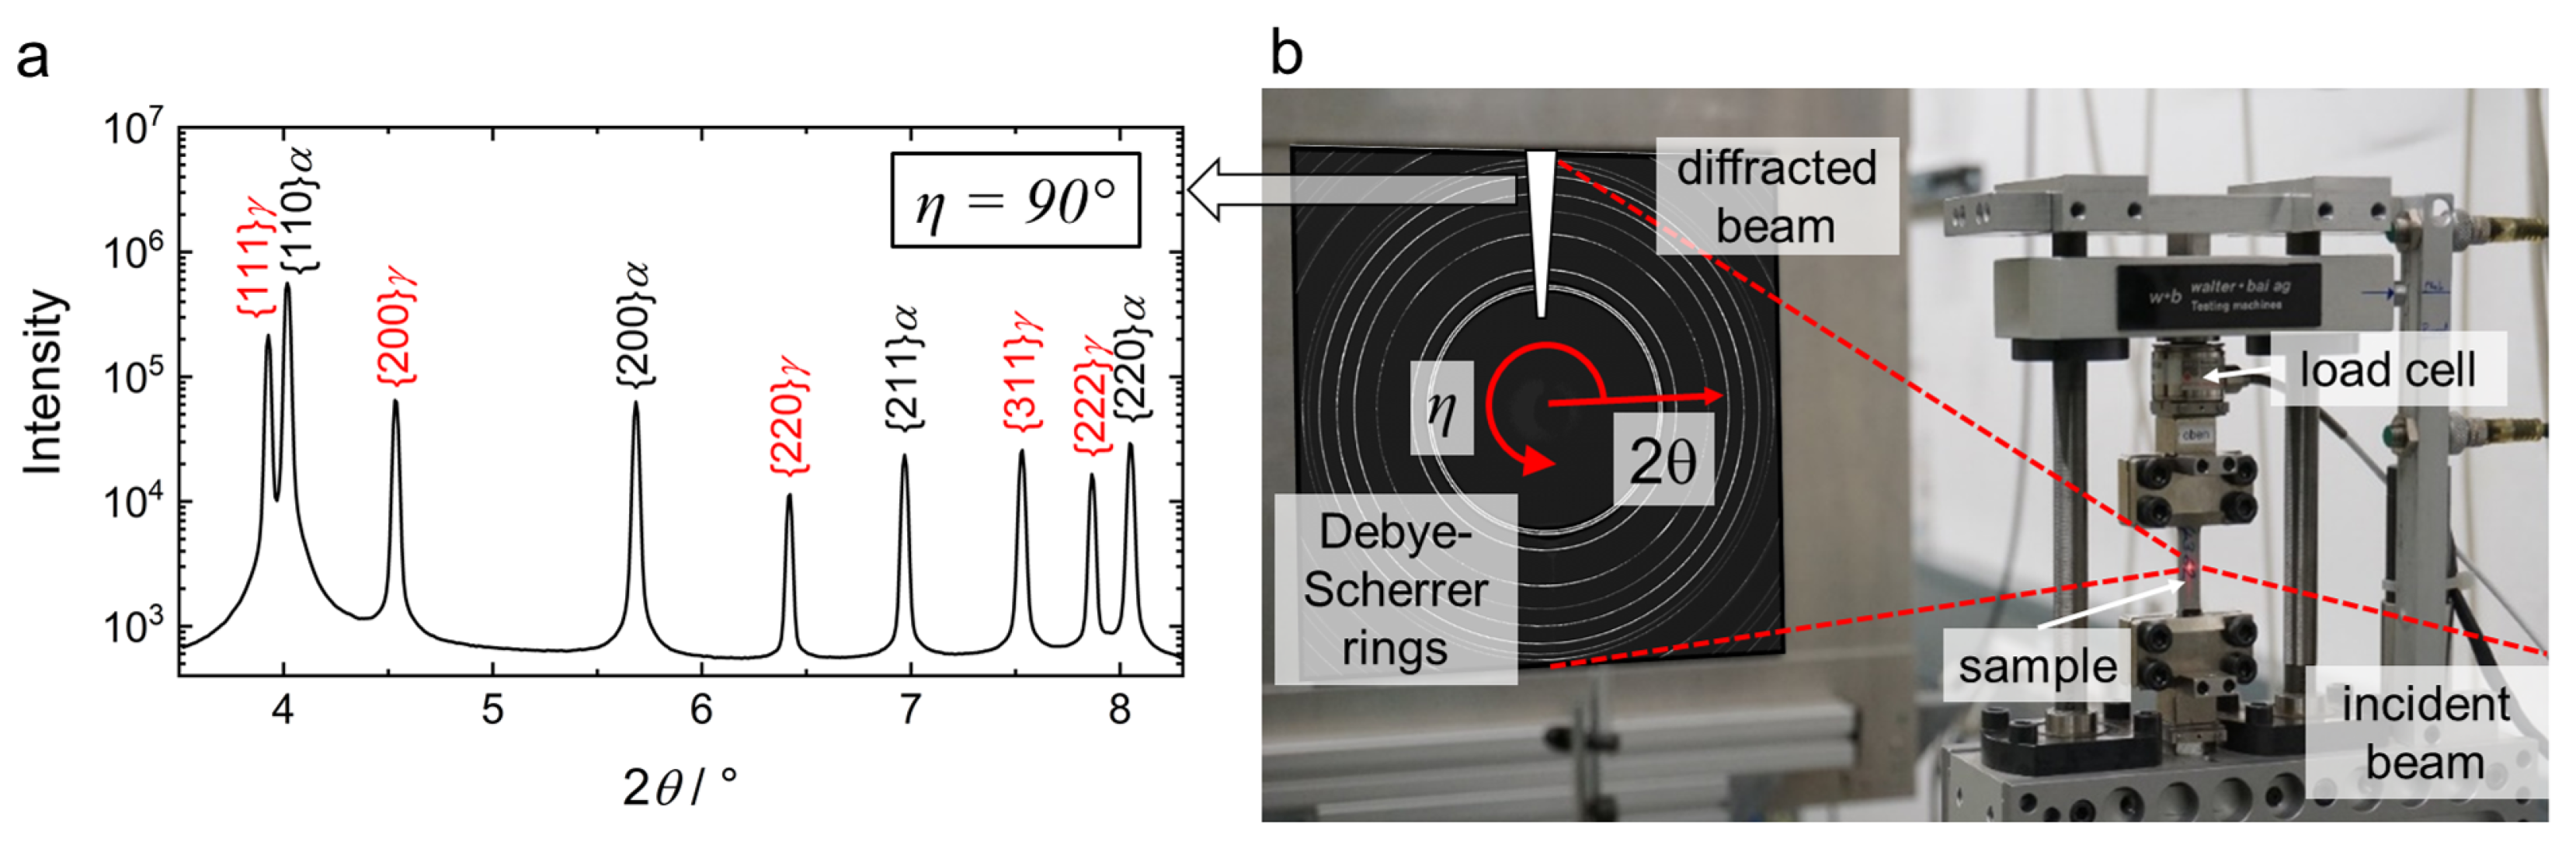
The use of high-energy synchrotron X-ray in transmission mode, however, enables the analysis of mean phase-specific stresses for metal samples having a thickness of up to a few millimetres. Here, the diffraction data contain integral information over the sample thickness; hence, depth gradients of the crystallographic texture or residual stresses are not resolved. In contrast, the information gained reflects an overall material response that is unaffected by local deviations due to near-surface effects. By means of a 2D detector, full diffraction rings of several lattice planes can be recorded for polycrystalline samples. After azimuthal segmentation of the diffraction pattern, the diffraction profiles can be analysed for various azimuthal directions. Using these means, d h k l sin 2 ψ distributions can be evaluated based on a single exposure [21,22]. This approach allows for the determination of lattice spacings with polar angles of up to | ψ | = 90 . Thus, it is a valuable tool for the systematic analysis of the development of oscillatory d h k l sin 2 ψ distributions with elastic and elasto-plastic deformations.
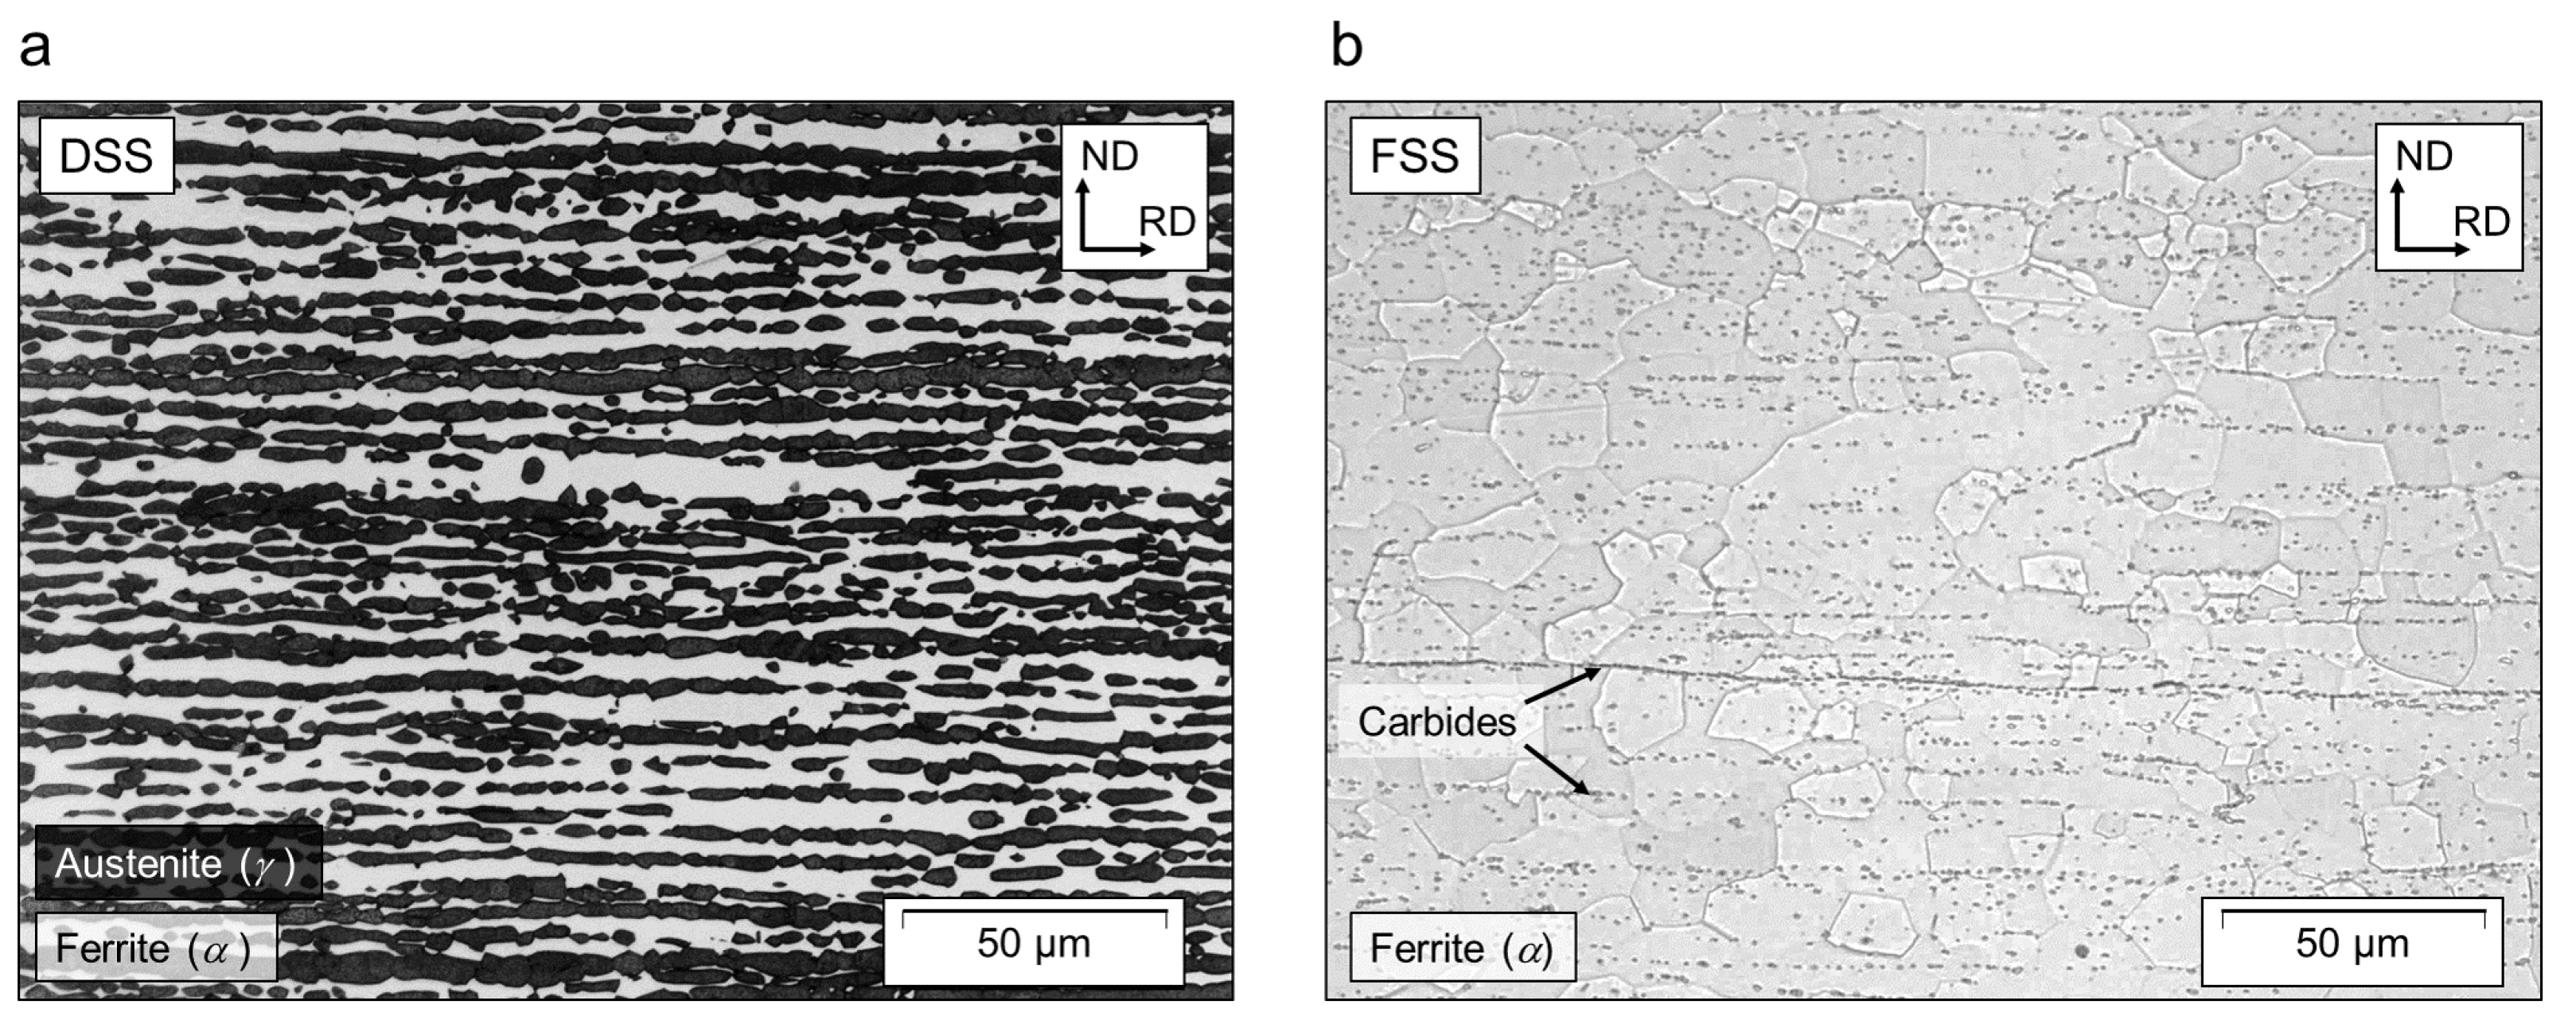
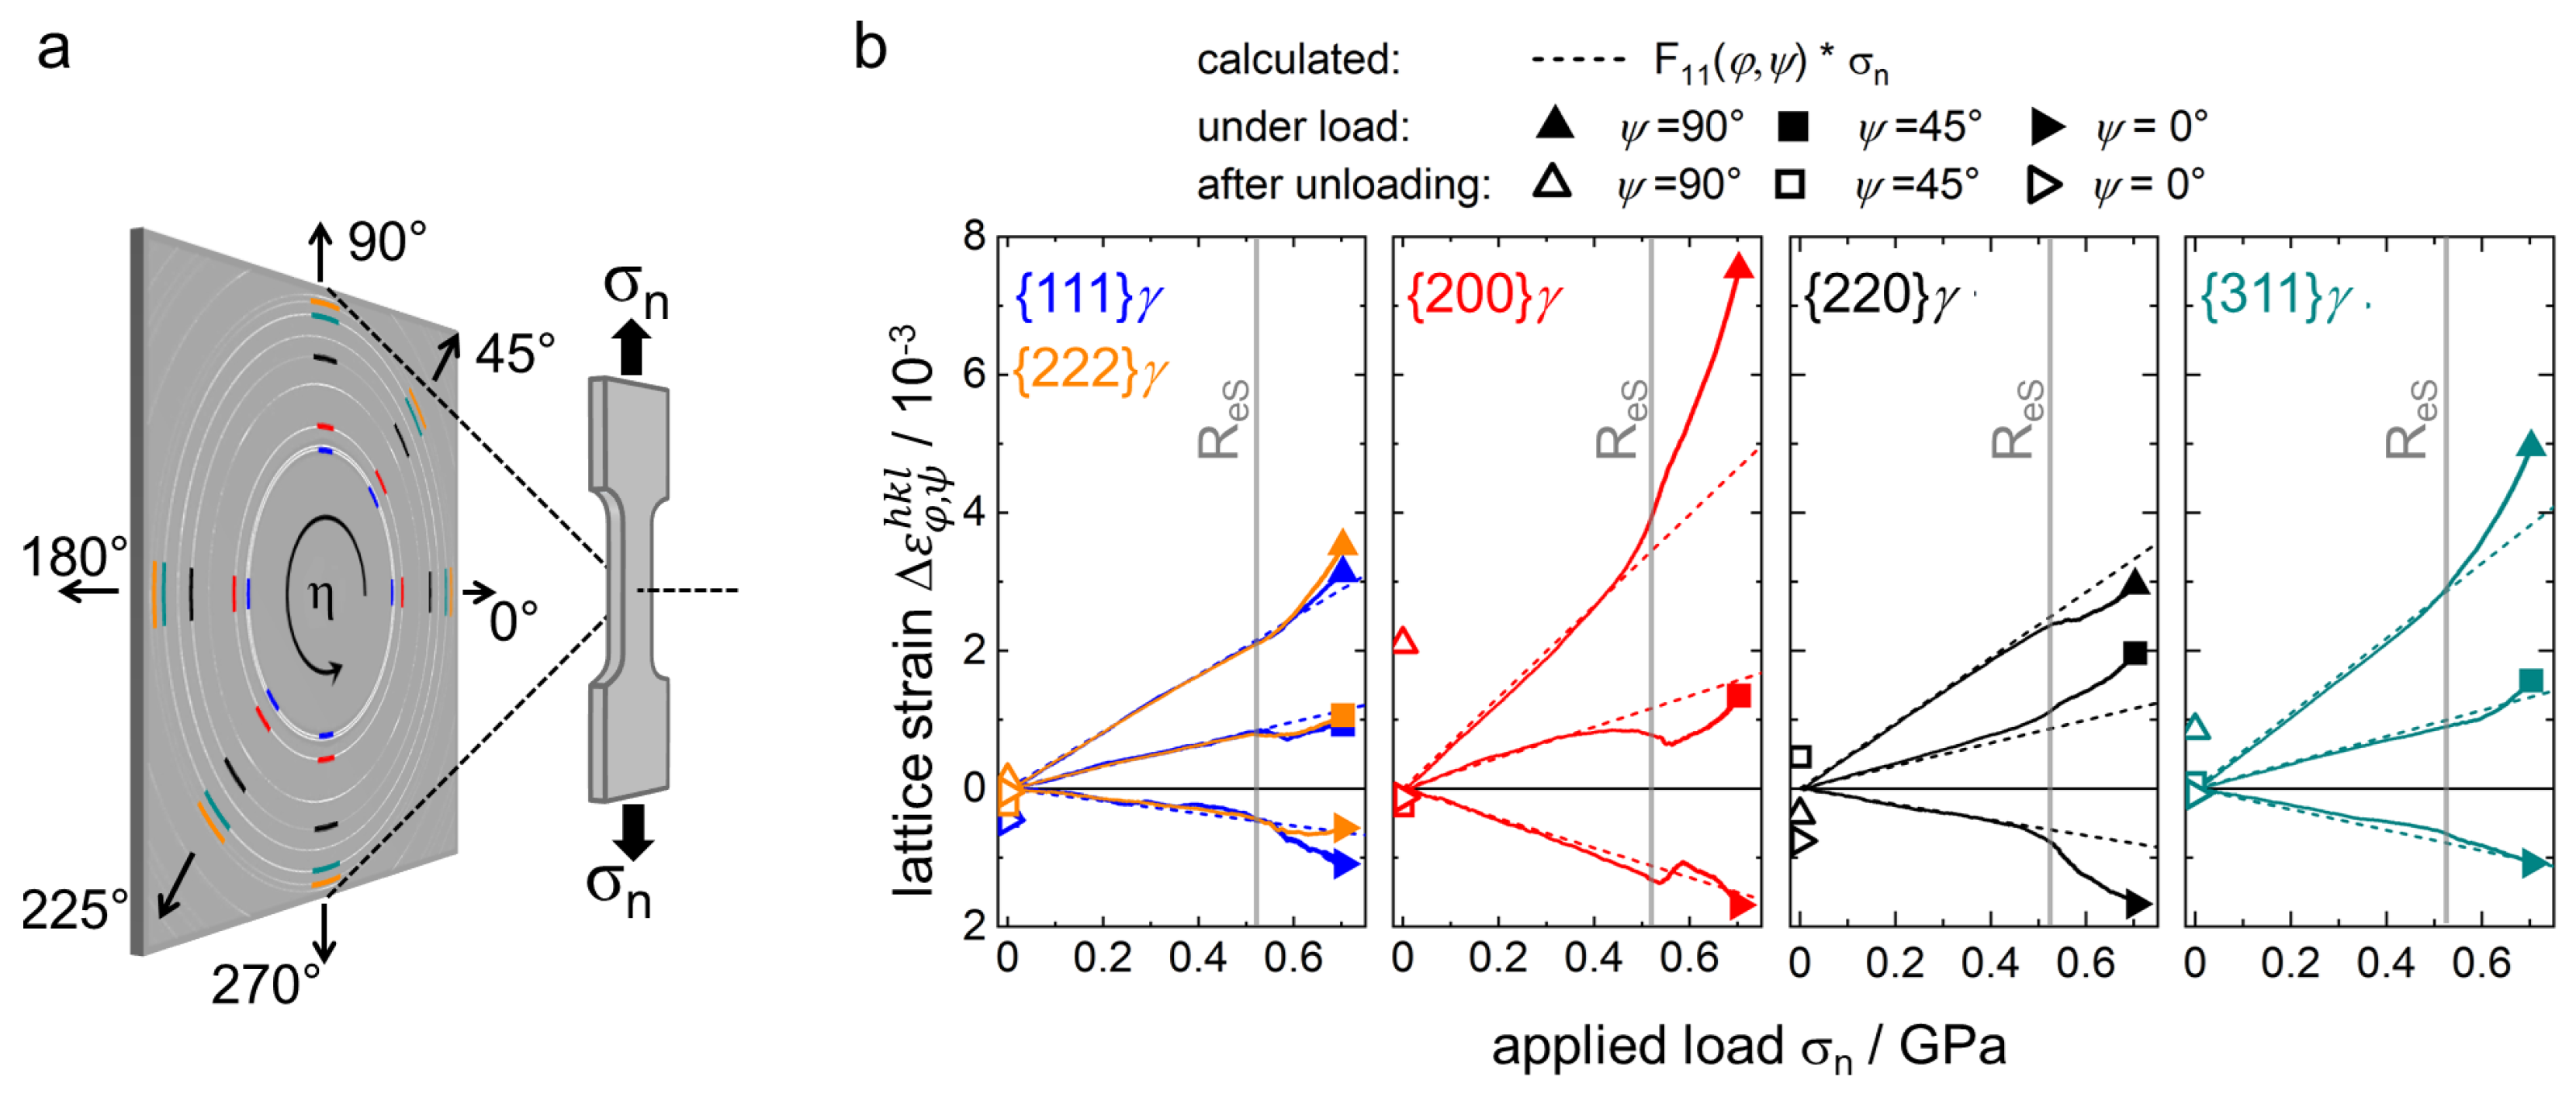
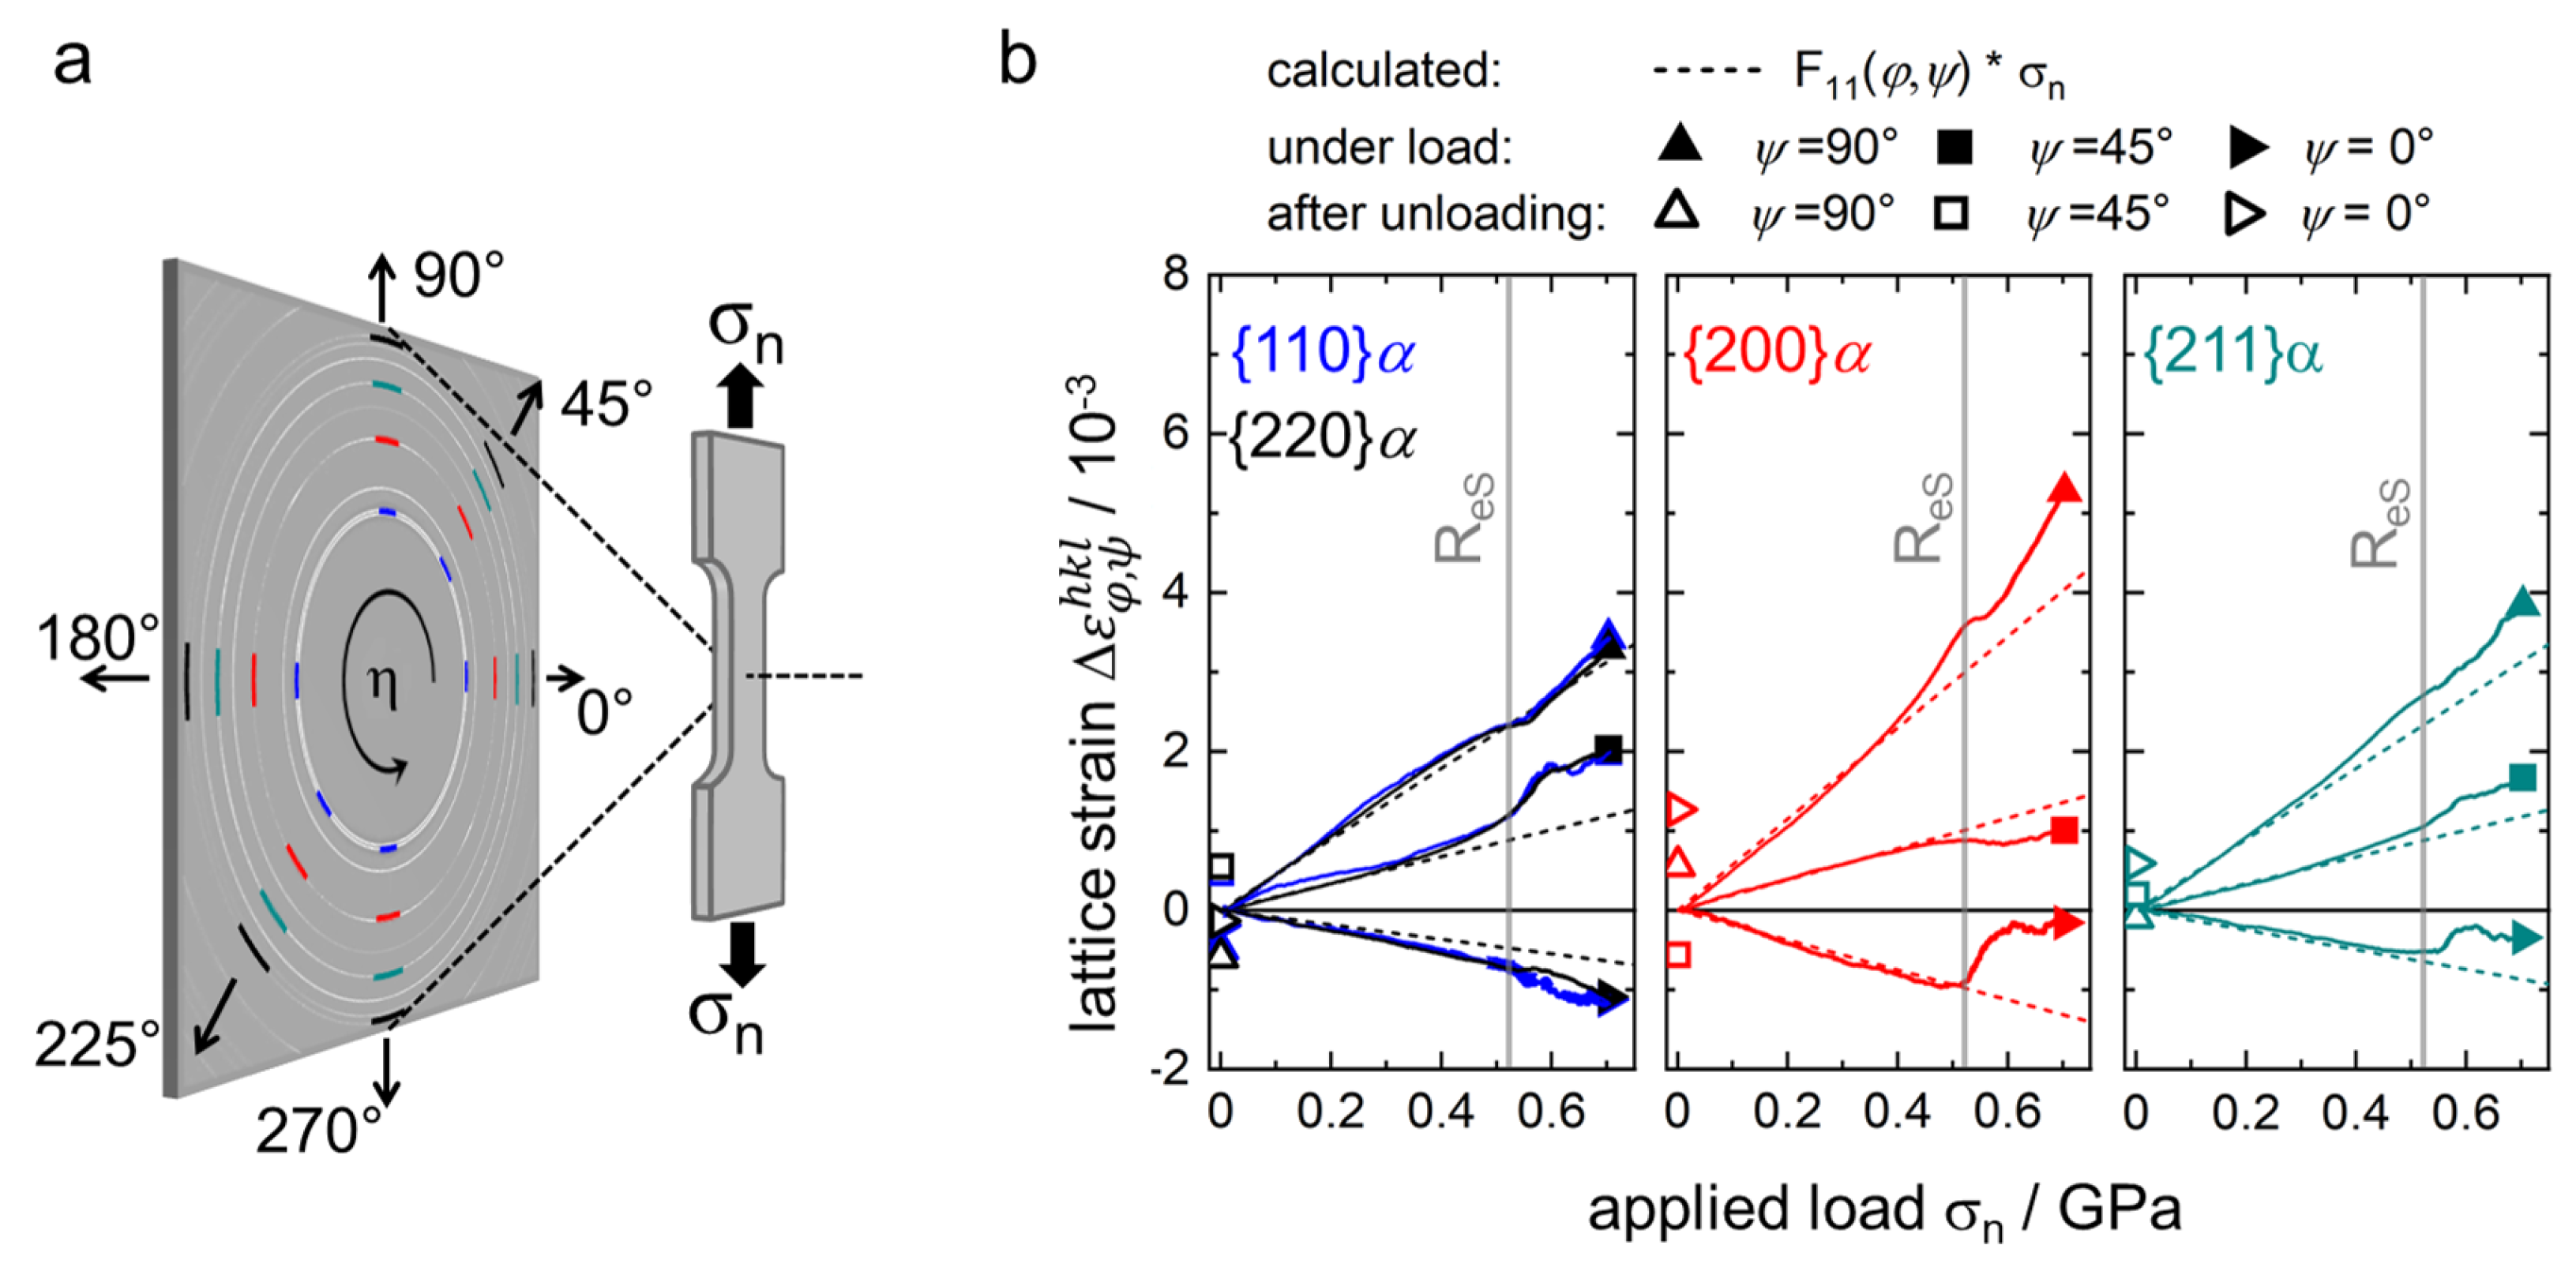
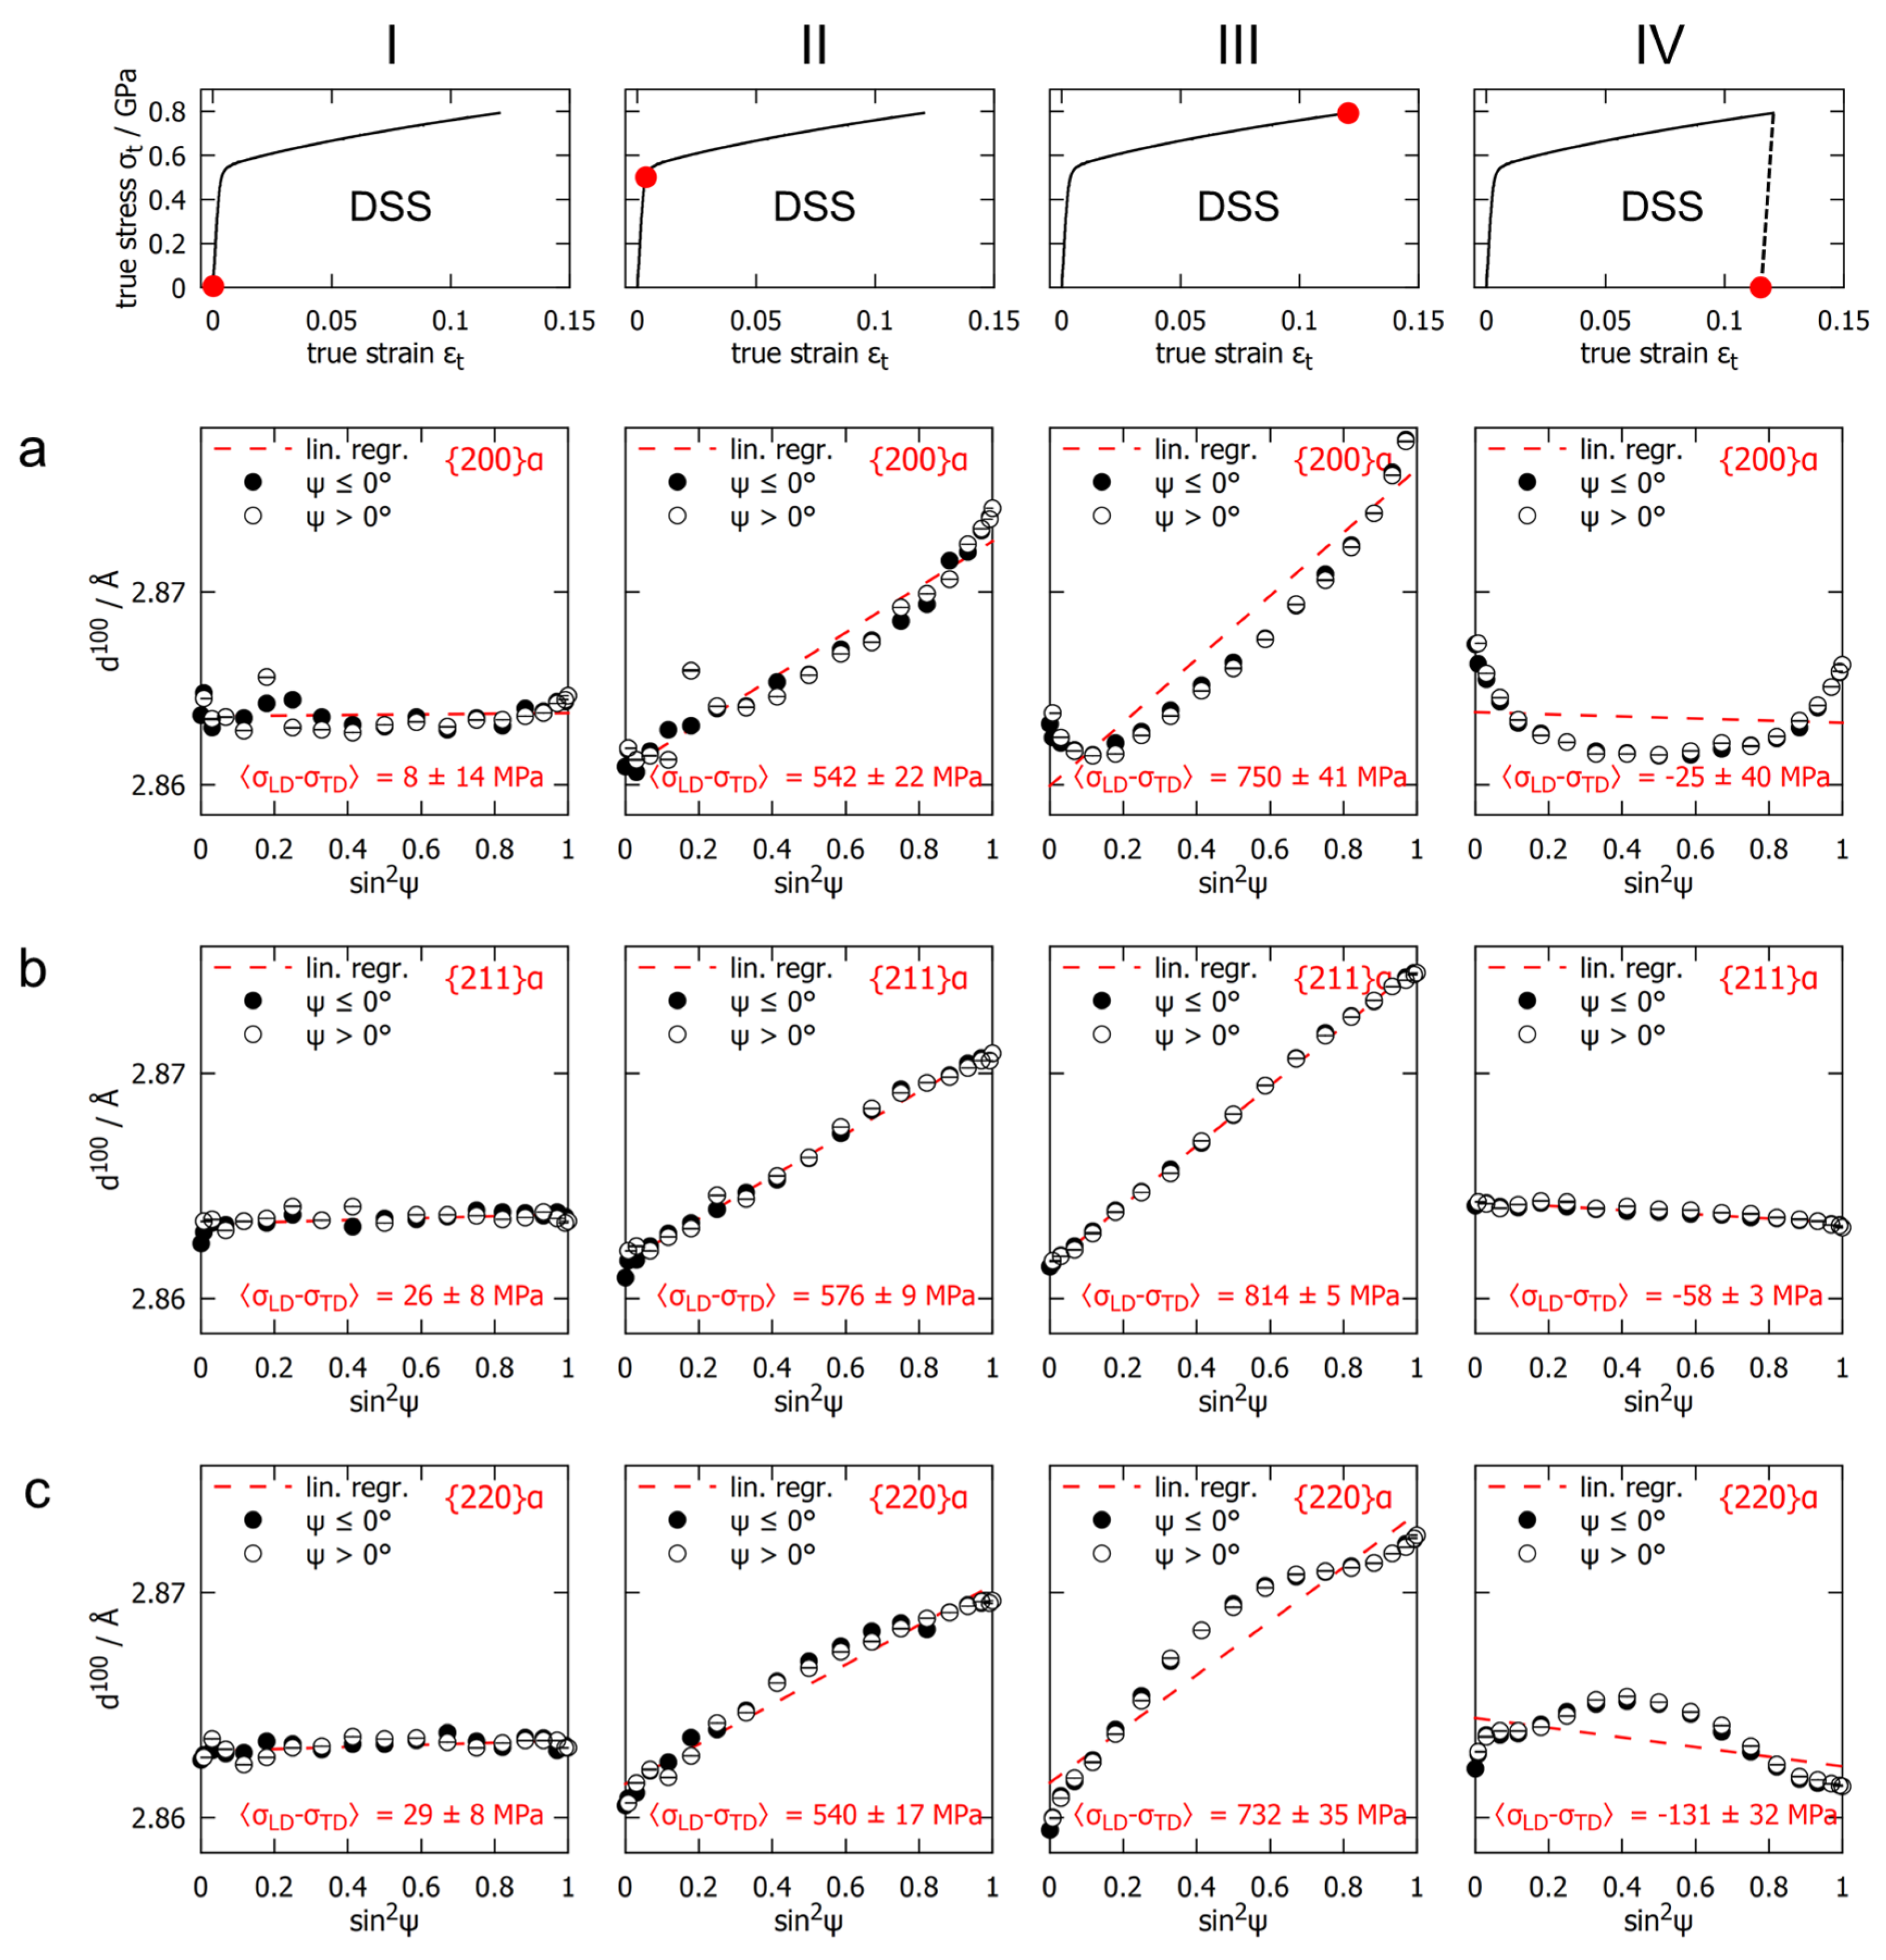
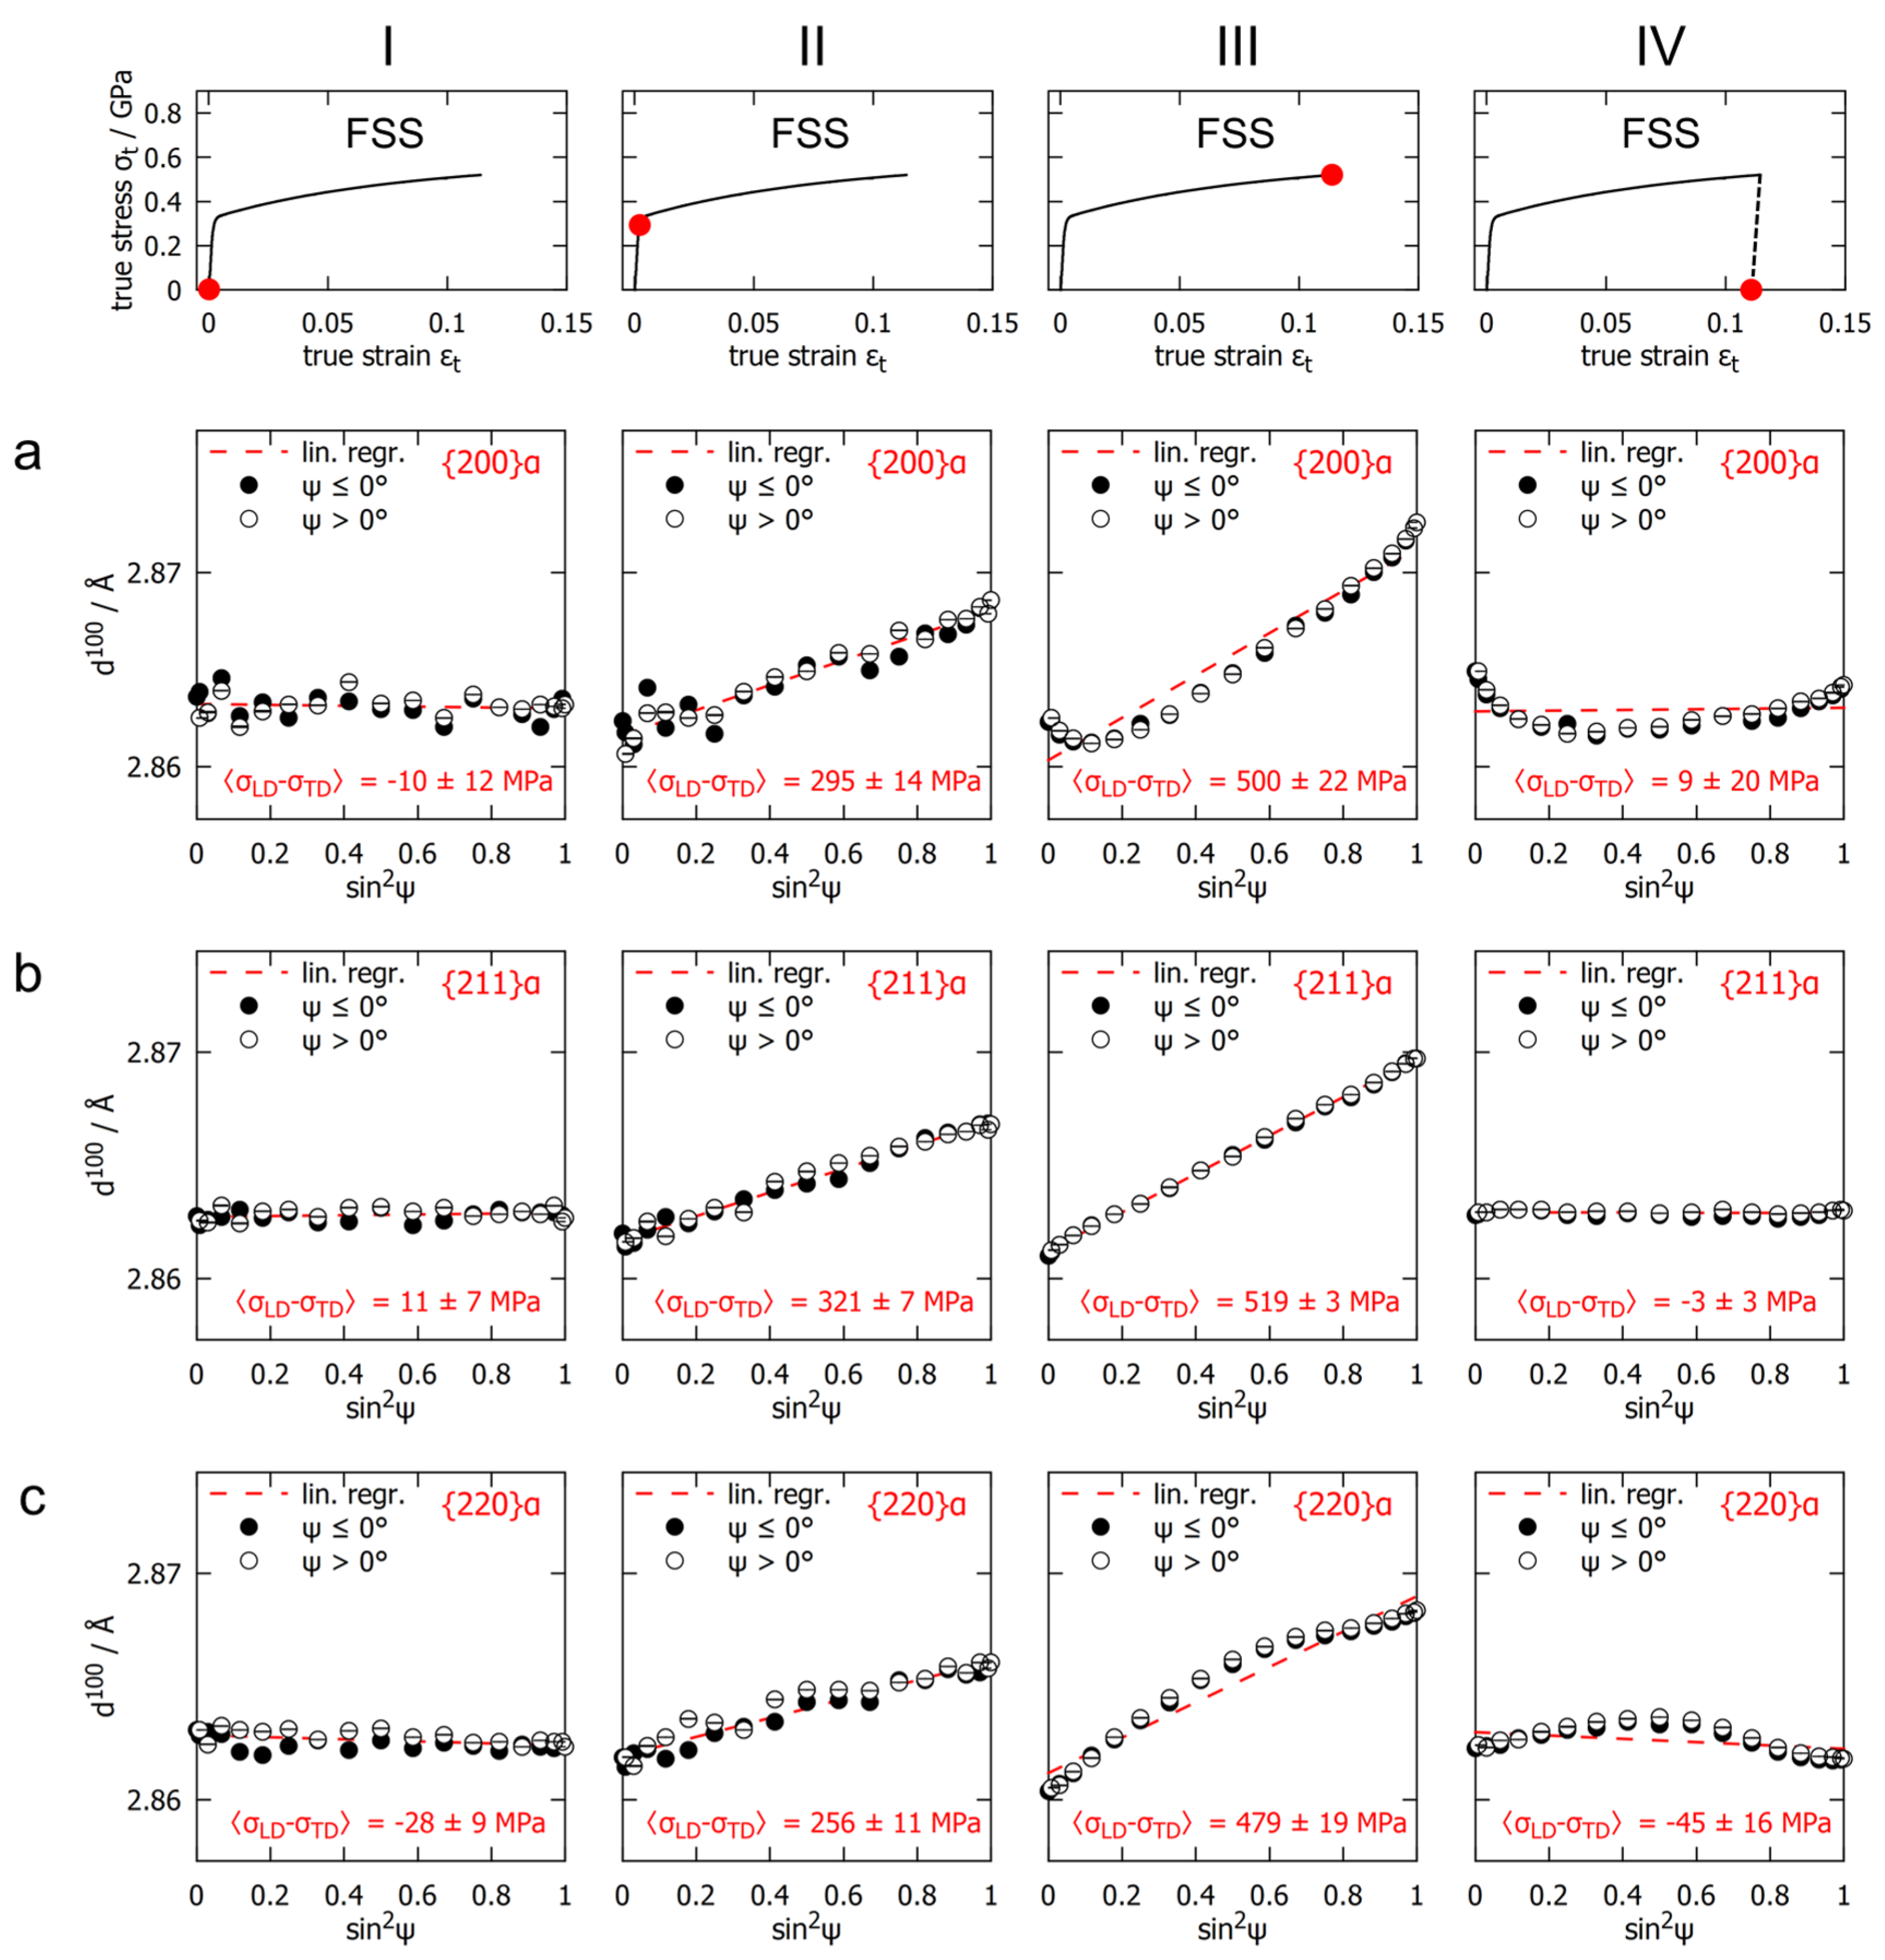
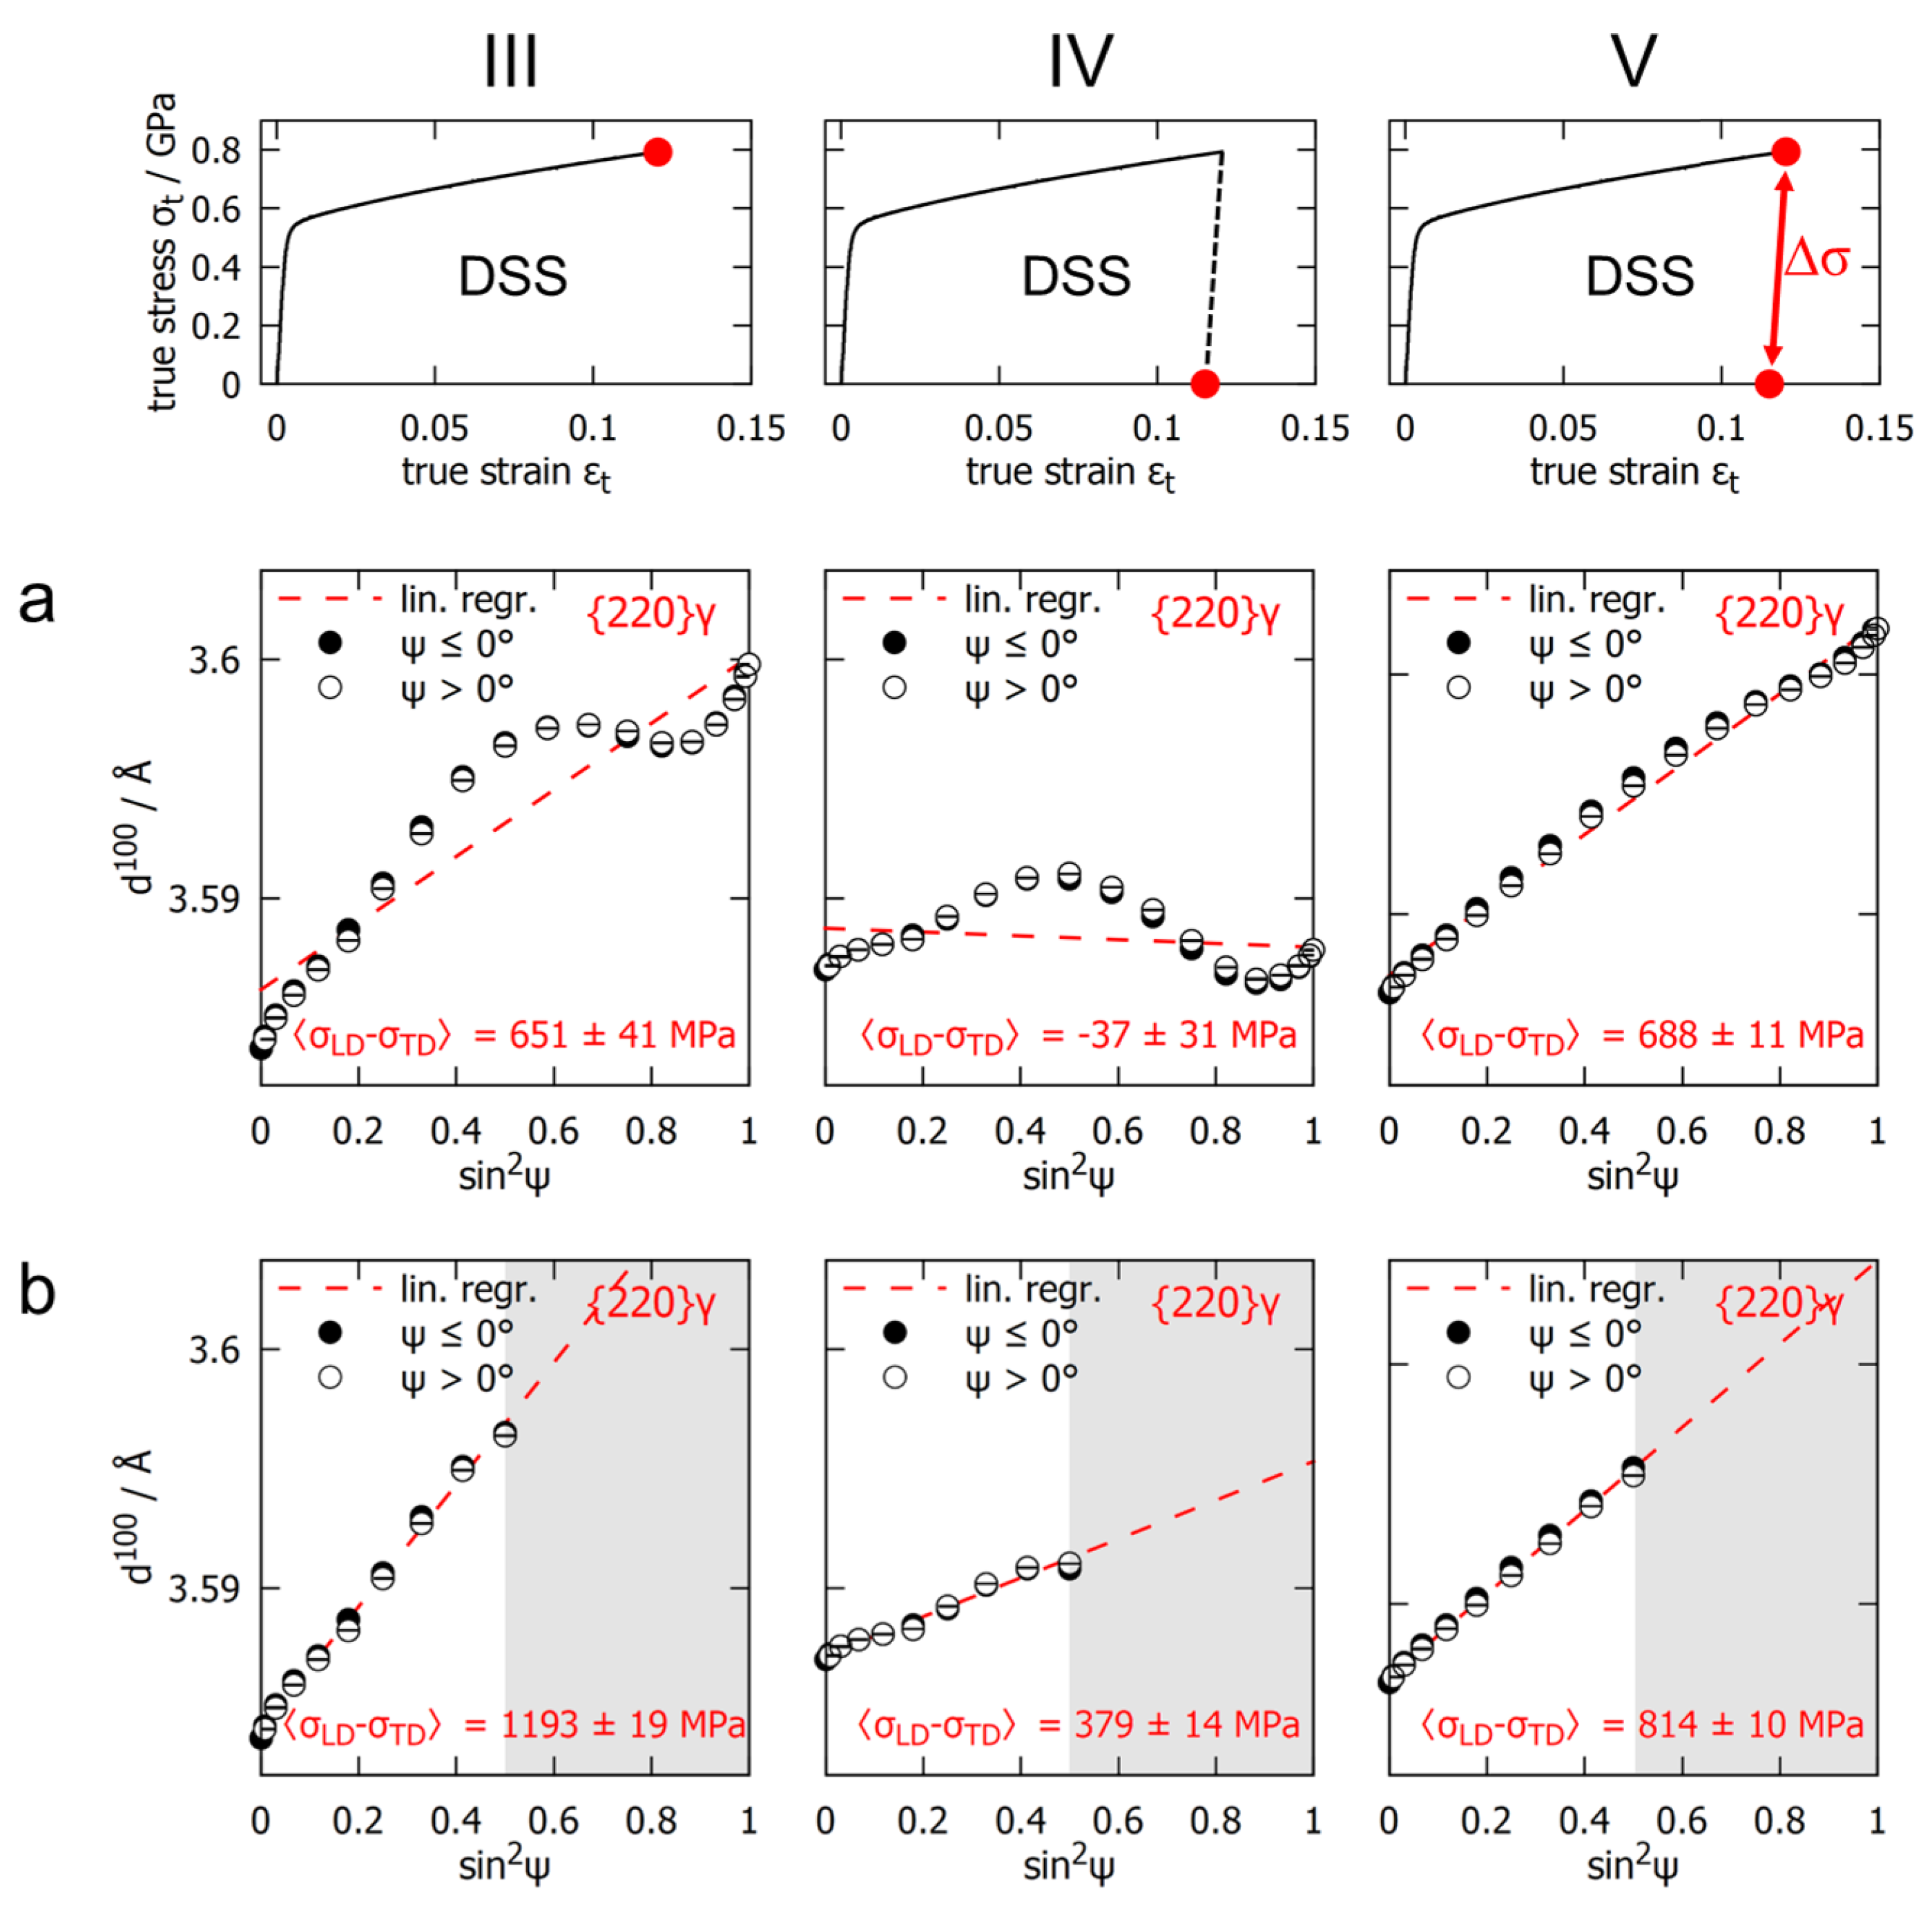
In the present work, the phase-specific lattice strain responses of a cold-rolled duplex stainless steel sheet and a ferritic stainless steel sheet were analysed under increasing tensile deformations up to a total strain of about ε = 0.12 . The aim was to analyse the development of oscillatory courses in d h k l vs. sin 2 ψ for several lattice planes for single-phase and two-phase materials and to obtain a better comprehension of the respective contributions of elastic and plastic anisotropy. Therefore, in situ loading experiments using 2D high-energy synchrotron X-ray diffraction were carried out at the P07B@PETRA III beamline at Deutsches Elektronen-Synchrotron (DESY) Hamburg, Germany. During uniaxial deformation in the elastic and elasto-plastic regime, entire Debye–Scherrer rings of several lattice planes { h k l } for the ferritic phases were detected by means of a flat-panel detector. In the case of the duplex stainless steel, the Debye–Sherrer rings were also found for the austentitic phase. From these, the direction-dependent lattice spacings d φ , ψ h k l were evaluated.
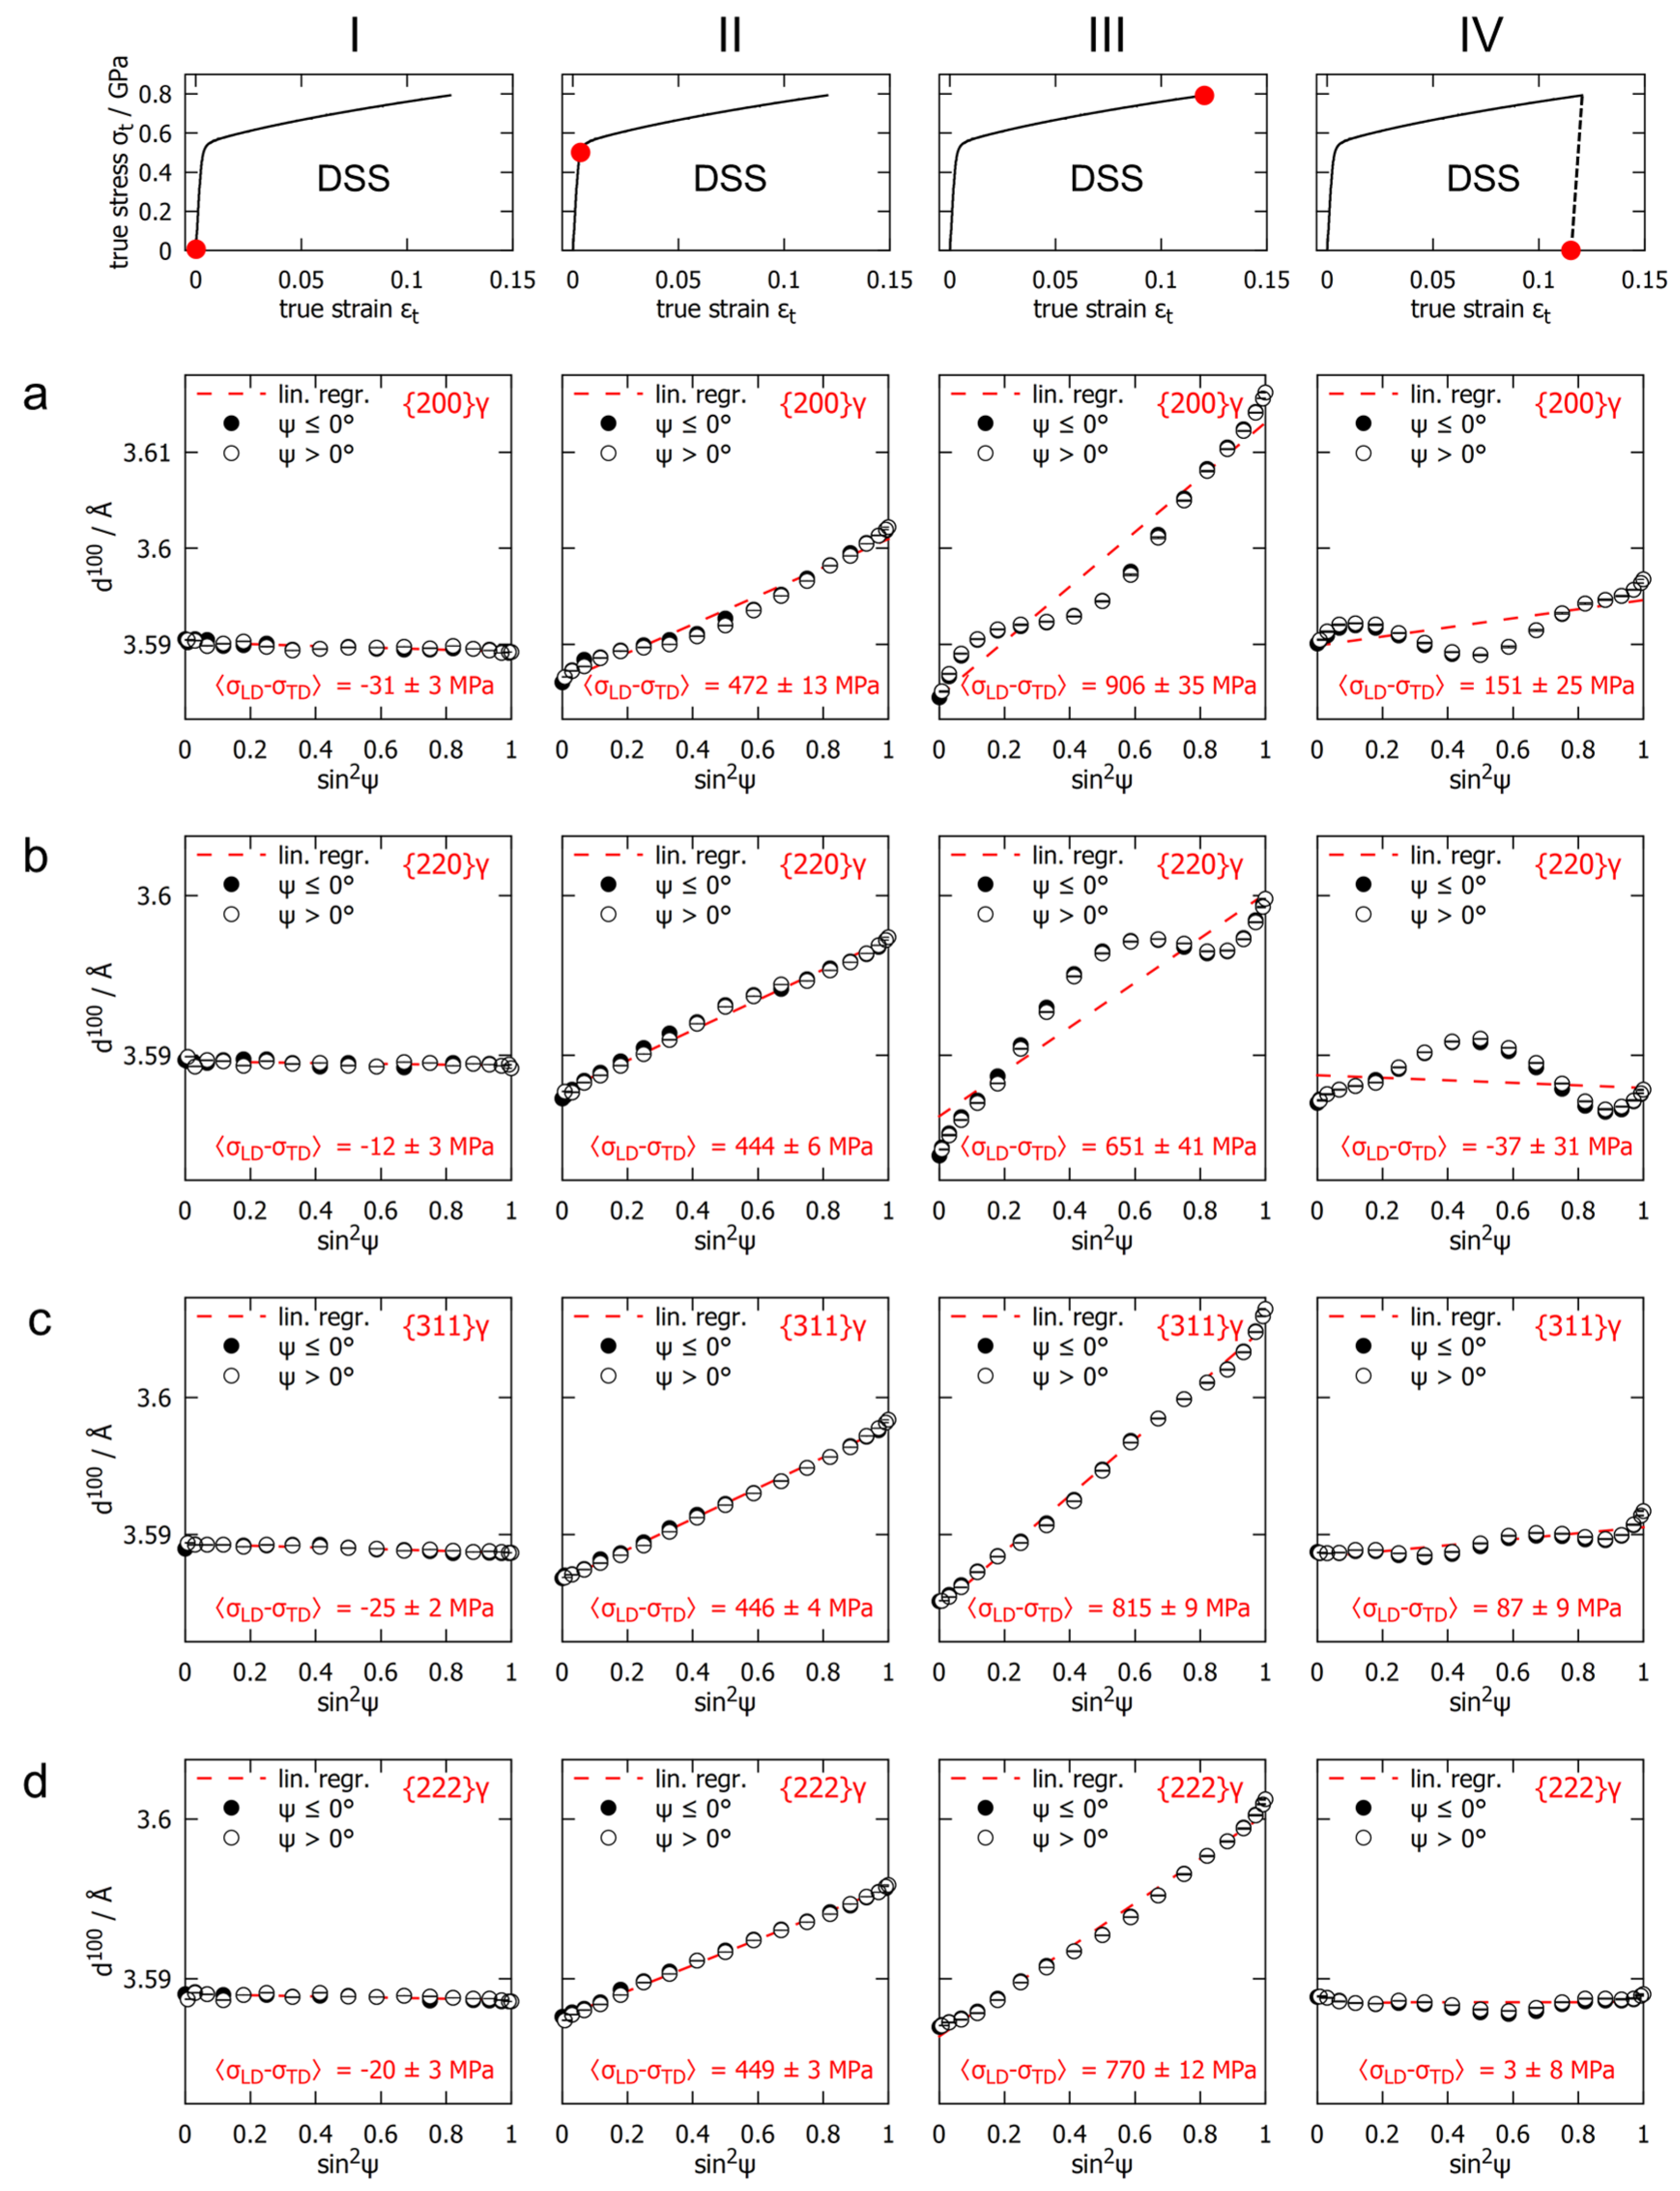
The results are presented and discussed in the following order. At first, the continuous evolution of the phase-specific lattice strain is analysed for selected directions with respect to the loading direction. Thereafter, d h k l sin 2 ψ plots of the individual lattice plane families of both materials are discussed for four particular load increments including the unloaded state. It is investigated whether linear regression over oscillating distributions leads to comparable stress results for different lattice planes if the entire range in sin 2 ψ (from 0.1) can be considered. The ferritic phase of the duplex stainless steel and the ferritic stainless steel exhibit the same crystal structure. In comparing the d h k l sin 2 ψ distributions of the single-phase material and the two-phase material, it is investigated if the second phase has an influence on the non-linearities. Finally, the influences of intergranular strains and crystallographic texture on the d h k l sin 2 ψ courses are separated by comparing the loaded and unloaded state.

2. Materials and Methods

2.1. Initial Material State

Duplex stainless steel EN 1.4362 (Alloy 2304, German grade X2CrNiN23-4) and ferritic stainless steel EN 1.4016 (AISI 430, German grade X6Cr17) were used in this study, both in a cold-rolled state with a sheet thickness of 1.5 mm. The abbreviations DSS for duplex stainless steel and FSS for the ferritic stainless steel are used throughout this work. The materials’ chemical compositions, as determined by optical emission spectroscopy, are shown in Table 1.
Metallographic analysis on the DSS revealed a nearly equal volume fraction of the phases ferrite ( α , body-centred cubic) and austenite ( γ , face-centred cubic), see Figure 2a. No further phases could be determined. The ferritic phase exhibits relatively large grains that are elongated in the rolling direction with a mean diameter of approximately 13 μ m . In contrast, the austenitic phase has smaller grains of with a rather spherical shape with sizes of about 4 μ m in diameter [19]. The ferritic stainless steel has rather large globular ferrite grains of sizes within a range of 10 μ m to 25 μ m , see Figure 2b. In addition, small carbide segregations were observed, regularly arranged in lines along the rolling direction (RD). However, the volume fraction of carbides is rather low and does not exceed 5 % . Hence, the ferritic stainless steel is considered as single-phase material within this work.
The crystallographic textures of the initial states were analysed by lab X-ray experiments using a four-circle X-ray diffractometer with 1 mm collimated Fe-filtered Co–K α -radiation (photon energy E C o K α = 6.93 keV , wavelength λ C o K α = 1.789   Å ). On the secondary side, a 4 mm slit aperture was installed in front of the point detector. From the measured incomplete pole figures of ferritic lattice planes ( { 200 } α , { 211 } α , { 220 } α ) and austenitic lattice planes ( { 200 } γ , { 220 } γ , { 311 } γ ) the phase-specific ODFs ( f ( g ) ) and main texture components { h k l } u v w of both materials were calculated using the Matlab toolbox MTEX [23]. To account for the depth gradient, the texture was repeatedly characterised after step-wise layer removal until half of the sheet thickness was reached. Each layer had a thickness of about 250 μ m and was removed by grinding and subsequent electrochemical polishing. The volume fractions of the main texture components as well as the overall texture index J, which describes the degree of anisotropy [24], are depicted in Figure 3 over the distance to the surface. Both phases show ideal texture components that are frequently observed for body-centred cubic (bcc) and face-centred cubic (fcc) metals after rolling. Major components of the austenitic phase of the DSS are Taylor { 4 4 11 } 11 11 8 (also named Dillamore), copper { 123 } 111 , S1 { 124 } 211 , brass { 110 } 112 and Goss { 110 } 001 orientations. The ferritic phases of the DSS and the FSS both have components of α -fibre ( { 100 } 110 , { 115 } 110 , { 112 } 110 ) and γ -fibre ( { 111 } 110 , { 111 } 112 ). Yet, the texture of the FSS is less pronounced in comparison to the ferritic phase of the DSS. According to the texture index J, the ferritic phase in the DSS also exhibits a sharper texture than the austenitic phase. For both materials (DSS and FSS), only a negligible variation of the texture vs. depth was observed.

2.2. In Situ Loading Experiment

Tensile specimens were cut out of the sheet metals with their longitudinal direction aligned parallel to the sheet’s rolling direction. The sample volume experiencing an homogeneous strain has a length, width, and thickness of 21 × 8 × 1.5 mm. For the tensile tests, a miniature tensile testing machine from Walter+Bai AG, Switzerland, with an attached 10 kN load cell was used. The macro stress–strain curves were determined up to a maximum strain of about ε t = 0.12 using an extensometer. The strain rate was approximately ε ˙ = 4 × 10 5 s 1 . During the in situ experiments, i.e., during X-ray exposure, the extensometer was dismounted to avoid shadowing effects.
The in situ high-energy X-ray diffraction (HEXRD) experiments were carried out at beamline P07B@PETRA III at DESY in Hamburg, Germany. Monochromatic synchrotron X-rays with a photon energy of E H E = 87.1 keV (wavelength λ H E = 0.1423 Å ) and a beam size of 1 mm in width and 0.6 mm in height were used. Diffraction patterns were detected by a Perkin–Elmer flat -panel detector of type XRD 1621 with a 2048 × 2048 array of 200 × 200 μ m pixels having a distance to the sample of 1365 mm. The experimental setup was calibrated using a Fe-powder reference sample.
During the uniaxial deformation, the diffraction patterns were continuously recorded with an acquisition time of Δ t = 2 s (sampling rate 0.5 Hz). Thereby, nine complete Debye–Scherrer rings, corresponding to the { 111 } γ , { 200 } γ , { 220 } γ , { 311 } γ , { 222 } γ austenite interference lines and the { 110 } α , { 200 } α , { 211 } α , { 220 } α ferrite interference lines were recorded for the DSS sample. For the FSS sample, diffraction rings of { 110 } α , { 200 } α , { 211 } α , { 220 } α were detected.

2.3. Determination of sin 2 ψ Courses from Debye–Scherrer Rings

To enable direction-dependent data evaluation, the diffraction patterns were sectioned into 72 diffraction profiles via integration along the azimuthal angle η in the detector plane in steps of Δ η = 5 using the software FIT2D [25]. As exemplified for η = 90 in Figure 4, each of the intensity vs. 2 θ profiles corresponds to one azimuthal direction η .
After linear background subtraction, the individual diffraction peaks were fitted with pseudo-Voigt functions using a self-written MATLAB routine. From the evaluated mean 2 θ h k l positions, the lattice spacings d h k l were calculated according to Bragg’s law (see Equation (1)). For better comparability of the evolution of lattice spacings of different lattice planes d h k l , they are expressed by the changes of the uniform lattice spacing d 100 using the following equation:
d φ , ψ 100 = d φ , ψ h k l h 2 + k 2 + l 2 .
In the laboratory system, each measurement direction is defined by the scattering vector m, which depends on the azimuthal angle η in the detector plane and the particular diffraction angle θ h k l , as schematically depicted in Figure 5a. For the evaluation of strains and stresses, the scattering vectors have to be expressed in respect to a sample-fixed reference system, which is generally defined by an azimuthal angle φ and a polar angle ψ . In Figure 5, two different stereographic projections of the scattering vectors m are illustrated, assuming a diffraction angle θ = 4.1 . Figure 5b depicts the projection perpendicular to the sheet’s normal direction (ND), whereas Figure 5c depicts the projection perpendicular to the sheet’s transverse direction (TD). The respective projections are indicated by indices. The coordinate transformation was performed using a rotation matrix as described in [26].
In classical application of the sin 2 ψ method, the stress in direction φ is evaluated from measured lattice spacings for various sample inclinations ψ under constant azimuthal direction φ . The path of the scattering vectors in coordinate system (c) approximately describes a path of various ψ TD angles for a fixed azimuthal angle φ TD = 0 . The negligible offset from the LD–TD plane is simply due to the diffraction angle θ (compare Figure 5a). Considering the very small diffraction angles for the given experimental setup ( θ max h k l = θ 220 α 4.1 ), this angular offset is ignored in further evaluation and the following approximations are made:
m ( φ , ψ ) = m ( φ = 0 = LD , ψ = η ) m ( φ TD , ψ TD ) .
Thus, the d φ , ψ - sin 2 ψ distributions dealt with in this work can be assigned to the sample-fixed LD–TD plane. Because the angles φ and ψ do not correspond exactly to φ TD and ψ TD , they are not indexed with ’TD’. The stress error made by this assumption was calculated assuming non-textured ferritic steel with a simulated uniaxial stress state ( σ LD = 100 MPa , σ LD = σ LD = 0 ). For the maximum diffraction angle investigated ( θ 220 α ) the stress error is less than 0.5% and is thus within the range of usual measurement error. Comparable evaluation approaches have already been proposed by [21,22,27]. To correct any inaccuracies in the determination of the beam centre, the lattice spacings d φ , ψ h k l determined from opposing azimuthal angles within the Debye–Scherrer rings are averaged:
d φ , ψ 100 = d 100 ( φ , ψ ) + d 100 ( φ , ψ + 180 ) 2 , for | ψ | 90 .

2.4. Stress Evaluation

Although significant oscillations in the d h k l sin 2 ψ distributions are expected in this study, the phase-specific stress evaluation is carried out according to the sin 2 ψ method. In this way, it can be verified, if the stress values determined from different lattice planes correlate, given that the entire range 0 sin 2 ψ 1 is covered. Gradients of residual stresses cannot be resolved with the transmission experiment, as only integral values across the sheet thickness are determined. In multi-phase materials however, there are homogeneous phase-specific micro-residual stresses which are balanced by the homogeneous micro-residual stresses of the other phases. The presence of such homogeneous micro-residual stresses must be considered for all measurement directions in the sample reference system. Hence, only the differences of the mean stresses σ LD σ TD ϑ of the respective phase ϑ can be obtained by the applied method:
σ LD σ TD ϑ = 1 1 2 s 2 h k l 1 d 0 100 d φ , ψ 100 sin 2 ψ .
Because the uniform lattice spacing for the stress-free state d 0 100 of the respective phases is unknown, it is replaced by the average of the uniform lattice spacings of all analysed interference lines measured for the materials initial state. The stress error introduced by this assumption is less than 0.1 % for most materials if stresses are evaluated according to the sin 2 ψ method [4]. In Table 2, the used d 0 100 values for DSS and FSS are provided.
The diffraction elastic constants 1 2 s 2 h k l , as specified in Table 3, are calculated according to the self-consistent model, known as the Eshelby/Kröner model, following the iterative approach proposed by [28]. The single-crystal elastic constants for the ferritic and austenitic phases were taken from [29,30], respectively.

3. Results and Discussion

3.1. Lattice Strain Evolution of DSS for Selected ψ Angles

At first, the continuously recorded measurement data are shown for three selected polar angles ψ = 0 , ψ = 45 and ψ = 90 in order to illustrate the evolution of lattice strain response from both phases of the DSS sample with increasing load. The strain response is given as a change in lattice strain Δ ε φ , ψ h k l , which is calculated with respect to the lattice spacing of the initial state d i n i t h k l :
Δ ε φ , ψ h k l = d φ , ψ h k l d init h k l d init h k l .
When the lattice strain versus applied load deviates from a linear dependency, oscillations in the d h k l sin 2 ψ plots can also be expected. The theoretical strain evolution for a linear dependency is calculated by the stress factors F 11 ( φ , ψ ) multiplied with the nominal applied stress σ n . The stress factors F 11 ( φ , ψ ) for the three particular directions ψ were calculated using the software isoDEC applying the Eshelby/Kroener model [31]. The phase-specific ODFs from the initial material state were taken into account as input data.
In Figure 6a and Figure 7a the Debye–Scherrer rings from the austenitic and the ferritic phase are highlighted and the selected ψ directions are marked ( ψ = η ). The solid lines in Figure 6b and Figure 7b depict the corresponding changes in lattice strain Δ ε φ , ψ h k l of the investigated austenitic and ferritic lattice planes, respectively. The dotted lines indicate the theoretical strain evolution, calculated by F 11 ( φ , ψ ) multiplied with σ n . The experimentally determined strain development Δ ε φ , ψ h k l of both phases is accurately predicted by the calculated values for almost all investigated lattice planes as long as the applied load is clearly below the macro yield strength ( σ n R eS , compare Figure 6b and Figure 7b). Hence, both constituents of the DSS share approximately the same load σ n within the purely elastic deformation, which seems plausible because of their only minor differences in elastic properties.
When the applied load approaches the macro yield strength, significant deviations from the linear stress–strain relationship are observed. This is due to the plastic anisotropy of the individual crystallites, i.e., the direction-dependent yield strength [32]. Crystallite orientations with low strength with respect to the direction of the applied load show plastic yielding already below the macro yield strength. This causes additional elastic strain within the crystallites that have a high-strength orientation, due to the constraints of the surrounding polycrystal [33]. The selective nature of diffraction methods means that those strain heterogeneities become visible, especially when various {hkl} interference lines are studied. Depending on the particular polar angle ψ , positive or negative deviations from linear stress–strain-dependency are observed, which are related to oscillations in a d h k l sin 2 ψ plot.
The unfilled symbols indicate the residual strain after unloading. It can be seen that for both phases, the introduced intergranular strains also remain in the unloaded state.
Furthermore, in Figure 6b, a difference between the lattice strains determined by { 111 } γ and { 222 } γ interference lines is evident for applied loads beyond R e S . This systematic shift is due to the stacking fault probability in the austenitic phase which increases with plastic deformation and has been frequently observed for materials that exhibit a low stacking fault energy (SFE) [34]. For the ferritic lattice planes { 110 } α and { 220 } α , no such strain differences exist (see Figure 7b), which can be explained by the usually high SFE of body-centred cubic metals.

3.2. Stress Evaluation According to the sin 2 ψ Method

The d 100 sin 2 ψ plots are determined from Debye–Scherrer rings as described in detail in Section 2.3. For reasons of clarity, only results of four characteristic load states during the tensile deformation are shown. Those are the initial unloaded state (I), the macro yield point σ t = R e S (II), the maximum deformed state under load ( ε t = 0.12 , (III)), and the unloaded deformed state (IV). From two crystallographic-equivalent lattice planes, only one is depicted, namely { 222 } γ for the austenitic phase and { 220 } α for the ferritic phase. According to the theory of [34], it is assumed that the shift of lattice strain due to deformation stacking faults is non-directional. Hence, it does not affect the slope of d h k l sin 2 ψ distributions and will not be considered further in this work. The stress differences σ LD σ TD of the respective phase are calculated from the slopes of the linear regressions according to Equation (6) using the isotropic diffraction elastic constants given in Table 3. Stress errors are calculated for each sin 2 ψ evaluation, taking into account the variances of the regression line as described in [1].

3.2.1. DSS—Austenitic Phase

In Figure 8, the d 100 sin 2 ψ distributions for the four load states (IIV) determined from austenitic lattice planes { 200 } γ (a), { 220 } γ (b), { 311 } γ (c) and { 222 } γ (d) are shown. The uniform lattice spacings d 100 are depicted over sin 2 ψ . Positive and negative ψ angles are indicated with white-filled and black-filled symbols, respectively. The variances in the individual d 100 values are propagated from the peak fit and are given by error bars. The result of the linear regression is shown as a red dotted line from which the stresses σ LD σ TD γ are calculated. In the initial state (I), all austenitic lattice planes show a linear d 100 sin 2 ψ dependency. Merely, minor scattering can be observed which results in small stress errors ( ± 3 MPa). The initial residual stress difference σ LD σ TD γ of the austenitic phase is negative in sign, and the average from all lattice planes amounts to about 22 MPa.
In the load state II, tendencies towards oscillating deviations are already visible for the { 200 } γ and the { 220 } γ planes. The stress evaluation of different lattice planes leads to an average value of about 453 MPa, from which { 200 } γ deviates the most, by approximately 19 MPa. The calculated stress errors are ± 13 MPa at maximum. It is well known that oscillatory d 100 sin 2 ψ distributions observed for { h 00 } or { h h h } lattice planes of cubic centred materials cannot be caused by crystallographic texture [35]. Consequently, the non-linearities visible for { 200 } γ already indicate the influence of plastically induced intergranular strains. With further plastic deformation (load state III) the oscillations for { 200 } γ and { 220 } γ increase significantly in amplitudes. The d h k l sin 2 ψ distributions of { 311 } γ and { 222 } γ lattice planes now also exhibit deviations from linearity, although those are much smaller compared to the latter. The evaluated stresses σ LD σ TD γ for this load state range from 651 MPa to 906 MPa, with an average value of about 786 MPa. The oscillations result in higher calculated stress errors, which, however, significantly underestimate the true uncertainty in stress evaluation if the results from different lattice planes are considered.
After unloading (load state IV), the deviations from the linear distribution almost completely remain for all lattice planes. The average stress difference σ LD σ TD γ from all investigated planes calculates to about 51 MPa. However, it should be pointed out that depending on the respective lattice plane compressive residual stress ( { 220 } γ ), tensile residual stress ( { 200 } γ , { 311 } γ ) and residual stress values of close to zero are determined. A direct comparison of load state I and IV reveals the magnitude of strain heterogeneities introduced by the elasto-plastic tensile deformation, which is observable for all examined austenitic lattice planes.

3.2.2. DSS—Ferritic Phase

The d 100 sin 2 ψ distributions obtained from the Debye–Scherrer rings of the ferritic phase are depicted in Figure 9. The distributions of { 200 } α (a), { 211 } α (b) and { 220 } α (c) are shown here for load states IIV in an equivalent representation to Figure 8.
In the initial state (I), all lattice spacings d 100 show a nearly linear dependency of sin 2 ψ . Only local fluctuations can be observed, which are greater in magnitude compared to the austenitic phase. Those fluctuations are presumable due to a larger average size and thus a lower number of coherently scattering domains. Such local non-linearities due to ’coarse grains’ superimpose on the linear or non-linear d h k l sin 2 ψ distributions [35]. Hence, the larger stress errors ( ± 14 MPa) observed for the ferritic phase in the initial state can be attributed to the larger grain size in comparison to the austenitic phase. The evaluated residual stress difference of the ferritic phase σ LD σ TD α is of a positive sign with an average value of about 21 MPa.
At load state II, minor d 100 oscillations are already visible for all lattice planes except for { 211 } α . However, the evaluated stresses of different lattice planes show comparable results, with an average value of about 553 MPa from which { 211 } α deviates the most, by approximately 23 MPa. The maximum stress error from linear regression is about ± 22 MPa.
For load state III, it can be observed that the non-linearities of d 100 vs. sin 2 ψ are increased for lattice planes { 200 } α and { 220 } α , whereas { 211 } α still shows an almost linear distribution. The stress values σ LD σ TD α range from approx. 732 MPa to 814 MPa with an average value of about 765 MPa. Whereas the error in stress calculation increases for lattice planes { 200 } α and { 220 } α , it decreases for { 200 } α compared to the previous load state II. This is due to the reduced local fluctuations from a continuous d 100 sin 2 ψ distribution, which is evident for all lattice planes after plastic deformation.
As already observed for the austenitic phase, the oscillations persist after unloading (load state IV). The residual stress difference σ LD σ TD α from all three lattice planes averages to about 71 MPa with a minimum value of approx. 131 MPa and a maximum value of 25 MPa for { 220 } α and { 200 } α , respectively. A direct comparison of load states I and IV shows the extent of the oscillations introduced by tensile plastic deformation with simultaneous reduction in the local fluctuations which were present in the initial state. The latter indicates that the domain size is reduced significantly due to the increase in lattice defects caused by plastic deformation. This hypothesis could be confirmed by a peak profile analysis on the measurements data set according to Williamson-Hall, which allows for the separation of size and strain effects on diffraction line broadening [36]. However, the measurement statistic of the interference profiles was not sufficient for a precise quantitative analysis of the respective contributions, hence, results on this evaluation is not presented here. Nonetheless, from comparison of load state I and IV a decrease in average domain sizes after plastic deformation could be qualitatively confirmed for both, the ferritic and austenitic phases.

3.2.3. FSS—Ferritic Phase

The results obtained from the FSS sample are presented in Figure 10 in the same manner as for the DSS sample. The load states IIV correspond to equivalent positions on the macro stress strain curve of the FSS. The d 100 sin 2 ψ distributions in the initial state (I) show a nearly horizontal line for all three lattice planes. The residual stress difference σ LD σ TD α is close to zero with an average value of about 9 MPa confirming the expected stress-free state for a single-phase steel. Compared to the ferritic phase of the DSS even higher local fluctuations in d 100 vs. sin 2 ψ are determined, which supports the aforementioned assumption of grain size influences because the FSS exhibits the largest grains (see Figure 2).
In load state II the average stress obtained from all lattice planes amounts to approx. 291 MPa. Any oscillations that may already be present in the d 100 sin 2 ψ distribution are superimposed by the local scattering deviations and can therefore not be clearly recognised.
Those local fluctuations reduce significantly after plastic deformation (load state III) and the d 100 sin 2 ψ oscillations are clearly visible for { 200 } α and { 220 } α planes. The average stress determined by the sin 2 ψ method is about 499 MPa, whereby { 211 } α , the only lattice plane with linear d 100 sin 2 ψ distribution, shows the highest stress, with approximately 519 MPa.
The non-linear distributions that are also present in the unloaded state (IV) lead to considerable differences in the evaluated residual stresses based on different lattice planes. The residual stress, determined by the almost linear d 100 sin 2 ψ distribution of { 211 } α , is again close to zero with a value of about σ LD σ TD α = 3 MPa.

3.2.4. Comparison of DSS and FSS

For equivalent lattice planes of the deformed FSS (Figure 10(IVa–c)) and the ferritic phase of the deformed DSS (Figure 9(IVa–c)), comparable features in the oscillating d 100 sin 2 ψ distributions are observed. Hence, these oscillations are not affected by the presence of a second phase, i.e., the austenitic phase of the DSS. The lower oscillation amplitudes for the FSS compared to those observed for the ferritic phase of the DSS are due to the lower yield strength and thus the lower number of microstresses caused by plastic deformation.
For a better overview, the evaluated stress values are listed together with the applied loads in Table 4 and Table 5 for FSS and DSS, respectively. If stress values are determined from d 100 sin 2 ψ distributions showing significant or marginal oscillations, they are shaded with light red of light pink, respectively. Because the FSS is considered a single-phase material, no homogeneous phase-specific residual stress should be observable. The measured data were obtained by a transmission experiment, so that a macro-residual stress depth gradient always integrates to zero in order to fulfil the equilibrium condition of residual stresses. This assumption is confirmed by the very low stress values determined by two lattice planes in the initial state and by the { 211 } α planes after unloading (Table 4).
In the DSS, however, the mean phase-specific residual stresses over the sample thickness are not equal to zero because they are balanced by the mean stresses of the other phase. Because both phases have approximately equal volume fractions, the phase-specific micro-residual stresses of both phases must add up to zero.
This is confirmed by the average stress differences in the initial state (I), which amount to about σ LD σ TD γ = 22 MPa and σ LD σ TD α = 21 MPa for the austenitic and ferritic phases, respectively. The unloaded state after deformation showed σ LD σ TD γ = 51 MPa for the austenitic phase and σ LD σ TD α = 71 MPa for the ferritic phase. The fact that the phase-specific residual stresses change due to uniaxial deformation shows that ferritic and austenitic phase exhibit different strength and/or hardening behaviour with respect to the direction of loading (LD‖RD). A further evaluation of the phase-specific triaxial stress tensor requires the precise lattice parameters for the stress-free state d 0 100 , which are not known in the present state and are difficult to determine. σ TD h k l must not be assumed to be zero because significant hydrostatic phase-specific stresses can arise in multi-phase materials. Therefore, the phase-specific hardening behaviour unfortunately cannot be derived from the presented results.

3.3. Influence of Texture on d 100 -sin 2 ψ -Oscillations

For the initial state (load state I) and the macro yield point (load state II), no considerable oscillations in the d 100 sin 2 ψ distributions were observed for DSS and FSS. It is therefore assumed that no significant plastically induced intergranular strains ε pl . existed in the initial states. Furthermore, it is concluded that the initial crystallographic textures only minorly affect non-linear d 100 sin 2 ψ distributions for the given material states. However, it should be noted that texture generally develops through plastic deformation. The observed significant increase in non-linearities with further tensile deformation might thus be affected by both elastic anisotropy (i.e., the crystallographic texture) and plastic anisotropy (i.e., intergranular strains). At this point, it should be mentioned that the crystallographic texture also influences the development of plastically induced intergranular strains. It is expected that different incompatibility stresses arise during plastic deformation of non-textured materials than in highly textured materials. However, no variation in textures was investigated within this study. The term ’influenced by texture’ in this work is therefore exclusively associated with the effect of elastic anisotropy on the oscillatory courses in d h k l vs. sin 2 ψ .
To separate the effects of texture and plastically induced strains, the results obtained for load state III and load state IV were examined in more detail. Generally, it can be assumed that the texture and the plastically induced intergranular strains ε pl . do not change during unloading given that the unloading process is purely elastic:
Δ ε pl . ( φ , ψ , h k l ) = ε loaded pl . ( φ , ψ , h k l ) ε unloaded pl . ( φ , ψ , h k l ) = ! 0 .
The change in elastic strain between the loaded and unloaded state Δ ε therefore only depends on the loading stress Δ σ i j . Equations (2) and (8) yield:
Δ ε ( φ , ψ , h k l ) = ε loaded ( φ , ψ , h k l ) ε unloaded ( φ , ψ , h k l ) = i , j F i j ( φ , ψ , h k l ) Δ σ i j .
With respect to the change of the lattice spacing d 100 , the equation is:
Δ d 100 ( φ , ψ , h k l ) = d loaded 100 ( φ , ψ , h k l ) d unloaded 100 ( φ , ψ , h k l ) = i , j F i j ( φ , ψ , h k l ) Δ σ i j d 0 100 .
In Figure 11a, this approach is exemplified for the { 220 } γ lattice plane. The strongly pronounced oscillations which are present in load state III and IV disappear almost completely if the difference in lattice spacings of both states is calculated (load state V = IIIIV). The remaining deviations from the regression line that might be caused by the crystallographic texture are comparatively small. Figure 11b depicts the same measurement results but here only d h k l values for the lower-half range of sin 2 ψ are considered, which correspond to sample inclinations | ψ | 45 . In laboratory X-ray applications, the ψ range is frequently limited to such low angles due to the restrictions of the used instruments (e.g., mobile diffractometers) or shadowing caused by the geometry of the sample being investigated. A comparison of Figure 11a,b shows that the evaluated stresses differ drastically (IIIa/b) and even change signs for the residual stress state (IVa/b). Even for the difference of both load states (Va/b), in which the effect of plastically induced intergranular strains can be excluded, a considerable stress difference is evident. In the case of plastically deformed material states, it must be taken into account that non-linearities might be recognisable only in the upper tilt angle range. A stress evaluation based on the apparently linear d h k l sin 2 ψ distribution within the lower ψ angle range in this case leads to strongly erroneous stress results.
The comparison of Figure 11a,b reveals that the stress errors, which are calculated from variances in linear regression, are far from the true stress inaccuracies.
From all investigated lattice planes of the ferritic and austenitic phases within this study, only the { 211 } α plane remained almost unaffected regarding oscillatory d 100 sin 2 ψ distributions for the applied deformation.

4. Conclusions

The in situ HEXRD experiments have shown that significant oscillations in the d h k l sin 2 ψ distributions arise during elasto-plastic tensile deformation for both materials investigated: duplex stainless steel EN 1.4362 and ferritic stainless steel EN 1.4016.
A comparison of the results from selected load states and deformation states resulted in the following findings, irrespective of the material considered:
  • Local fluctuations in d h k l sin 2 ψ , which are present in the initial state, significantly reduce during tensile plastic deformation, presumably due to the decrease in domain sizes.
  • The oscillations of the d h k l sin 2 ψ distributions, observed after plastic deformation, are only minorly affected by crystallographic texture. This is due to the rather weak textures of both cold-rolled steel grades investigated.
  • In contrast, the non-linearities are predominantly caused by plastically induced intergranular strains. Hence, they are observed also for lattice planes which are not susceptible to crystallographic texture ( { h 00 } , { h h h } ).
  • The crystallographic texture’s influence on the development of plastically induced intergranular strains could not be analysed because only one initial texture state was investigated.
  • The oscillations occur for almost all examined interference lines, although they differ strongly in characteristics and amplitudes depending on the respective lattice planes.
  • Stress evaluation by linear regression of oscillating d h k l sin 2 ψ distributions varies for different lattices planes, even if the entire sin 2 ψ range is covered.
  • The non-linearities frequently occur, in particular, under higher tilt angles, which cannot be accessed with stationary and mobile diffractometers using conventionally generated X-rays (lab X-ray applications). Thus, in case of plastically deformed material states, stress evaluation according to sin 2 ψ method might be highly erroneous. Even if presumably linear distributions are obtained within the limited sin 2 ψ range, the results must be interpreted with caution.
Regarding the respective material, following conclusions can be drawn:
  • No phase-specific residual stresses are determined for the FSS. The stresses determined from lattice plane { 211 } α are in good accordance with the applied stress values.
  • The DSS exhibits phase-specific microstresses, which change with plastic deformation. The tensile residual stress of the ferritic phase is balanced by compressive residual stress of the austenitic phase prior to the deformation. After uniaxial deformation, the inverse is true.
  • Because only the stress differences σ LD σ TD α , γ were determined, the phase-specific strain hardening could not be derived.
  • For the ferritic phases of DSS and FSS, similar characteristics in the d h k l sin 2 ψ oscillations were observed. Thus, their evolution in the DSS is barely affected by the austenitic phase.
We believe that the results of this study are well suited for the validation of models used for the prediction of elasto-plastic material behaviour. This concerns, for example, crystal plasticity models or EPSC (elasto-plastic self-consistent) models, which are able to predict the evolution of intergranular strains and texture during plastic deformation.

Author Contributions

Conceptualization, N.S. (Nicola Simon) and J.G.; methodology, N.S. (Nicola Simon) and J.G.; software, N.S. (Nicola Simon) and N.S. (Norbert Schell); validation, N.S. (Nicola Simon); formal analysis, N.S. (Nicola Simon); investigation, N.S. (Nicola Simon), J.G. and N.S. (Norbert Schell); resources, J.G. and N.S. (Norbert Schell); data curation, N.S. (Nicola Simon); writing—original draft preparation, N.S. (Nicola Simon); writing—review and editing, J.G. and N.S. (Norbert Schell); visualization, N.S. (Nicola Simon); supervision, J.G.; project administration, J.G.; funding acquisition, J.G. All authors have read and agreed to the published version of the manuscript.

Funding

This research was funded by the German Research Foundation (DFG) within the Priority Programme SPP2013 “Targeted Use of Forming Induced Residual Stresses in Metal Components” (Gi 376/13-3). The support by the German Research Foundation (DFG) is gratefully acknowledged. Furthermore, we acknowledge support by the KIT-Publication Fund of the Karlsruhe Institute of Technology.

Institutional Review Board Statement

Not applicable.

Informed Consent Statement

Not applicable.

Data Availability Statement

The data presented in this study are available on request from the corresponding author.

Acknowledgments

We gratefully acknowledge Herfried Behnken for the helpful discussions.

Conflicts of Interest

The authors declare no conflict of interest.

Abbreviations

The following abbreviations are used in this manuscript:
bccbody-centred cubic
DESYDeutsches Elektronensynchrotron
DSSduplex stainless steel
fccface-centred cubic
FSSferritic stainless steel
HEXRDhigh-energy X-ray diffraction
LDloading direction
LSload state
NDnormal direction
ODForientation distribution function
RDrolling direction
TDtransverse direction
XRDX-ray diffraction

References

  1. Hauk, V. Structural and Residual Stress Analysis by Nondestructive Methods: Evaluation, Application, Assessment; Elsevier: Amsterdam, The Netherlands, 1997. [Google Scholar]
  2. Behnken, H.; Hauk, V. Determination and assessment of homogeneous microstresses in polycrystalline materials. Steel Res. 1996, 67, 423–429. [Google Scholar] [CrossRef]
  3. Macherauch, E.; Müller, P. Das sin2ψ-Verfahren der röntgenographischen Spannungsmessung. Zeitschrift für Angewandte Physik 1961, 13, 305–312. [Google Scholar]
  4. Noyan, I.C.; Cohen, J.B. Residual Stress; Springer: New York, NY, USA, 1987. [Google Scholar] [CrossRef]
  5. Baczmański, A.; Braham, C.; Seiler, W. Microstresses in textured polycrystals studied by the multireflection diffraction method and self-consistent model. Philos. Mag. 2003, 83, 3225–3246. [Google Scholar] [CrossRef]
  6. Behnken, H. Strain-function method for the direct evaluation of intergranular strains and stresses. Phys. Status Solidi A Appl. Res. 2000, 177, 401–418. [Google Scholar] [CrossRef]
  7. Behnken, H.; Hauk, V. Berechnung der röntgenographischen Spannungsfaktoren texturierter Werkstoffe—Vergleich mit experimentellen Ergebnissen. Zeitschrift für Metallkunde 1991, 82, 151–158. [Google Scholar] [CrossRef]
  8. Voigt, W. Ueber die Beziehung zwischen den beiden Elasticitätsconstanten isotroper Körper. Annalen der Physik 1889, 274, 573–587. [Google Scholar] [CrossRef] [Green Version]
  9. Reuss, A. Berechnung der Fließgrenze von Mischkristallen auf Grund der Plastizitätsbedingung für Einkristalle. J. Appl. Math. Mech. 1929, 9, 49–58. [Google Scholar] [CrossRef]
  10. Eshelby, J.D. The determination of the elastic field of an ellipsoidal inclusion, and related problems. Proc. R. Soc. London. Ser. A Math. Phys. Sci. 1957, 241, 376–396. [Google Scholar] [CrossRef]
  11. Kröner, E. Berechnung der elastischen Konstanten des Vielkristalls aus den Konstanten des Einkristalls. Zeitschrift für Physik 1958, 151, 504–518. [Google Scholar] [CrossRef]
  12. Gnäupel-Herold, T.; Creuziger, A.A.; Iadicola, M. A model for calculating diffraction elastic constants. J. Appl. Crystallogr. 2012, 45, 197–206. [Google Scholar] [CrossRef]
  13. Hauk, V.; Nikolin, H.J.; Pintschovius, L. Evaluation of Deformation Residual Stresses Caused by Uniaxial Plastic Strain of Ferritic and Ferritic-Austenitic Steels/Ermittlung der durch einachsige plastische Dehnung verursachten Verformungseigenspannungen in ferritischen und ferritisch-austenitischen Stählen. Int. J. Mater. Res. 1990, 81, 556–569. [Google Scholar] [CrossRef]
  14. Johansson, J.; Odén, M.; Zeng, X.H. Evolution of the residual stress state in a duplex stainless steel during loading. Acta Mater. 1999, 47, 2669–2684. [Google Scholar] [CrossRef]
  15. Inal, K.; Lebrun, J.L.; Belassel, M. Second-order stresses and strains in heterogeneous steels: Self-consistent modeling and X-ray diffraction analysis. Metall. Mater. Trans. A 2004, 35, 2361–2369. [Google Scholar] [CrossRef]
  16. Dakhlaoui, R.; Baczmański, A.; Braham, C.; Wroński, S.; Wierzbanowski, K.; Oliver, E.C. Effect of residual stresses on individual phase mechanical properties of austeno-ferritic duplex stainless steel. Acta Mater. 2006, 54, 5027–5039. [Google Scholar] [CrossRef]
  17. Jia, N.; Peng, R.L.; Wang, Y.D.; Chai, G.C.; Johansson, S.; Wang, G.; Liaw, P.K. Interactions between the phase stress and the grain-orientation-dependent stress in duplex stainless steel during deformation. Acta Mater. 2006, 54, 3907–3916. [Google Scholar] [CrossRef]
  18. Simon, N.; Erdle, H.; Walzer, S.; Gibmeier, J.; Böhlke, T.; Liewald, M. Phase-specific residual stresses induced by deep drawing of lean duplex steel: Measurement vs. simulation. Prod. Eng. 2019, 13, 227–237. [Google Scholar] [CrossRef]
  19. Simon, N.; Krause, M.; Heinemann, P.; Erdle, H.; Böhlke, T.; Gibmeier, J. Phase-Specific Strain Hardening and Load Partitioning of Cold Rolled Duplex Stainless Steel X2CrNiN23-4. Crystals 2020, 10, 976. [Google Scholar] [CrossRef]
  20. Gadalińska, E.; Baczmański, A.; Wroński, S.; Joncour, L.L.; Braham, C.; François, M.; Panicaud, B.; Wierzbanowski, K. Direct determination of phase stress evolution in duplex steel using synchrotron diffraction. Mater. Sci. Eng. A 2021, 801, 140355. [Google Scholar] [CrossRef]
  21. Wanner, A.; Dunand, D.C. Synchrotron X-ray study of bulk lattice strains in externally loaded Cu-Mo composites. Metall. Mater. Trans. A 2000, 31, 2949–2962. [Google Scholar] [CrossRef]
  22. Gelfi, M.; Bontempi, E.; Roberti, R.; Depero, L.E. X-ray diffraction Debye Ring Analysis for STress measurement (DRAST): A new method to evaluate residual stresses. Acta Mater. 2004, 52, 583–589. [Google Scholar] [CrossRef]
  23. Bachmann, F.; Hielscher, R.; Schaeben, H. Texture analysis with MTEX- Free and open source software toolbox. Solid State Phenom. 2010, 160, 63–68. [Google Scholar] [CrossRef] [Green Version]
  24. Bunge, H.J. Texture Analysis in Materials Science: Mathematical Methods; Butterworths: London, UK, 1982. [Google Scholar]
  25. Hammersley, A.P. FIT2D: A multi-purpose data reduction, analysis and visualization program. J. Appl. Crystallogr. 2016, 49, 646–652. [Google Scholar] [CrossRef]
  26. Wcislak, L.; Klein, H.; Bunge, H.; Garbe, U.; Tschentscher, T.; Schneider, J. Texture analysis with high-energy synchrotron radiation. J. Appl. Crystallogr. 2002, 35, 82–95. [Google Scholar] [CrossRef] [Green Version]
  27. Geandier, G.; Vautrot, L.; Denand, B.; Denis, S. In Situ Stress Tensor Determination during Phase Transformation of a Metal Matrix Composite by High-Energy X-ray Diffraction. Materials 2018, 11, 1415. [Google Scholar] [CrossRef] [Green Version]
  28. Kneer, G. Zur Elastizität Vielkristalliner Aggregate Mit und Ohne Textur. Ph.D. Thesis, Technische Hochschule, Clausthal University of Technology, Bergakademie Clausthal, Germany, 1964. [Google Scholar]
  29. Every, A.G.; McCurdy, A.K. Landolt-Börnstein—Group III Condensed Matter 29A: Second and Higher Order Elastic Constants; Springer: Berlin/Heidelberg, Germany, 1992. [Google Scholar] [CrossRef]
  30. Ledbetter, H.M. Predicted monocrystal elastic constants of 304-type stainless steel. Phys. B+C 1985, 128, 1–4. [Google Scholar] [CrossRef]
  31. Gnäupel-Herold, T. ISODEC: Software for calculating diffraction elastic constants. J. Appl. Crystallogr. 2012, 45, 573–574. [Google Scholar] [CrossRef]
  32. Greenough, G.B. Residual lattice strains in plastically deformed poly-crystalline metal aggregates. Proc. R. Soc. London. Ser. A Math. Phys. Sci. 1949, 197, 556–567. [Google Scholar] [CrossRef] [Green Version]
  33. Allen, A.J.; Bourke, M.; David, W.I.F.; Dawes, S.; Hutchings, M.T.; Krawitz, A.D.; Windsor, C.G. Effects of Elastic Anisotropy on the Lattice Strains in Polycrystalline Metals and Composites Measured by Neutron Diffraction. In International Conference on Residual Stresses; Springer: Dordrecht, The Netherlands, 1989; pp. 78–83. [Google Scholar] [CrossRef]
  34. Paterson, M.S. X-ray diffraction by face-centered cubic crystals with deformation faults. J. Appl. Phys. 1952, 23, 805–811. [Google Scholar] [CrossRef]
  35. Dölle, H. The influence of multiaxial stress states, stress gradients and elastic anisotropy on the evaluation of (Residual) stresses by X-rays. J. Appl. Crystallogr. 1979, 12, 489–501. [Google Scholar] [CrossRef]
  36. Williamson, G.K.; Hall, W.H. X-ray line broadening from filed aluminium and wolfram. Acta Metall. 1953, 1, 22–31. [Google Scholar] [CrossRef]
Figure 1. Sample reference system with scattering vector m defined by azimuthal angle φ and sample inclination ψ (a). Schematic visualisation of the lattice spacing d h k l and diffraction angle θ h k l (b).
Crystals 13 00419 g001
Figure 2. Micrographs of longitudinal sections of duplex stainless steel 1.4362 (a) and ferritic stainless steel 1.4016 (b), determined by light optical microscopy after etching with Lichtenegger–Bloech and V2A etchant, respectively; rolling direction (RD) and normal direction (ND) are indicated.
Crystals 13 00419 g002
Figure 3. Depth gradients of crystallographic texture from sheet surface to centre of the austenitic phase (a) and ferritic phase (b) of the DSS and the FSS (c), depicted by volume fractions of the main texture components (top row) and the texture index J (bottom row).
Crystals 13 00419 g003
Figure 4. Exemplary diffraction profile of the duplex stainless steel sample after azimuthal integration of a segment over ± 2.5 at η = 90 (a) and experimental setup with tensile testing machine and flat-panel detector (b).
Crystals 13 00419 g004
Figure 5. Schematic visualisation of the scattering vector orientations m ( θ , η ) in the laboratory system (a). Scattering vectors for a specific diffraction angle of θ = 4.1 in the sample-fixed system as stereographic projection perpendicular to the sheet’s normal direction (ND), defined by azimuthal angle φ ND and polar angle ψ ND (b) and perpendicular to the transverse direction (TD), defined by azimuthal angle φ TD and polar angle ψ TD (c).
Crystals 13 00419 g005
Figure 6. Debye–Scherrer rings of the austenitic phase ( γ ) of the DSS (a); lattice strain vs. applied load for three selected directions ψ = η = 0 , ψ = η = 45 and ψ = η = 90 experimentally determined (solid lines) and calculated (dotted lines) for lattice planes { 111 } γ , { 200 } γ , { 220 } γ , { 311 } γ and { 222 } γ (b).
Crystals 13 00419 g006
Figure 7. Debye–Scherrer rings of the ferritic phase ( α ) of the DSS (a); Lattice strain vs. applied load for three selected directions ψ = η = 0 , ψ = η = 45 and ψ = η = 90 experimentally determined (solid lines) and calculated (dotted lines) for lattice planes { 110 } α , { 200 } α , { 221 } α and { 220 } α (b).
Crystals 13 00419 g007
Figure 8. d 100 sin 2 ψ distributions of austenite lattice planes { 200 } γ (a), { 220 } γ (b), { 311 } γ (c) and { 222 } γ (d) for selected load states during tensile deformation of the DSS: initial state (I), macroscopic yield strength (II), plastically deformed (III) and unloaded after deformation (IV); stress differences σ LD σ TD γ determined by linear regression (red dotted line) according to the sin 2 ψ method.
Crystals 13 00419 g008
Figure 9. d 100 sin 2 ψ distributions of ferrite lattice planes { 200 } α (a), { 211 } α (b) and { 220 } α (c) for selected load states during tensile deformation of the DSS: initial state (I), macroscopic yield strength (II), plastically deformed (III) and unloaded after deformation (IV); stress differences σ LD σ TD α determined by linear regression (red dotted line) according to the sin 2 ψ method.
Crystals 13 00419 g009
Figure 10. d 100 sin 2 ψ distributions of ferrite lattice planes { 200 } α (a), { 211 } α (b) and { 220 } α (c) for selected load states during tensile deformation of the FSS: initial state (I), macroscopic yield strength (II), plastically deformed (III), and unloaded after deformation (IV); stress differences σ LD σ TD α determined by linear regression (red dotted line) according to the sin 2 ψ method.
Crystals 13 00419 g010
Figure 11. d φ , ψ 100 - sin 2 ψ plots for the { 220 } γ lattice planes of the DSS for the deformed state (III), deformed state after unloading (IV) and the difference between loaded and unloaded state (V); stress evaluation is performed considering the full sin 2 ψ range 0 sin 2 ψ 1 (a) and considering only the lower half 0 sin 2 ψ 0.5 for demonstration purposes (b).
Crystals 13 00419 g011
Table 1. Chemical composition of duplex stainless steel EN 1.4362 (DSS) and ferritic stainless steel EN 1.4016 (FSS).
CCrNiMnMoCoCuFe
DSS0.03423.914.741.330.370.10.27bal.
FSS0.03416.070.240.350.020.020.21bal.
Table 2. Applied reference lattice spacings d 0 100 .
DSS AusteniteDSS FerriteFSS Ferrite
d 0 100 / Å 3.58942.86422.8630
Table 3. Diffraction elastic constants 1 2 s 2 h k l used for the austenitic phase and the ferritic phase.
AusteniteFerrite
{111}{200}{220}{311}{222}{110}{200}{211}{220}
1 2 s 2 h k l / TPa 1 5.02298.77075.95987.00525.02295.70057.62845.70055.7005
Table 4. Stresses in the ferritic phase σ LD σ TD α of the FSS for different load states (LS) at the applied true stress σ t and the true strain ε t ; evaluation according to sin 2 ψ method.
LSIIIIIIIV
ε t /-0.00000.00220.11380.1106
σ t /MPa02955200
σ LD σ TD α /MPa{200} α 10 ± 12 295 ± 14 500 ± 22 9 ± 20
{211} α 11 ± 7 321 ± 7 519 ± 3 3 ± 3
{220} α 28 ± 9 256 ± 11 479 ± 19 45 ± 16
d h k l sin 2 ψ oscillations:negligiblemarginalsignificant
Table 5. Stresses in the austenitic phase σ LD σ TD γ and ferritic phase σ LD σ TD α of the DSS for different load states (LS) at the applied true stress σ t and the true strain ε t ; evaluation according to sin 2 ψ method.
LSIIIIIIIV
ε t /-0.00000.00370.12020.1151
σ t /MPa05027930
σ LD σ TD γ /MPa{200} γ 31 ± 3 472 ± 13 906 ± 35 151 ± 25
{220} γ 12 ± 3 444 ± 6 651 ± 41 37 ± 31
{311} γ 25 ± 2 446 ± 4 815 ± 9 87 ± 9
{222} γ 20 ± 3 449 ± 3 770 ± 12 3 ± 8
σ LD σ TD α /MPa{200} α 8 ± 14 542 ± 22 750 ± 41 25 ± 40
{211} α 26 ± 8 576 ± 9 814 ± 5 58 ± 3
{220} α 29 ± 8 540 ± 17 732 ± 35 131 ± 32
d h k l sin 2 ψ oscillations:negligiblemarginalsignificant
Disclaimer/Publisher’s Note: The statements, opinions and data contained in all publications are solely those of the individual author(s) and contributor(s) and not of MDPI and/or the editor(s). MDPI and/or the editor(s) disclaim responsibility for any injury to people or property resulting from any ideas, methods, instructions or products referred to in the content.

