Article

A Study on the Co-Content Optimization of the DD15 Single-Crystal Superalloy

Science and Technology on Advanced High Temperature Structural Materials Laboratory, Beijing Institute of Aeronautical Materials, Beijing 100095, China
*
Author to whom correspondence should be addressed.
Crystals 2023, 13(3), 389; https://doi.org/10.3390/cryst13030389
Submission received: 4 February 2023 / Revised: 20 February 2023 / Accepted: 21 February 2023 / Published: 24 February 2023

Abstract

:
The fourth-generation single-crystal superalloy DD15 with 6% Co, 9% Co and 12% Co was cast using the vacuum directionally solidified furnace, while other alloying element’s content remained unchanged. The long-term aging experiment was conducted at 1100 °C for 1000 h after standard heat treatment. The stress rupture tests of the alloy were conducted at 1100 °C/137 MPa and 1140 °C/137 Mpa. The influence of Co content on the microstructure and stress rupture properties of DD15 alloy had been investigated to optimize the Co content to obtain excellent comprehensive performance. The results showed that the primary dendrite arm spacing of the alloy decreases at first and increases afterwards, and the volume fraction of γ-γ′ eutectic decreases with the growth of Co content in the as-cast microstructures. The size, cubic degree and volume fraction of the γ′ phase of the alloy after standard heat treatment all decrease with the increase in Co content. The microstructure stability of the alloy is enhanced with the increase in Co content. No TCP phase was present in the alloy with 12% Co precipitate even after aging 1000 h. The stress rupture lives at two conditions, both reduced in different degrees with the increase in Co content. The effect of Co on the stress rupture life of the alloy improves with the increase in Co content or test temperature. The acicular TCP phase appeared in the 6% Co alloy and 9% Co alloy in the microstructure of the ruptured specimens with different Co contents. Moreover, the TCP phase content in the 6% Co alloy is much more than that in the 9% Co alloy. There is no TCP phase precipitation in the 12% Co alloy. At last, the relationship between microstructure stability, stress rupture properties and Co content of the alloy is discussed. The alloy containing 9% Co is the best choice considering the microstructure stability and stress rupture properties.

1. Introduction

The Ni-based single-crystal superalloy has been extensively used as one of the key materials for the blade part in advanced aero-engines because of their excellent comprehensive performance [1]. The temperature capability of the turbine blade has increased significantly in the past several decades. Some advancements have been achieved by improving the content of the alloying elements.
Co is an essential alloying element in high-generation single-crystal superalloys. It is mainly soluble in the γ phase and only a small amount of Co enters the γ′ phase. Co can lower the stacking fault energy of the γ phase and form secondary carbides [2]. Co can increase the solid solubility of Cr, Mo and W elements in the γ matrix [3]. Excessive Co may lower the γ′ phase content, mechanical strength and initial melting temperature of the alloy [4]. The oxidation and corrosion resistance, stress rupture life and dendrite segregation of the alloy may be improved with the appropriate amount of Co [5,6,7]. With the increase in the refractory alloying elements, the alloy tends to precipitate TCP phases, which leads to a reduction in the mechanical properties [8,9,10]. It has become increasingly difficult to develop new single-crystal superalloys with a balanced combination of strength, environmental resistance, castability and microstructural stability.
There are different opinions about the Co content in the alloy to achieve good microstructure stability. The Co content is 3.3% in the third-generation single-crystal superalloy CMSX-10 [11]. However, the increase in Co to 12.5% can also make another same-generation alloy, René N6, which has good microstructural stability [12]. The Co contents of the fourth-generation single-crystal superalloys EPM-102, NG-MC and TMS-138 developed, respectively, by America, France and Japan are 16.5%, <0.2% and 5.9% [13,14,15]. Moreover, there are few studies on the effect of Co element on the fourth-generation single-crystal superalloy in the public literature.
The DD15 alloy studied in this paper was developed for aeroengine turbine blade application by the Beijing Institute of Aeronautical Materials. The properties of the alloy are equivalent to those of other fourth-generation single-crystal superalloys. The influence of Co content on the microstructure and mechanical properties at high temperatures of the fourth-generation single-crystal superalloy DD15 was investigated in this paper with the aim to optimize its chemical composition, microstructure and properties.

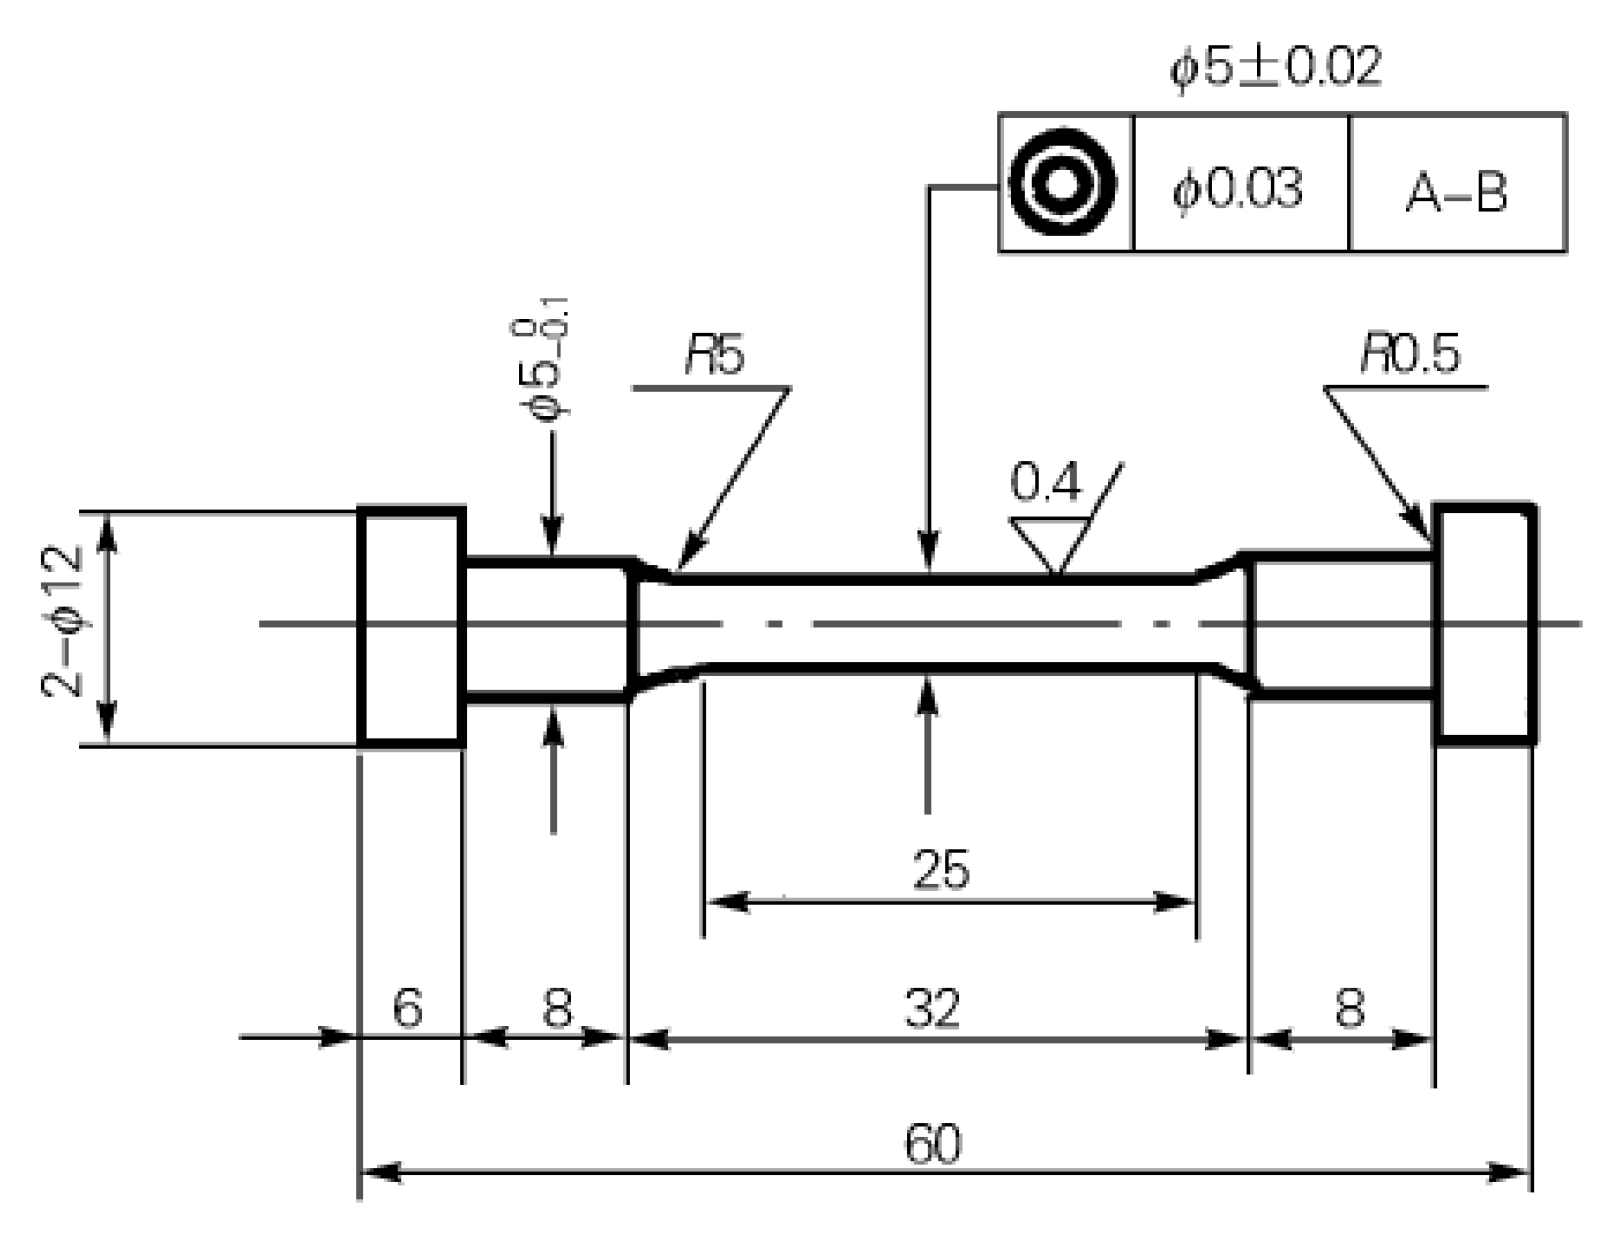
2. Materials and Methods

Commercially pure raw materials were used to prepare master alloy heat in a vacuum-induction furnace. Three single-crystal samples with the size of ϕ 15 mm × 180 mm were cast using a crystal selection method in the vacuum directionally solidified furnace with a high-temperature gradient by adding different Co contents in the alloy. The Co contents of three alloys were 6%, 9% and 12%, respectively, and the other alloying element’s content was the same. The nominal chemical components of the three alloys are listed in Table 1. The crystal orientations of the samples were analyzed with the Laue X-ray back-reflection method, and the growing direction was within 15 degrees deviating from the [001] orientation.
The heat treatment of the samples proceeded according to their different heat treatment regimes. The single-crystal specimens received a standard heat treatment comprising a solution treatment and a two-step aging treatment. The solution treatments of the alloy with 6% Co, 9% Co and 12% Co were 1340 °C/5 h/AC, 1335 °C/5 h/AC and 1330 °C/5 h/AC, respectively. The two-step aging treatment of the alloy was 1140 °C/4 h/AC + 870 °C/32 h/AC. All the samples were kept for 200 h, 400 h, 600 h, 800 h and 1000 h at 1100 °C for long-term aging to check the effect of Co content on the microstructural stability of the alloy.
The standard cylinder samples for stress rupture tests were prepared after standard heat treatment. The shape and size of the stress rupture specimen are shown in Figure 1. The stress rupture test experiment was carried out at 1100 °C/137 MPa and 1140 °C/137 MPa in air. Every datum is the mean value of three specimens. The longitudinal profile microstructure of the stress rupture samples was observed.
The microstructures of the samples with different states were analyzed with a Leica DM4000M optical microscope (OM) made in Germany, a Zeiss supra 55 field-emission scanning electron microscope (SEM) made in Germany and a JEOL JEM-2100F transmission electron microscope (TEM) made in Japan. The image analysis software was used to analyze the primary dendrite arm spacing and the volume fraction of eutectic. The samples for SEM were etched for 6~9 s with 5 g CuSO4 + 25 mL HCl + 20 mL H2O + 5 mL H2SO4, which dissolves the γ′ phase. Foils for TEM of the creep-ruptured samples analysis were obtained by cutting 0.2 mm thick discs perpendicular to the tensile axis of the specimens using an electric discharge machine. Thin foils were prepared by using twin-jet thinning electrolytically in a solution of 10 vol% perchloric acid and 90 vol% ethanol at −10 °C using liquid nitrogen.

3. Results

3.1. Heat Treatment Microstructure

Figure 2 shows the as-cast microstructure of the alloy with different Co contents. These samples were sectioned normally to the solidification direction and show a typical dendritic microstructure. The primary dendrite arm spacing of the alloy with 6% Co, 9% Co and 12% Co are 365 μm, 342 μm and 351 μm, respectively. The primary dendrite arm spacing decreases at first and increases afterwards with the increase in Co content. In addition, the structure contains pools of γ-γ′ eutectic in the interdendritic region. The eutectic fraction represents the remaining liquid at the last stage of solidification. After quantitative calculation, the eutectic fractions in the alloy with 6% Co, 9% Co and 12% Co are 11.8%, 11.2 and 10.5%, respectively. The volume fraction of the γ-γ′ eutectic decreases with the increase in Co content.
The eutectic fraction represents the remaining liquid at the last stage of solidification. The γ forming elements, such as Co, Cr, Re, Mo and W all tend to segregate towards the dendrite core during solidification. This indicates that these elements are the first to solidify within the dendrite cores during the single-crystal superalloy withdrawal process. The γ′ forming elements, such as Al, Hf, Nb and Ta all tend to segregate into the interdendritic region. These elements are present in greater quantity in the last liquid phase to solidify and result in large eutectic γ-γ′ phases forming within the interdendritic regions. Much less residual liquid may be forced to reach the eutectic point with the increase in the concentration of Co. This may result in the formation of much less eutectic. So, the volume fraction of γ-γ′ eutectic of the alloy decreases with the increase in Co content in the as-cast microstructures.

3.2. Heat Treatment Microstructure

Figure 3 shows the heat treatment microstructures of the alloy with different Co contents. It illustrates that they consist of the cubic γ′ phase precipitated coherently in the γ phase. The γ-γ′ eutectic and coarse γ′ phase completely disappeared after heat treatment at high temperatures. The new fine γ′ phase precipitated from the supersaturated γ solid solution during the following cooling process. The homogeneous distribution of strengthening the cubic γ′ phase was obtained after two stages of aging treatment. Comparing the three pictures, it can be seen that the cubic degree of γ′ phase slightly declines as the Co content rises. Figure 4 shows the effect of Co content on the size and volume fraction of the γ′ phase of the alloy calculated using data statistics. The γ′ phase size is about 0.3–0.4 µm and the volume fraction of γ′ phase is about 55–65% for the different Co content alloys. It is shown that the size and volume fraction of the γ′ phase of the alloy all decrease with the increase in Co content.

3.3. Long-Term Aging Microstructure

Figure 5 illustrates the long-term aging microstructures of the alloy with different Co contents at 1100 °C at various times. It is shown in Figure 5 that the γ′ phases are no longer in cubic shape in the 6% Co alloy after long-term aging 200 h. They merge and grow together to form rafts along the [100] or [010] direction. There is no TCP phase precipitated. However, a lot of acicular TCP phase is observed with a 45° angle relative to the rafted orientation after aging 400 h. The amount of TCP phase greatly increases and the rafting degree of the γ′ phase does not change greatly after aging 1000 h. The rafted structure has formed and there is no TCP phase observed in the 9% Co alloy after aging 800 h. A small amount of acicular TCP phase appears with a 45° angle relative to the rafted orientation after aging 1000 h. The rafted structure has formed, and no TCP phase precipitates in the alloy with 12% Co even after long-term aging 1000 h. It may be concluded that the microstructural stability of the alloy is enhanced as Co content increases.
The chemical components of the TCP phase in the 6% Co alloy and 9% Co alloy aging for 1000 h are shown in Table 2. In both samples, the TCP phase is rich in Re and W elements. In contrast, the TCP phase in 9% Co alloy contains fewer Re and W elements and much more Co and Ta elements compared with that in the 6% Co alloy.

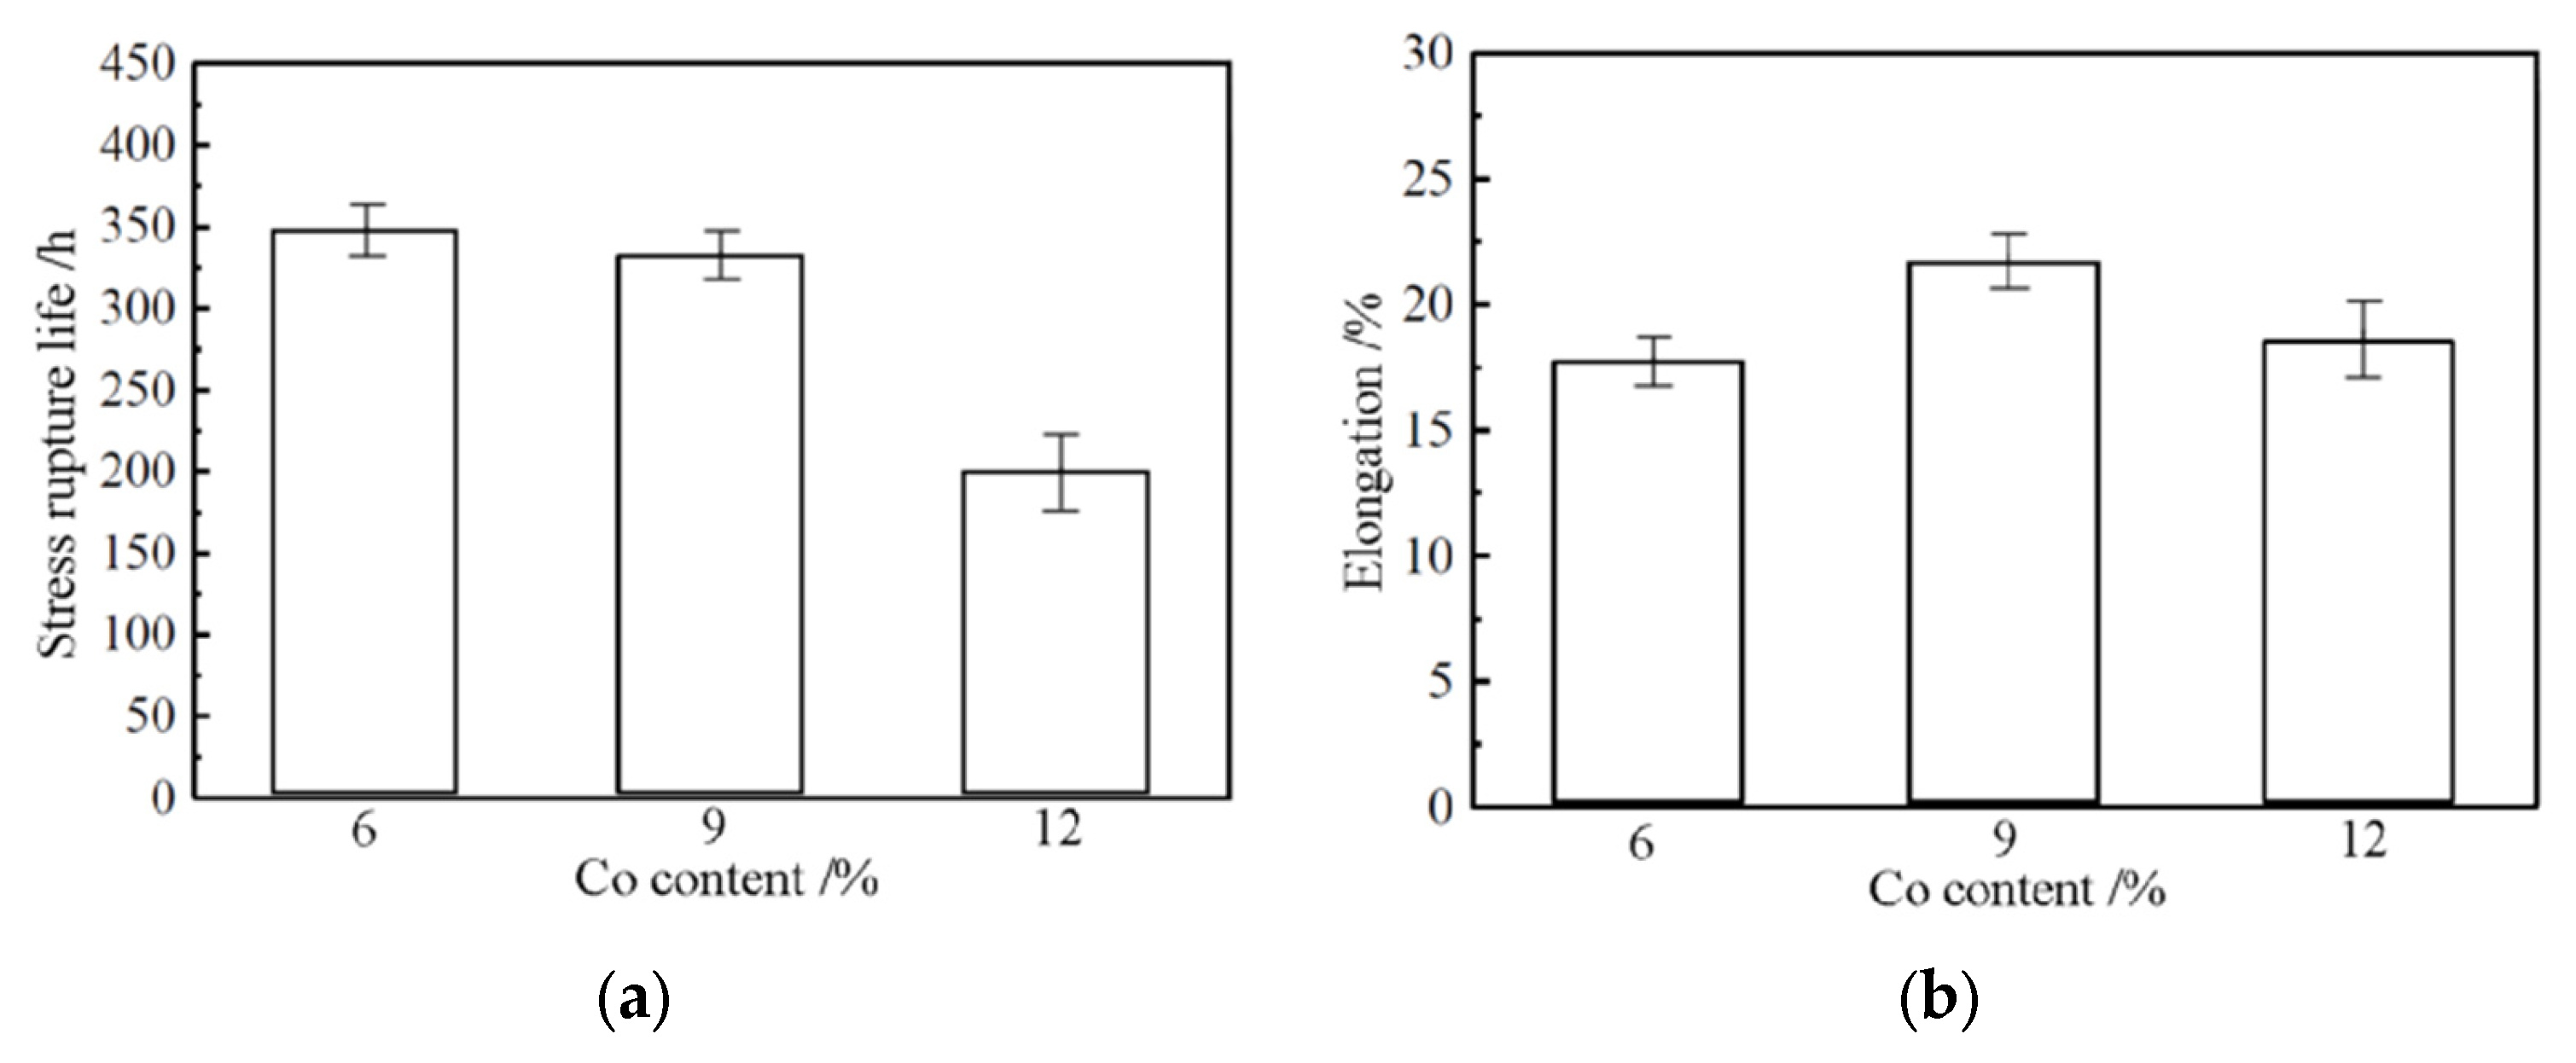
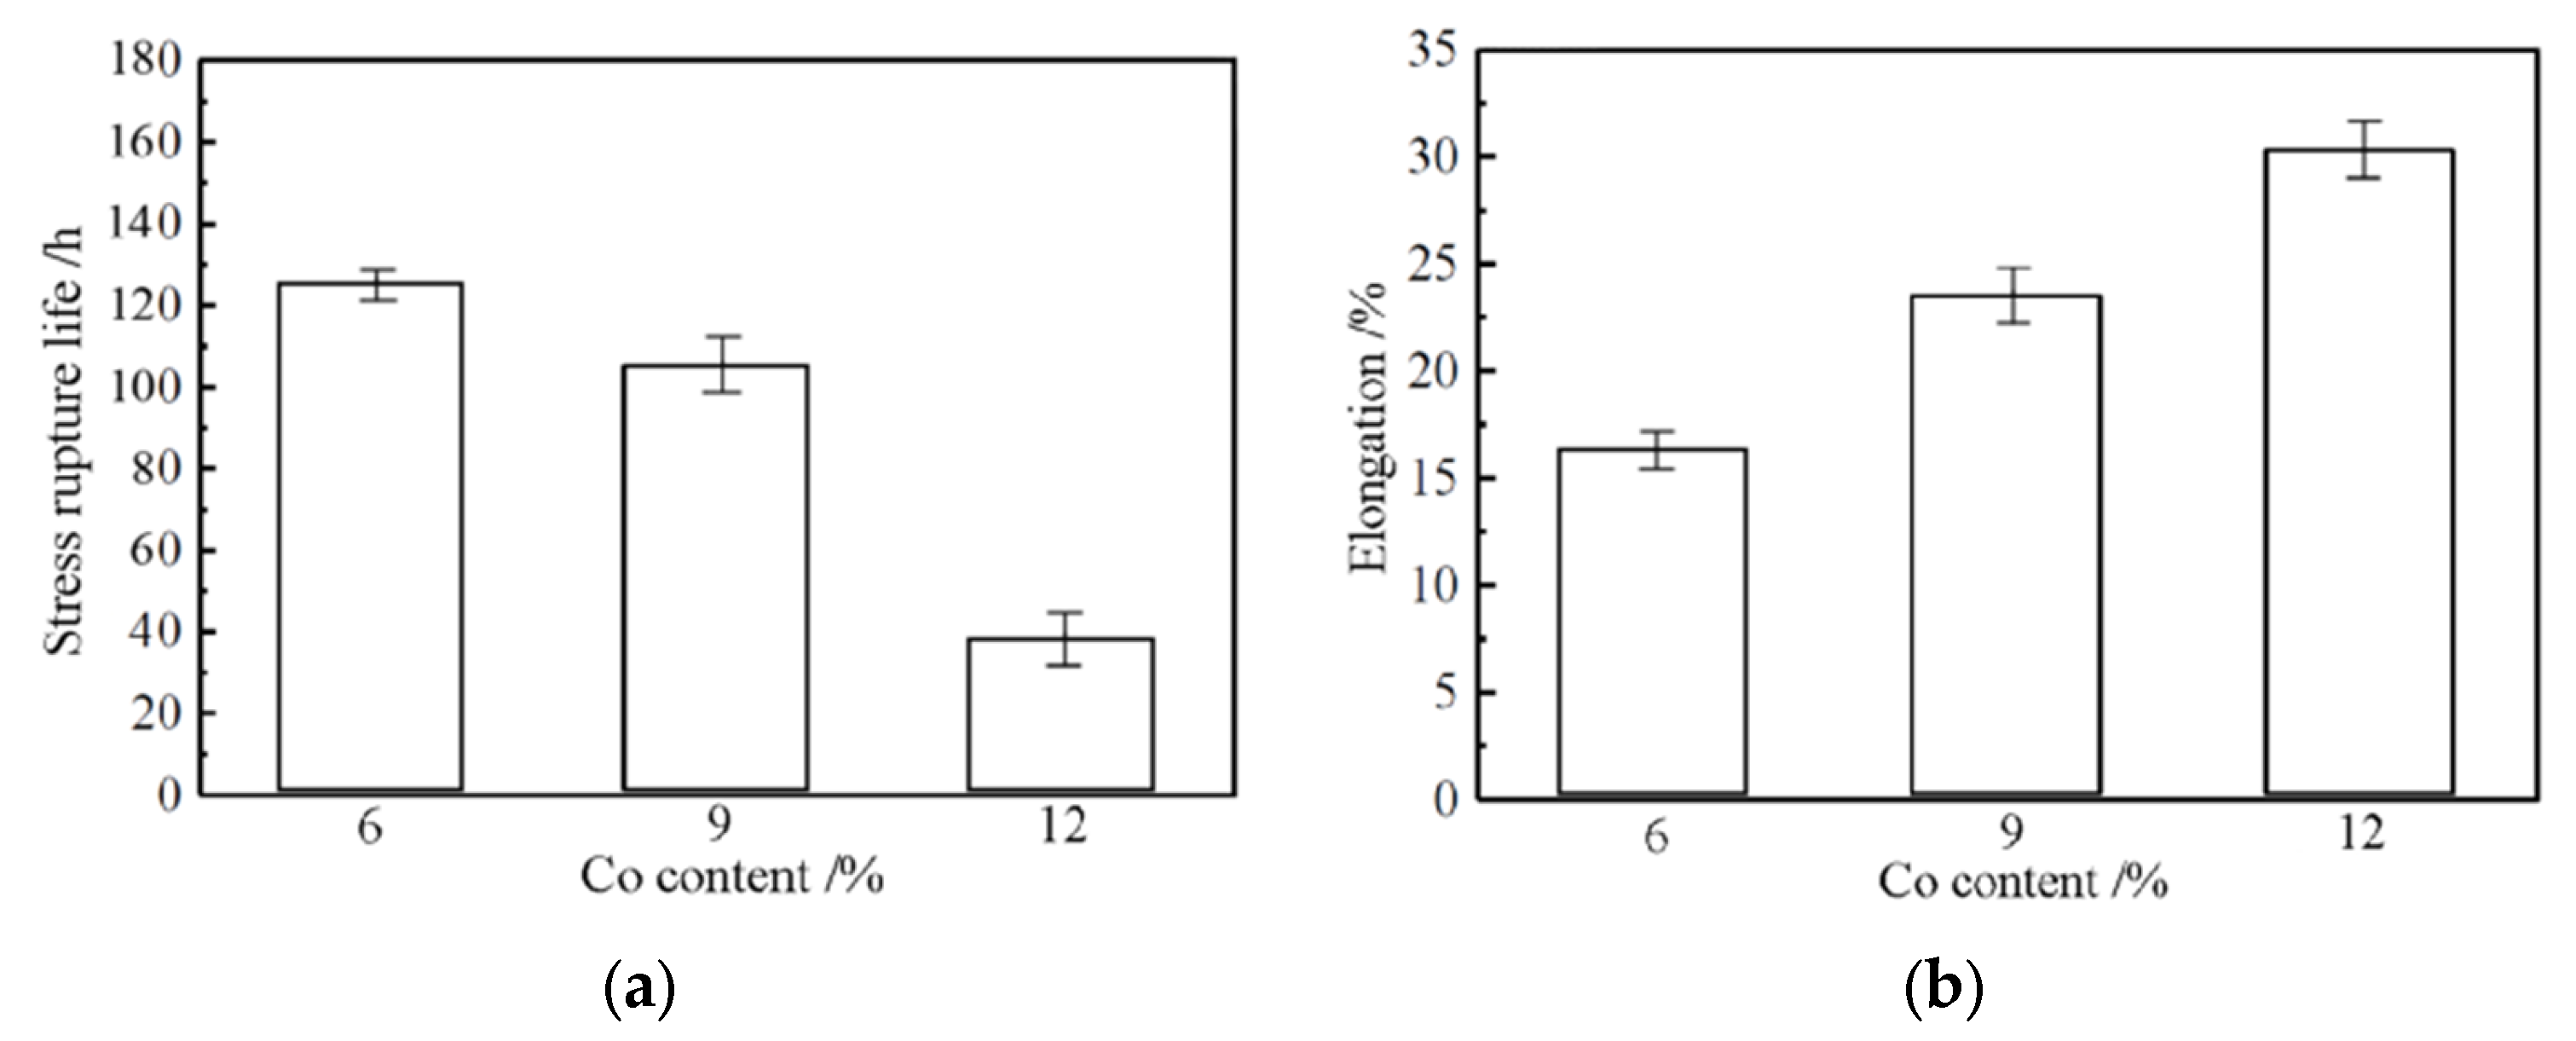
3.4. Stress Rupture Properties

The influence of Co content on the stress rupture properties of the alloy at different conditions is shown in Figure 6 and Figure 7.
Figure 6 and Figure 7 illustrate that with increasing Co content, the stress rupture life of the alloy at 1100 °C/137 MPa and 1140 °C/137 MPa all reduce in different degrees; the elongation at 1100 °C/137 MPa increases at first and decreases afterwards, but then at 1140 °C/137 MPa, monotonously increases. When Co content increases from 6% to 9% and 12%, the stress rupture life at 1100 °C/137 MPa decreases by 4.5% and 42.2%, then at 1140 °C/137 MPa and declines by 16.7% and 76.9%, respectively. This indicates that the effect of the Co element on the stress rupture life of the alloy improves with the increase in Co content or test temperature.

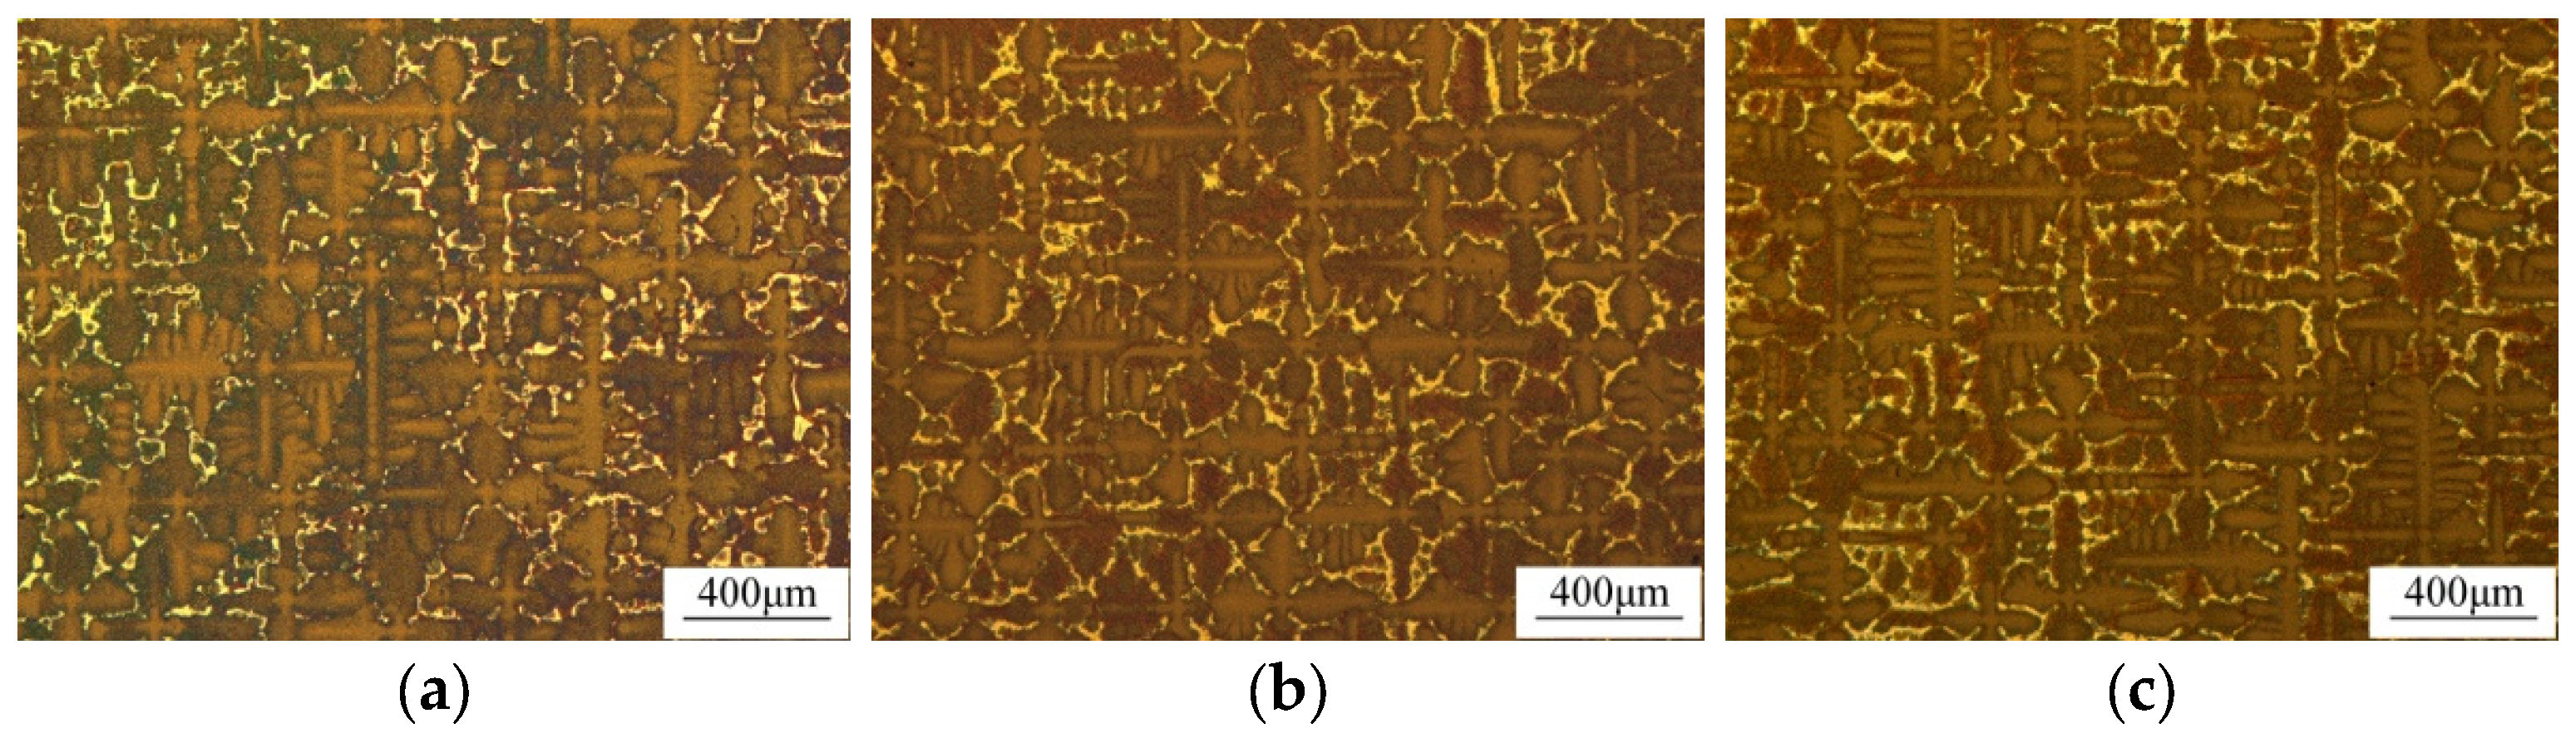
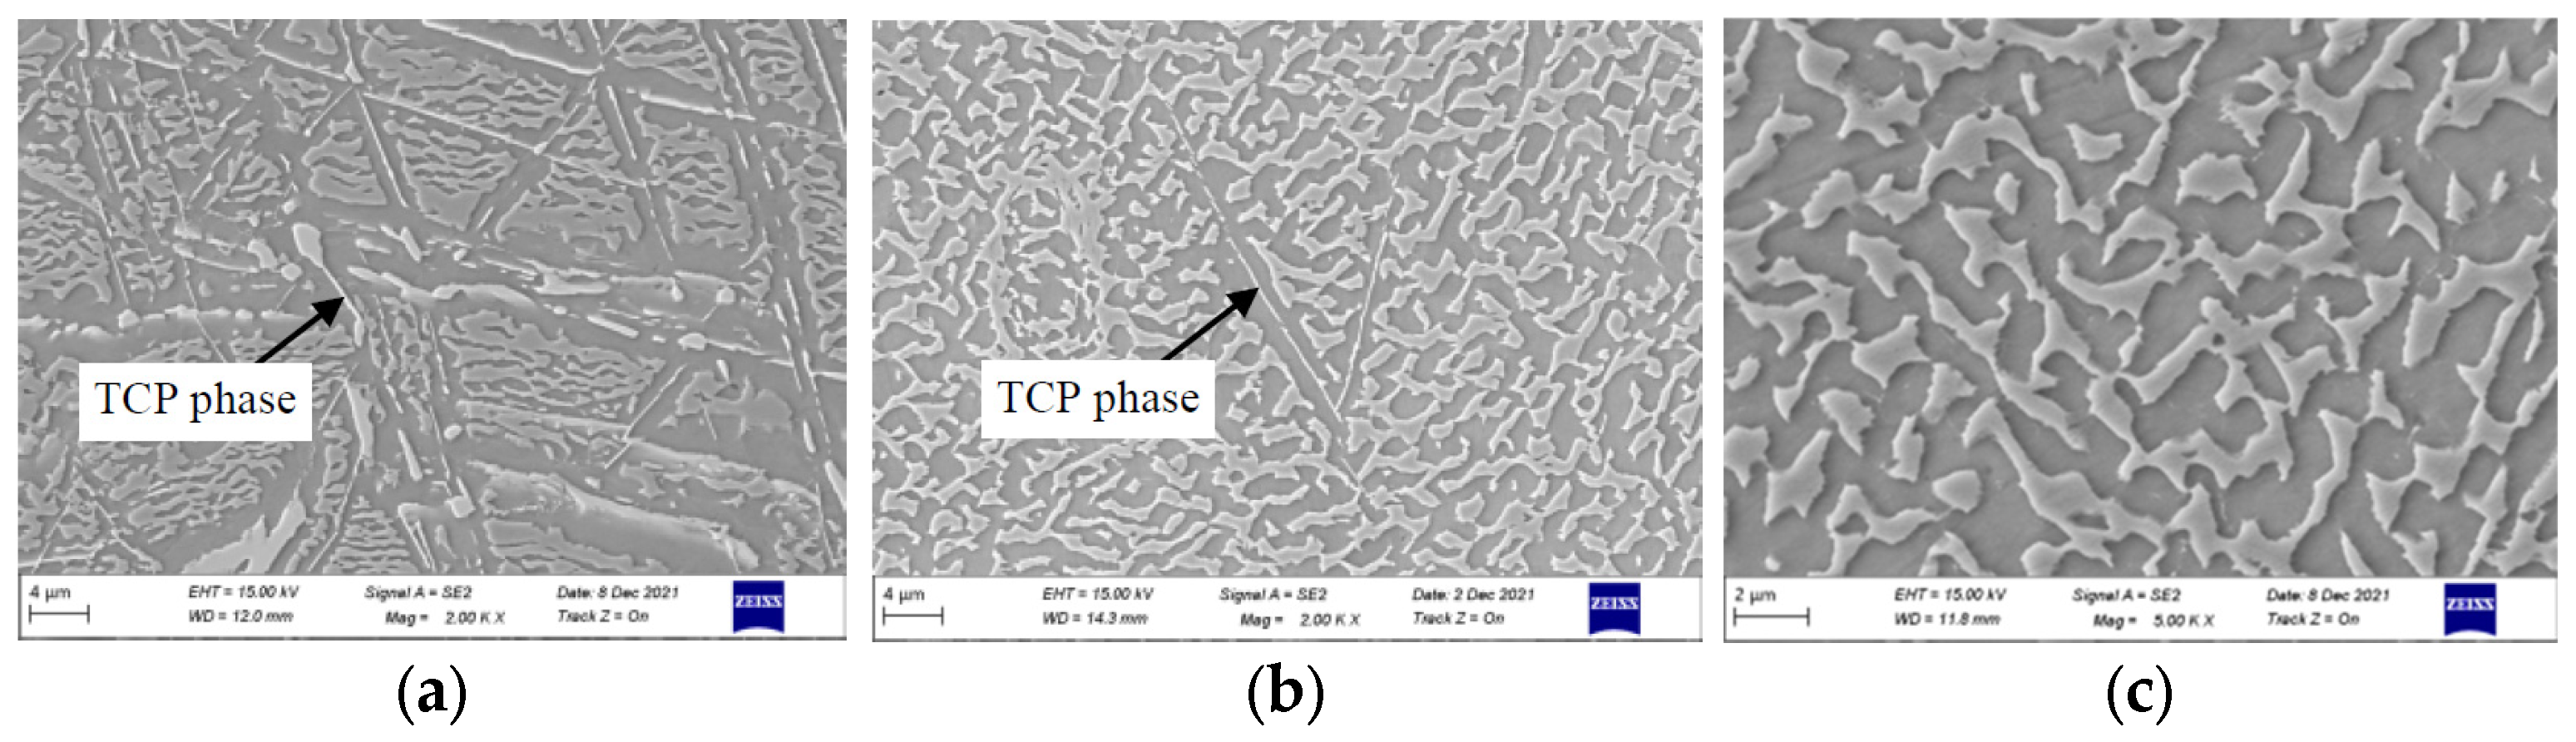
3.5. Microstructure of Stress Ruptured Samples

The longitudinal section microstructure of the stress ruptured samples with different Co content at 1100 °C/137 MPa and 1140 °C/137 MPa was observed. Figure 8 and Figure 9 show the microstructure at 1.5 cm from the fracture surface of the ruptured samples at different conditions, while Figure 10 and Figure 11 show the microstructure adjacent to the fracture surface of the ruptured samples at different conditions.
It is shown in Figure 8 that the γ′ particles degenerate into the rafts in the orientation vertical to the tensile stress for three alloys at the condition of 1100 °C/137 MPa. The difference is that the thickness of the raft decreases slightly with the increase in Co content in addition to the presence of the TCP phase in the 6% Co alloy. The continuity of the rafted structure is destroyed by the acicular TCP phase. It can be seen in Figure 10 that the γ matrix is not continuous and has become islands that are completely surrounded by the γ′ precipitates, which is called “topological inversion” [16]. The raft displays a slightly twisted configuration because the stress state near the fracture surface is different to that apart from the fracture surface. The acicular TCP phase has presented in the 6% Co alloy and 9% Co alloy. Moreover, the amount of TCP phase in 6% Co alloy is much more than that in 9% Co alloy.
It is shown in Figure 9 that the γ′ particles also degenerate into the rafts in the orientation vertical to the tensile stress for three alloys at 1140 °C/137 MPa. The difference is that the thickness of the raft decrease slightly with the increase in Co content, but there is no TCP phase formed in the 6% Co alloy. It is shown in Figure 11 that the γ phase presented similar characteristics and the so-called topological inversion can also be seen. The acicular TCP phase forms in the 6% Co alloy and 9% Co alloy. The amount of TCP phase in the 6% Co alloy is much more than that in the 9% Co alloy. Compared with 1100 °C/137 MPa, a new discovery is that the secondary fine γ′ particles precipitated after the stress rupture process. The integrity of the dislocation network is damaged by the secondary γ′ particles, so this is an adverse impact on the mechanical properties of the alloy at high temperatures [17].
A conclusion can be drawn from the above analysis, which is as the Co content rises, the microstructure stability of the alloy is enhanced. This is consistent with the results of the long-term aging experiment.

4. Discussion

4.1. Microstructure Evolution of the γ′ Phase

The directional growth of γ′ particles in long-term aging is the result of the combined actions of thermodynamics and kinetics. The driving force for the growth and coarsening is the decrease in the interfacial energy between the γ′ particles and γ matrix [18]. The larger γ′ particles grow and smaller γ′ particles dissolve with the increase in aging time. In LSW theory [19], if the coarsening of the γ′ phase is diffusion controlled, the following formula will be valid:
( r t 3 r 0 3 ) 1 / 3 = K t 1 / 3
where r0 is the initial particle radius, rt is the instantaneous particle radius, K is the rate constant and t is the aging time.
In the stress rupture process, the cubic γ′ phase gradually changed into a raft structure because of the directional diffusion of the elements. The diffusion and redistribution of the alloying elements in the γ′ and γ phases have occurred [20]. With the action of the applied stress and the misfit stress at high temperature, the γ′ phase forming elements Al, Ta, Nb and Hf diffuse to the vertical channels to promote the γ′ phase growth perpendicular to [001] direction. At the same time, the γ matrix forming elements Cr, Co, W, Mo, Re and Ru diffuse to the horizontal channels in the reverse orientation to increase the width of the γ matrix. Under the condition of temperature and stress, the γ′ rafted structure gradually formed. The formation of regular and perfect γ′ rafts has a good effect on the stress rupture life of the single-crystal superalloy.

4.2. Microstructural Stability of the Alloy

The microstructural stability of high-generation single-crystal superalloys is one of the key technical indexes [21]. The volume fraction and precipitation rate of the TCP phase both declined with the increase in Co content both in the long-term aging experiment and stress rupture properties test. It shows that increasing Co content in the single-crystal superalloys can improve microstructure stability at high temperatures. The TCP phase precipitate of the alloys is ascribed to that of the high-melting-point alloying elements (Re, W, Mo, et al.) in the disordered γ matrix which are oversaturated [22]. The equilibrium phase precipitation characteristics of the alloy with different Co content were studied using JMatPro software and the corresponding database. The research result of equilibrium phases of the alloy with different Co contents at 1100 °C is illustrated in Figure 12. There are four equilibrium phases in the alloy: γ phase, γ′ phase, TCP phase and carbide. There is a small change for the TCP phase and MC as the Co content increases from 6% to 12%. However, the amount of γ′ phase greatly declines and the γ matrix greatly increases with the increase in Co content. The three alloys all have the same amount of Re, W, Mo and other γ phase formation elements. With the increase in the volume fraction of the γ phase, the concentration of these elements in the γ matrix can be declined accordingly. So, the supersaturating degree of the high-melting-point alloying elements (Re, W and Mo) within the γ matrix will be reduced and the microstructural stability of the alloy can be enhanced as Co content rises.
It is shown that TCP phases precipitated and grew along a fixed direction in all of the specimens in the long-term aging or stress rupture testing. The crystal structures of the TCP phases are extremely complex, and the size of the unit cell is much larger than the lattice of the γ and γ′ phases. A large nucleation barrier serves to prevent the formation of TCP phases in the microstructures of single-crystal superalloys [23]. When TCP phases form in the alloys, they nucleate preferentially on close-packed planes, forming a semicoherent interface, and exhibit distinctive orientation relationships with the parent crystal [24].

4.3. Stress Rupture Properties of the Alloy

The variation of stress rupture properties of the alloy with different Co contents can be attributed to the microstructure changes. The excellent mechanical properties of single-crystal superalloys are mainly attributed to the solution strength of the γ phase, the precipitation strengthening of γ′ phase and γ/γ′ interface strengthening.
Firstly, the atomic radius of Co and Ni is 0.167 nm and 0.162 nm, respectively. The solid solution strengthening effect of the Co element is very small because Co and Ni have very little difference in atomic radius. Co and Ni may be intermiscible indefinitely. Moreover, Co is a γ matrix formatting element. The increase in Co content is equivalent to increasing the solvent, diluting the concentration of solution strength elements, such as Mo, W and Re, et al. The solid solution strengthening action of the alloy is reduced as Co content rises.
Secondly, the mechanical property of the alloy is greatly influenced by the γ′ phase content as considering the precipitation enhancement [9]. Both experiment and phase diagram calculations show that the volume fraction of the γ′ phase decreases with the increase in Co content, which greatly decreases the precipitation-strengthening effect of the alloy.
Lastly, dislocations and interfaces provide increased diffusion promoting by-passing of the γ′ phase by climbing at elevated temperatures [25]. The deformation feature of the alloy is the movement of 1/2 [110] dislocations on the octahedral slip systems in the matrix channels [26]. The dislocation networks in the matrix result from the reaction of two sets of dislocations with different Burgers vectors during creep. These dislocations exist in different slip planes. Once these dislocations move to the same slip plane to come across each other, the three-dimensional networks may be formed by the reaction of the dislocation. The denser dislocation networks may be strongly impeded by the subsequent dislocation to cut into the γ′ precipitate and make the alloy maintain a minimum creep rate [27]. Figure 13 shows the γ/γ′ interfacial dislocation configuration of ruptured samples at 1100 °C/137 MPa. It is shown that the dislocation networks at γ/γ′ interfaces have been clearly formed for the samples. The denser extent of the dislocation network is related to the latticle mifit. The lattice misfit of the alloy is more negative with the decrease in Co content. The dislocation network of the alloy turns sparser and dislocation spacings become bigger with the increase in Co content. Therefore, this is also a reason that the stress rupture lives of the alloy decrease as the Co content rises.
On the other hand, as the Co content rises, the microstructural stability of the alloy is enhanced. It is beneficial to the stress rupture properties of the alloy. There are three main reasons for the negative role of the TCP phase on the stress rupture properties. Firstly, the TCP phase is brittle; it is the site for crack initiation and the easy way for crack propagation during plastic deformation. Secondly, the TCP phase destroys the continuity of the matrix. Finally, the solid solution strengthening elements, such as Re and W, are enriched in the TCP phase, as shown in Table 2, which results in Re and W in the matrix surrounding the TCP phase and decreases the solid solution strengthening of the matrix. Therefore, these lead to an extensive envelope of the γ′ phase around the TCP phase which may potentially act as a channel for preferential deformation [28].
A combination of beneficial and harmful effects is associated with increasing Co content; the alloy containing 9% Co is the best choice considering the microstructure stability and stress rupture properties.

5. Conclusions

(1)
The primary dendrite arm spacing of the alloy decreases at first and increases afterwards, and the volume fraction of γ-γ′ eutectic decreases with the increase in Co content in the as-cast microstructures.
(2)
The size, cubic degree and volume fraction of γ′ phase of the alloy after standard heat treatment all decrease with the increase in Co content. The microstructural stability of the alloy is enhanced with the increase in Co content. No TCP phase in the alloy with 12% Co precipitate even after aging 1000 h.
(3)
The stress rupture lives at two conditions both reduce at different degrees with the increase in Co content. The effect of the Co element on the stress rupture life of the alloy improves with the increase in Co content or test temperature.
(4)
The acicular TCP phase appears in the 6% Co alloy and 9% Co alloy in the microstructure of the ruptured specimens with different Co contents. Moreover, the TCP phase content in the 6% Co alloy is much more than that in the 9% Co alloy. No TCP phase is observed in the 12% Co alloy.
(5)
The alloy containing 9% Co is the best choice considering the microstructure stability and stress rupture properties.

Author Contributions

Experiment conduction, writing—original draft preparation, Z.S.; data and image processing—S.L. All authors have read and agreed to the published version of the manuscript.

Funding

This research was funded by the National Science and Technology Major Project (2017-VI-0002-0071).

Data Availability Statement

Not applicable.

Conflicts of Interest

The authors declare no conflict of interest.

References

  1. Caron, P.; Khan, T. Evolution of Ni-based superalloys for single crystal gas turbine blade applications. Aerosp. Sci. Technol. 1999, 3, 513–523. [Google Scholar] [CrossRef]
  2. Zheng, Y.R.; Zhang, D.T. Color Metallographic Investigation of Superalloy and Steels; National Defence Industry Press: Beijing, Chian, 1999; pp. 6–7. [Google Scholar]
  3. Li, J.R.; Xiong, J.C.; Tang, D.Z. Advanced High Temperature Structure Materials and Technology; National Defence Industry Press: Beijing, China, 2012; pp. 19–20. [Google Scholar]
  4. Yang, D.Y.; Jin, T.; Zhao, N.R. The influence of cobalt, tungsten, and titanium on the as-east microstructure of single crystal nickel-base superalloys. J. Aeronaut. Mater. 2003, 23, 17–20. [Google Scholar]
  5. Yang, D.Y.; Zhang, X.; Jin, T. The Innuence of cobalt, tungsten, and titanium on stress-rupture properties of Nickel-base Single Crystal Superalloy. Rare Met. Mater. Eng. 2005, 34, 1295–1298. [Google Scholar]
  6. Liu, J.L.; Zhang, J.; Meng, J.; Jia, Y.X.; Jin, T. The effect of Co on the microstructure and stress rupture properties of a single crystal superalloy. Mater. Res. Innov. 2014, S4, 414–420. [Google Scholar] [CrossRef]
  7. Wang, W.Z.; Jin, T.; Zhao, N.R.; Wang, Z.H.; Sun, X.F.; Guan, H.R.; Hu, Z.Q. Effect of Cobalt on chemical segregation and solution process in Re-containing single crystal superalloys. In Proceedings of the 2006 Beijing International Materials Week, Beijing, China, 25–30 June 2006; pp. 1978–1981. [Google Scholar]
  8. Zhao, G.Q.; Tian, S.G.; Zhu, X.J. Effect of element Ru on microstructure and creep behaviour of single crystal nickel-based superalloy. Mater. High Temp. 2019, 36, 132–141. [Google Scholar] [CrossRef]
  9. Shi, Z.X.; Li, J.R.; Liu, S.Z. Effect of long term aging on microstructure and stress rupture properties of a Nickel based single crystal superalloy. Prog. Nat. Sci. Mater. Int. 2012, 22, 426–432. [Google Scholar] [CrossRef] [Green Version]
  10. Yang, W.C.; Liu, C.; Qu, P.F. Strengthening enhanced by Ru partitioned to γ′ phases in advanced Nickel-based single crystal superalloys. Mater. Charact. 2022, 186, 111809. [Google Scholar] [CrossRef]
  11. Erickson, G.L. The development and application of CMSX-10. In Superalloys; TMS: Warrendale, PA, USA, 1996; pp. 35–44. [Google Scholar]
  12. Walson, W.S.; O′hara, K.; Ross, E.W.; Pollock, T.M.; Murphy, W.H. RenéN6: Third generation single crystal superalloy. In Superalloys; TMS: Warrendale, PA, USA, 1996; pp. 27–34. [Google Scholar]
  13. Walston, S.; Cetel, A.; Mackay, R.; O′hara, K.; Duhl, D.; Deshfield, R. Joint development of a fourth generation single crystal superalloy. In Superalloys; TMS: Pennsylvania, PA, USA, 2004; pp. 15–24. [Google Scholar]
  14. Argence, D.; Vernault, C.; Desvallees, Y.; Fournier, D. MC-NG: Generation single crystal superalloy for future aeronautical turbine blades and vanes. In Superalloys; TMS: Warrendale, PA, USA, 2000; pp. 829–837. [Google Scholar]
  15. Zhang, J.X.; Murakumo, T.; Koizumi, Y.; Kobayshi, T.; Harada, H. Interfacial Dislocation Networks Strengthening a Fourth-Generation Single-Crystal TMS-138 Superalloy. Metall. Mater. Trans. A 2002, 33, 3741–3746. [Google Scholar] [CrossRef]
  16. Maciej, Z.; Steffen, N.; Mathias, G. Characterization of γ and γ’ phases in 2nd and 4th generation single crystal Nickel-Base superalloys. Met. Mater. Int. 2017, 23, 126–131. [Google Scholar]
  17. Shi, Z.X.; Li, J.R.; Liu, S.Z. Effect of Hf on the microstructures and stress rupture properties of DD6 single crystal superalloy. Rare Met. Mater. Eng. 2010, 39, 1334–1338. [Google Scholar]
  18. Ren, Y.L.; Jin, T.; Guan, H.R.; Hu, Z.Q. The effect of long aging time at high temperature on the structure evolution of γ′ phase for a Nickel base single crystalline superalloy. Mater. Mech. Eng. 2004, 28, 10–12. (In Chinese) [Google Scholar]
  19. Lifshitz, M.; Slyozov, V.V. The kinetics of precipitation from supersaturated solid solution. J. Phys. Chem. Solids 1961, 19, 35–50. [Google Scholar] [CrossRef]
  20. Tian, S.G.; Zhang, J.H.; Zhou, H.H.; Yang, H.C.; Xu, Y.B.; Hu, Z.Q. Aspects of primary creep of a single crystal nickel-base superalloy. Mater. Sci. Eng. A 1999, 262, 271–280. [Google Scholar]
  21. Yan, H.J.; Tian, S.G.; Zhao, G.Q. Deformation features and affecting factors of a Re/Ru-containing single crystal nickel-based superalloy during creep at elevated temperature. Mater. Sci. Eng. A 2019, 768, 138437. [Google Scholar] [CrossRef]
  22. Han, Y.F.; Ma, W.Y.; Dong, Z.Q.; Li, S.S.; Gong, S.K. Effect of Ruthenium on microstructure and stress rupture properties of a single crystal Nickel-base superalloy. In Superalloys; TMS: Pennsylvania, PA, USA, 2008; pp. 91–97. [Google Scholar]
  23. Neumeier, S.; Pyczak, F.; Goken, M. The influence of Ruthenium and Rhenium on the local properties of the γ- and γ′-phase in Nickel-base superalloys and their consequences for alloy behavior. In Superalloys; TMS: Pennsylvania, PA, USA, 2008; pp. 109–110. [Google Scholar]
  24. Rae, C.M.F.; Karunaratne, M.S.A.; Small, C.J.; Broomfield, R.W.; Jones, C.N.; Reed, R.C. Topologically close packed phases in an experimental Rhenium-containing single crystal superalloy. In Superalloys; TMS: Warrendale, PA, USA, 2000; pp. 767–777. [Google Scholar]
  25. Tian, S.G.; Zhang, J.H.; Zhou, H.H.; Yang, H.C.; Xu, Y.B.; Hu, Z.Q. Formation and role of dislocation networks during high temperature creep of a single crystal nickel–base superalloy. Mater. Sci. Eng. A 2000, 279, 160–165. [Google Scholar]
  26. Yu, J.J.; Sun, X.F.; Jin, T.; Zhao, N.R.; Guan, H.R.; Hu, Z.Q. High temperature creep and low cycle fatigue of a nickel-base superalloy. Mater. Sci. Eng. A 2010, 527, 2379–2389. [Google Scholar] [CrossRef]
  27. Tian, S.G.; Zhang, B.S.; Shu, D.L. Creep properties and deformation mechanism of the containing 4.5Re/3.0Ru single crystal nickel-based superalloy at high temperature. Mater. Sci. Eng. A 2015, 643, 119–126. [Google Scholar] [CrossRef]
  28. Yeh, A.C.; Tin, S. Effect of Ru on the high temperature phase stability of Ni-base single crystal superalloys. Metall. Mater. Trans. A 2006, 37, 2621–2631. [Google Scholar] [CrossRef]
Figure 1. Shape and size of the stress rupture property specimen (mm).
Crystals 13 00389 g001
Figure 2. As-cast dendritic microstructure of the alloy with different Co contents: (a) 6% Co; (b) 9% Co and (c) 12% Co.
Crystals 13 00389 g002
Figure 3. The microstructures of the alloy with different Co content after full heat treatment: (a) 6% Co; (b) 9% Co and (c) 12% Co.
Crystals 13 00389 g003
Figure 4. The effect of Co content on the size and volume fraction of γ′ phase: (a) size of γ′ phase and (b) volume fraction of γ′ phase.
Crystals 13 00389 g004
Figure 5. Microstructures of the alloy with different Co content after long-term aging at 1100 °C: (a) 200 h, 6% Co; (b) 400 h, 6% Co; (c) 1000 h, 6% Co; (d) 800 h, 9% Co; (e) 1000 h, 9% Co and (f) 1000 h, 12% Co.
Crystals 13 00389 g005
Figure 6. Influence of Co content on the stress rupture properties of the alloy at 1100 °C/137 MPa: (a) stress rupture life and (b) elongation.
Crystals 13 00389 g006
Figure 7. Influence of Co content on the stress rupture properties of the alloy at 1140 °C/137 Mpa: (a) stress rupture life and (b) elongation.
Crystals 13 00389 g007
Figure 8. Microstructure 1.5 cm from the fracture surface of the ruptured samples at 1100 °C/137 MPa (353.6 h): (a) 6% Co; (b) 9% Co and (c) 12% Co.
Crystals 13 00389 g008
Figure 9. Microstructure 1.5 cm from the fracture surface of the ruptured samples at 1140 °C/137 MPa (126.2 h): (a) 6% Co; (b) 9% Co and (c) 12% Co.
Crystals 13 00389 g009
Figure 10. Microstructure adjacent to the fracture surface of the ruptured samples at 1100 °C/137 MPa (353.6 h): (a) 6% Co; (b) 9% Co and (c) 12% Co.
Crystals 13 00389 g010
Figure 11. Microstructure adjacent to the fracture surface of the ruptured samples at 1140 °C/137 MPa (126.2 h): (a,b) 6% Co; (c,d) 9% Co and (e,f) 12% Co.
Crystals 13 00389 g011aCrystals 13 00389 g011b
Figure 12. The effect of Co content on the equilibrium phases at 1100 °C.
Crystals 13 00389 g012
Figure 13. TEM images of ruptured specimens of the alloy with different Co content at 1100 °C/137 MPa: (a) 6% Co; (b) 9% Co and (c) 12% Co.
Crystals 13 00389 g013
Table 1. Nominal chemical components of the three alloys (mass fraction, %).
AlloyCrCoMoWTaReRuNbAlHfNi
6% Co3.06.01.07.07.55.03.00.55.60.1Bal.
9% Co3.09.01.07.07.55.03.00.55.60.1Bal.
12% Co3.012.01.07.07.55.03.00.55.60.1Bal.
Table 2. Chemical components of the TCP phase in the 6% Co alloy and 9% Co alloy after aging 1000 h at 1100 °C (wt%).
AlloyAlCrCoTaRuWReMoNi
6% Co2.32.63.63.42.516.531.11.9Bal.
9% Co4.52.27.26.82.313.416.61.4Bal.
Disclaimer/Publisher’s Note: The statements, opinions and data contained in all publications are solely those of the individual author(s) and contributor(s) and not of MDPI and/or the editor(s). MDPI and/or the editor(s) disclaim responsibility for any injury to people or property resulting from any ideas, methods, instructions or products referred to in the content.

