1. Introduction
Over the last few decades, the use of hydrogen gas has proliferated due to its numerous applications in industry, medicine, and everyday life as a chemical reactant and an energy carrier [
1,
2]. Hydrogen is the most abundant chemical element in the universe [
3,
4], and is considered to be an excellent alternative to fossil fuels as a clean and renewable fuel [
5,
6,
7]. Hydrogen gas is currently being used as a fuel in the aerospace sector [
4]. Several chemical compounds, including ammonia, are synthesized using hydrogen; and some drugs, such as hydrogen peroxide, are manufactured using hydrogen [
4]. Other applications of hydrogen include the oil and gas industry, petrochemicals, the food industry, fertilizer manufacturing, welding, and metallurgy [
8]. The increased industrial use of hydrogen in combination with its unusual properties, such as very low density, lightness, and high flammability (with 4 vol.% as the explosive lower limit in air), call for the need to monitor and carefully control its concentration [
9,
10]. Furthermore, hydrogen is a completely odorless, colorless, and tasteless gas, and so precise and sensitive sensors are required for detection and measurement in routine and industrial applications [
4,
5,
11].
Thus, in the past few years, several attempts have been made to develop inexpensive and precise hydrogen gas sensors, employing various electrical, optical, mechanical, thermochemical, acoustic, and catalytic strategies [
4,
7,
12]. Particularly, optical, or colorimetric sensing can be devised with a material that changes color in a visually discernible manner corresponding to the change in the lattice structure upon reaction with a target gas. No electrical power is required, and the sensor can operate at room temperature, with a high resistance to electromagnetic interference. As all-optical gas detectors do not generate electrical sparks, they do not pose a risk of explosion [
2,
13]. Furthermore, optical sensors provide higher accuracy alongside a lower limit of detection, shorter response times, as well as good stability and recyclability (sensing mechanisms based on reversible chemical reactions) [
6,
10,
14]. Furthermore, in the presence of hydrogen, optical gas sensors based on surface plasmon resonance (SPR) are more sensitive thanks to the localized field [
5]. The plasmonic effect due to collective oscillations of conduction electrons excited by an external electromagnetic radiation serves as the mechanism in SPR sensors, which in turn depends on the morphology of the metal-dielectric interface. The optical response can be induced through localized surface plasmon resonance (LSPR) or propagating surface plasmon polaritons (SPP). In fact, SPR sensors have attracted much attention from researchers in recent years because of their ease of construction, affordability, and portability [
15,
16,
17]. More specifically, nano-grating structures have attracted the most attention due to their cost-effectiveness, high sensitivity, and tunable resonance wavelength, and consequently, they have been widely adopted in scientific research and industry [
18,
19,
20]. The coupling of LSPR-enhanced electric fields significantly enhances the sensitivity performance, and, indeed, subwavelength interactions of nano-structures supporting the SPP and LSPR modes can refine the spectral transmission characteristics.
Usually, hydrogen sensing palladium (Pd) or its alloy plays a major role as a catalyst layer in plasmonic sensors [
21,
22] due to its high absorption capability (almost three orders of magnitude greater than its volume), high selectivity, as well as the adjustable LSPR spectrum [
11,
23,
24]. Upon hydrogen adsorption, the metal Pd transforms into Pd hydride (PdH
x), so that the electrical conductance and optical properties significantly change, especially the dielectric constant in the visible region [
25,
26,
27]. The optical response can be dichotomized into three distinct phases, namely the α-phase, mixed phase, and the fully formed metal-hydride β-phase. These phases correspond to important response regions for SPR hydrogen gas sensing. The spectral extinction/transmission/reflection magnitudes, peak/dip position, and full width at half maximum of the peak/dip can characterize the reversible chemical reactions of the hydrogen with the metal sensing layer. While a lot of work has been carried out on hydrogen gas sensing so far, in which plasmonic hydrogen sensor schemes have also played an important role, a very limited number of these works have been about hydrogen gas sensor design based on the colorimetric method and that use practical plasmonic structures that have been experimentally demonstrated. To address this technology gap, we introduced a novel, easy-to-fabricate, low-cost and portable sensor platform that works based on color changes of the sensing layer (Pd) surface. Fabrication of the sensors tend to involve spin coating, RF magnetron sputtering, photochemical deposition, and solution-stirring methods. Conversely, for successful commercial exploitation, a facile and economical fabrication procedure is required.
Colorimetric sensors utilizing surface plasmon resonance offer a straightforward yet sensitive method of gas detection that has a simpler structure and better stability than other colorimetric methods [
12,
28,
29]. In addition, the structural and optical parameters can control the plasmonic color. Common optical hydrogen gas sensors use optical fibers including the distributed Bragg grating and tapered single-mode fiber. By applying coatings at the optical fiber end comprising a silver layer, a thin film of chemochromic material, and a catalytic layer of Pd, all-optical guided-wave hydrogen gas detectors can be realized [
30]. Serhatlioglu et al. [
31] numerically studied the effect of varying the dielectric layer thickness in the metal-insulator-metal interference structure on the spectral absorption characteristics upon hydrogen exposure that changes the surface color. In another recent work, Duan and Liu [
32] made scanning plasmonic color displays possible using aluminum nanoparticles as plasmonic pixels that are switched on/off by hydrogen atom adsorption/desorption on a magnesium screen. Nugroho et al. [
33] inversely designed using a particle swarm optimization algorithm, a plasmonic metasurface based on a periodic array of Pd nanoparticles that led to ultrasensitive optical hydrogen detection. Luong et al. [
34] developed an optical hydrogen gas sensor platform based on Pd bilayer plasmonic nano-lattices that exhibited an extended optical response range and enhanced sensitivity for hydrogen gas detection, as well as an order of magnitude higher optical response speed in the low hydrogen pressure regime. Hosseini and Ranjar [
35] demonstrated a linear blueshift of the LSPR for optical hydrogen sensing using sputter-deposited Pd film on flame-synthesized nanostructured MoO
3 films.
In this study, we present a colorimetric plasmonic hydrogen sensor based on a one-dimensional nano-grating and thin-film Pd. Since the nano-gratings used in this sensor design were extracted from a digital optical disk data storage format (Digital Video Disk or DVD), the sensor inherits attractive technology features of being lightweight, inexpensive, and very accessible. To enhance the structural quality of the sensor and to improve the gas sensing performance, we also explored the advantages of having sputter-deposited gold (Au) as a noble metal buffer layer. It is important to correlate the hydrogenation/dehydrogenation process with property modifications. When the surface dissociated hydrogen atoms diffuse into the Pd lattice, phase transitions lead to color changes according to the hydrogen concentration. Hence, the concentration of hydrogen gas in the surrounding environment can be determined by measuring the relative intensity contrast and resonance wavelength shift from the reflectance spectrum. Sensors developed in this way are low-cost, ocular-safe, portable, and highly sensitive. When paired with smart systems such as smartphones utilizing machine learning and digital technologies for environmental monitoring and mobile health, powerful, cost-effective analytical devices can be realized offering direct and convenient diagnostic solutions.
2. Materials and Methods
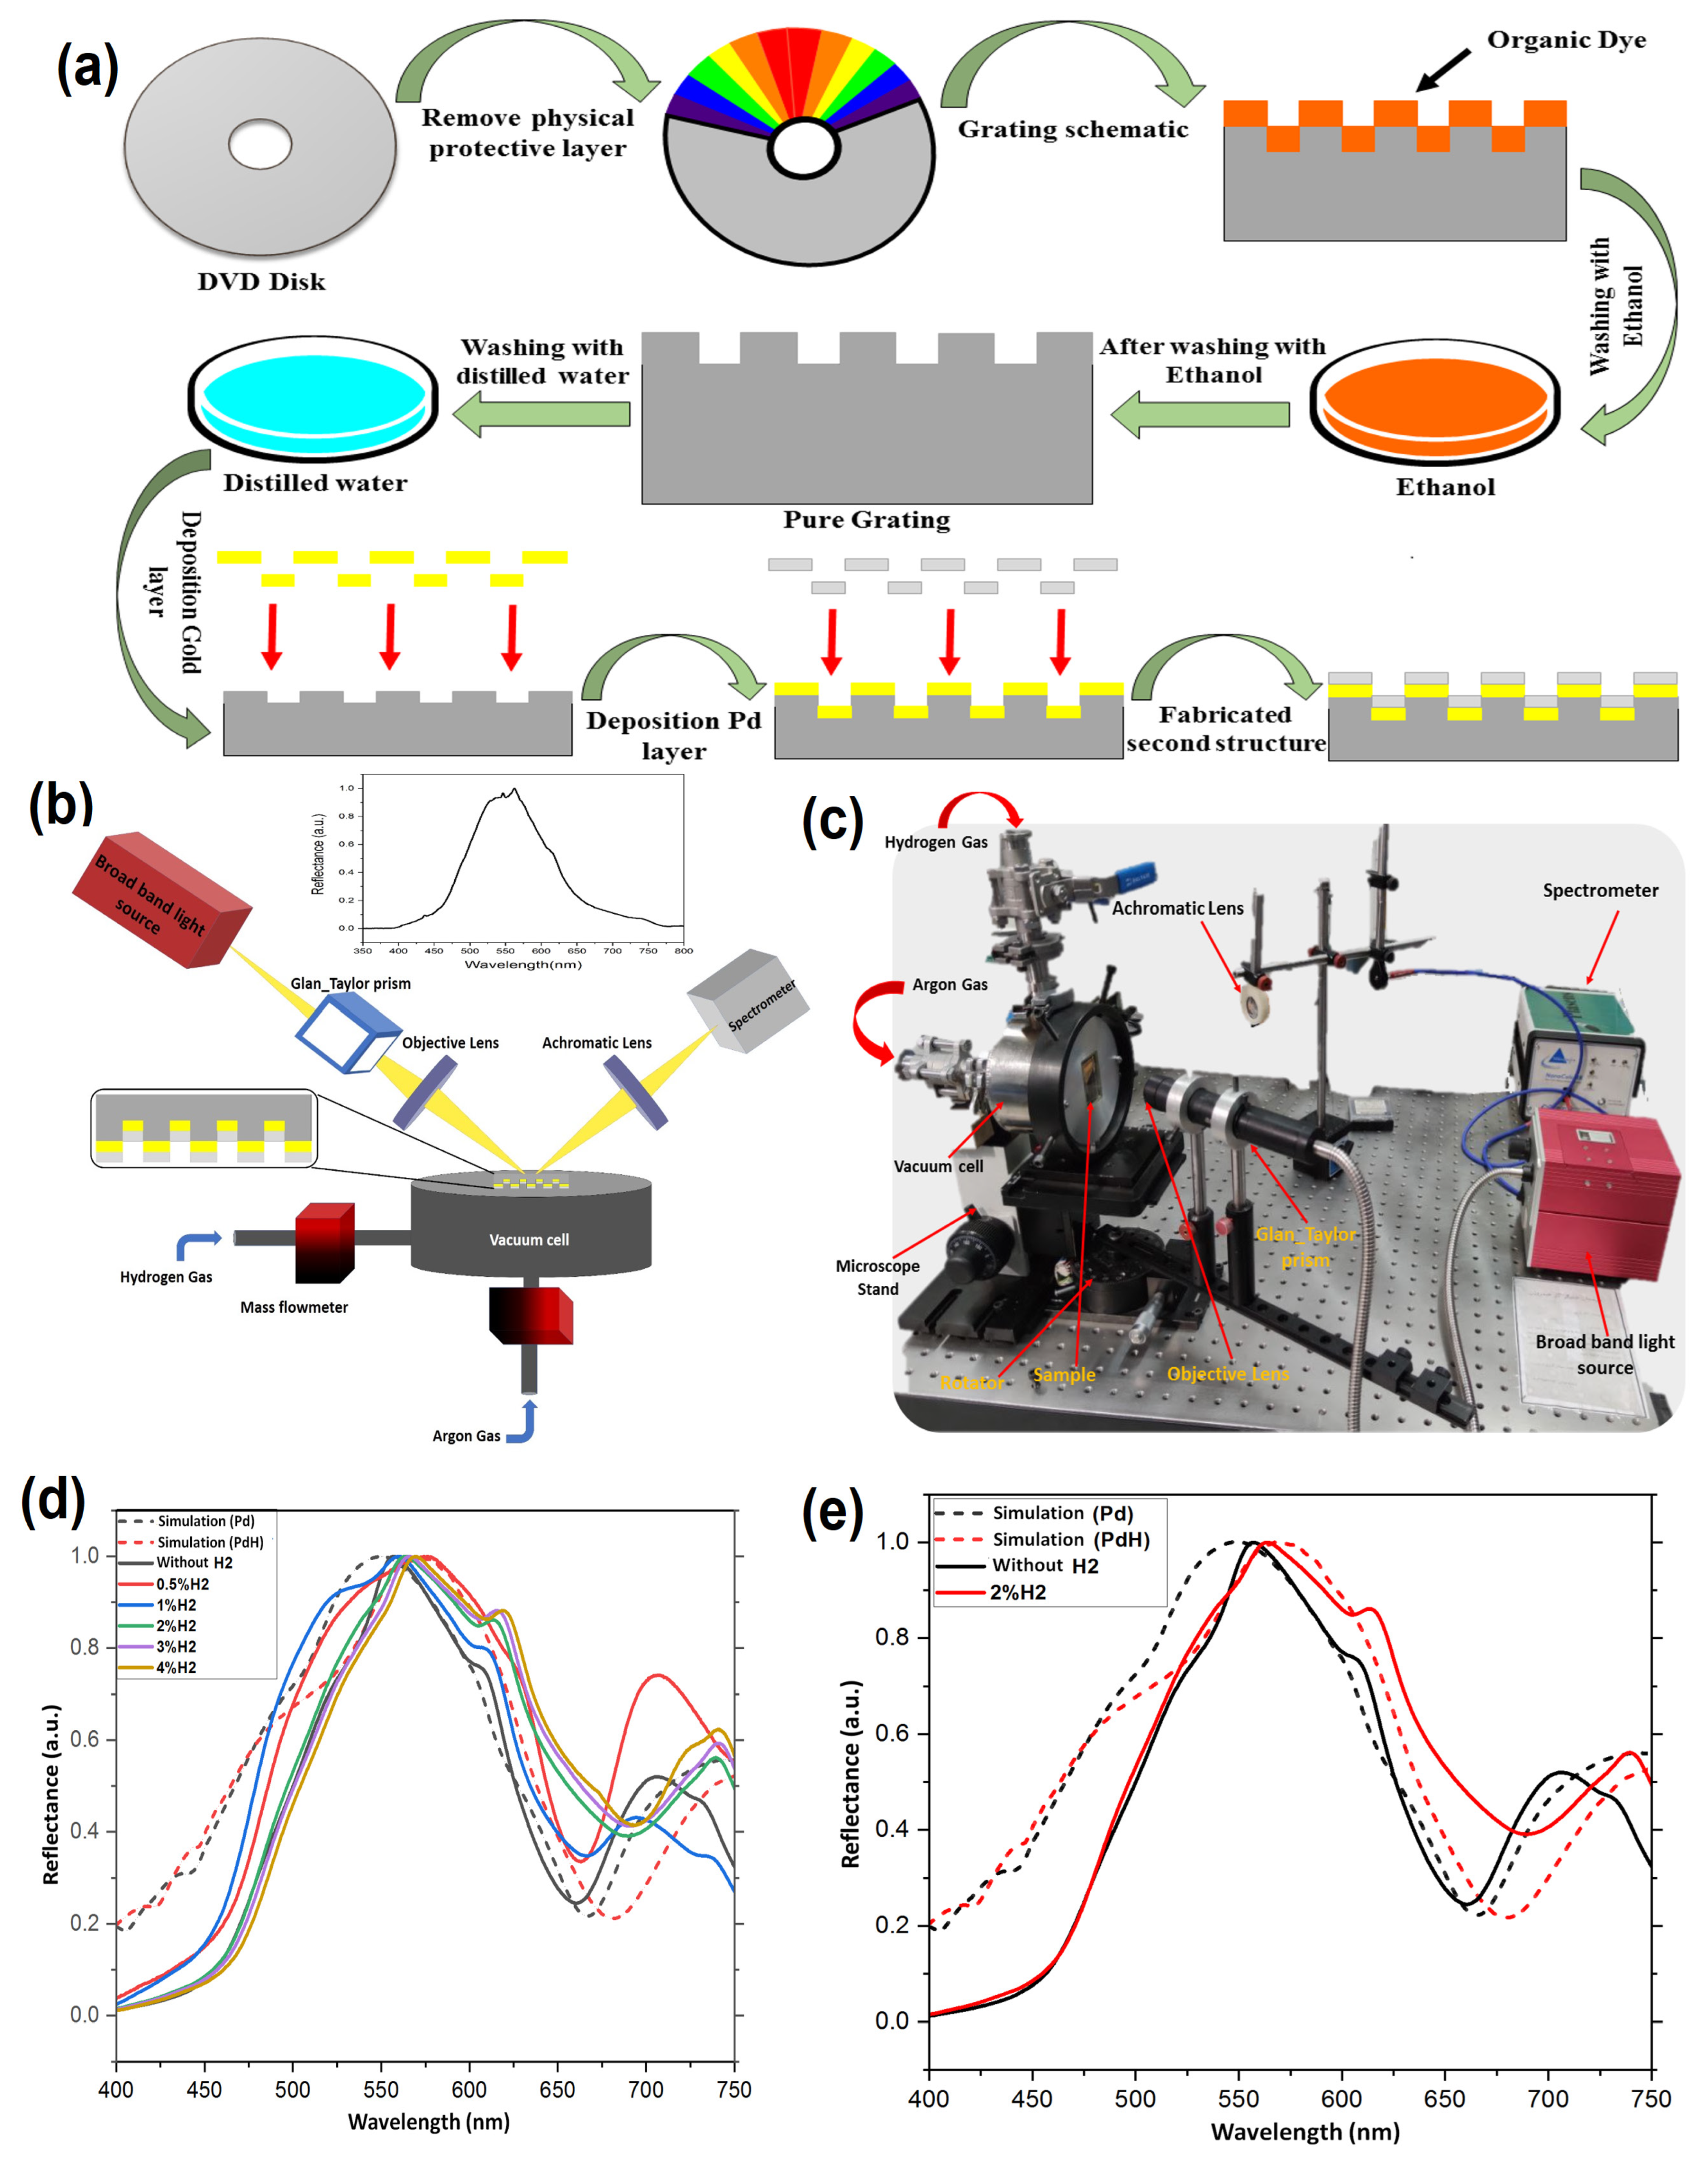
A one-dimensional nano-grating structure extracted from a DVD was used as a substrate (see
Figure 1a). In contrast to prisms or optical waveguides, these nano-gratings are small, lightweight, compact, readily available, and inexpensive, allowing them to be used in portable plasmonic systems. First, the protective layer of the optical disk must be removed to extract the gratings, as shown in
Figure 1a. We removed the pigments from the surface using ethanol without damage to the grating structure. Thereafter, we washed the sample in distilled water followed by drying. Pd (40-nm thick) and Au (35-nm thick) layers were then deposited onto the nano-grating substrate using the DC sputter method. To protect the sensing Pd layer from damaging ambient gasses and deactivation, the sample was placed in a vacuum chamber.
Figure 1b,c illustrates, respectively, the optical configuration in the vacuum chamber and the overall experimental setup. The cylinder-shaped steel chamber had a window through which the sample was connected from the back by an index-matched gel. An index-matching medium is essential to allow efficient radiative coupling. A mass flow controller (MFC) was used to control the gas flow of hydrogen and argon into the chamber so that the gas concentrations could be precisely regulated and monitored.
For this study, the optical apparatus was based on a versatile micro-reflectivity setup to investigate the optical properties of hydrogen adsorbent surfaces. Unpolarized light from a broadband halogen lamp (Thorlabs, Newton, NJ, USA, OSL2 fiber optic illuminator) was polarized with a Glan-Taylor prism (GT10-A) to produce TM polarization. The polarized light was then focused onto the sample using an objective lens (Thorlabs), and the reflected light was collected and coupled into a UV-VIS spectrometer (Ocean Optics, Ostfildern, Germany, NANOCALC-XR) using an achromatic lens (Thorlabs). The intensity reading of the broadband light source below 420 nm and above 730 nm was almost zero (see
Figure 1b).
The sensing Pd crystal has a face-centered cubic (FCC) lattice structure. When the hydrogen atoms are adsorbed on the surface, they occupy the interstitial (octahedral) sites of the FCC lattice [
36]. The high selectivity toward hydrogen is because of the higher hydrogen permeability in the Pd lattice compared to that of other gasses. In general, hydrogen penetration into the Pd lattice leads to the formation of metal hydride (PdH
x) in different phases and correspondingly alters its structure and properties. At low hydrogen gas concentrations, the α-phase is formed of the Pd lattice and there is no significant change to the lattice structure [
11,
37]. As the hydrogen gas concentration increases further, patches of the metal hydride can be formed as the so-called β-phase in the Pd lattice. Hence, the α-phase and β-phase will be simultaneously present in the FCC lattice. The metal hydride’s behavior is dependent on the temperature [
24]. With increasing penetration of hydrogen, the Pd lattice transforms from the mixed α- and β-phases into the pure β-phase and the Fermi level shifts due to a significant volume expansion. Furthermore, the dielectric response function of the Pd hydride will be completely modified from that of pure Pd, with significant changes to the real and imaginary parts of the Pd hydride’s dielectric response function [
21,
25]. This phase transition in the sensing layer is therefore responsible for modifications of the electrical and optical properties, such that the modulating surface color can provide opportunities for remote sensing.
We utilized the Lumerical software and the finite-difference time-domain (FDTD) method to compute and investigate the optical characteristics of the sensor structures employed. We established the geometric specifications of the nano-grating, defining one period as a unit cell with three-dimensional periodic boundary conditions. A perfectly matched layer (PML) boundary condition was applied on the structure perimeter. Using a frequency-domain field and power monitor in the simulation environment, we computed the reflection spectra from the structures. To achieve acceptable convergence characteristics, we used a mesh size of 2 nm × 2 nm × 2 nm. We modeled the thin BK7 borosilicate glass of the vacuum chamber window as a substrate in the simulation domain. A Pd metal layer directly fabricated on a one-dimensional nano-grating forms the basis of the initial structure. Therefore, we determined the optimal Pd layer thickness to obtain the most suitable visible resonance wavelength, and then collected the spectral reflectance for the range of angles of incidence from 40° to 60°. Then, by using reputable sources for the refractive index and extinction coefficient for the Pd hydride [
38], we compared its reflectance spectrum with that of pure Pd (see
Figure 1d). To excite the surface plasmons, we used a one-dimensional nano-grating that equates the incident light wave vector (K
light) with the plasmon wave vector (K
SPP). Using atomic force microscopy (AFM) imaging, we obtained measurements of the periodicity, height, and the widths of the nano-grating. The nano-grating geometry will have an influence on the sensor performance, and one of the most important parameters is the periodicity. The relationship with nano-grating geometry when the surface plasmon polaritons are excited at a specified wavelength λ can be expressed as [
39]:
where
m = 0, ±1, ±2, ±3, … is the diffraction order,
P is the grating period and ε
m is the dielectric constant of the metal.
θ is the light incidence angle on the grating and
is the refractive index of the dielectric medium coating the grating. The resonance wavelength redshifts with periodicity. The height and width of the nano-grating are the other parameters influencing the resonance wavelength and shape of the reflectance spectrum, in turn governing the sensor performance. When the height or width of the nano-grating increases, the resonance wavelength redshifts or blueshifts, respectively [
39,
40]. For the range of hydrogen concentrations studied, the optical simulations results, accounting for the properties of the Pd sensing layer (and Au buffer layer), show that in terms of the periodicity and height of the nano-grating, the structure parameters in the optical disk compare well with that required for placement of the resonance wavelength in the optical regime. We therefore find that the nano-grating geometry extracted from the DVD is most suitable to establish our colorimetric scale, thus combining a high sensitivity performance with the unique benefits of the ease of availability of substrate materials, as well as the low-cost and low-complexity fabrication of the sensor, and portability.
After the sample preparation, we placed the sample inside the vacuum chamber, which operated with a turbopump until a 10
−6 mbar pressure was reached. This allowed us to analyze the effect of varying quantities of hydrogen adsorption on the structure more precisely. By using MFCs, a steady stream of argon and hydrogen gas was introduced into the chamber at the targeted volumetric concentrations. The sample was affixed to a microscope stand and attached to the center of a rotator onto which an optical system was mounted (concentric with a microscope stand). For the aforementioned angles, we recorded the spectral reflectance at room temperature with and without hydrogen exposure. We then pumped the sample chamber to a high vacuum and flushed the sample with pure argon gas after each loading of a hydrogen concentration for 5 cycles to ensure minimization of the hysteresis effect. Adsorption/desorption hysteresis and phase transformation properties can otherwise be very common in metal-hydride configurations. The experiments were repeated at least three times under the same conditions to confirm good reproducibility of the measurements. That the readings were essentially identical also ensured the repeatability and reliability of the results. By evaluating and comparing the theoretical and experimental reflection spectra, we determined 44° as the ideal angle for measurement due to the resonance depth and its placement inside the visible range (
Figure 1d,e). For this structure,
Figure 1e demonstrates close agreement of the simulated and experimental reflectance spectra and plasmonic resonance wavelength characteristics. Notably, the feature reflectance dip was caused by the activation of the surface plasmon at this wavelength since the light strikes the nano-grating from behind and there is no waveguide mode in this case [
41].
3. Results and Discussion
Our goal was to determine the amount of hydrogen gas present in the environment by calibrating the number of color changes (RGB) in the sensing layer (Pd). Additionally, we do not alloy the sensing metal with other metals or use a protective layer because that is known to diminish the color variation of the sensing layer and more complex fabrication processes are mandatory for alloy nanostructures. The resonance wavelength for the as-fabricated nano-grating/Pd structure was approximately 660 nm without hydrogen exposure. As shown in
Figure 1d,e, peak broadening and redshift in the resonance wavelength were observed upon hydrogen gas exposure. In principle, the amount of hydrogen adsorbed on the Pd sensing material leads to a corresponding proportionate change in the physical and optical properties, thereby affecting the reflectance spectra and the surface color. When hydrogen adsorbs on the Pd layer, the metal hydride (PdH
x) forms. The conversion of Pd into PdH
x upon hydrogen gas exposure is accompanied by a refractive index change in the sensing layer. Hence, the redshift in the resonance wavelength, where the absorption is maximum, indicates the refractive index change of the sensing material. For the hydrogen concentrations ranging from 0.5 to 4 vol.%, the resonance wavelength was ideally located within the visible range (see
Figure 1d–e), so that the prototyped platform is feasible for colorimetric sensing applications. However, owing to the cyclic adsorption and desorption of hydrogen gas and the consequent expansion and contraction of the sensing metal lattice, damage is caused to the surface of the Pd sensing material and cracking can occur when a single layer is used, thereby degrading the nanostructure’s mechanical stability. Furthermore, due to rapid saturation by gas adsorption, sensors based on a single metal layer operate well only within a narrow range of gas pressures [
10,
18]. To resolve the abovementioned challenges, Au was deposited as a buffer layer between the nano-grating and the Pd layer to enhance surface adhesion, lower pressure on the Pd sensing layer, and further stabilize the mechanical integrity. The addition of the Au layer may also enhance the measurement of rise and fall times [
10,
37,
42].
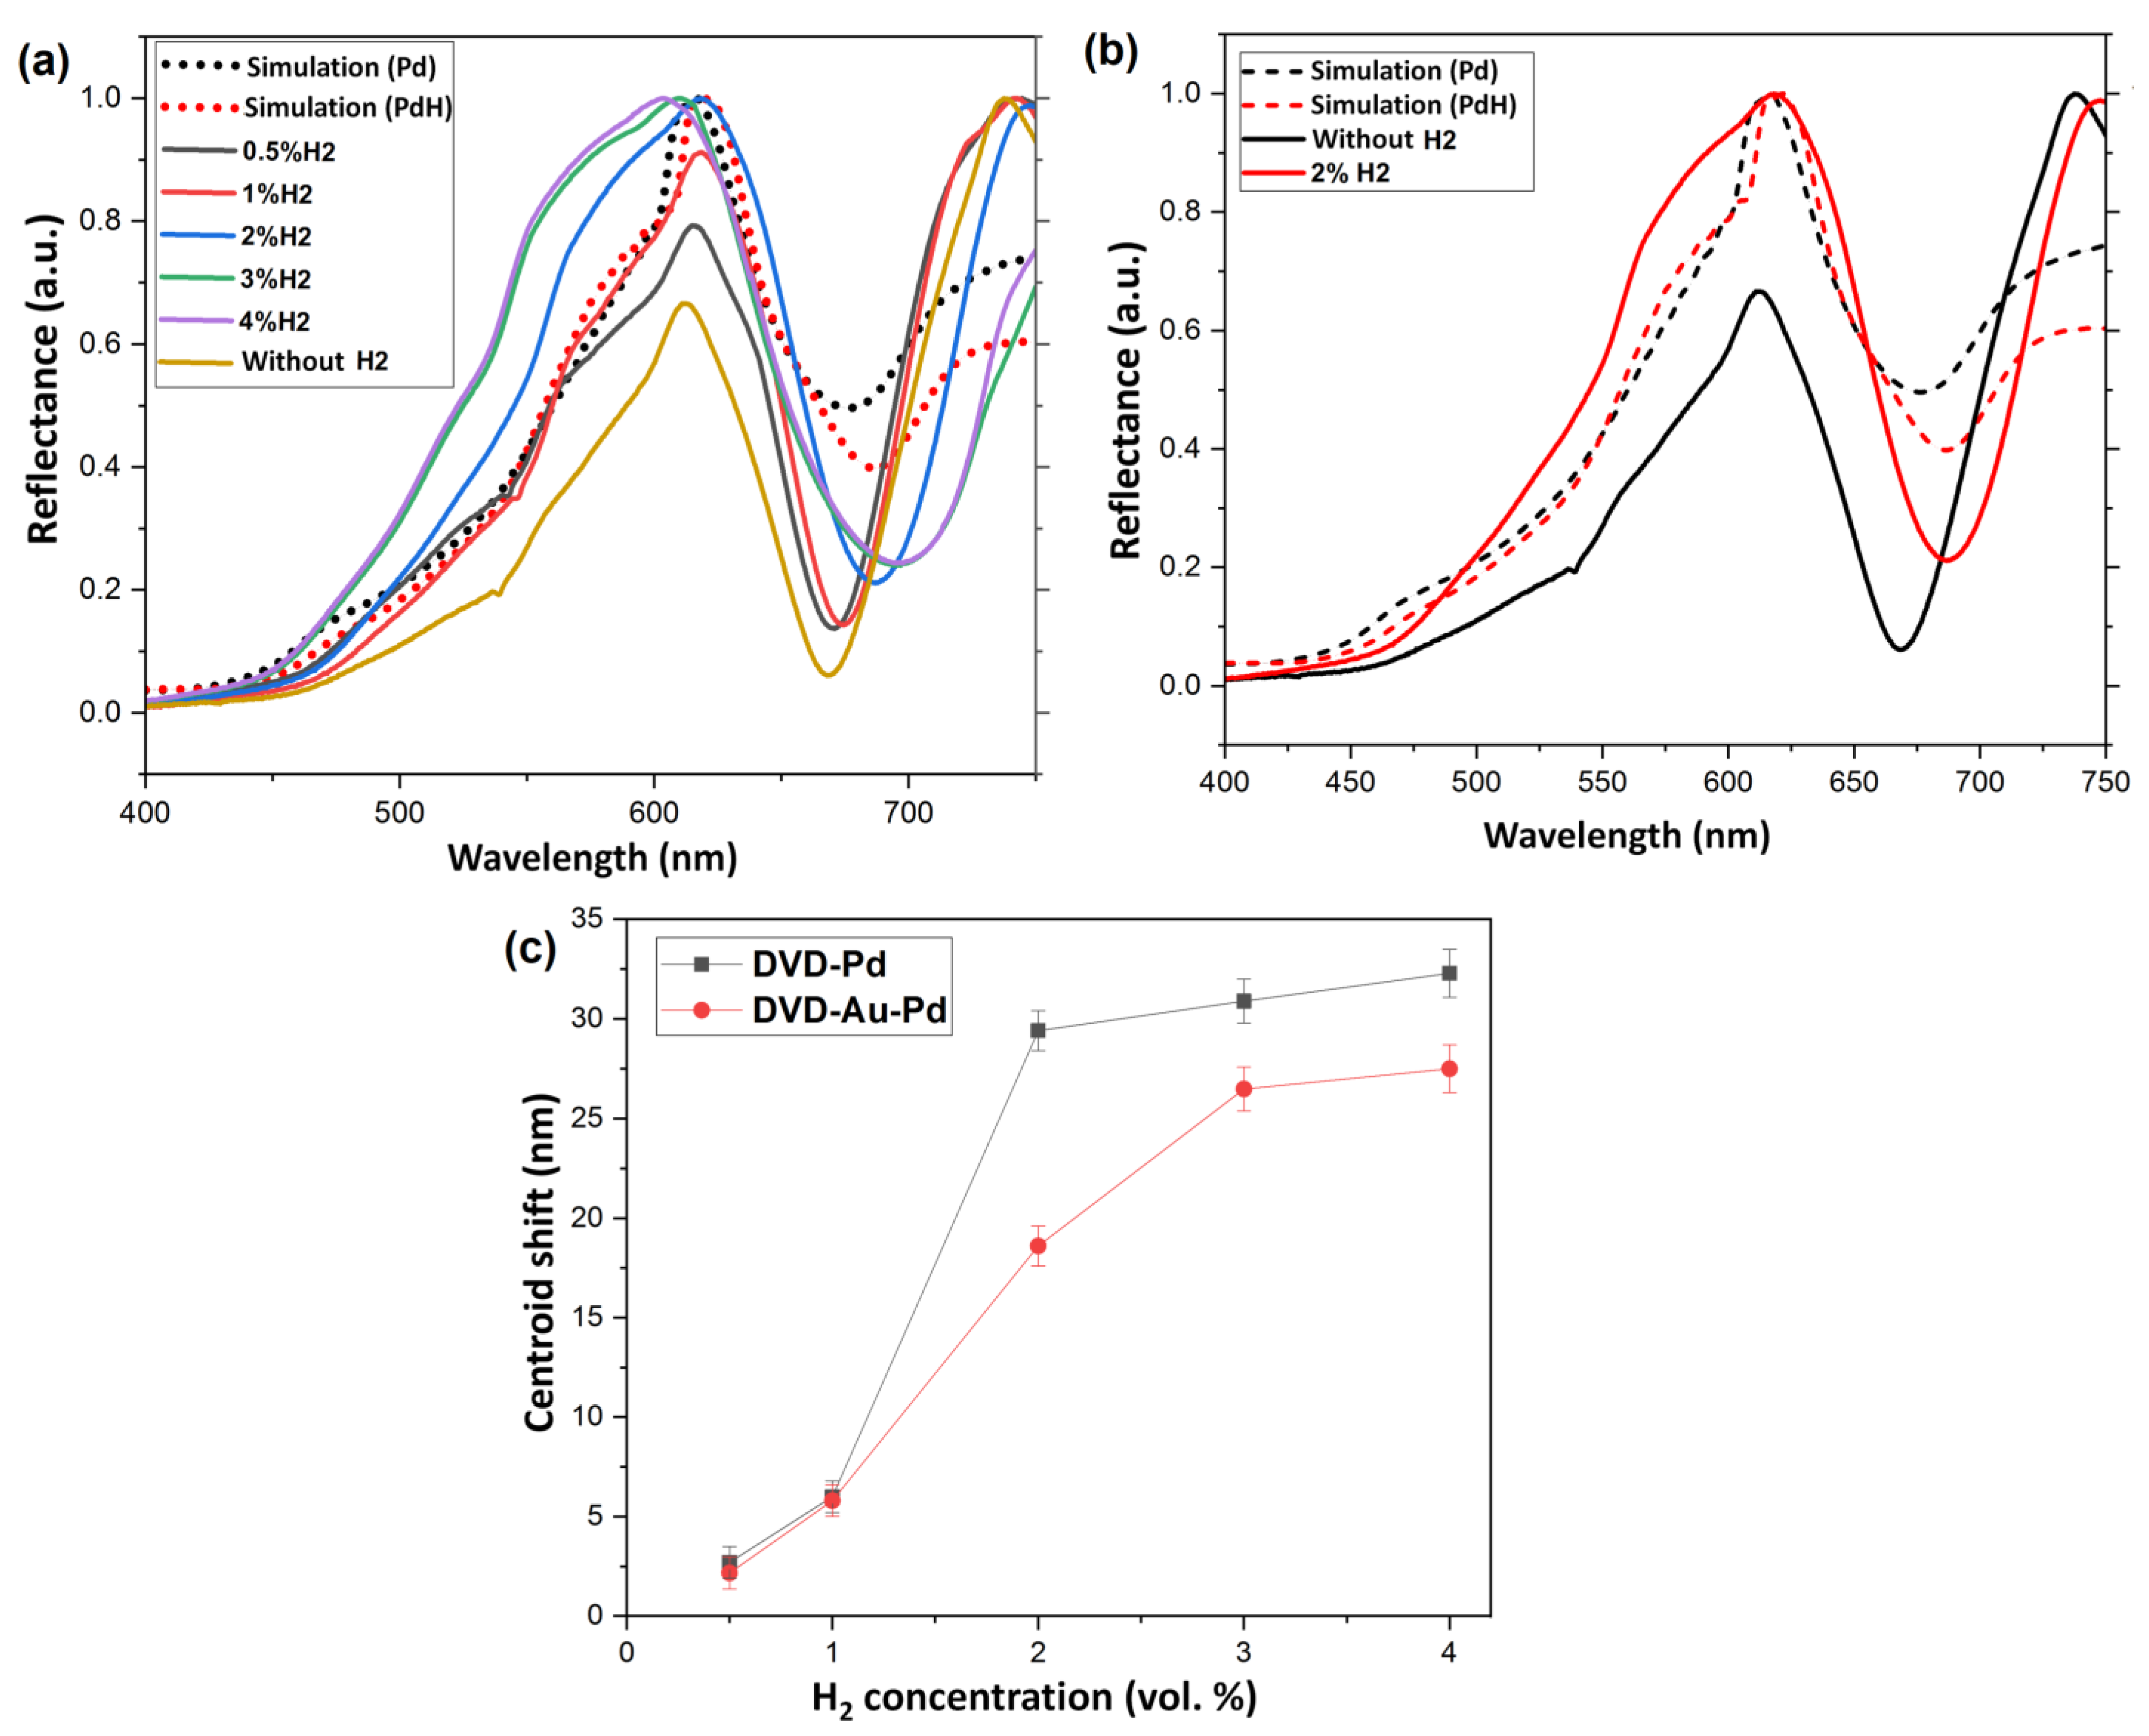
In our simulation results (
Figure 2a), we determined the appropriate thicknesses of the Pd and Au layers and identified the optimal resonance wavelength from the reflection spectrum for incidence angles between 40° to 60°. The resonance wavelength was approximately 670 nm without hydrogen exposure. When loading the appropriate amounts of hydrogen gas concentration, the experimental spectral reflectance showed similar characteristics to that in the simulations (
Figure 2a,b). As can be seen, the inclusion of the Au layer caused a redshift in the resonance wavelength, while the resonance wavelength remained in the visible range at the volumetric concentrations under study, allowing the device to be suited for colorimetric sensing operations.
The spectral shift of the resonance wavelength with hydrogen concentration is shown in
Figure 2c for the nano-grating/Pd and nano-grating/Au/Pd structures. We find that when compared to the nano-grating/Au/Pd structure, the nano-grating/Pd structure without the Au buffer exhibits a larger wavelength shift when exposed to hydrogen. Moreover, due to modifications of the Pd lattice constant in either structure by hydrogen adsorption, the phase transition from the α-phase to the mixed α- and β-phases is nonlinear, exhibiting a large, abrupt transformation in phase above a threshold volumetric concentration.
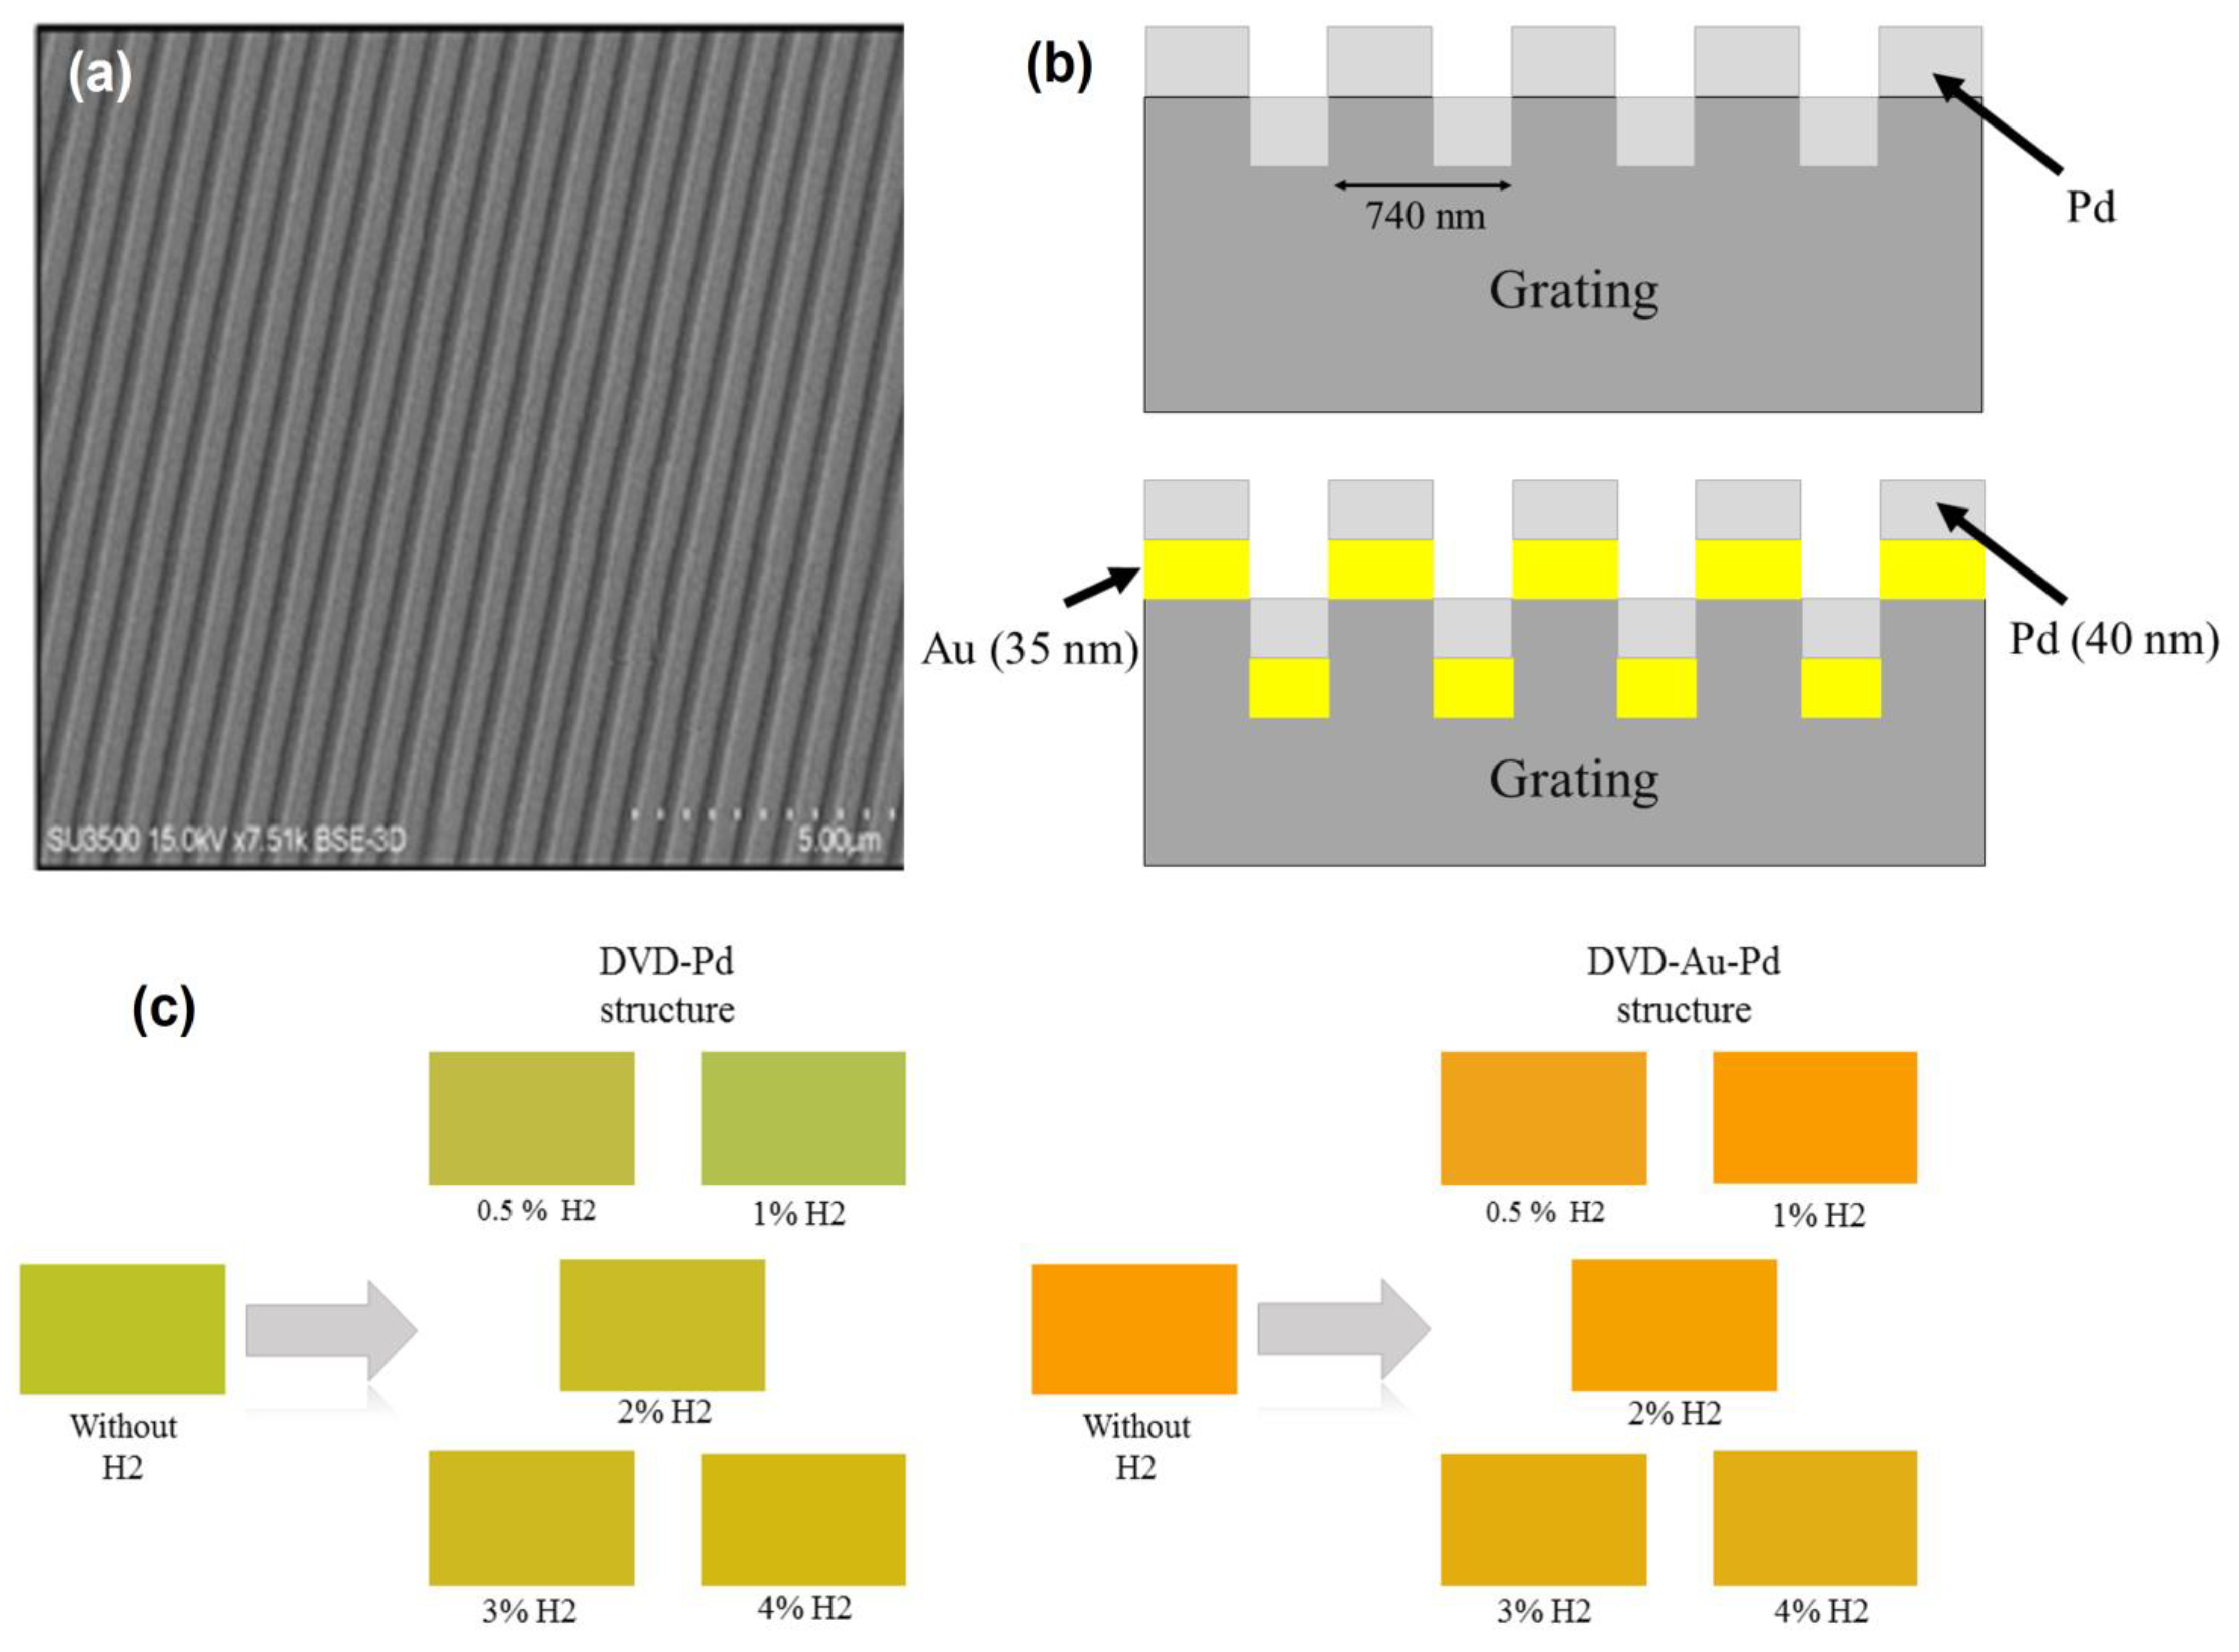
As shown in
Figure 3a, the secondary electron image confirms the periodicity and uniformity of the nano-gratings. The sensitivity performance is governed by the structural configurations of the prototyped nano-grating/Pd and nano-grating/Au/Pd designs (
Figure 3b). Compared to the nano-grating/Pd structure, the Pd phase transition for the nano-grating/Au/Pd structure is slower with respect to the amount of hydrogen adsorption on the surface sensing layer, resulting in an improved dynamic range and performance stability (see
Figure 2c). Whereas the sensing response for the nano-grating/Pd structure rapidly saturates after the transition from the α- to β-phase of the sensing material, the saturation of the sensitivity performance is deferred to higher hydrogen concentrations for the nano-grating/Au/Pd structure due to the slower phase transition, thus extending the dynamic range. Sensors generally perform in a limited pressure range; these sensors usually exhibit a large response around the hydride formation pressure. Without the Au buffer layer, the expansion and contraction of the Pd lattice will be relatively large and rapid, thus directly affecting the stability of the Pd sensing layer. Conversely, adding the Au buffer layer between the Pd and nano-grating layer not only enhances the surface adhesion between the sensing and substrate material, but also reduces the pressure in the Pd lattice; this is because the Au layer acts as a diffusion barrier, preventing hydrogen atoms from diffusing too deeply into the Pd layer and causing excessive lattice expansion. The slower and milder Pd lattice expansions/contractions with respect to the hydrogen adsorption/desorption underlie an enhanced mechanical stability of the sensing layer.
Figure 3c exhibits the visual color changes of the Pd layer according to the CIE 1931 color space diagram for the various volumetric concentrations of hydrogen. The phase transition occurred between 1 to 2 vol.% and 2 to 3 vol.% for the nano-grating/Pd and nano-grating/Au/Pd nanostructure films, respectively. We can utilize these gasochromic results to operate an efficient system platform for domestic and industrial sensing applications. This platform may include a smartphone that can accurately and directly measure the color changes of the sensing layer surface in a continuous fashion through real-time image capture and processing, adopting high-performance industrial machine vision standards involving specialized image processing software. As a result, we will have a compact and accurate colorimetric plasmonic hydrogen sensing platform suitable for any form factor. While our focus has been to investigate the color change sensitivity of the Pd surface layer in response to the different gas concentrations up to 4 vol.%, which is the flammability limit at normal atmospheric pressure in oxygen, our work has so far demonstrated sensitivity to hydrogen concentrations as low as 0.5 vol.%. The corresponding color changes extending through to this low gas concentration are completely noticeable, and thus we have numerically and experimentally demonstrated a more sensitive and accurate plasmonic sensor than that reported in other papers that also use the colorimetric method [
43,
44]. Color changes on the sensing layer are virtually insignificant at lower hydrogen concentrations, and they either border on or exceed the threshold for human visual detection. Nevertheless, we can still measure the amount of resonance wavelength shift (although very small) for hydrogen concentrations as low as 0.2 vol.% using a spectrometer. However, it is usually not practical or necessary to detect such trace amounts of hydrogen in routine domestic and industrial screening processes.


