
Study on the Chromogenic Mechanism of Violet-Red to Orange-Red Spinel


School of Gemmology, China University of Geosciences (Beijing), Beijing 100083, China
*
Author to whom correspondence should be addressed.
Crystals 2023, 13(2), 339; https://doi.org/10.3390/cryst13020339
Submission received: 5 February 2023
/
Revised: 13 February 2023
/
Accepted: 15 February 2023
/
Published: 16 February 2023
(This article belongs to the Topic In-Situ Study of Mineralogy, Gemology and Progress in Gemology)
(This article belongs to the Section Mineralogical Crystallography and Biomineralization)
(This article belongs to the Section Mineralogical Crystallography and Biomineralization)
Abstract
:In this paper, the chemical composition and spectroscopy of 38 violet-red to orange-red spinel samples were analyzed by energy dispersive X-ray fluorescence spectrometer and UV-visible spectrophotometer, based on CIE LAB color space, to explore the effects of different chromogenic ions on spinel color transition. The results show that the chroma C* is mainly controlled by the variation of color coordinates a*, and the hue angle h° is mainly controlled by the variation of color coordinates b*. Spinel can be divided into iron-bearing spinel and chromium–vanadium-bearing spinel according to their chromogenic elements, where Fe is mostly present in the form of Fe2+, which is mainly replaced with Mg2+ in tetrahedral voids, while Cr3+ and V3+ are mainly replaced with Al3+ in octahedral voids, and the level of Al content indicates the degree of isomorphism in spinel. The lightness L* of spinel decreases with increasing Cr content, and the hue h° decreases with increasing Fe and increases with increasing V content.
1. Introduction
The general chemical formula of spinel is T(A1−δBδ)M(AδB2−δ)O4, which belongs to the cubical system [1,2]. Divalent oxygen ions are cubically most tightly packed in the three-dimensional space, forming two types of voids, namely tetrahedral (T) voids and octahedral (M) voids. The voids are filled with two types of cations, A and B. A is a divalent cation and B is a trivalent cation. δ is the disorder factor and the value can be taken as 0-1 [3,4,5]. Previous studies have shown that spinel has a variety of colors due to the fact that the void species accommodate a variety of transition metal cations of different valence states. Among them, Cr3+, V3+ and Mn2+ make spinel orange-red [6,7], Fe3+ and Fe2+ make spinel dark red [8], blue-green or blue-purple and Co2+ can make spinel dark blue [9,10].
In recent years, chromaticity has played an important role in gemmological research. The CIE 1976 L*a*b* color uniform space is the latest recommendation by the International Commission on Illumination for a table color system for quantitative color characterization with lightness L*, color coordinates a* and color coordinates b* as color parameters [11,12,13,14]. Lightness L* represents the degree of lightness of a color, ranging from very dark black (L* = 0) to very bright white (L* = 100). The higher the value of lightness, the brighter the color. Color coordinate a* describes the color change between red (+a*) and green (−a*), while color coordinate b* describes the color change between yellow (+b*) and blue (−b*). Chroma C* represents the intensity of a single color of intensity, ranging from very light color (C* = 0) to very intense color (C* = 100). The larger the chroma value, the more vivid the color. Hue angle h° represents a series of continuous color hue transitions. Chroma C* and hue angle h° can be calculated from color coordinates a*, b*. It has good color uniformity and is now mostly used in the study of gemstone chromaticity, such as beryl [15,16], peridot [17,18], turquoise [19,20], chrysoprase [21,22], jadeite [23,24], etc.
A synthesis of previous research results shows that although the crystal structure, chemical composition, spectroscopic characteristics, color genesis and inclusion characteristics of spinel have been studied to some extent at present, the research methods have developed from general gemological tests and microscopic observation to the application of modern testing techniques. However, due to the limited number and type of samples, there are fewer studies on the color genesis of different colored spinels, and there is a lack of quantitative characterization of spinel color transitions and their causes. At the same time, there is often a link between the color of a gemstone and external factors [25,26]. For example, garnets with a color-changing effect often have different colors when illuminated by different light sources [27,28,29]. Therefore, as one of the world’s most famous colored gemstone species, spinel’s colorful body color is the primary factor affecting quality assessment. Quantitative characterization of the color effects of red spinel chromogenic ions is not only an objective and systematic way to promote discussion of spinel chromogenic mechanisms, but also a practical guide to the scientific standardization of spinel color grading criteria.
In summary, the color data lightness L*, color coordinates a* and color coordinates b* of 38 violet-red to orange-red spinels were collected using an X-rite SP62 portable spectrophotometer, and their hue angle h° and colorimetric value C* were calculated accordingly. The relationships between their chromatic parameter variables were discussed based on CIE 1976 L*a*b* color uniform space in this paper. At the same time, the chemical composition and structural characteristics of spinel were analyzed according to ED-XRF and UV-VIS nondestructive testing methods, and the influencing factors and color-causing mechanisms of spinel color change were discussed.
2. Samples and Analytical Methods
2.1. Samples
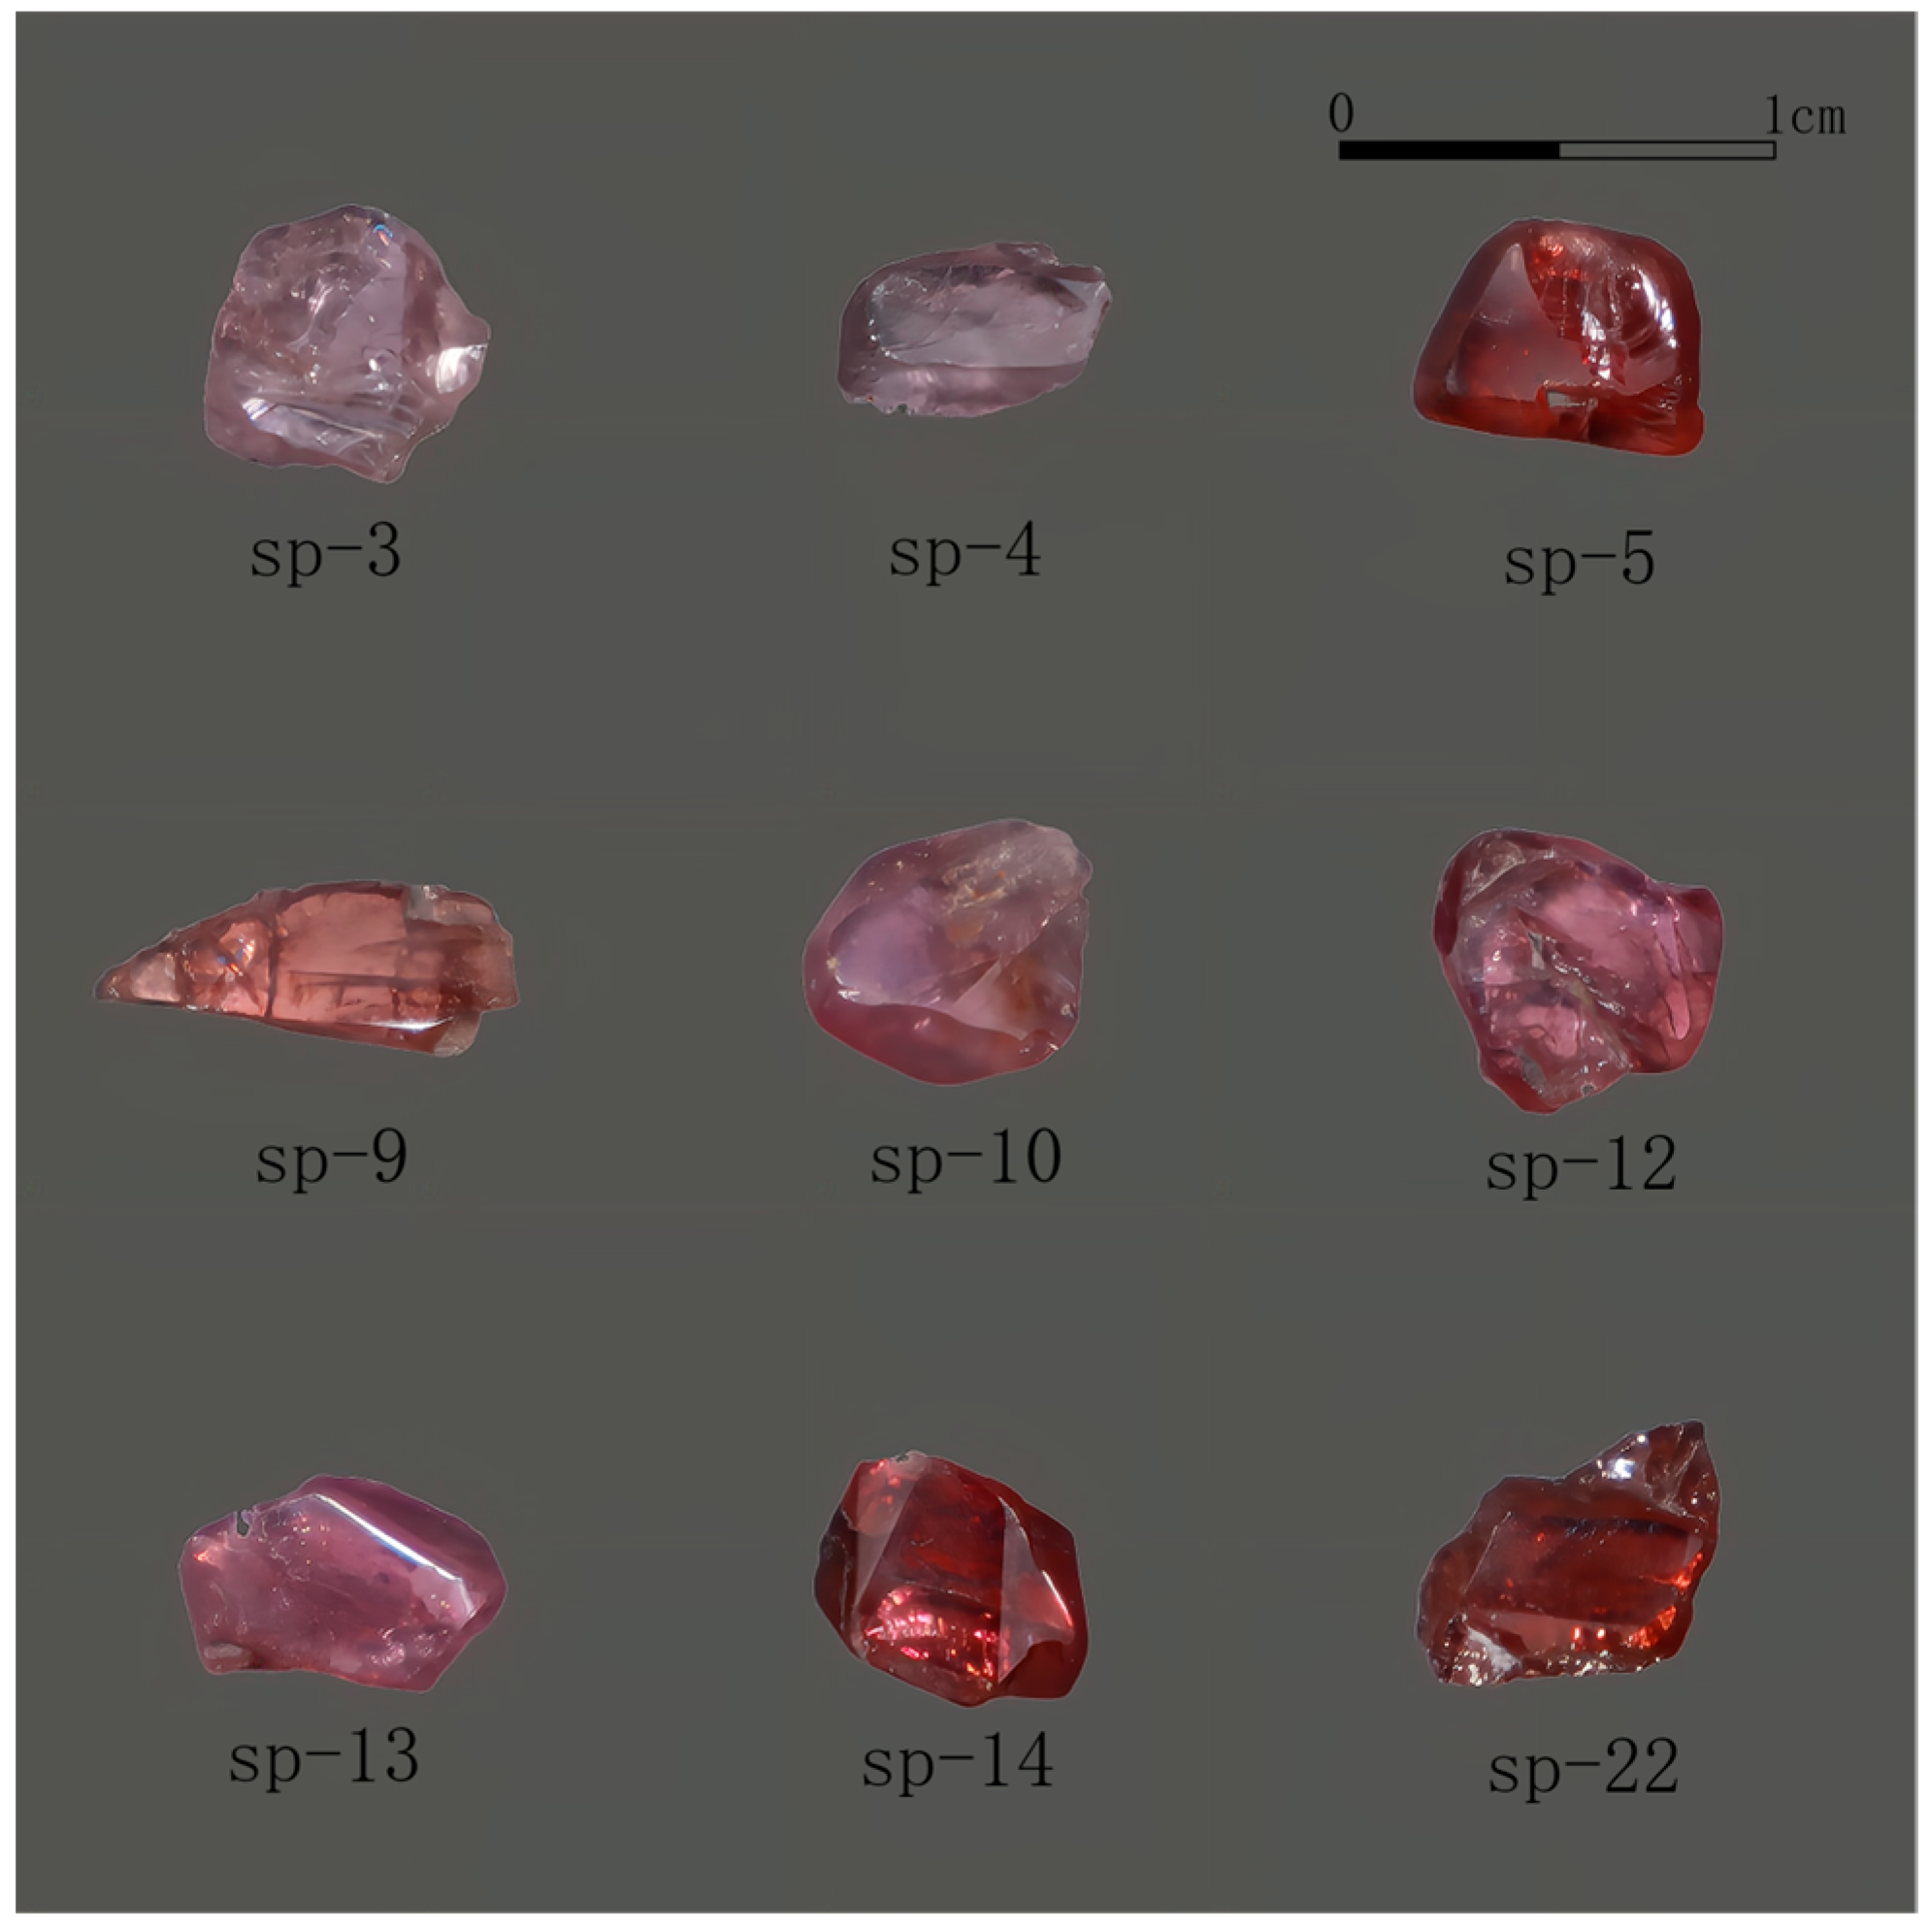
In this paper, thirty-eight spinels are used as the object of study. The morphology of all spinel samples is parallel plate, with a thickness of about 3 mm, and polished on both sides, with a glassy luster, relatively clean inside, without obvious inclusions, a few samples have pits and scratches, and the color distribution of the samples is relatively uniform, with a good purplish-red-orange-red transition distribution of hues, some of which are shown in Figure 1. All samples were tested for chromatographic parameters, and nine with clean interiors and uniform hue angles were tested for composition and color.
2.2. Colorimetric Analysis
The color index of spinel was determined using a portable Aicolor X-Rite SP62 portable spectrophotometer (X-Rite, Grand Rapids, MI, USA), selected from the CIE1976 L*a*b* uniform color space, using an integrated sphere to collect the reflected signal from the sample surface. Test conditions: D65 (6504 K) standard light source illumination; reflection method; specular reflection included; 2° observer field of view; measurement range, 400–700 nm. The final color data were averaged over three tests and the test area for a single sample is a circle with a diameter of 6 mm.
2.3. UV-Visible Spectrophotometer
UV-Vis absorption spectroscopy is an absorption spectrum of ions and atoms in gemstones as well as valence electrons and electrons in molecular orbitals that are excited by electromagnetic radiation and jump between electronic energy levels. Colored gemstones with different crystal structures contain chromogenic impurity ions with different degrees of selective absorption of incident light at different wavelengths, and their composition can be analyzed qualitatively or quantitatively according to the wavelength range and degree of absorption of light absorbed by the gemstone sample. UV-visible spectroscopy is a non-destructive test, which is divided into transmission and reflection methods. In this experiment, a UV-Vis spectrophotometer model UV-3600 was used in the Gem Lab of the jewelry college of China University of Geosciences (Beijing), and the measurement method was the transmission method to determine its absorption value, with a wavelength range of 300–800 nm, a slit width of 1 mm, a sampling interval of 0.5, and a scanning speed of medium.
2.4. ED-XRF
Energy-dispersive X-ray fluorescence (EDXRF) is the characteristic X-ray emitted by atoms after excitation. The wavelength and intensity of different X-rays correspond to the types and contents of different elements, respectively. This instrument is the most widely used in gemmology for the rapid and non-destructive determination of the presence of most elements in turquoise, with a wide range of analytical concentrations, from macronutrients to trace elements, facilitating qualitative and semi-quantitative analysis of elements in gemstones with complex compositions such as spinel. In this experiment, the EDX-7000 energy dispersive X-ray fluorescence spectrometer of the jewelry college of China University of Geosciences (Beijing) was used, and the test atmosphere was selected as vacuum; the collimator was selected as 3 mm according to the sample size; the voltage was 15 kv when the measured element was Na-Sc, and 50 kv when the measured element was Al-U; the measurement results were expressed as oxide.
3. Results
3.1. Color Quantification
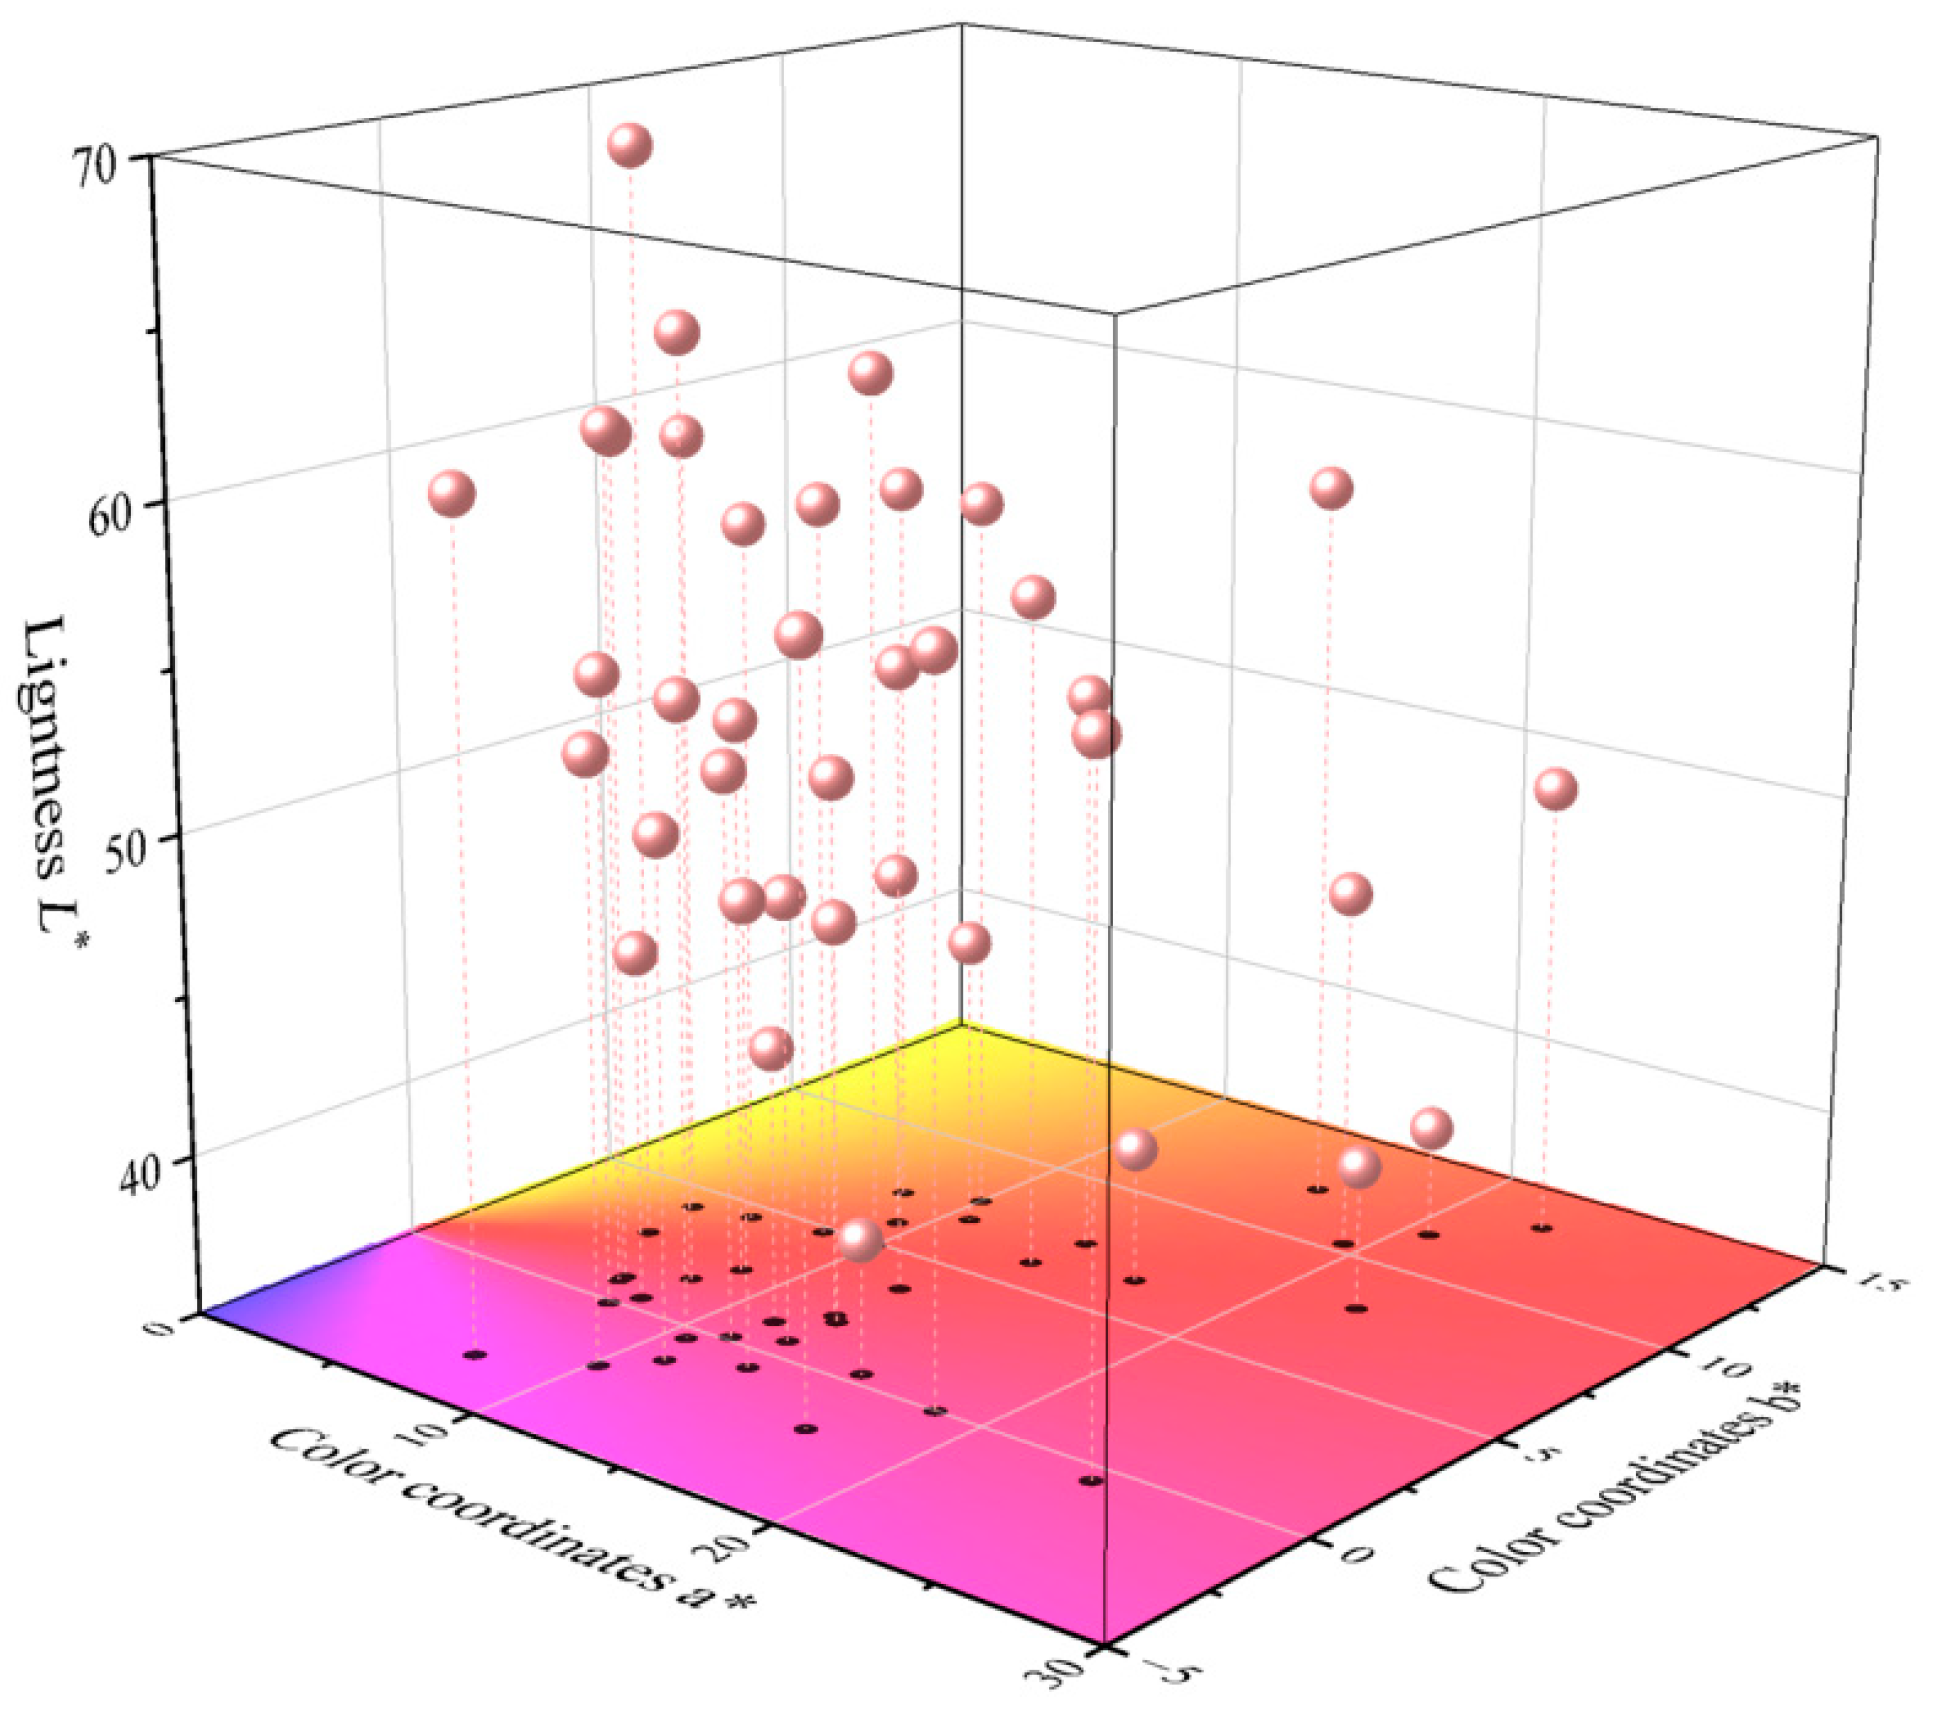
Spinel color parameter throw point under D65 light source Figure 2 is shown. According to the test results, the color parameters L* ∈ (38.53, 69.21), a* ∈ (4.36, 24.09), b* ∈ (−3.23, 13.29), C* ∈ (5.51, 26.36) and h° ∈ (−23.69, 43.79) of the experimental samples belong to the violet-red to orange-red hue interval, medium-high brightness and low color intensity.
Correlation analysis is an analytical method that measures the relationship between quantitative data and can be used to analyze the relationship between variables and their strength or weakness. In this paper, bivariate correlation analysis is used to study the relationship between color parameters. The absolute value of Pearson’s correlation coefficient in correlation analysis is (0.8,1.0), which means that the two have a very strong correlation. The results of the correlation analysis between the color parameters were calculated as shown in Table 1: there were extremely strong correlations between chroma C* and color coordinates a*, and between hue angle h° and color coordinates b*.
Based on Pearson’s analysis, the chroma C* is fitted to the color coordinates a* and the hue angle h° to the color coordinates b* in this paper, as shown in Figure 3, and the fitting equations are as follows:
C* = 0.26 + 1.06a* (r = 0.979)
h° = 2.10 + 6.79b* − 0.36b*2 (R2 = 0.861)
From Figure 3a, the fit correlation coefficient r is 0.979, and the 95% confidence band and 95% prediction band are indicated by dark pink and light pink areas in the figure, respectively. There is a highly significant linear positive correlation between the color value a* and the chroma value C*, meaning that the chroma value of spinel gradually increases as the color value a* increases. The coefficient of determination R2 in Figure 3b is 0.861, indicating that there is also a positive correlation between the color value b* and the hue angle h° in the interval, meaning that the hue angle h° of spinel gradually increases as the color value b* increases.
3.2. Chemical Composition
ED-XRF is a semi-quantitative assay that yields the relative content of each element. Nine samples were tested by X-ray fluorescence spectroscopy and the test results were normalized and presented as oxides. The content of the main mass fractions of oxide (%) in spinel samples is shown in Table 2: the average content of Mg and Al in spinel samples was 97.210 wt%. In addition to the main elements, trace elements Cr (0.050–0.318 wt%), V (0.010–0.696 wt%), Fe (0.122–0.575 wt%), Zn (0.000–1.923 wt%) and Si (1.034–8.072 wt%) are also present, where w(Fe2O3) represents the detected total Fe content, independent of the valence state.
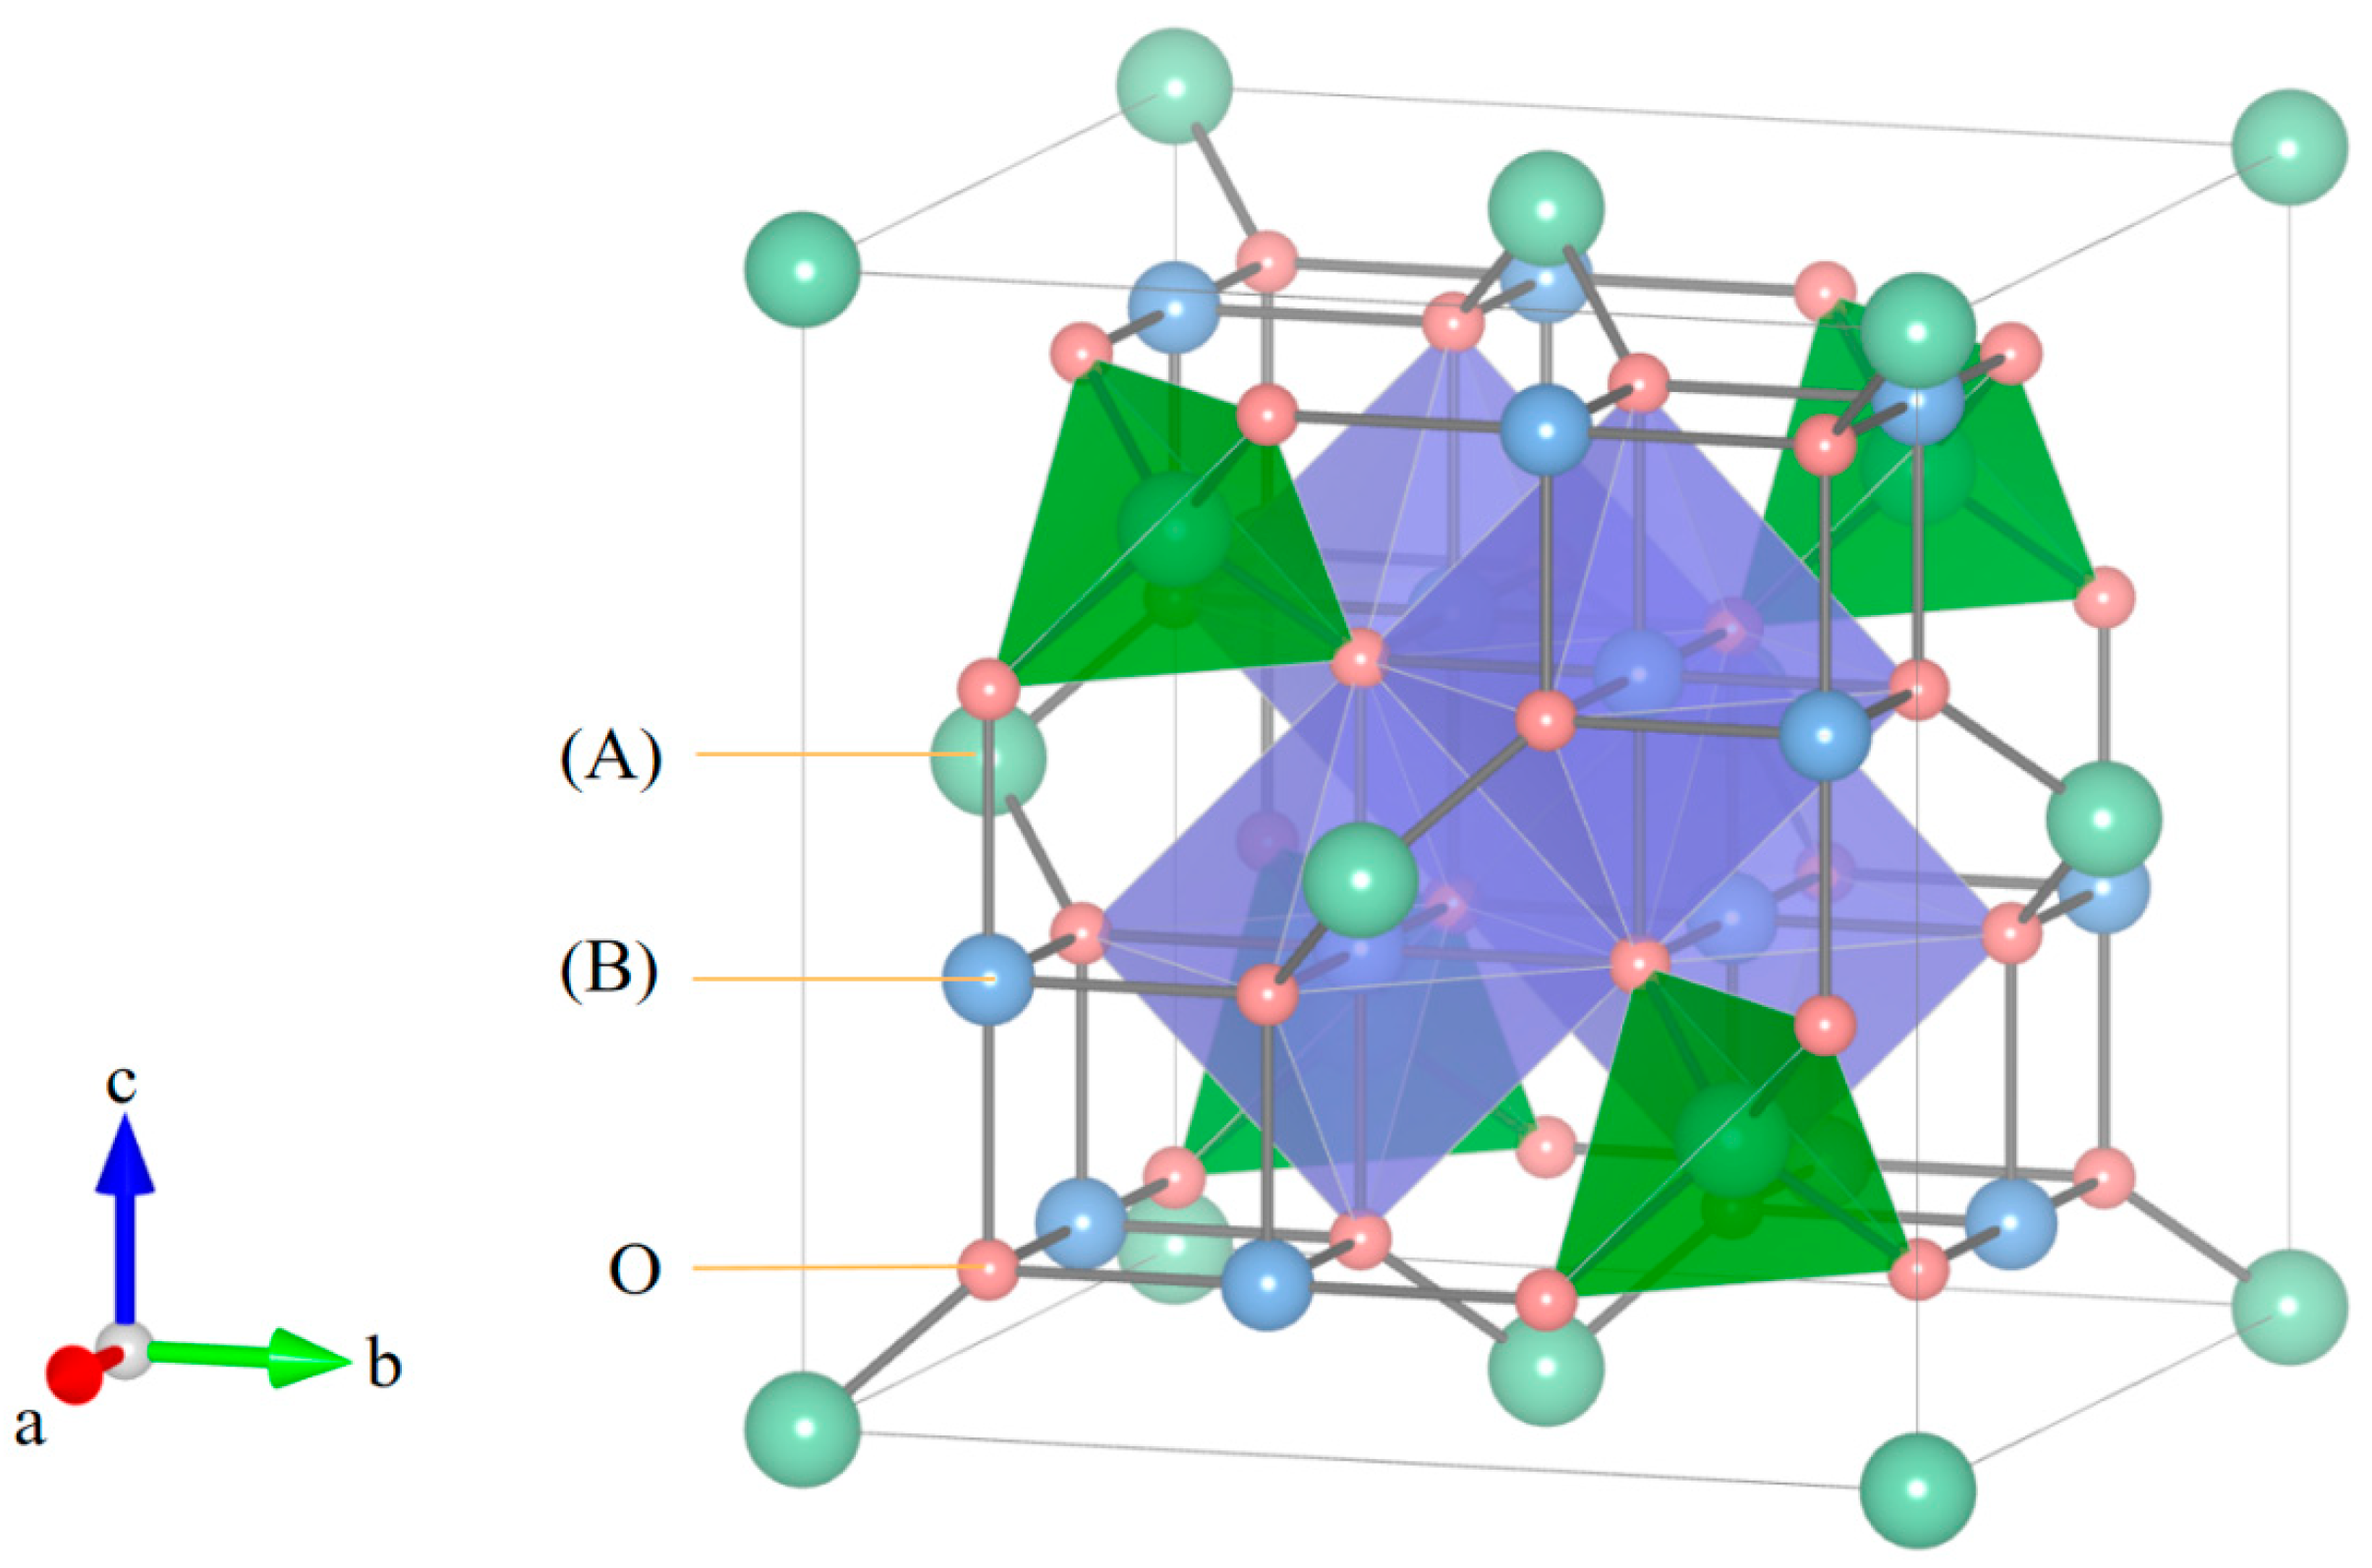
As shown in Figure 4, spinel divalent oxygen ions are cubically most tightly packed in the three-dimensional space, forming two types of voids, tetrahedral and octahedral, which are filled by two types of cations, A and B, respectively. Pure spinel is MgAl2O4, and spinel exhibits different colors when trace amounts of transition group metal elements replace Al3+ or Mg2+ in the crystal structure. The relationships between spinel components were analyzed on the basis of bivariate correlations, and the results are shown in Table 3. Negative correlations exist between Al and Si, Cr and V, indicating that these three ions mainly replace Al3+ in octahedral voids. Negative correlations between Zn and Mg are higher than those between Zn and Al, indicating that Zn2+ mainly undergoes homogeneous substitution with Mg2+ in tetrahedral voids. The negative correlation between Fe and Mg indicates that Fe is mainly in the form of Fe2+, in agreement with the Fe3+/Fetot ratio of 7 to 21% in spinel measured by Giovanni B. Andreozzi using Musburger spectroscopy (the latter being the richest Fe sample). The negative correlation between total trace elements and Al is higher than that between total trace elements and Mg, indicating that overall, the lower the Al content, the higher the overall total trace element content and the greater the degree of homogeneous substitution. The linear fitting equation between the two is as follows:
w(Al2O3) = 71.66 − 1.01w(Si + Zn + Fe + Cr + V) (R2 = 0.975)
The color of spinel is influenced by two or more transition element chromophores, which can be divided into two categories, chromogenic chromophores of chromium and chromogenic chromophores of iron. The color of vanadium–chromogenic spinel is mainly influenced by Cr3+ and V3+ in the octahedral voids. The ternary phase diagrams of the three chromogenic elements are shown in Figure 5. sp-3, sp-4, sp-10, sp-12 and sp-13 are mainly Fe chromogenic spinels, while the higher content of sp-5, sp-9, sp-14 and sp-22 are mainly Cr-vanadium chromogenic spinels.
3.3. UV-Vis Spectroscopy Characteristics of Spinel
In this paper, nine spinel samples with uniform color and relatively pure interior were selected and their spectra were tested by the transmission method to compare and analyze the characteristic absorption of different transition metal ions in the UV-vis absorption spectra, so as to analyze the effect of chromogenic ions on spinel color. The spectral bands of the UV-Vis absorption spectra of various spinel shades varied in the 300–800 nm range. According to the classification of the ternary phase diagram in the previous paper, nine samples were divided into two categories: iron-bearing spinel and chromium–vanadium-bearing spinel for UV-visible spectroscopy analysis.
The UV-visible absorption spectra of iron-bearing spinel at 300–800 nm are shown in Figure 6. The iron-bearing spinel UV-vis absorption spectrum formed multiple absorption regions in the 300–800 nm range: a broad absorption band with good symmetry at 380 nm and 530 nm, while a narrow absorption band was formed at 470 nm and 650 nm. Compared to sp-10, which has the lowest hue angle, and sp-3, which has the highest hue angle, the former has a higher absorption intensity in the yellow-green region. Therefore, its purplish-red hue is heavier, which means that the hue angle becomes lower.
The UV-visible absorption spectra of chromium–vanadium-bearing spinel at 300–800 nm are shown in Figure 7. It formed two distinct absorption bands in the 300–800 nm range, which were located in the blue-violet region at 390 nm and the yellow-green region at 540 nm, while the absorption intensity in the blue-violet region was greater than that in the yellow-green region, thus giving the spinel a red hue. The UV-visible absorption spectra of sp-5 and sp-9 were plotted in the same coordinate system after the debasement process, and the peak absorption area of sp-5 was significantly higher than that of the latter, so the red tone became darker, which means that the hue angle decreased.
4. Discussion
4.1. Color Causes of Spinel
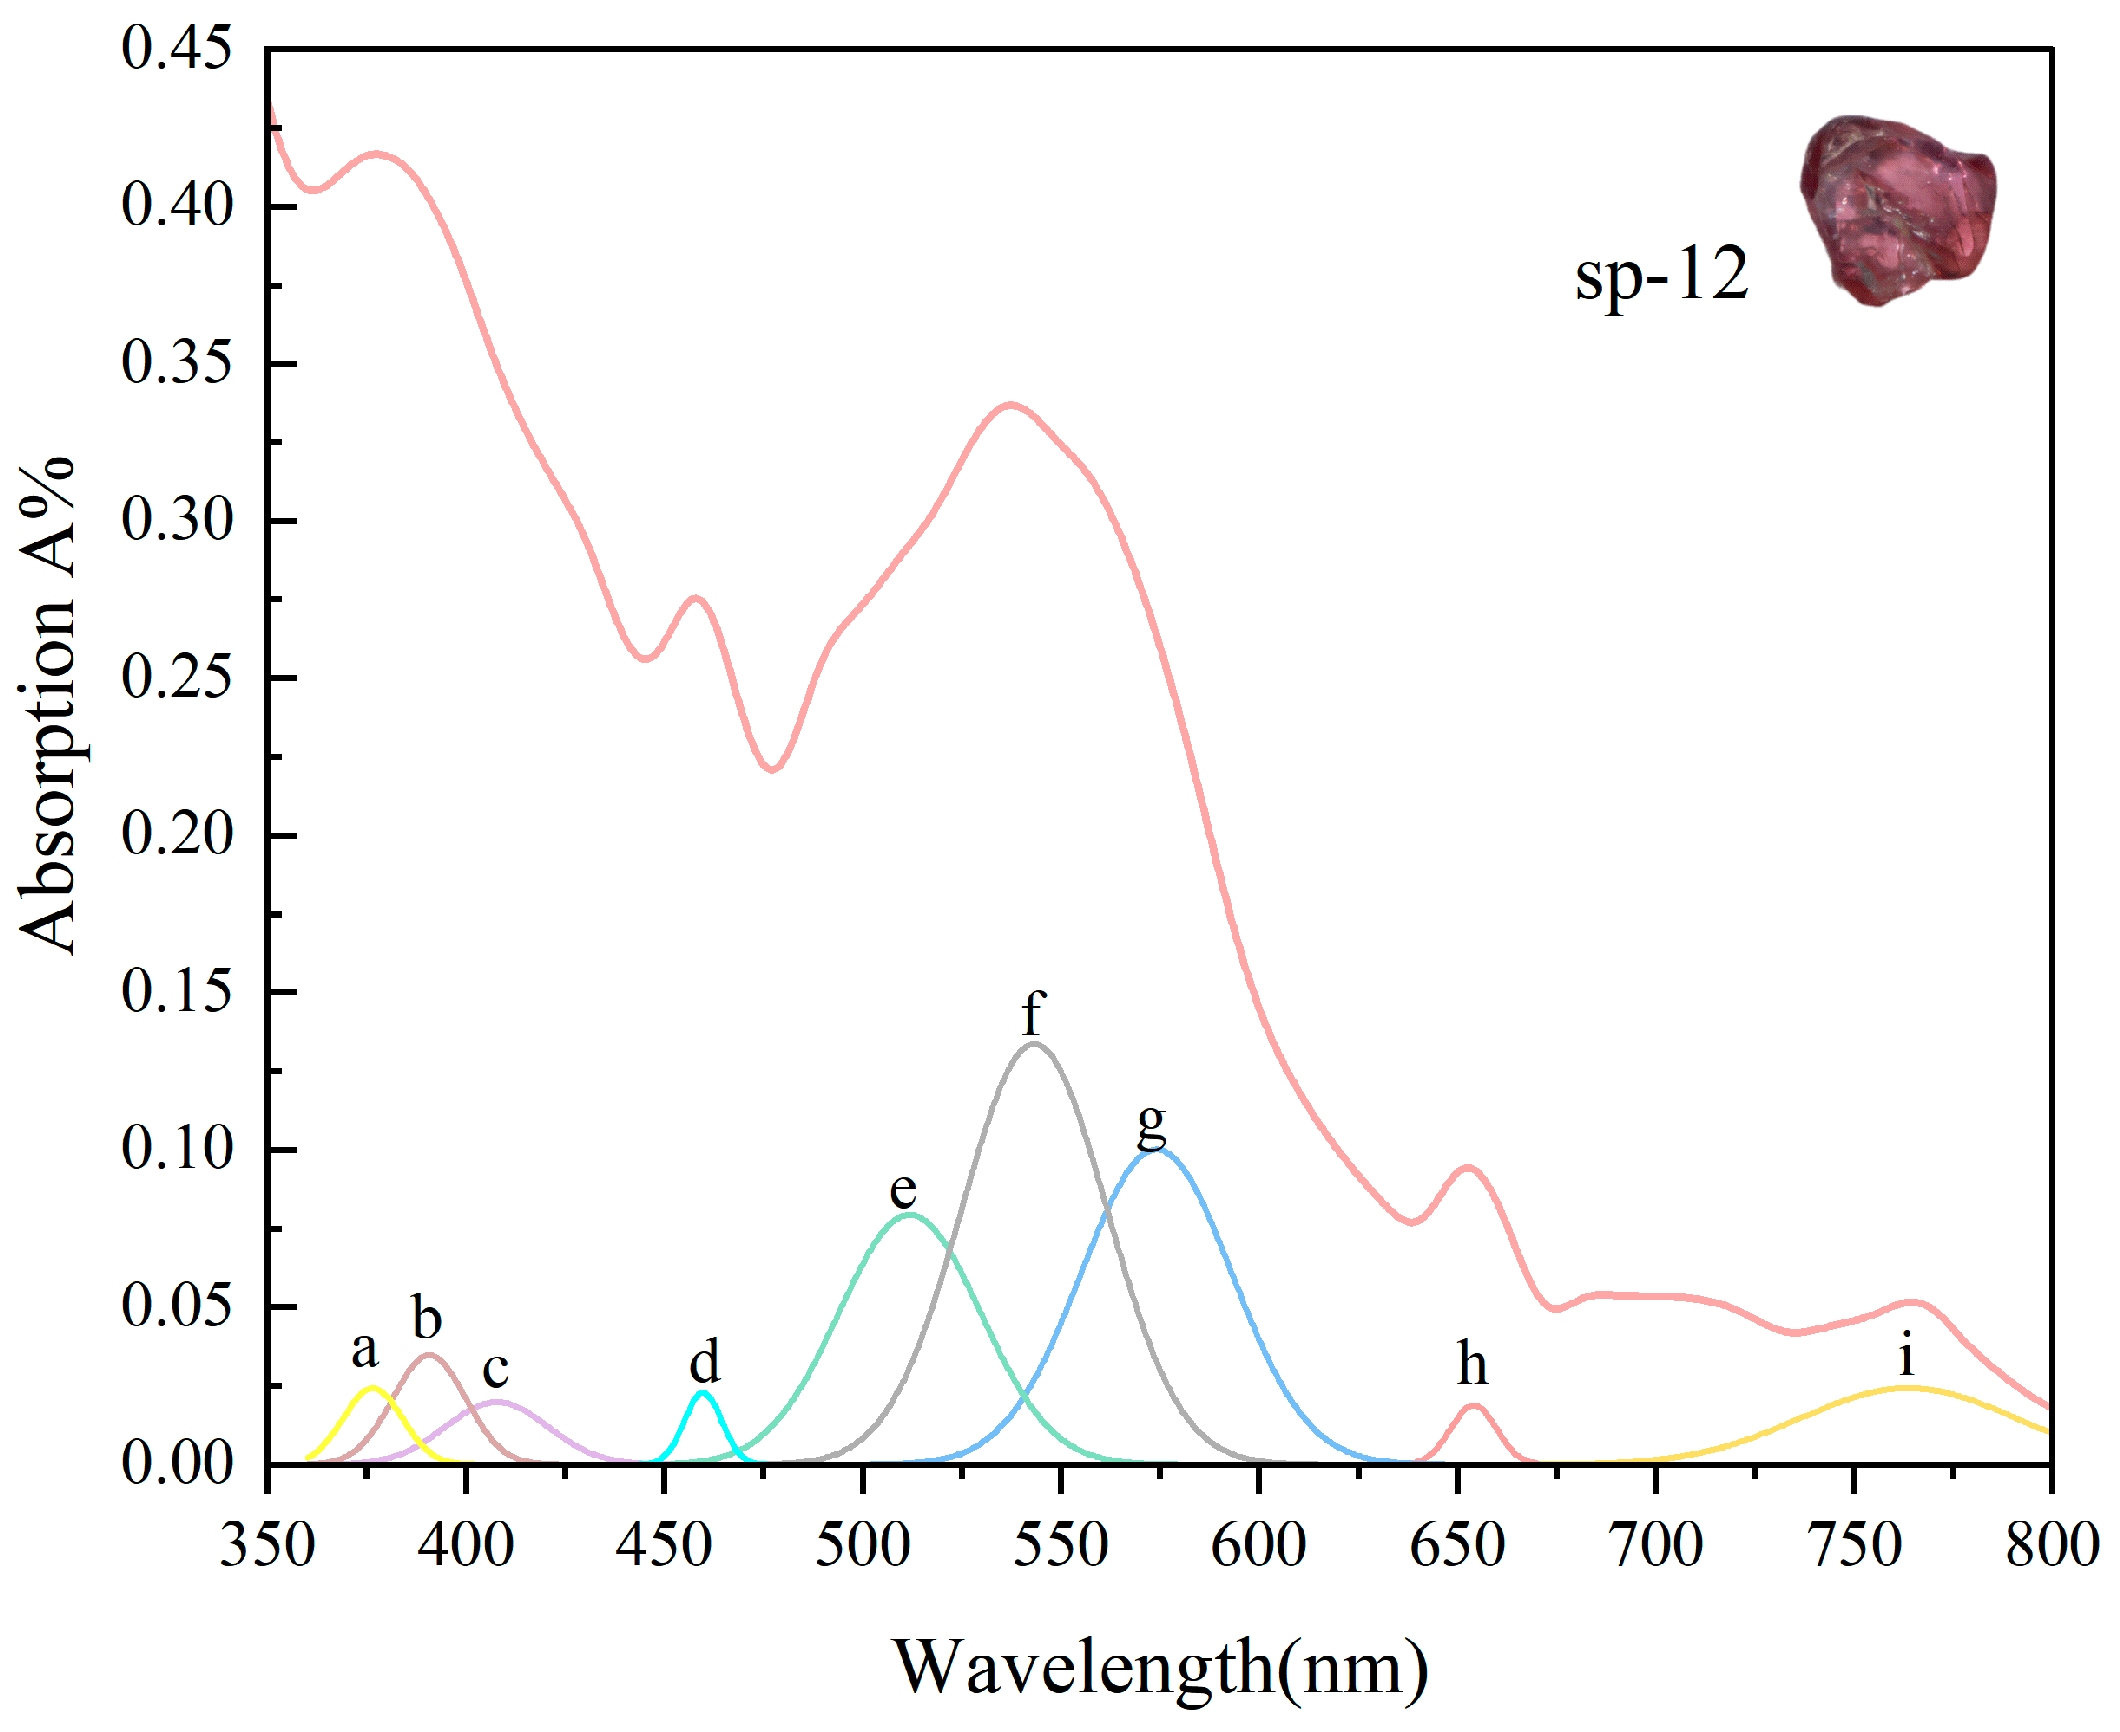
According to the composition test analysis, the main components of spinel composition are Mg and Al, and the trace elements are Cr, V, Fe, Zn, Si, etc. Spinel is an allochromatic colored gemstone. Its color is influenced by two or more transition element chromophores, and the spinel can be divided into two categories based on different chromophores, iron-bearing spinel and chromium–vanadium-bearing spinel. To facilitate statistical analysis, the UV-Vis absorption spectra were fitted with Peak Fit v4.12 by splitting the peaks. The absorption curves were smoothed sm = 6.5% using the Loess method, the appropriate baseline processing parameters were selected as best tol 1.9–4.6%, and the possible absorption bands were fitted using Guass Amp, and the fitting coefficients R2 all reached 98% or above.
Although the hue angles of all iron-bearing spinel samples differed, they generally had similar absorption spectra. The results of sp-12 peak fitting are shown in Figure 8. Detailed data on the fitting results and the attribution of each peak position are shown in Table 4. The UV-Vis absorption spectra of iron-bearing spinels are generally consistent, and 7–9 Gaussian curves can be fitted to all of them. To facilitate the description of these Gaussian peaks from low to high wavelengths, they are labeled from a to i, respectively. The position of the absorption band is related to the main elements of the sample, while the intensity of the absorption band is related to the trace elements it contains. The absorption bands of the UV-Vis absorption spectra of iron-bearing spinel are mainly attributed to spin-forbidden of TFe2+, MFe2+, MFe3+, and the relative intensity of Fe affects the absorption bands of the UV-Vis absorption spectra.
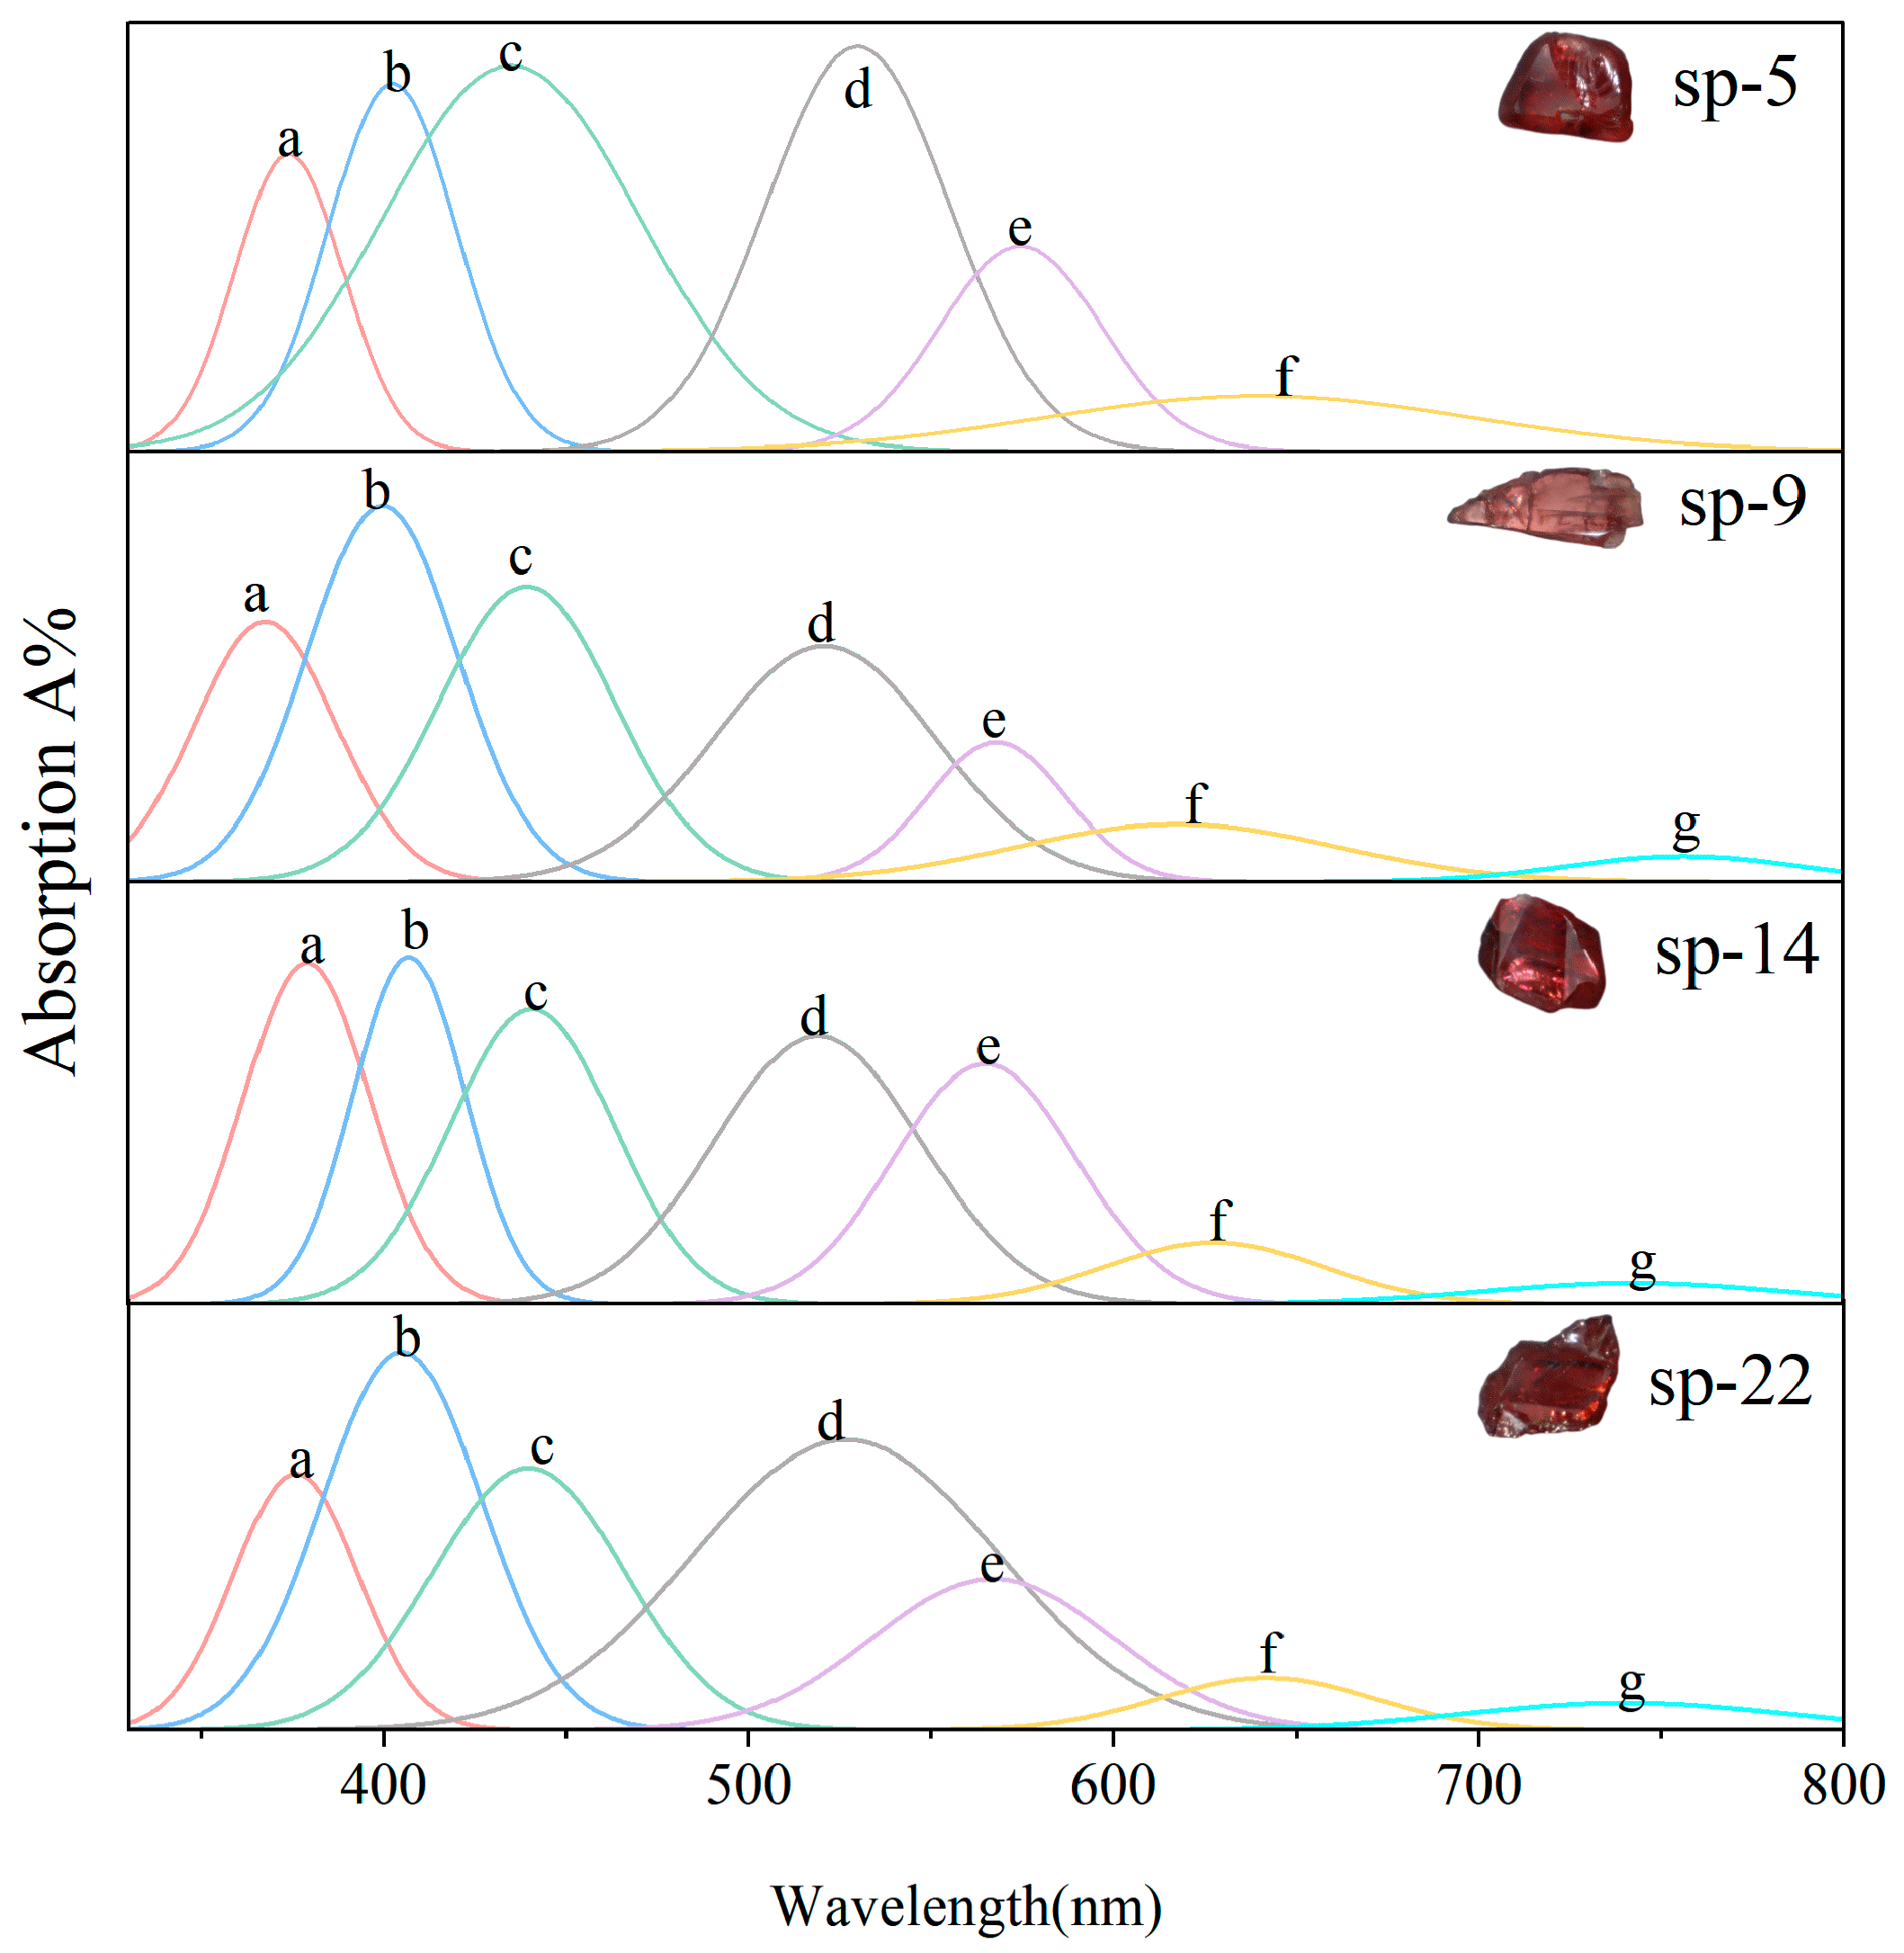
The chromium–vanadium-bearing spinel formed two distinct broad absorption bands in the 300–800 nm range, which were located in the blue-violet region at 390 nm and the yellow-green region at 540 nm. The UV-Vis absorption spectra are shown in Figure 9, and the locations of absorption bands and their attribution are shown in Table 5. The chromium–vanadium-bearing spinel was generally fitted to 6–7 Gaussian curves. Gaussian peaks are named from low wavelength to high wavelength from a to g. It is worth noting that it is often difficult to distinguish Cr3+ and V3+ in the split-peak fitting due to the spin-allowed leap at the octahedral position near 405 nm and 530 nm.
4.2. Relationship between Color and Composition
As analyzed by ED-XRF and UV-Vis in the previous section, spinel color is often caused by transition metal ions, especially iron, chromium and vanadium. To explore the relationship between spinel composition and color parameters, the previously mentioned bivariate analysis method was used to calculate Pearson coefficients between r parameters. The results of the calculations are shown in Table 6. The results show that there is a strong negative correlation between spinel brightness and w(Cr). In other words, as Cr3+ content increases, spinel brightness decreases.
The hue angles between iron and vanadium on spinel are both correlated, but have opposite effects on them. Based on the previous data, the following box plot is shown in Figure 10. The hue angle ranges from (−6.53, +11.53) for iron-bearing spinel to (+19.76, +36.65) for chromium–vanadium-bearing spinel, with the hue angle for iron-bearing spinel being smaller than another. Fitting the hue angles to the iron and vanadium content of the spinel, respectively, shows:
h° = 55.33 − 176.36w(Fe) + 125.76w(Fe)2, R2 = 0.81
h° = −2.95 + 240.12w(V) − 402.10w(V)2, R2 = 0.80
Combined with UV-Vis data, it is clear that chromium makes the spinel appear red. As iron content increases, the spinel hue angle decreases, shifting from red tones to purple tones. With the increase in vanadium, the orange tone of spinel increases. In summary, the hue angle of iron-bearing spinel is less than another, so iron spinel is more violet-red and chromium–vanadium-bearing spinel is more orange-red.
5. Conclusions
The chroma C* of the violet-red to orange-red spinel is mainly controlled by the variation of the color coordinates a*; the hue angle h° is mainly controlled by the variation of the color coordinates b*. According to the results of ED-XRF and UV-Vis tests, spinel can be classified as iron-bearing spinel and chromium–vanadium-bearing spinel according to their chromogenic elements, and they have similar UV spectra, respectively. Among them, Fe mainly exists as Fe2+, which is mainly replaced with Mg2+ in tetrahedral voids by homogeneous substitution, while Cr3+ and V3+ are mainly replaced with Al3+ in octahedral voids, and the level of Al content indicates the degree of isomorphism occurring in spinel. Chromium is the main reason for spinel’s red tint. With the increase in Cr, the spinel lightness L* decreases; with the increase in Fe content, the absorption band at 530 nm due to the spin-forbidden leap of Fe2+ at the T site in the UV-Vis absorption spectrum is enhanced, resulting in the decrease in spinel hue and shift from red to violet-red tone; with the increase in V content, the absorption band at 390 nm in the blue-violet region and 540 nm caused by the spin-allowed leap of Cr3+ and V3+ at M position in the yellow-green region becomes wider, resulting in the increase in spinel hue and shift to orange.
6. Patents
This section is not mandatory but may be added if there are patents resulting from the work reported in this manuscript.
Author Contributions
Conceptualization, Y.D.; methodology, Y.D. and Y.G.; validation, Y.G.; formal analysis, Y.D.; investigation, Y.D.; resources, Y.D. and Y.G.; data curation, Y.D.; writing—original draft preparation and editing, Y.D.; supervision, Y.G.; project administration, Y.G. All authors have read and agreed to the published version of the manuscript.
Funding
The APC was funded by the Institute of Jewelry, China University of Geosciences, Beijing and Professor Ying Guo (guoying@cugb.edu.cn).
Data Availability Statement
Not applicable.
Acknowledgments
Experiments in this research were carried out in laboratories of the Gemological Institute, China University of Geosciences, Beijing.
Conflicts of Interest
The authors declare no conflict of interest.
References
- Andreozzi, G.B.; Ippolito, V.D.; Skogby, H.; Hålenius, U.; Bosi, F. Color mechanisms in spinel: A multi-analytical investigation of natural crystals with a wide range of coloration. Phys. Chem. Miner. 2019, 46, 343–360. [Google Scholar] [CrossRef]
- Ippolito, V.D.; Andreozzi, G.B.; Hålenius, U.; Skogby, H.; Hametner, K.; Günther, D. Color mechanisms in spinel: Cobalt and iron interplay for the blue color. Phys. Chem. Miner. 2015, 42, 431–439. [Google Scholar] [CrossRef]
- D’Ippolito, V.; Andreozzi, G.B.; Bosi, F.; Halenius, U. Blue spinel crystals in the mgal2o4-coal2o4 series: Part i. Flux growth and chemical characterization. Am. Miner. 2012, 97, 1828–1833. [Google Scholar] [CrossRef]
- Andreozzi, G.B.; Princivalle, F.; Skogby, H.; Giusta, A.D. Cation ordering and structural variations with temperature in mgal2o4 spinel: An x-ray single-crystal study. Am. Miner. 2000, 85, 1164–1171. [Google Scholar] [CrossRef]
- Carbonin, S.; Martignago, F.; Menegazzo, G.; Negro, A.D. X-ray single-crystal study of spinels: In situ heating. Phys. Chem. Miner. 2002, 29, 503–514. [Google Scholar] [CrossRef]
- Zhao, L.; Li, G.; Weng, L. Gemological and spectroscopic characteristics of “jedi” spinel from man sin, myanmar. Minerals 2022, 12, 1359. [Google Scholar] [CrossRef]
- Malsy, A.K.; Karampelas, S.; Schwarz, D.; Klemm, L.; Armbruster, T.; Tuan, D.A. Orangey-red to orangey-pink gem spinels from a new deposit at lang chap (tan huong-truc lau), vietnam. J. Gemmol. 2012, 33, 19–27. [Google Scholar] [CrossRef]
- Belley, P.; Palke, A. Purple gem spinel from vietnam and afghanistan: Comparison of trace element chemistry, cause of color, and inclusions. Gems Gemol. 2021, 57, 228–238. [Google Scholar] [CrossRef]
- Fregola, R.A.; Skogby, H.; Bosi, F.; Ippolito, V.D.; Andreozzi, G.B.; Halenius, U. Optical absorption spectroscopy study of the causes for color variations in natural fe-bearing gahnite: Insights from iron valency and site distribution data. Am. Miner. 2014, 99, 2187–2195. [Google Scholar] [CrossRef]
- Taran, M.N.; Koch-Muller, M.; Feenstra, A. Optical spectroscopic study of tetrahedrally coordinated co2+ in natural spinel and staurolite at different temperatures and pressures. Am. Miner. 2009, 94, 1647–1652. [Google Scholar] [CrossRef] [Green Version]
- Kirillova, N.P.; Vodyanitskii, Y.N.; Sileva, T.M. Conversion of soil color parameters from the munsell system to the cie-l*a*b* system. Eurasian Soil Sci. 2015, 48, 468–475. [Google Scholar] [CrossRef]
- Vodyanitskii, Y.N.; Kirillova, N.P. Application of the cie-l*a*b* system to characterize soil color. Eurasian Soil Sci. 2016, 49, 1259–1268. [Google Scholar] [CrossRef]
- Goguitchaishvili, A.; Ruiz, R.G.; Bautista, F.; Hernández, R.S. Colorimetric method to estimate the soil organic matter in karst areas. Ecosistemas Recur. Agropecu. 2022, 9, 1. [Google Scholar] [CrossRef]
- Bujdoš, D.; Bulíková, L. Effect of ratio of liquid pigment on colouring cement matrix. Solid State Phenom. 2019, 296, 3–8. [Google Scholar] [CrossRef]
- Shang, Y.; Guo, Y.; Tang, J. Spectroscopy and chromaticity characterization of yellow to light-blue iron-containing beryl. Sci Rep 2022, 12, 10765. [Google Scholar] [CrossRef]
- Wang, H.; Guan, Q.; Liu, Y.; Guo, Y. Effects of transition metal ions on the colour of blue-green beryl. Minerals 2022, 12, 86. [Google Scholar] [CrossRef]
- Tang, J.; Guo, Y.; Xu, C. Color effect of light sources on peridot based on cie1976l*a*b* color system and round rgb diagram system. Color Res. Appl. 2019, 44, 932–940. [Google Scholar] [CrossRef]
- Tang, J.; Guo, Y.; Xu, C. Metameric effects on peridot by changing background color. J. Opt. Soc. Am. A 2019, 36, 2030. [Google Scholar] [CrossRef]
- Wang, X.; Guo, Y. The impact of trace metal cations and absorbed water on colour transition of turquoise. R. Soc. Open Sci. 2021, 8, 201110. [Google Scholar] [CrossRef]
- Wang, X.; Guo, Y.; Zhang, X.; Cui, Y.; Tang, J. Study on turquoise’s green color grading and quality evaluation of color based on cie1976 l * a * b * uniform color space. DEStech Trans. Mater. Sci. Eng. 2017, 132–138. [Google Scholar]
- Jiang, Y.; Guo, Y.; Zhou, Y.; Li, X.; Liu, S. The effects of munsell neutral grey backgrounds on the colour of chrysoprase and the application of ap clustering to chrysoprase colour grading. Minerals 2021, 11, 1092. [Google Scholar] [CrossRef]
- Jiang, Y.; Guo, Y. Genesis and influencing factors of the colour of chrysoprase. Sci. Rep. 2021, 11, 9939. [Google Scholar] [CrossRef] [PubMed]
- Liu, Z.; Guo, Y.; Shang, Y.; Yuan, B. Research on parameters optimization of digital imaging system in red–yellow jadeite color measurement. Sci. Rep. 2022, 12, 3619. [Google Scholar] [CrossRef] [PubMed]
- Ying, G.; Tao, M. Three Standard Illuminations’ Effect on Jadeite-Jade Color Green, 2010; IEEE: Piscataway, NJ, USA, 2010. [Google Scholar]
- Guo, Y.; Wang, H.; Li, X.; Dong, S. Metamerism appreciation of jadeite-jade green under the standard light sources d65, a and cwf. Acta Geol. Sin.—Engl. Ed. 2016, 90, 2097–2103. [Google Scholar] [CrossRef]
- Liu, X.; Guo, Y. Study on the color-influencing factors of blue iolite. Minerals 2022, 12, 1356. [Google Scholar] [CrossRef]
- Krzemnicki, M.S.; Hänni, H.A.; Reusser, E. Colour-change garnets from madagascar: Comparison of colorimetric with chemical data. J. Gemmol. 2001, 27, 395–408. [Google Scholar] [CrossRef]
- Qiu, Y.; Guo, Y. Explaining colour change in pyrope-spessartine garnets. Minerals 2021, 11, 865. [Google Scholar] [CrossRef]
- Sun, Z.; Palke, A.C.; Renfro, N. Vanadium- and chromium-bearing pink pyrope garnet: Characterization and quantitative colorimetric analysis. Gems Gemol. 2016, 51, 348–369. [Google Scholar] [CrossRef] [Green Version]
Figure 1.
Some spinel samples under D65 light source.

Figure 2.
Cast point diagram of spinel color parameters L*, a*, b* under D65 light source.

Figure 3.
Fitting analysis between color parameters under D65 light source (a) Chroma C* and color coordinates a* (b) Hue angle h° and color coordinates b*.
Figure 3.
Fitting analysis between color parameters under D65 light source (a) Chroma C* and color coordinates a* (b) Hue angle h° and color coordinates b*.

Figure 4.
The crystal structure of spinel.

Figure 5.
Spinel Cr2O3-V2O3-FeO (wt%) ternary phase diagram.

Figure 6.
UV-Vis absorption spectra of iron-bearing spinel.

Figure 7.
UV-Vis absorption spectra of chromium–vanadium-bearing spinel.

Figure 8.
UV-Vis absorption spectra split peak fitting of sp-12.

Figure 9.
Split peak fitting of UV-Vis absorption spectra of chromium–vanadium-bearing spinel.

Figure 10.
(a) Distribution range of spinel hue angle h° (b) Relationship between hue angle h° and iron and vanadium content.
Figure 10.
(a) Distribution range of spinel hue angle h° (b) Relationship between hue angle h° and iron and vanadium content.


Table 1.
Correlation analysis between spinel color parameters under D65 light source. ** At level 0.01 (double tail), the correlation was significant.
Table 1.
Correlation analysis between spinel color parameters under D65 light source. ** At level 0.01 (double tail), the correlation was significant.
| Color Parameters | a* | b* | C* | h° |
|---|---|---|---|---|
| a* | 1.000 | 0.372 | 0.980 ** | −0.042 |
| b* | - | 1.000 | 0.534 | 0.838 ** |
| C* | - | - | 1.000 | 0.122 |
| h° | - | - | - | 1.000 |
Table 2.
ED-XRF chemical composition test results (wt%).
| Sample | sp-3 | sp-4 | sp-5 | sp-9 | sp-10 | sp-12 | sp-13 | sp-14 | sp-22 |
|---|---|---|---|---|---|---|---|---|---|
| Al2O3 | 68.553 | 70.173 | 62.205 | 69.902 | 70.091 | 69.507 | 69.495 | 69.323 | 69.835 |
| MgO | 27.843 | 28.015 | 27.964 | 28.227 | 27.768 | 28.812 | 28.698 | 28.584 | 29.118 |
| SiO2 ZnO | 1.180 1.923 | 1.170 0.068 | 8.072 0.089 | 1.254 0.072 | 1.263 0.087 | 1.035 0.136 | 1.034 0.140 | 1.051 0.060 | 1.041 0.000 |
| Fe2O3 | 0.305 | 0.463 | 0.223 | 0.122 | 0.575 | 0.293 | 0.412 | 0.193 | 0.242 |
| Cr2O3 | 0.050 | 0.059 | 0.318 | 0.046 | 0.050 | 0.095 | 0.138 | 0.281 | 0.117 |
| V2O3 | 0.067 | 0.010 | 0.476 | 0.343 | 0.016 | 0.050 | 0.014 | 0.387 | 0.417 |
| else | 0.079 | 0.042 | 0.653 | 0.033 | 0.149 | 0.072 | 0.069 | 0.121 | 0.006 |
| Total | 100.00 | 100.00 | 100.00 | 100.00 | 100.00 | 100.00 | 100.00 | 100.00 | 100.00 |
Table 3.
Correlation analysis among the chemical components of spinel.
| Si | Zn | Fe | Cr | V | Si + Fe + Cr + V | Zn + Fe | Si + Zn + Fe + Cr + V | ||
|---|---|---|---|---|---|---|---|---|---|
| Al | r | −0.978 | −0.042 | 0.293 | −0.709 | −0.594 | −0.975 | 0.026 | −0.989 |
| Sig | 0.000 | 0.915 | 0.021 | 0.032 | 0.166 | 0.000 | 0.947 | 0.000 | |
| Mg | r | −0.323 | −0.394 | −0.357 | 0.153 | 0.246 | −0.299 | −0.465 | −0.399 |
| Sig | 0.396 | 0.295 | 0.345 | 0.695 | 0.524 | 0.435 | 0.207 | 0.288 |
Table 4.
Iron-bearing spinel UV-vis absorption spectrum assignment and electronic transition (nm).
| Sample | sp-3 | sp-4 | sp-10 | sp-12 | sp-13 | Assignment and Electronic Transition [1] |
|---|---|---|---|---|---|---|
| a | 378 | 378 | 372 | 377 | 373 | TFe2+: s.f. 5E→3E |
| b | 392 | 387 | 387 | 391 | 387 | TFe2+: s.f. 5E→3T2,3T1 |
| c | 412 | 401 | 405 | 408 | 407 | TFe2+: s.f. 5E→3T1 possibly intensified by ECP transition |
| d | 459 | 461 | 459 | 460 | 459 | MFe3+: 6A1g→4A1g,4Eg possibly intensified by ECP transitions in TFe3+—MFe3+ clusters and by spin-forbidden 5E→3T2, 3T1, 3E in TFe2+ |
| e | - | 512 | 509 | 512 | 508 | - |
| f | 549 | 547 | 547 | 543 | 540 | TFe2+: s.f. 5E→3T2 |
| g | - | 580 | 581 | 574 | 573 | TFe2: s.f. 5E→3T1 |
| h | 654 | 653 | 655 | 654 | 652 | MFe2+-MFe3+ IVCT |
| i | 758 | 744 | 764 | 763 | 753 | TFe2+: s.f. 5E→3T1 |
Table 5.
Chromium–vanadium-bearing spinel UV-vis absorption spectrum assignment and electronic transition (nm).
Table 5.
Chromium–vanadium-bearing spinel UV-vis absorption spectrum assignment and electronic transition (nm).
| Sample | sp-5 | sp-9 | sp-14 | sp-22 | Assignment and Electronic Transition [1] |
|---|---|---|---|---|---|
| a | 374 | 368 | 379 | 375 | MCr3+: s.f. 4A2g(4F)→2T1g(2G) |
| b | 402 | 400 | 407 | 405 | MCr3+: s.a. 4A2g→4T1g(F) MV3+: s.a. 3T1g(F)→3T1g(P) |
| c | 435 | 439 | 440 | 440 | MCr3+: s.a. 4A2g→4T1g(F) |
| d | 530 | 521 | 519 | 526 | MCr3+: s.a. 4A2g→4T2g(F) MV3+: s.a. 3T1(F)→3T2(F) |
| e | 575 | 568 | 564 | 567 | MCr3+: s.a. 4A2g→4T2g(F) |
| f | 640 | 618 | 628 | 642 | MFe2+-MFe3+ IVCT |
| g | - | 756 | 742 | 740 | TFe2+: s.f. 5E→3T1 |
Table 6.
Bivariate correlation analysis between spinel composition and color parameters. ** At level 0.01 (double tail), the correlation was significant. * At level 0.05 (double tail), the correlation was significant.
Table 6.
Bivariate correlation analysis between spinel composition and color parameters. ** At level 0.01 (double tail), the correlation was significant. * At level 0.05 (double tail), the correlation was significant.
| Fe | Cr | V | ||
|---|---|---|---|---|
| L* | r | 0.509 | −0.834 ** | −0.748 * |
| Sig | 0.161 | 0.005 | 0.021 | |
| C* | r | 0.265 | 0.166 | 0.104 |
| Sig | 0.491 | 0.670 | 0.118 | |
| h° | r | −0.790 * | 0.205 | 0.826 ** |
| Sig | 0.011 | 0.598 | 0.006 |
Disclaimer/Publisher’s Note: The statements, opinions and data contained in all publications are solely those of the individual author(s) and contributor(s) and not of MDPI and/or the editor(s). MDPI and/or the editor(s) disclaim responsibility for any injury to people or property resulting from any ideas, methods, instructions or products referred to in the content. |
© 2023 by the authors. Licensee MDPI, Basel, Switzerland. This article is an open access article distributed under the terms and conditions of the Creative Commons Attribution (CC BY) license (https://creativecommons.org/licenses/by/4.0/).
Share and Cite
MDPI and ACS Style
Du, Y.; Guo, Y. Study on the Chromogenic Mechanism of Violet-Red to Orange-Red Spinel. Crystals 2023, 13, 339. https://doi.org/10.3390/cryst13020339
AMA Style
Du Y, Guo Y. Study on the Chromogenic Mechanism of Violet-Red to Orange-Red Spinel. Crystals. 2023; 13(2):339. https://doi.org/10.3390/cryst13020339
Chicago/Turabian StyleDu, Yang, and Ying Guo. 2023. "Study on the Chromogenic Mechanism of Violet-Red to Orange-Red Spinel" Crystals 13, no. 2: 339. https://doi.org/10.3390/cryst13020339
Note that from the first issue of 2016, this journal uses article numbers instead of page numbers. See further details here.