Article

Electro-Optic Effect of Laser Photobleaching on Viscoelastic Properties of Chiral Liquid Crystals

1
Institute of Molecular Physics, Polish Academy of Sciences, 60-179 Poznań, Poland
2
Institute of Physics, Jagiellonian University, 30-348 Kraków, Poland
3
Faculty of Materials Engineering and Technical Physics, Poznań University of Technology, 60-965 Poznań, Poland
*
Author to whom correspondence should be addressed.
Crystals 2023, 13(2), 164; https://doi.org/10.3390/cryst13020164
Submission received: 30 November 2022 / Revised: 5 January 2023 / Accepted: 14 January 2023 / Published: 17 January 2023
(This article belongs to the Special Issue Optoelectronics of Thin Films and Nanoparticles)

Abstract

:
Viscoelastic properties are one of the most fundamental properties of chiral liquid crystals. In general, their determination is not a straightforward task. The main problem is the multitude of physical parameters needed to determine the value of the elasticity and viscosity constants. It is also necessary to consider the character of a respective phase. This problem is particularly important in the case of chiral phases such as ferroelectric and antiferroelectric phases or in the blue phases. There are several experimental methods to measure viscosity and elasticity constants in chiral phases. These methods use various phenomena to detect deformation, e.g., light transmission, polarization current, light modulation, dielectric constant and helix deformation or helix unwinding. Commonly, an external electric field is used to induce deformation, the homogeneity of which inside the cell is essential. This study is focused on the analysis of the effect of laser photobleaching on the electro-optic properties of the antiferroelectric liquid crystal and on the homogeneity of the electric field. The results obtained by confocal microscopy as a function of the cell depth are presented. The influence of the stabilization procedure of the isolated region performed by controlled laser photobleaching on the electro-optic properties has been studied. The observation was conducted using a polarizing microscope, and numerical analysis of two-dimensional colored textures was performed. The obtained results suggest that laser photobleaching can produce an anchoring effect, which has a positive effect on the electro-optic properties of antiferroelectric liquid crystal.

1. Introduction

Austrian botanist Reinitzer discovered liquid crystals (LC) in 1888 [1]. The first applications appeared only in the 1960s (after almost 80 years). Thus far, scientists, who are fascinated by the non-trivial properties of liquid crystals, have studied them only from the cognitive side. The fact that the director (the resultant direction of the long axes of LC molecules), which is often the equivalent of the material optical axis, can be relatively easily modified by various external stimuli, such as mechanical, magnetic, electric, optical fields and temperature. This fact makes liquid crystals attractive for both industry and science. Due to substantial progress in the field of displays since the 1970s, LCs are one of the most popular materials in the world [2,3]. However, over the past decade, more and more researchers have shifted their attention from displays to other new applications of liquid crystals—for example, optical devices, telecommunications, information storage, holography, energy conservation, elastomeric robots, sensors, biotechnology and nano/micromanipulation, to name a few [4,5,6,7,8,9]. These new areas are leading to a liquid crystal renaissance, in particular with the design of new functional materials and new technologies [10].
It is known that an addition of a chiral LC dopant to the non-chiral LC system modifies the LC structure, and the liquid crystalline material becomes chiral [11]. It is worth noting here that in liquid crystals, we are dealing with two types of “chirality”: chirality of molecules and chirality of phases. Chiral molecules have one or more chiral centers, whereas phase chirality is related to the presence of a helical structure in the phase built up of chiral molecules. However, some phases may not be chiral even though they are composed of chiral molecules. Chiral liquid crystal molecules have been shown to form a helical smectic SmC* phase with ferroelectric properties [12]. The molecules form a layered structure with a random distribution of their centers of mass within the layer and are tilted by a certain angle with respect to the normal to the layer. This tilt depends on the temperature and the type of liquid crystal, and in successive layers, it twists to form a helical structure [13,14]. The ordering of the dipole moment is equivalent to the appearance of spontaneous polarization of the smectic layer [15]. Such a structure shows the existence of local spontaneous polarization [16]. The resultant polarization of a sample with a thickness equal to the pitch or a multiple, therefore, is equal to zero. When the chiral molecules are tilted in opposite directions in successive layers, and the resultant dipole moments that are perpendicular to the long axes of the molecules cancel each other in adjacent smectic layers, the antiferroelectric phase with a double helical structure is formed, and a three-step switching is observed [17,18,19].
Among liquid crystals, only the mechanical properties of the nematic phase are well understood, both from a theoretical and experimental point of view [20,21,22]. To describe the mechanical properties of the nematic, three coefficients of elasticity and five coefficients of viscosity are actually sufficient. In the case of chiral smectic liquid crystals, the situation is much more complicated [23,24]. Due to their layered structure, chirality and often lower symmetry, many more parameters are required to describe their properties. However, it turns out that for display applications, the most relevant constants for chiral liquid crystals are the twist elasticity coefficient of the smectic director c and the rotational viscosity coefficient, which affect the switching and threshold voltage [25]. Moreover, the switching time of ferroelectric liquid crystals strongly depends on the spontaneous polarization and mechanical properties. Therefore, it is seen that the viscoelastic properties are highly desirable, and the precise determination of viscoelastic parameters is of great importance for the design of new applications.
In most cases, the viscosity coefficient is measured by using the switching phenomenon (see, e.g., [26,27,28,29]). However, it might provide results disturbed by the use of a strong electric field. In this case, the switching method can give only qualitative but not the quantitative results. On the other hand, the measurement of viscosity is based on the observation of flow caused by an external force. To ensure correctness of the measurements, the flow should be laminar. It is the case only when the flow stimulating factor (e.g., the deformation of the helical structure) is weak. Up to now, the mechanical properties of the c-director in the ferroelectric and antiferroelectric smectic phases with non-deformed or weakly deformed helical structure have been not often investigated (a slight pitch deformation is due to electric field applied). Macroscopic changes in the optical properties of the sample are expressed by the average value of the helix deformation in the bulk. Based on calculations, the relationship between the linear electro-optic coefficient and the viscoelastic behavior of the mesogen was found. Therefore, the linear electro-optic parameter in absolute units should be determined [30,31,32], and the spontaneous polarization [33,34,35], the tilt angle [36,37] and the pitch [38] have to be determined.
The measurement of optic axis deviation a in a weak electric field is essential for determination of the elastic constant K when the electro-optic method is used. This quantity may be measured by detection of electro-optic response followed by the calibration procedure, as described in [39]. This calibration procedure allowed us to express the experimental results as angular quantities independent of experimental conditions. The remaining quantities can be found using other methods and techniques. Additionally, with the rapid development of composite liquid crystalline materials [40,41,42,43], it has been recognized that long range interactions in the mesophase can lead to a strong influence of the liquid crystal matrix on the change of orientation and position of the dopant. The doping of liquid crystals with nanoparticles of appropriate shapes and sizes also affects the properties of the whole system, facilitating or hindering the homogeneous ordering of the sample. In order to achieve results that unambiguously characterize the phase, a material is required that is relatively homogeneously oriented throughout the sample. The material should be thermodynamically stable and should preferably exhibit no ageing effects. Liquid crystals are most often surface-stabilized by polymer orientation layers, but a relatively homogeneous order in chiral smectic liquid crystals often requires the use of additional stimulation with a temperature gradient and an alternating electric field of different frequencies. In recent years, an additional stabilizing element has been photopolymerization. It has been observed that such a procedure can significantly increase the temperature range of a particular phase [44,45,46,47,48,49,50]. During the photobleaching procedure, molecules with fluorescent properties undergo chemical transformations under the influence of light absorption. There is then a process of irreversible disappearance of their fluorescence ability and, at sufficiently strong laser beam power, even photochemical destruction. Such action produces a boundary that further stabilizes the system and anchors the LC molecules in a well-defined area. It is worth noting that such photobleaching is an invasive and irreversible process compared, for example, with aging (the appearance of defects), which can be reversed using an appropriate procedure. The most common application here is a slow alternating electric field with an appropriate, sample-adapted voltage. We assumed that such an action could create a boundary which would additionally stabilize the system and anchor the LC molecules in a well-defined area, which would affect the properties of the material studied. A hypothesis has been suggested that the laser photobleaching method [51] could be an additional method of stabilizing liquid crystal layers.
The commercially available liquid crystal 4-(1-methylheptyloxycarbonyl)phenyl4-octyloxybiphenyl-4-carboxylate, which is abbreviated as (S)-MHPOBC, is a liquid crystal that has been extensively studied by various methods [18,19,20,37,52]. It is characterized by rich polymorphism and exhibits both ferroelectric and antiferroelectric phases in its phase sequence. The determined elasticity coefficients showed that their behavior is influenced by intermediate phases, phase sequence, ordering and susceptibility to the electric field of neighboring phases. In order to verify the laser photobleaching method using a fluorescence polarizing confocal microscope (FCPM), the observation was made by using a polarizing optical microscope (POM) for MHPOBC doped with a 4-dimethylamino-40-nitrostilbene fluorescent dye called DANS (MHPOBC + 0.1 wt.%DANS). The method of numerical analysis of two-dimensional textures was also applied (Color Texture Analysis, CTA) [53] to determine the intensity of light passing through the sample. Three-dimensional images were recorded using FCPM [54,55]. The sample was then subjected to a laser photobleaching procedure, and the intensity of light passing through the sample was re-examined. In addition, a single-temperature photobleaching procedure was performed for the MHPOBC + 0.5% Au nanoparticle composite [52]. The fluorescence intensity was checked before and after the laser photobleaching procedure using FCPM. The results obtained are presented and discussed in the following section.

2. Materials and Methods
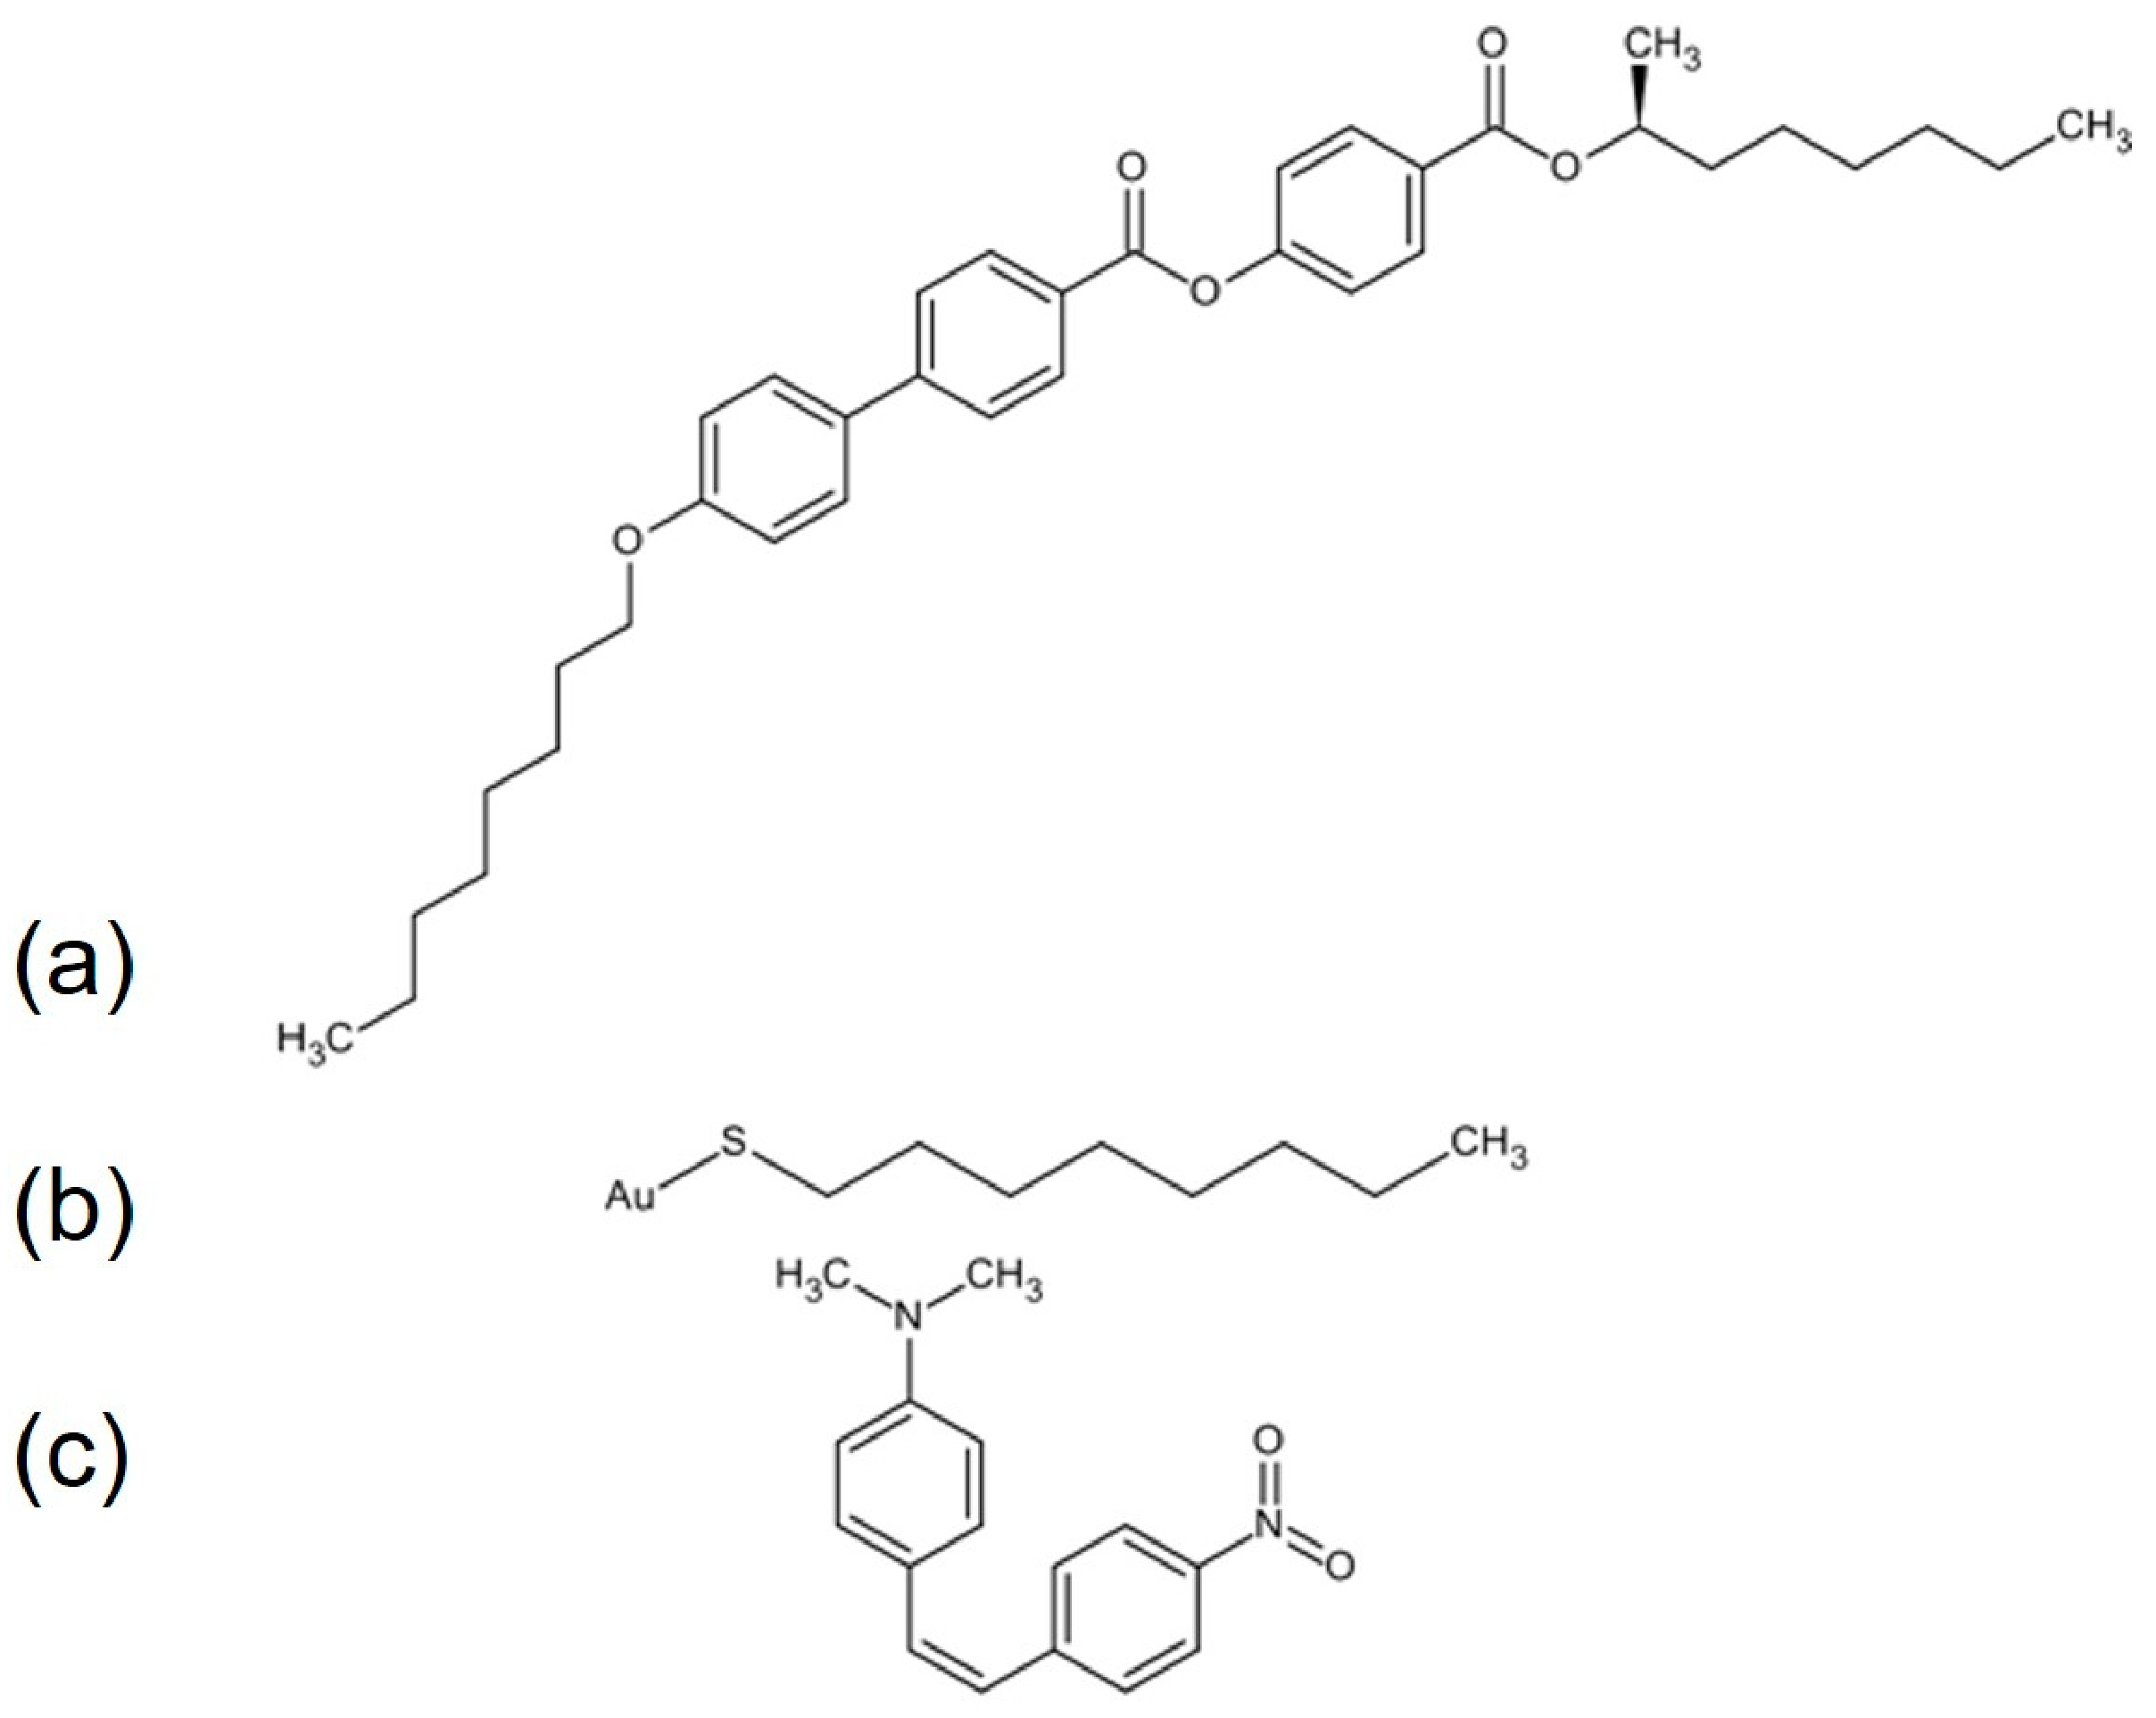
2.1. Materials

Commercially available liquid crystal (S)-MHPOBC (Military University of Technology, Warsaw, Poland and Sigma-Aldrich Co., Saint Louis, MO, USA) were used as a liquid crystalline matrix. The LC was in the form of white flakes and was used without chemical pre-purification. Its chemical structure is shown in Figure 1a. The liquid crystal was mixed with the fluorescent dye DANS to improve their visibility. The DANS dye chemical structure is shown in Figure 1c. The dye and its concentration were chosen based on the “guest–host” effect. DANS dye was chosen because its molecules have an approximate shape to those of the liquid crystalline materials studied, it mixes well with LC, and the amount of dye did not alter their structure. To create a liquid crystalline mixture with a fluorescent dye, a standard solution was prepared. The commercially available 1-octanethiol-functionalized gold nanoparticles (Au NPs) (spherical, diameter 2–4 nm) as 2% w/v solution in toluene (Sigma-Aldrich, Co., Saint Louis, MO, USA, Figure 1b) were also used as an admixture. The size of the Au nanoparticles was chosen as comparable to the average lengths of LC molecule. The composite MHPOBC + 0.5 wt.% Au NPs was prepared according to the procedure described in our previous paper [52].

2.2. Electro-Optic Response (EOR)

Electro-optic response was detected with a photodiode connected to a lock-in amplifier SR850 (Stanford Research) followed by the calibration procedure, as described in [39]. Electro-optic measurements were performed with the use of a commercial electro-optic cell (5 μm, polymer orienting layers) purchased by Linkam. The cell was filled with liquid crystalline material in the isotropic phase due to the capillary action. The Mettler Toledo hot stage with temperature stabilization ±0.1 K by the controller TC-6500 (from Digi-Sense) was used. The hot stage was fixed to the turntable of the polarizing microscope (PZO, Warsaw, Poland). The change in the intensity of light passing through the sample was recorded by a photodiode with the preamplifier PIN20 (FLC Electronics, Partille, Sweden). The output from the preamplifier was connected with the lock-in amplifier SR-850 (Stanford Research). The program made it possible to measure simultaneously the linear electrooptic and calibration response as a function of temperature.

2.3. Electro-Optic Measurements (EOM) and Color Texture Analysis (CTA)

The textures of liquid crystalline material at different temperatures were registered by using the polarizing optical microscope BX53-P (Olympus, Tokyo, Japan) connected with an XC10 Color Digital Camera (CCD) (Olympus, Tokyo, Japan). The LC samples are cooled down from the isotropic phase using an Instec hot stage ST HCS402 (Instec Inc., Boulder, CO, USA) and the precision mK2000 temperature controller (Instec Inc., Boulder, CO, USA). Commercially available electro-optic cells with planar alignment (5 μm, AWAT Company, Warsaw, Poland) were used. The cells were filled by capillary effect at a temperature just above the clearing point and then slowly cooled down to room temperature. CTA method is based on numerical analysis of textures recorded with a digital camera. The automatization of numerical analysis was developed by Sławomir Pieprzyk from the Institute of Molecular Physics at the Polish Academy of Sciences. The CTA method should not be treated as a determinant of phase transitions but as a supplement and verification of data obtained by other methods [53].

2.4. Fluorescence Confocal Polarizing Microscopy (FCPM)

The FCPM method was originally used to study liquid crystals due to the defects present in them. In our case, however, it is the method used to control laser photobleaching and detect fluorescence in the investigated materials [51,55,56]. An Olympus Fluoview 1200 fluorescence microscope (Olympus, Tokyo, Japan) with a diode laser (λ D 405 nm and λ D 473 nm) and a beam power equal to 1.24 mW was used. The low beam power is intentional, and its purpose is to avoid light-induced reorientation of LC molecules. The collected images show the fluorescence obtained simultaneously for two excitation wavelengths and detection ranges. The fluorescence signal was detected in the spectral range 430–455 nm (blue) and 490–590 nm (green) in the reflection mode. To obtain the 3D image of the whole sample, the focused beam scans the sample in the horizontal plane (x,y-directions) and then mechanically refocuses to a different depth of the sample (z-direction). Horizontal scanning was then repeated, which produced another thin ‘optical slice’. During the laser photobleaching procedure, all diode lasers that generate pulsed wavelengths (405 nm, 473 nm, 559 nm and 635 nm) were used with maximum burning power. The pulsed laser light was connected to the FV1200 scanner.

3. Results and Discussion

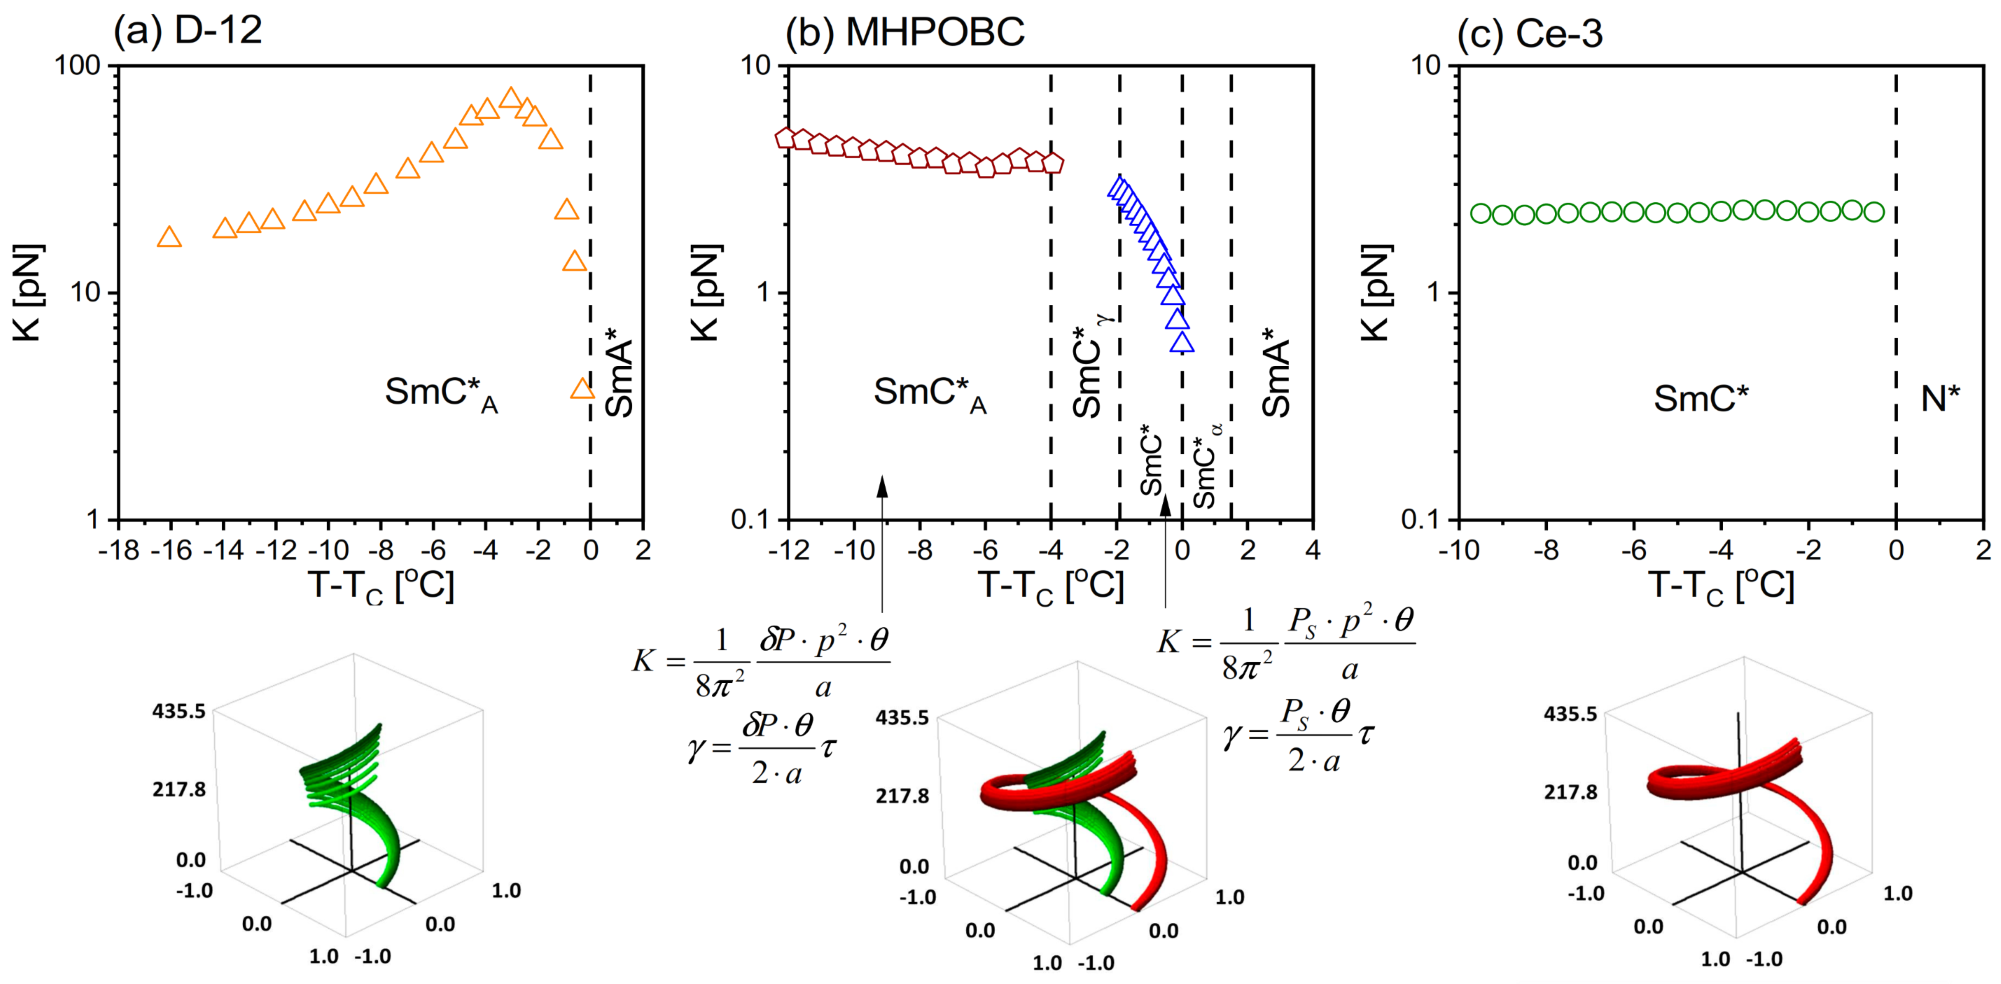
3.1. Viscoelastic Properties—Electro-Optic Results

A detailed description of the basics of the electro-optic method and calculations was presented in our previous papers [30,31,39]. Briefly, the determination of viscoelastic properties is limited to the following considerations. The starting point is the well-known equation of molecules’ motion in the ferroelectric smectic phase [33], exhibiting the helical superstructure with the helix axis oriented along the z axis, which can be written in the form:
K 2 ϕ z 2 γ ϕ t = P S E 0 s i n ϕ   c o s   ω t ,
where K is the interlayer twist elasticity coefficient, ϕ the angle between the electric field and the director, z—the spatial coordinate, γ—the rotational viscosity, t—time and PS is the local spontaneous polarization, E 0 the electric field, ω—the angular frequency. On the other hand, the optic axis orientation Δ α changes under a weak electric field E 0 , as follows:
Δ α = a · E 0 ,
where the coefficient a is independent on electric field E0. The relation between Δ α and the tilt angle of the molecules θ with respect to the smectic layer normal can be described as:
Δ α = 1 2 ϕ 0 s i n   θ ,
where the coefficient ϕ 0 , which characterizes the field-induced deformation of the helix, linearly depends on E 0 . Considering the above Equations (1)–(3), one can obtain:
1 2 P S s i n   θ K q 2 1 + ω 2 τ G 2 = a ,
where q = 2π/p, p is helix pitch, and τG denotes the relaxation time of the Goldstone mode:
τ G = γ K q 2 .
For frequencies ω << 1 τ G , the following expression for the interlayer elasticity coefficient K for ferroelectric and antiferroelectric materials is immediately obtained:
K = 1 8 π 2 P S p 2 θ a ,
where for antiferroelectric materials, the absolute value of the remaining local polarization associated with a pair of smectic layers can be determined by the relation:
δ P = 2 π l p P S ,
because the smectic layer of thickness l is much less than the helix pitch.
It has now become important to study a material in which ferroelectric and antiferroelectric phases occur in the phase sequence. Such behavior is exhibited by the well-known and comprehensively studied liquid crystal MHPOBC. It has been noted that the behavior of the elastic coefficient is different for different materials, which is not surprising. What is surprising is the influence of adjacent phases on the nature of the transition. Figure 2 shows the temperature dependence of the elastic constant for three different materials obtained by the electro-optic method using low electric fields. The D-12 material shows a direct transition from the antiferroelectric SmC*A to the paraelectric SmA* phase (for detailed results and calculations, see [31]) and a characteristic increase in the elastic coefficient with increasing temperature. Then, a sharp decrease in the vicinity of the transition is clearly visible. Radically different is the behavior of the elastic coefficient in the antiferroelectric SmC*A phase for the MHPOBC material. As the temperature increases, the elastic coefficient K slightly decreases until the phase transition to the SmC*γ phase (with a helical structure). One might suspect that if the helical pitch could be determined in this temperature range, the elasticity coefficient would continuously change to the value in the ferroelectric SmC* phase. What is surprising, however, it is its sharp decrease in the ferroelectric phase. It is likely that the frustration of the SmC*α sub-phase before the transition to the paraelectric phase SmA* is “sensed”. In contrast, in the ferroelectric SmC* phase of Ce-3 material (a detailed description of the determination of viscoelastic coefficients for this material was described in [32,33]), the elastic coefficient is practically constant through the SmC* phase up to the transition to the twisted nematic (cholesteric) N* phase. For easier illustration of the helix, one period of the helix versus temperature for each studied material is also shown in Figure 2. The number, nature and order of the phase transition seem to determine the viscoelastic properties of the material. The few liquid crystals studied so far do not allow generalized conclusions about the etiology of the observed differences. A hypothesis has been put forward that chirality (or lack thereof) and susceptibility to an electric field (or lack thereof) play a decisive role here. To this end, it will be worthwhile to study numerous compounds with different phase sequences and dielectric properties and their mixtures.

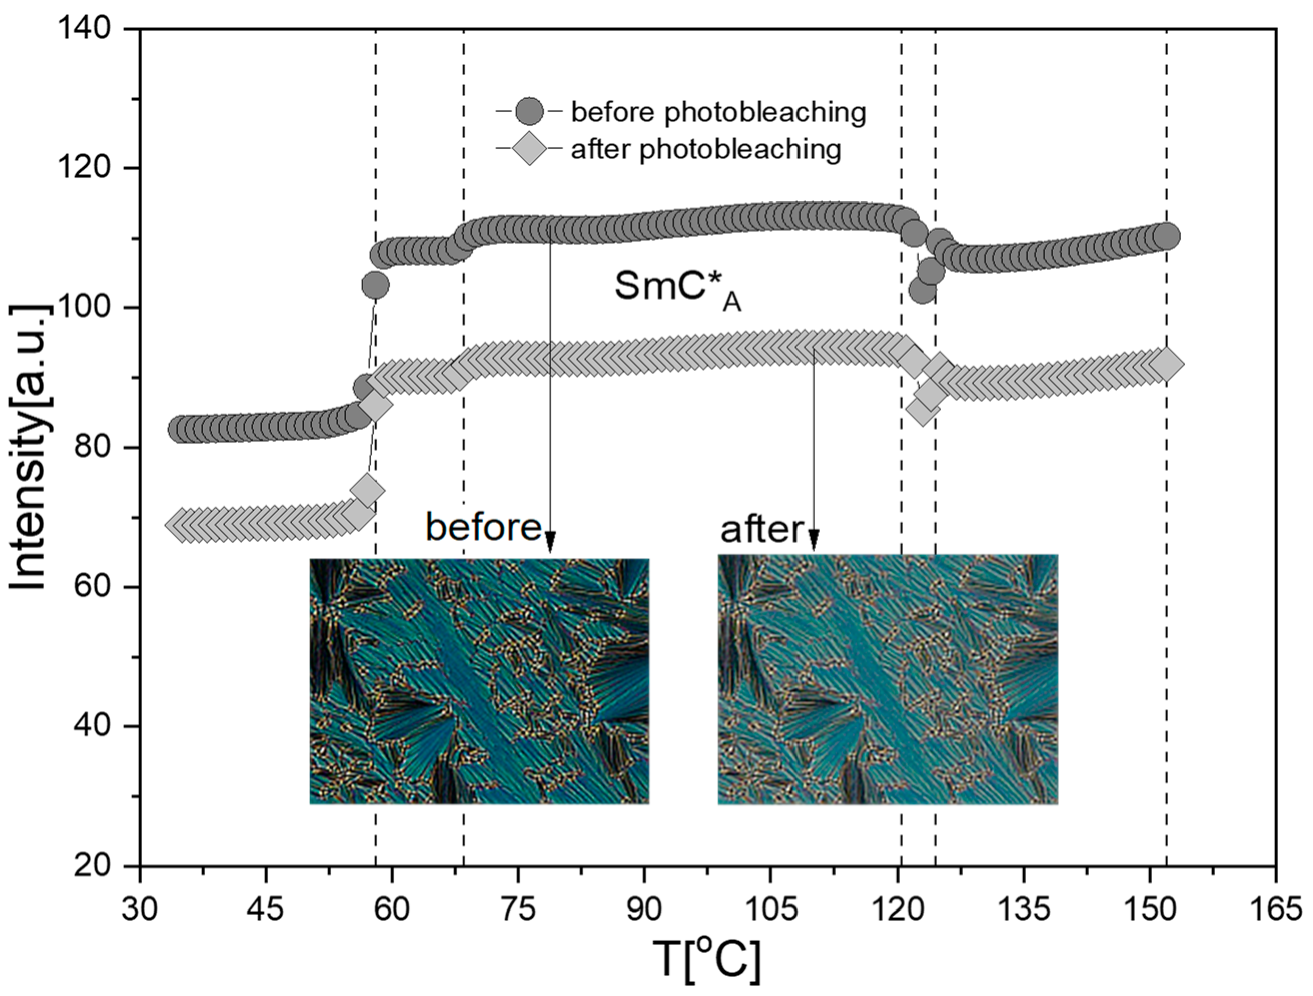
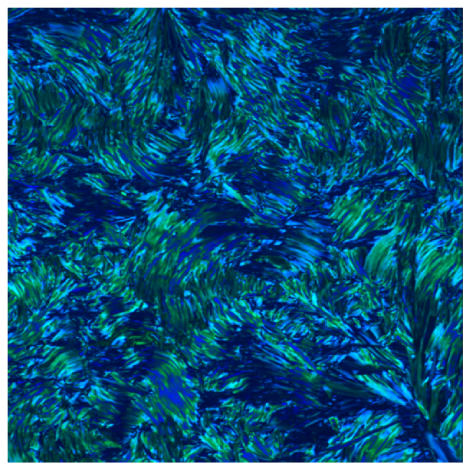
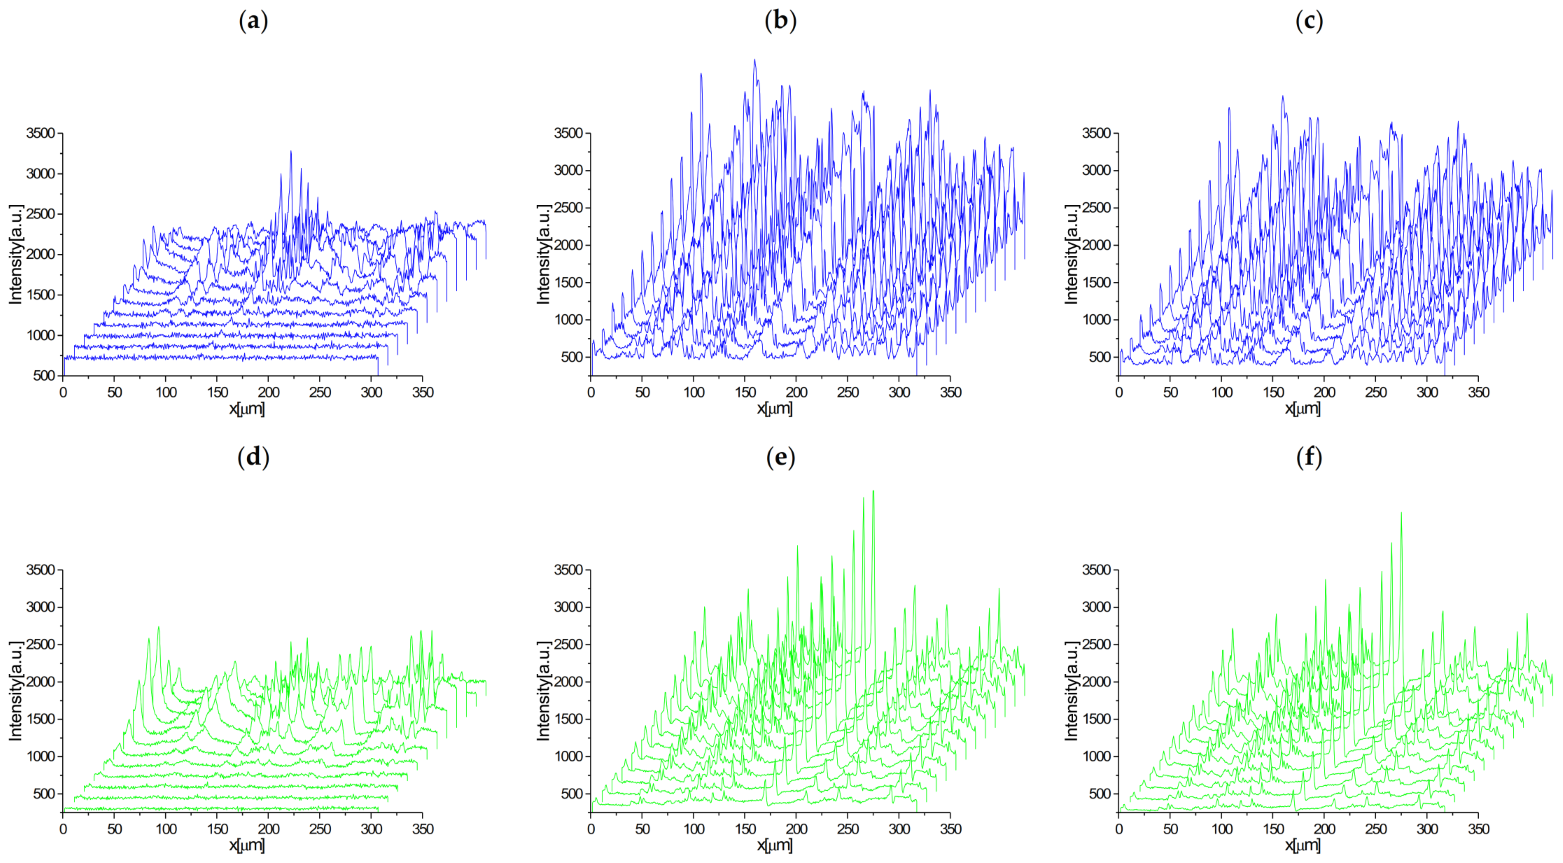
3.2. FCPM Laser Photobleaching and Color Texture Analysis

Due to the application potential of the studied materials, it is very important to stabilize the obtained system and control its homogeneity (avoiding the formation of large defects, aging of the material under the influence of temperature changes or the passage of time). Currently, the most commonly used method is polymerization. In this study, controlled laser photobleaching has been proposed as an alternative method to stabilize such a system. Due to its rich polymorphism, liquid crystal MHPOBC was chosen to check this.
To test the laser photobleaching method using a fluorescence confocal polarizing microscope, a liquid crystal (here MHPOBC) is traditionally decorated with a fluorescent dye (here DANS). Figure 3 presents the temperature dependence of light intensity obtained from two-dimensional texture color analysis for gray scale. Textures of the MHPOBC + 0.1 wt.% DANS mixture were registered during cooling. The sample was then subjected to laser photobleaching, and the texture registration and color analysis procedure was repeated. Based on the presented results, we can conclude that laser photobleaching (applied at the maximum power of available lasers) did not cause destruction of the studied material; however, it reduced the intensity of the transmitted light. No shift in the temperature of the phase transitions was noticed. In addition, one can see the anchoring of defects in the textures. The heating and cooling did not change the ordering of the sample, and the textures before and after photobleaching are the same.
Figure 4 shows three-dimensional images obtained using FCPM for blue and green light detection lengths (registered in the SmC*A phase at 100 °C in the spectral ranges 490–590 nm and 430–455 nm). Fluorescence was observed in both wavelength ranges, whereas light detection intensity in the 490–590 nm range is significantly higher, in line with the spectral range of the DANS dye. Furthermore, a reduction in the intensity of the light reflected from the sample after the laser photobleaching procedure is visible, but no change in the ordering or destruction of the material was observed. Due to the invasive nature of controlled laser photobleaching, the process is irreversible. However, the controlled reduction of the intensity of the transmitted light while maintaining the order of the molecules may be interesting from application point of view.

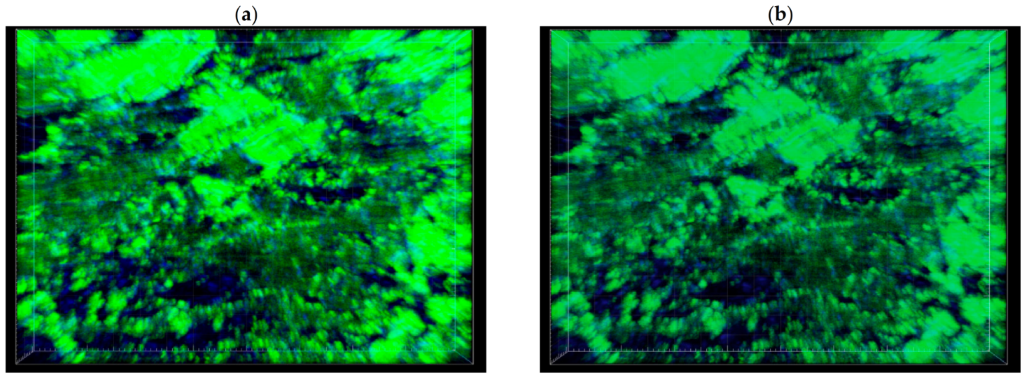
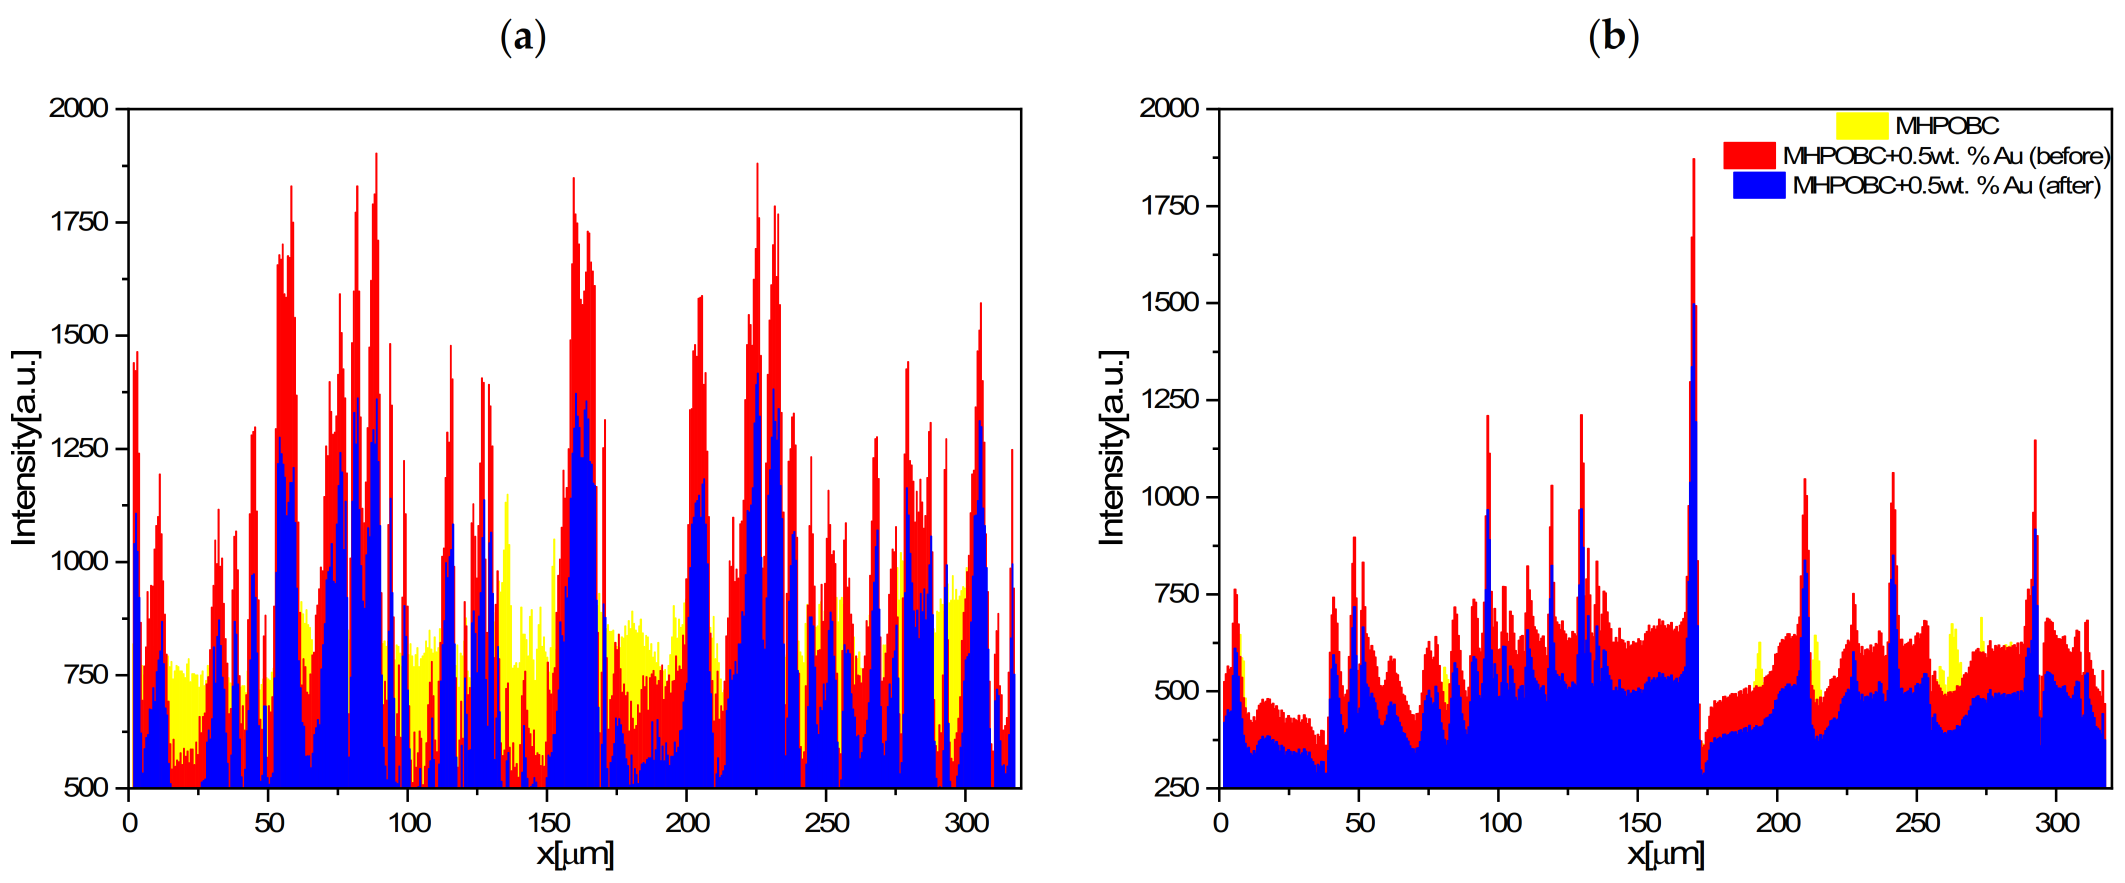
3.3. FCPM Laser Photobleaching and Au Nanoparticles

Recently, we have confirmed that MHPOBC exhibits fluorescence in both of the mentioned wavelength ranges [54]. An example of the fluorescence image of a pure MHPOBC at room temperature is shown in Figure 5. This is a single slice obtained from the simultaneously detection of fluorescence signal for green and blue light. Fluorescence is visible despite the absence of a “guest” fluorescent dye.
It is known that tiny clusters of gold or silver show the property of fluorescence due to discretization in band gap structure. It is necessary to control the size of the nanoparticles. It turns out that the optical properties are dependent on the interplay of the collective oscillation (plasmon) and quantize absorbance of incident light [41,52]. Fluorescence of pure Au nanoparticles is visible in the green range (490–590 nm), whereas it is not observed in the blue range (430–455 nm). Gold nanoparticles of adequate size can behave similarly to fluorescent dyes but significantly affect the properties of the composite.
In addition, it was noted that perturbations introduced into the system (temperature change and external electric or magnetic field) contribute to the aggregation of nanoparticles and the formation of clusters. Re-separation of nanoparticles that have formed aggregates is highly complicated. Nanoparticles usually decorate the boundaries of defects, so it seems very likely that the laser photobleaching procedure could also act here to anchor the gold nanoparticles, preventing them from aggregating over a longer period of time than without photobleaching. At the moment, the only option available to evaluate this hypothesis appeared to be the analysis of the fluorescence intensity in the sample in hand, a composite of MHPOBC + 0.5 wt.% Au nanoparticles before and after photobleaching.
Figure 6 collects results of the fluorescence intensity depending on the horizontal dimension of the sample. The individual spectrum represents a single slice. The sum of these slices represents the ordering and homogeneity of the sample across the thickness. It is seen that the laser photobleaching procedure reduced the fluorescence intensity by about 20%, as in the case of the MHPOBC + 0.1 wt.% DANS mixture. Moreover, no change in ordering was observed in the MHPOBC + 0.5 wt.% Au nanoparticles composite. For a better illustration of the intensity changes, Figure 7 compares the fluorescence intensities of the middle section of the sample in the spectral ranges 490–590 nm (green) and 430–455 nm (blue). Due to the ultra-high laser power required to produce the effect, we could not currently perform a full analysis as a function of temperature.
As mentioned at the beginning, we started our research with the hypothesis that it is possible to stabilize the liquid crystal system (with specific viscoelastic properties) by laser photobleaching. We decided to check whether it is possible to isolate a homogeneous region in which molecules will be anchored in a specific way and whether it is possible to “freeze” the properties of the studied material and extend the temperature range of a given liquid crystalline phase. However, the obtained results showed that the method of laser photobleaching using a confocal fluorescence-polarizing microscope does not cause bleaching of a specific area of the sample and does not extend the temperature range of a specific phase. Texture analysis showed that there is a decrease in the intensity of the light passing through the sample after the laser photobleaching treatment, but the properties of the material do not change, even after successive heating and cooling cycles. This means that the applied method does not affect the viscoelastic properties of the studied material, and there are no changes in the structure. No changes in the texture of a given phase means the stability of such parameters as linear proportionality factor, helix pitch, tilt angle or spontaneous polarization. In turn, such behavior of the material after the laser photobleaching treatment proves the long-term stabilization of the entire system. Therefore, the laser photobleaching method can be used to stabilize metastable systems showing undesirable aging effects or systems with emerging defects (e.g., systems with nanoparticles). However, it should be noted here that this method currently (in terms of its requirements) does not appear to be competitive with polymerization. However, space is opening for the search for cheaper, commercial methods of laser photobleaching in order to revise and use the proposed method of stabilizing the liquid crystal material.

4. Conclusions

The aim of this study was to verify the effectiveness of the proposed laser photobleaching method and its effect on the basic properties of the liquid crystal system in the ferroelectric SmC* and antiferroelectric SmC*A phases. For this purpose, two mixtures based on commercially available liquid crystal MHPOBC doped with a 0.1 wt.% fluorescent dye DANS and 0.5 wt.% gold nanoparticles were prepared and studied by electro-optic and fluorescence confocal polarizing microscope methods. A well-known MHPOBC liquid crystal exhibits ferroelectric and antiferroelectric properties. The selection of the admixture and its concentration was determined by the “guest–host” principle. The dye particles have a shape similar to the shape of liquid crystal molecules, and the size of the gold nanoparticles is comparable to the length of the LC molecule. Both the amount of dye and nanoparticles did not change the structure of the LC matrix.
It is known that the number, nature and order of the phase transition determine the viscoelastic properties of the liquid crystalline phase. Based on the results obtained, it was shown that the laser photobleaching method (also known as photo-burning) affects the intensity of light passing through the LC material but does not change its structure or ordering. Although laser photobleaching was performed for the maximum power of the available lasers, no photochemical destruction effect was observed. In summary, laser photobleaching of the LC material results in long-term stabilization of the entire system, and this method can be used to stabilize metastable liquid crystalline systems.
The results of this study extend the state of the art for the applications of fluorescence confocal polarizing microscopy and the optical properties of the liquid crystalline materials. Stabilization of the system and control of the gray scale level of the sample obtained by using laser photobleaching may result in new solutions in the field of optoelectronics, addressing and data reading.

Author Contributions

Conceptualization, D.D.; methodology, D.D.; validation, D.D. and M.M.; formal analysis, D.D.; investigation, D.D., Z.N., T.Y. and S.L.; resources, D.D. and M.M.; writing—original draft preparation, D.D.; writing—review and editing, S.L. and M.M.; visualization, D.D. and S.L.; supervision, M.M.; project administration, D.D.; funding acquisition, D.D. All authors have read and agreed to the published version of the manuscript.

Funding

The work was supported by the Polish National Science Center, Project No. 2019/03/X/ST3/01516.

Acknowledgments

D.D. would like to thank Sławomir Pieprzyk for providing the author’s program for the numerical analysis of two-dimensional textures.

Conflicts of Interest

The authors declare no conflict of interest.

References

  1. Reinitzer, F. Contributions to the knowledge of cholesterol. Liq. Cryst. 1989, 5, 7–18. [Google Scholar] [CrossRef]
  2. Shen, Y.; Dierking, I. Perspectives in Liquid-Crystal-Aided Nanotechnology and Nanoscience. Appl. Sci. 2019, 9, 2512. [Google Scholar] [CrossRef] [Green Version]
  3. Adamczyk, A. Niezwykły Stan Materii–Ciekłe Kryształy; Wiedza Powszechna: Warszawa, Poland, 1981. [Google Scholar]
  4. Żmija, J.; Zieliński, J.; Parka, J.; Nowinowski-Kruszelnicki, E. Displeje Ciekłokrystaliczne; Wydawnictwa Naukowe PWN: Warszawa, Poland, 1993. [Google Scholar]
  5. Hamley, I.W. Liquid crystal phase formation by biopolymers. Soft Matter 2010, 6, 1863–1871. [Google Scholar] [CrossRef]
  6. Lagerwall, J.P.F.; Scalia, G. A new era for liquid crystal research: Applications of liquid crystals in soft matter nano-, bio- and microtechnology. Curr. Appl. Phys. 2012, 12, 1387–1412. [Google Scholar] [CrossRef]
  7. Rešetič, A.; Milavec, J.; Domenici, V.; Zupančič, B.; Bubnov, A.; Zalar, B. Deuteron NMR investigation on orientational order parameter in polymer dispersed liquid crystal elastomers. Phys. Chem. Chem. Phys. 2020, 22, 23064–23072. [Google Scholar] [CrossRef]
  8. Tschierske, C. Liquid Crystals: Materials Design and Self-Assembly; Springer Science & Business Media: Berlin/Heidelberg, Germany, 2012; p. 318. [Google Scholar]
  9. Kato, T.; Mizoshita, N.; Kishimoto, K. Functional liquid-crystalline assemblies: Self-organized soft materials. Angew. Chem. Int. Ed. 2005, 45, 38–68. [Google Scholar] [CrossRef]
  10. Bisoyi, H.K.; Kumar, S. Liquid-crystal nanoscience: An emerging avenue of soft self-assembly. Chem. Soc. Rev. 2011, 40, 306–319. [Google Scholar] [CrossRef]
  11. Lagerwall, S.T. Chirality, Symmetry and Physical Effects. In Chiral Liquid Crystals; Kuczyński, W., Ed.; IFM PAN: Poznań, Poland, 2005; pp. 185–222. [Google Scholar]
  12. Meyer, R.B.; Liebert, L.; Strzelecki, L.; Keller, P. Ferroelectric liquid crystals. J. Phys. Lett. 1975, 36, 69–71. [Google Scholar] [CrossRef]
  13. Kuczyński, W.; Dardas, D.; Hoffmann, J.; Nowicka, K.; Jeżewski, W. Comparison of methods for determination of viscoelastic properties in chiral smectics C*. Phase Trans. 2012, 85, 358–363. [Google Scholar] [CrossRef]
  14. Malik, P.; Raina, K.K.; Bubnov, A.; Chaudhary, A.; Singh, R. Electrooptic switching and dielectric spectroscopy studies of ferroelectric liquid crystals with low and high spontaneous polarization. Thin Solid Films 2010, 519, 1052–1055. [Google Scholar] [CrossRef]
  15. Bone, M.F.; Coates, D.; Davey, A.B. Spontaneous polarization measurements on Ce3 and Ce8, two commercially available ferroelectric liquid crystals. Mol. Cryst. Liq. Crys. 1984, 102, 331–338. [Google Scholar] [CrossRef]
  16. Piecek, W.; Kula, P.; Raszewski, Z.; Perkowski, P.; Morawiak, P.; Kędzierski, J.; Dąbrowski, R.; Sun, X. An Influence of a Single Fluorine Atom Position in the Molecular Rigid Core on Physical Properties of Orthoconic Antiferroelectric Liquid Crystal. Ferroelectrics 2008, 365, 78–87. [Google Scholar] [CrossRef]
  17. Longa, L.; Trebin, H.R. Spontaneous polarization in chiral biaxial liquid crystals. Phys. Rev. A 1990, 42, 3453–3469. [Google Scholar] [CrossRef] [Green Version]
  18. Chandani, A.D.L.; Ouchi, Y.; Takezoe, H.; Fukuda, A.; Terashima, K.; Furukawa, K.; Kishi, A. Novel Phases Exhibiting Tristable Switching. Jpn. J. Appl. Phys. 1989, 28, L1261–L1264. [Google Scholar] [CrossRef]
  19. Czerwiński, M.; Tykarska, M. Helix parameters in bi- and multicomponent mixtures composed of orthoconic antiferroelectric liquid crystals with three ring molecular core. Liq. Cryst. 2014, 41, 850–860. [Google Scholar] [CrossRef]
  20. Parodi, O. Stress tensor for a nematic liquid crystal. J. Phys. 1970, 31, 581–584. [Google Scholar] [CrossRef]
  21. Gähwiller, C. Direct determination of the five independent viscosity coefficients of nematic liquid crystals. Mol. Cryst. Liq. Cryst. 1973, 20, 301–318. [Google Scholar] [CrossRef]
  22. Stannarius, R. Elastic Properties of Nematic Liquid Crystals; WILEY-VCH Verlag GmbH: Weinheim, Germany, 1998. [Google Scholar] [CrossRef]
  23. Kuczyński, W. Determination of elasticity and viscosity coefficients in a ferroelectric smectic c liquid crystal. Ber. Bunsenges. Phys. Chem. 1981, 85, 234–237. [Google Scholar] [CrossRef]
  24. Gouda, F.; Skarp, K.; Andersson, G.; Kresse, H.; Lagerwall, S.T. Viscoelastic Properties of the Smectic A* and C* Phases Studied by a New Dielectric Method. Jpn. Soc. Appl. Phys. 1989, 28, 1887–1892. [Google Scholar] [CrossRef]
  25. Kuczyński, W.; Dardas, D.; Nowicka, K. Determination of the bulk rotational viscosity coefficient in a chiral smectic C* liquid crystal. Phase Trans. 2009, 82, 444–451. [Google Scholar] [CrossRef]
  26. Lalik, S.; Deptuch, A.; Fryń, P.; Jaworska–Gołąb, T.; Dardas, D.; Pociecha, D.; Urbańska, M.; Tykarska, M.; Marzec, M. Systematic study of the chiral smectic phases of a fluorinated compound. Liq. Cryst. 2019, 46, 2256–2268. [Google Scholar] [CrossRef]
  27. Takezoe, H.; Kondo, K.; Miyasato, K.; Abe, S.; Tsuchiya, T.; Fukuda, A.; Kuze, E. On the methods of determining material constants in ferroelectric smectic C* liquid crystals. Ferroelectrics 1984, 58, 55–70. [Google Scholar] [CrossRef]
  28. Marzec, M.; Fryń, P.; Tykarska, M. New antiferroelectric compound studied by complementary methods. Phase Trans. 2014, 87, 1011–1017. [Google Scholar] [CrossRef]
  29. Wojciechowski, M.; Tykarska, M.; Bąk, G.W. Dielectric properties of ferrielectric subphase of liquid crystal MHPOPB. Scient. Bull. Phys. Tech. Univ. Łódź. 2013, 34, 57–64. [Google Scholar]
  30. Dardas, D.; Kuczyński, W.; Hoffmann, J.; Jeżewski, W.; Nowicka, K.; Małecki, J. Non-linear electrooptic effect in antiferroelectric liquid crystal. Opto-Electron. Rev. 2010, 17, 25–29. [Google Scholar] [CrossRef]
  31. Dardas, D.; Kuczyński, W.; Hoffmann, J.; Jeżewski, W. Determination of twist elastic constant in antiferroelectric liquid crystals. Meas. Sci. Technol. 2011, 22, 85707. [Google Scholar] [CrossRef]
  32. Dardas, D. Electro-optic and viscoelastic properties of a ferroelectric liquid crystalline binary mixture. Phase Trans. 2016, 89, 368–375. [Google Scholar] [CrossRef]
  33. Dardas, D. Tuning the electro-optic and viscoelastic properties of ferroelectric liquid crystalline materials. Rheol. Acta 2019, 58, 193–201. [Google Scholar] [CrossRef]
  34. Lagerwall, J.P.F.; Giesselmann, F. The experimental study of phases and phase transitions in antiferroelectric liquid crystals. Chiral Liq. Cryst. 2015, 2005, 147–184. [Google Scholar]
  35. Mikułko, A.; Marzec, M.; Wróbel, S.; Dąbrowski, R. Detection of alpha sub-phase between para- and ferroelectric phase of a fluorinated compound. Ferroelectrics 2005, 313, 105–112. [Google Scholar] [CrossRef]
  36. Salamończyk, M.; Kovarova, A.; Svoboda, J.; Pociecha, D.; Górecka, E. Switchable fluorescent liquid crystals. Appl. Phys. Lett. 2009, 95, 171901. [Google Scholar] [CrossRef]
  37. Škarabot, M.; Čepič, M.; Žekš, B.; Blinc, R.; Heppke, G.; Kityk, A.V.; Muševič, I. Birefringence and tilt angle in the antiferroelectric, ferroelectric, and intermediate phases of chiral smectic liquid crystals. Phys. Rev. E 1998, 58, 575. [Google Scholar] [CrossRef] [Green Version]
  38. Kuczyński, W. Behavior of the helix in some chiral smectic- C- liquid crystals. Phys. Rev. E. 2010, 81, 1–6. [Google Scholar] [CrossRef]
  39. Dardas, D.; Kuczyński, W.; Hoffmann, J. Measurements of absolute values of electrooptic coefficients in a ferroelectric liquid crystal. Phase Trans. 2006, 79, 213–222. [Google Scholar] [CrossRef]
  40. Kuczyński, W.; Goc, F.; Dardas, D.; Dąbrowski, R.; Hoffmann, J.; Stryła, B.; Małecki, J. Phase transitions in a liquid crystal with long-range dipole order. Ferroelectrics 2002, 274, 83–100. [Google Scholar] [CrossRef]
  41. Adamow, A.; Sznitko, L.; Chrzumnicka, E.; Stachera, J.; Szukalski, A.; Martyński, T.; Myśliwiec, J. The ultra-photostable and electrically modulated Stimulated Emission in perylene-based dye doped liquid crystal. Sci. Rep. 2019, 9, 2143. [Google Scholar] [CrossRef] [Green Version]
  42. Lalik, S.; Stefańczyk, O.; Dardas, D.; Górska, N.; Ohkoshi, S.-I.; Marzec, M. Modifications of FLC Physical Properties through Doping with Fe2O3 Nanoparticles (Part I). Materials 2021, 14, 4722. [Google Scholar] [CrossRef]
  43. Pawlak, M.; Bagiński, M.; Llombart, P.; Beutel, D.; González-Rubio, G.; Górecka, E.; Rockstuhl, C.; Mieczkowski, J.; Pociecha, D.; Lewadowski, W. Tuneable helices of plasmonic nanoparticles using liquid crystal templates: Molecular dynamics investigation of an unusual odd–even effect in liquid crystalline dimers. Chem. Commun. 2022, 58, 7364–7367. [Google Scholar] [CrossRef]
  44. Labeeb, A.; Gleeson, H.F.; Hegmann, T. Polymer stabilization of the smectic C-alpha∗ liquid crystal phase—Over tenfold thermal stabilization by confining networks of photo-polymerized reactive mesogens. Appl. Phys. Lett. 2015, 107, 232903. [Google Scholar] [CrossRef]
  45. Hegmann, T.; Qi, H.; Marx, V.M. Nanoparticles in liquid crystals: Synthesis, self-assembly, defect formation and potential applications. J. Inorg. Organomet Polym. Mater. 2007, 17, 483–508. [Google Scholar] [CrossRef]
  46. Yoshida, H.; Tanaka, Y.; Kawamoto, K.; Kubo, H.; Tsuda, T.; Fujii, A.; Kuwabata, S.; Kikuchi, H.; Ozaki, M. Nanoparticle-stabilized cholesteric blue phases. Appl. Phys. Express 2009, 2, 121501. [Google Scholar] [CrossRef]
  47. Yevchenko, T.; Dardas, D.; Kuczyński, W.; Brańka, A.C. Determining the Kerr constant in optically isotropic liquid crystals. Phys. Rev. E 2022, 206, 14701. [Google Scholar] [CrossRef] [PubMed]
  48. Knapkiewicz, M.; Rachocki, A.; Bielejewski, M.; Sebastião, P.J. NMR studies of molecular ordering and molecular dynamics in a chiral liquid crystal with the SmCα* phase. Phys. Rev. E 2020, 101, 52708. [Google Scholar] [CrossRef] [PubMed]
  49. Otón, E.; Yoshida, H.; Morawiak, P.; Strzeżysz, O.; Kula, P.; Ozaki, M.; Piecek, W. Orientation control of ideal blue phase photonic crystals. Sci. Rep. 2020, 10, 10148. [Google Scholar] [CrossRef] [PubMed]
  50. Bubnov, A.; Bobrovsky, A.; Rychetský, I.; Fekete, L.; Hamplová, V. Self-Assembling Behavior of Smart Nanocomposite System: Ferroelectric Liquid Crystal Confined by Stretched Porous Polyethylene Film. Nanomaterials 2020, 10, 1498. [Google Scholar] [CrossRef]
  51. Diaspro, A.; Chirico, G.; Usai, C.; Ramoino, P.; Dobrucki, J. Photobleaching. In Handbook of Biological Confocal Microscopy; Springer: Boston, MA, USA, 2006. [Google Scholar]
  52. Lalik, S.; Stefańczyk, O.; Dardas, D.; Deptuch, A.; Yevchenko, T.; Ohkoshi, S.-I.; Marzec, M. Nanocomposites Based on Antiferroelectric Liquid Crystal (S)-MHPOBC Doping with Au Nanoparticles. Molecules 2022, 27, 3663. [Google Scholar] [CrossRef]
  53. Pieprzyk, S.; Yevchenko, T.; Dardas, D.; Brańka, A.C. Phase transitions and physical properties by a color texture analysis: Results for liquid crystals. J. Mol. Liq. 2022, 362, 119699. [Google Scholar] [CrossRef]
  54. Smalyukh, I.I.; Shiyanovskii, S.V.; Lavrentovich, O.D. Three-dimensional imaging of orientational order by fluorescence confocal polarizing microscopy. Chem. Phys. Lett. 2001, 336, 88–96. [Google Scholar] [CrossRef]
  55. Nowicka, K.; Bielejewska, N.; Kuczyński, W.; Knapkiewicz, M.; Hoffmann, J. Exploration of liquid crystal structures using fluorescent confocal polarizing microscopy. Phase Trans. 2014, 87, 1073–1079. [Google Scholar] [CrossRef]
  56. Klyukin, D.; Silvennoinen, M.; Krykova, V.; Svirko, Y.; Sidorov, A.; Nikonorov, N. Fluorescent clusters in chloride photo-thermo-refractive glass by femtosecond laser bleaching of Ag nanoparticles. Opt. Express 2017, 25, 12944–12951. [Google Scholar] [CrossRef]
Figure 1. Chemical structure of (S)-MHPOBC (a), Au NPs functionalized with 1-octhanethiol (b) and dye DANS (c).
Crystals 13 00164 g001
Figure 2. The elastic constant K versus temperature for three different materials in the low electric field range: (a) D-12, (b) MHPOBC and (c) Ce-3 showing different dependencies of the elastic constant depending on the type of adjacent phases. To illustrate the difference of the pitch behavior, schematic cartoons for one period of pitch for compounds are shown.
Crystals 13 00164 g002
Figure 3. Temperature dependence of the intensity of gray scale obtained by color texture analysis (CTA) before and after photobleaching procedure. Textures of the SmC*A phase registered during cooling with rate 1 °C/min in MHPOBC + 0.1wt.%DANS, cross polarizers, 100 °C.
Crystals 13 00164 g003
Figure 4. Fluorescent image obtained by FCPM before (a) and after (b) photobleaching procedure. Pictures show MHPOBC + 0.1wt.%DANS in the antiferroelectric SmC*A phase, 100 °C.
Crystals 13 00164 g004
Figure 5. FCPM image for pure MHPOBC material in the mid-thickness of the sample at room temperature.
Crystals 13 00164 g005
Figure 6. Fluorescence intensity versus horizontal dimension of the samples: pure MHPOBC liquid crystal (a,d), MHPOBC doping with 0.5 wt.% Au NPs before (b,e) and after (c,f) photobleaching procedure for detection in the blue and green light wavelength ranges, respectively. The third dimension represents successive scans taken as a function of cell thickness.
Crystals 13 00164 g006
Figure 7. Fluorescence intensity versus horizontal dimension of pristine MHPOBC and MHPOBC doping with 0.5 wt.% Au NPs before and after photobleaching procedure, for detection in the blue (a) and green (b) light wavelength.
Crystals 13 00164 g007
Disclaimer/Publisher’s Note: The statements, opinions and data contained in all publications are solely those of the individual author(s) and contributor(s) and not of MDPI and/or the editor(s). MDPI and/or the editor(s) disclaim responsibility for any injury to people or property resulting from any ideas, methods, instructions or products referred to in the content.

