Article

Effect of Electrical Resistance Heating on Recrystallization of Cold-Rolled Low-Carbon Steel

1
Center for Advanced Vehicular Systems, Mississippi State University, Mississippi State, MS 39762, USA
2
Department of Mechanical Engineering, Mississippi State University, Mississippi State, MS 39762, USA
*
Author to whom correspondence should be addressed.
Crystals 2023, 13(12), 1650; https://doi.org/10.3390/cryst13121650
Submission received: 31 October 2023 / Revised: 21 November 2023 / Accepted: 23 November 2023 / Published: 30 November 2023
(This article belongs to the Special Issue Microstructure and Properties of Steels and Other Structural Alloys)

Abstract

:
The “electron wind effect” has long been cited as a potential catalyst of solid-state transformations in metals, particularly when high current densities are involved. However, the literature exploring similar effects at lower current densities, such as those occurring during Gleeble thermomechanical simulation, remains scarce. The present work compares recrystallization activity in cold-rolled low-carbon steel during heat treatment by conventional furnace versus direct resistance heating (Gleeble). Multiple levels of cold work, annealing durations, and soak temperatures were examined, allowing for an in-depth comparison of recrystallization rates and activation energies between samples subjected to identical time–temperature profiles in the furnace and Gleeble. In addition to the expected increase in recrystallization behavior with the increases in temperature and cold-reduction levels, the use of the Gleeble system as the heating method resulted in faster initial microstructural transformation than a conventional furnace. The variability in recrystallized fractions persisted until the microstructures had saturated to their nearly fully recrystallized levels, at which point the microhardness and electron backscatter diffraction (EBSD) revealed convergence to equivalent behavior irrespective of the heating method. Analysis of the recrystallization kinetics by fitting to a JMAK relationship reflected the increased transformation activity during Gleeble treatment, with the value of the kinetic exponent also indicating greater grain growth activity at higher temperature.

1. Introduction

With the rise in the prevalence of microstructure-based material design, the use of laboratory simulation in material development has become increasingly important. Physical simulation, defined as a precise laboratory-scale replication of full-scale thermal and mechanical processes, allows for isolation and the study of the effects of individual process parameters on material structure and properties [1]. Thermomechanical simulators, such as the Gleeble, provide precise control over process variables such as temperature, the heating/cooling rate, applied stress/strain, the deformation rate, and atmosphere. The primary difference between these simulators and conventional thermal processing arises in the use of direct resistance heating, in which an electric current is passed through the sample to heat it. A key question in the evaluation of the simulated microstructures becomes whether this current intrinsically affects the microstructure during heat treatment.

1.1. Electric Current Effects on Plastic Flow and Solid-State Transformations

The interaction between moving electrons (i.e., an electric current) and dislocations, termed the “electron wind effect”, was first reported by Troitskii and Likhtman in a 1963 study on irradiated zinc single crystals [2]. Plasticity of a crystal under stress was found to vary based on its orientation relative to an electron beam: the extent of plastic deformation increased when the beam was directed along the primary slip plane and decreased when the beam was directed transverse to the plane [2,3]. Similar results were observed in cadmium, tin, lead, indium, titanium, and iron, lending support to the hypothesis that electrons were assisting dislocation movement in the direction of current flow [2,3,4]. Expanding on this initial discovery, Sprecher et al. published a detailed investigation of electric current effects in various polycrystalline materials [3]. As in the prior studies, the application of a high-density current pulse led to a drop in flow stress during plastic deformation. Through meticulous experimentation, the current effects on plastic flow were separated from accompanying thermal effects and from any inertial effects in the test apparatus, effectively demonstrating current interaction with dislocations. This interaction was attributed in part to a force on the dislocations from the momentum of the drifting electrons.
Advancements in microstructure analysis techniques have revealed electric current effects on numerous material characteristics beyond flow stress. Specifically, the kinetics of solid-state transformations in metals have been shown to be altered via high-density electric currents (~103–105 A/cm2) [5,6,7,8,9]. Conrad [10] highlights several studies on intermetallic compound formation, precipitation, crystallization, and recrystallization, noting the influence of high-density current pulses on the rate and the extent of these diffusion-driven processes. In all cases, the current effects were especially pronounced in the initial stages of transformation, indicating a common effect on nucleation kinetics.
In various metals where recrystallization was accelerated by the current pulses, the extent of subsequent grain growth was also found to decrease [10]. Transmission electron microscopy (TEM) studies revealed significantly lower dislocation density in a sample recrystallized in the presence of an electric current versus in a sample annealed conventionally. The lower dislocation density after pulsing corresponds to a lower driving force for grain growth, leading to a smaller final grain size. These observations lend support to the theory that an electric current interacts with dislocations in a material, specifically that dislocation mobility is enhanced by such interaction [10,11].
While the present work aims to observe the effects of Gleeble heat treatment, which conventionally utilizes an alternating current within a conductive sample as the heating method, there exist studies examining the effects of other heating methods such as induction [12], as well as other heating devices such as dilatometers [13,14,15], on the evolution of recrystallization within a variety of metallic materials.

1.2. Gleeble vs. Conventional Heating Studies

Temperature control in a Gleeble thermomechanical simulator is typically accomplished using direct resistance heating, in which the resistance of the specimen of interest causes it to heat when a current is passed through it. In contrast to the pulsed currents previously discussed, applied current densities are relatively low (~101–103 A/cm2 instead of ~103–105 A/cm2) and current flow through the sample is continuous. Recent studies have begun to focus on whether, and how, recrystallization is affected in such conditions.

1.2.1. 316 Stainless Steel

In a 2010 study by Krawczynska et al. [16], a Gleeble 3800 thermomechanical simulator (Dynamic Systems Inc., Poestenkill, NY, USA) was used to anneal hydrostatically extruded 316 stainless steel. The microhardness of the Gleeble-annealed samples decreased with annealing time while the microhardness of the furnace-annealed samples changed very little during the heat treatment. After Gleeble annealing, the steel exhibited a bimodal grain size distribution, with larger grains (equivalent diameter of ~230 nm) dispersed within a matrix of fine, elongated grains. The average grain size remained ~130 nm for all annealing times. The furnace-annealed grain sizes were relatively homogeneous and the grains coarsened with the increasing annealing time over the range of times studied. A difference in the carbide precipitation structure was also observed between the furnace- and Gleeble-annealed samples. Carbides were elongated and located primarily at the grain boundaries in the furnace-annealed samples. The Gleeble samples contained grain boundary carbides and also had equiaxed carbides that were more randomly dispersed. The authors attribute these observations and the difference in recrystallization behavior to enhanced vacancy mobility and diffusion processes in the presence of a current.
The initial heating of the Gleeble- and furnace-annealed samples in this study should be noted, given that the annealing times were measured from before heating began. The furnace-annealed samples were placed into a preheated furnace and allowed to come to temperature, while the Gleeble-annealed samples were heated at 50 °C/s to the annealing temperature (700 °C). Thus, the Gleeble samples reached the annealing temperature more rapidly than the furnace samples, which could contribute to the discrepancies observed at shorter annealing times.

1.2.2. Copper

A second study comparing conventional heating and direct resistance heating focuses on the recovery and recrystallization behavior of copper [17]. Samples from an extruded copper rod were subjected to salt bath heat treatments and to annealing via direct resistance heating in a spark plasma sintering (SPS) machine. EBSD was used to compare the resulting grain structures and assess the extent of recrystallization for each type of annealing. In all salt bath treatments, only recovery was observed. Dislocation density as measured by the average in-grain orientation decreased slightly, but the original grain structure was unchanged. The observed texture was the same as in the deformed, unannealed copper. However, the SPS-treated samples showed refined grain sizes and lower in-grain misorientations as well as texture randomization, indicating that extensive recrystallization had occurred. An increased vacancy concentration, which is important for dislocation climb, was cited as the mechanism for the enhanced recovery and recrystallization in the SPS-annealed sample.
Similarly to the 316 stainless steel study, the initial heating of the copper was not necessarily consistent between the two annealing methods. Additionally, a stress of ~40 MPa was applied to the samples in the SPS machine to ensure good contact for the current flow. The sample annealed for the longest duration gradually deformed during the heat treatment; this deformation was attributed to a drop in yield stress due to the recrystallization that occurred. It would be beneficial to remove the stress from the sample to ensure that the microstructural changes caused the deformation and were not brought about by it.

1.2.3. Aluminum

Huang et al. [18] contributed a study on direct resistance heating effects on recrystallization in aluminum. The effects of the cold reduction level as well as sample orientation with respect to the current flow were investigated. The samples were annealed in a furnace and in a Gleeble 3800 thermomechanical simulator, of which the heating profile from the furnace was recorded and input into the Gleeble to ensure the heat treatments were identical. EBSD was used to compare the extent of recrystallization between the two heating methods.
In the samples with greater prior cold reduction, a pronounced acceleration of recrystallization was observed after Gleeble annealing as compared to furnace annealing. The effect of the current on the samples with less prior cold reduction was not as strong, which was attributed to the difference in subgrain structure (i.e., lower proportion of high-angle grain boundaries). High-angle boundaries, which have greater mobility than the low-angle boundaries, are more susceptible to the electron wind effect. A similar trend in electric current–grain substructure interactions was noted in the differing sample orientations: the apparent ‘electron wind effect’ was stronger when the current flowed along the rolling direction than along the transverse direction, which was again attributed to an increased density of high-angle grain boundaries along the rolling direction.

1.2.4. Inconel 718

One of the most recent studies on conventional vs. direct resistance heating was a thorough investigation on the effects of current flow on static and dynamic recrystallization in Inconel 718 [19]. During furnace annealing, the specimen temperature was recorded and the time–temperature profile was input into the Gleeble for simulation, ensuring exact correspondence between the furnace and Gleeble thermal profiles. Through the use of misorientation data from EBSD, it was shown that recrystallization was significantly accelerated during Gleeble annealing of the Inconel—for instance, a comparison of the resulting microstructures revealed that more recrystallization had occurred in the Gleeble-annealed sample upon reaching the soak temperature than had occurred in the furnace-annealed sample after holding at the soak temperature for 60 s. Additionally, the recrystallized grain size was found to be smaller in the Gleeble-annealed samples than in the furnace-annealed samples, indicating that the direct resistance heating accelerated the nucleation of recrystallized grains.
In addition to the recrystallization comparisons, several checks were performed to ensure the conclusions regarding current effects were valid. It was confirmed experimentally and mathematically that variables such as the starting microstructure and radial thermal gradients in the Gleeble samples did not significantly affect the final microstructures. As in previous studies, the effects of an electric current on vacancy concentration, associated atomic diffusion, and dislocation mobility are suggested as mechanisms for the accelerated recrystallization.

1.3. Objective of Present Study

To expand upon previous findings [20], the present study seeks to compare recrystallization in cold-worked ferritic steels under conventional furnace heating and direct resistance heating, with a focus on the extent and kinetics of resulting recrystallization. Steel samples of varying cold reductions were heat treated identically in conventional furnaces and in a Gleeble 3500 thermomechanical simulator (Dynamic Systems Inc., Poestenkill, NY, USA). In each case, the amount of recrystallization was quantified and compared to determine the effects of an electric current on microstructural evolution.

2. Materials and Methods

To examine the effects of the heating method on the recrystallization of low-carbon steels, commercially produced hot-rolled ASTM A36 steel was chosen. The hot-rolled plates’ surface, finished to 6.35 mm in thickness, were acquired from McMaster-Carr [21], with the chemical composition provided by the manufacturer listed in Table 1.
CALPHAD calculations using Thermo-Calc 2020a (Thermo-Calc Software, Stockholm, Sweden) [22] indicated an A3 temperature of approximately 820 °C for the given composition at equilibrium. In order to achieve full normalization and provide a uniform starting point for all samples in the study, the plates were annealed at 900 °C for 2 h under constantly flowing argon prior to being furnace-cooled [23]. The steel samples were then descaled and cold rolled using a Fenn Torin [24] reversible rolling mill in a 4-high configuration. Three cold reduction amounts (45%, 60%, and 75%) were chosen, with the rolling schedules listed in Table 2.
To produce individual samples out of each rolled plate, 9 mm wide strips were cut using a waterjet cutter, with a schematic of the nominal sample dimensions depicted in Figure 1a. Waterjet cutting was the preferred method of sample extraction due to the absence of any heating effects that may potentially alter the microstructures being analyzed.
The 80 mm length along TD was chosen for compatibility with the stainless steel wedge grips in a Gleeble 3500 thermomechanical simulator [1]. This length allowed for adequate contact on both gripped ends while providing ample space in the center for heating, with a consistent thermal profile along the length of the sample. Two different soak temperatures were chosen at 550 °C and 600 °C, with annealing durations of 100 s, 500 s, 1000 s, 5000 s, and 10,000 s for each temperature.
Furnace heat treatments were performed first, utilizing a muffle furnace held at the target temperature under an atmosphere of constantly flowing argon. In the interest of consistency, the same sample geometry was used between the furnace and Gleeble methods, and the location within the furnace was also kept consistent for all the furnace-treated samples. K-type thermocouples were percussion welded to the center of the RD-TD face of each sample to measure and record temperature continually during heating. The beginning of the annealing duration (tsoak) was defined as the point beyond which the sample remained isothermal for 30 s, as shown in Figure 2. Once annealed for the prescribed duration, the samples were immediately water quenched.
The thermal data recorded during furnace treatment was used to generate the temperature–time profile to be followed in a Gleeble 3500 system. This approach was applied for each individual sample with the goal of ensuring that the resistive heating profile followed the furnace heating profile as closely as possible. To this end, K-type thermocouples were also attached to the Gleeble-treated samples in the same location and using the same welding method. Ushioda et al. [25] showed that the heating rate may have an effect on the recrystallization rates. To avoid any spurious effects from inconsistent heating rates between methods, the heating portion of each furnace sample’s history was fitted using a sixth-order polynomial, which was then used to define the target heating path to be followed by the corresponding Gleeble sample. For samples of all thicknesses and annealing durations, the fitting polynomials captured the measured furnace heating profile very closely, with R2 values of 0.99 or higher. At the end of the specified annealing duration, the Gleeble-treated samples were also water quenched to halt any further changes in the microstructure. Figure 3 depicts the test setup used for Gleeble heat treatments.
Following heat treatment, the samples were sectioned, mounted, and polished in the RD-ND plane, with the final polishing step utilizing 0.04 μm colloidal silica. For both furnace-treated and Gleeble-treated cases, the samples were carefully prepared such that the polished plane being analyzed was as coincident as possible with the plane containing the thermocouples, ensuring that the properties being probed were representative of the region where the temperature was measured. On the polished surface, microstructure characterization was focused on the centerline parallel to RD, as schematized in Figure 1b. This convention was followed for the samples produced with both heating methods to ensure consistency.
Given that the quantification of recrystallized fractions is the primary objective of the present study, microhardness testing and electron backscatter diffraction (EBSD) were chosen to serve as two well-studied independent methods of measuring recrystallization. EBSD was performed with a Zeiss Supra 40 (Carl Zeiss AG, Oberkochen, Baden-Württemberg, Germany) [26] scanning electron microscope equipped with an EDAX EBSD detector (AMATEK, Inc., Berwyn, PA, USA) [27], using an accelerating voltage of 20 kV and a working distance of 10 mm. Each EBSD scan was performed on an area spanning 150 μm × 150 μm along the centerline with RD parallel to the horizontal axis of the scan, as illustrated in Figure 4. The step size of 0.3 μm used for the scans is consistent with that used by Dziaszyk et al. [28] in their evaluation of EBSD-based methods to characterize the recrystallized fraction, albeit the present study uses a larger scanned area in order for the findings to be more representative of the overall response.
Following the EBSD scans, microhardness measurements were made using a Wilson VH3100 automatic Vickers hardness testing system (Buehler, Lake Bluff, IL, USA) [29] with an applied load of 0.5 kgf. For each sample, a 3 × 3 grid of indentations was made, with the average of all nine hardness measurements reported in Table 3. The grid was centered along the centerline of the sample parallel to RD, and adjacent indents were spaced approximately 508 μm (0.02 in.) away from each other, with the layout shown in Figure 4. This spacing far exceeds the minimum distance prescribed by ASTM E384 and E92 [30,31] to ensure that any microstructural changes brought about by indentation in one region had no effects on the response of the adjacent indents. A preliminary comparison of microhardness between heating methods revealed slightly lower values for Gleeble treatments, suggesting greater microstructural transformation for the same temperature and duration, with further analyses presented in the upcoming section.

3. Results and Discussion

The determination of recrystallized fractions via EBSD can be performed using a variety of post-analysis metrics which utilize the morphological and crystallographic changes exhibited by microstructures during recrystallization. Dziaszyk et al. compared the accuracy of these metrics and reported that grain average misorientation (GAM) was found to reliably capture recrystallized fractions, outperforming other measures such as image quality, grain orientation spread, and grain reference orientation deviation [28]. As such, GAM was chosen as the microstructure-based method for assessing recrystallized fractions, defined using the area fraction of the scan with GAM ≤ 1° as measured via TSL OIM Analysis v8 software [32]. Figure 5 illustrates the EBSD outputs using the 75% cold-reduced samples treated at 550 °C for 1000 s as an example. The full array of EBSD maps for all 60 samples within the test matrix can be found in Appendix A.
The recrystallized fraction (X) can be estimated via hardness using the following relationship [33,34]:
X = H 0 H H 0 H rx
where H0 is the as-deformed hardness (after cold rolling in this case), H is the hardness measured after annealing, and Hrx is the fully recrystallized hardness. In order to establish the value of Hrx, the cold-rolled samples at each reduction were furnace-heated at 650 °C for 30 min, 1 h, 2 h, and 4 h until the hardness values had stabilized. For any subsequent calculations, the hardness values produced by annealing at 650 °C for 4 h were chosen as the Hrx reference values.
The calculation of recrystallization fractions using Equation (1) requires hardness values from three different samples, with nine hardness measurements made for each sample. As such, the recrystallized fractions listed in Figure 6 involve the computation of all 729 possible combinations of recrystallized fractions from the hardness measurements per data point prior to determining the average and standard deviation (shown as error bars). Within the figure, the corresponding recrystallized fractions from EBSD analyses are also provided. In general, the Gleeble-treated samples experience an accelerated uptick in the recrystallized fraction for lower soak times, corresponding to the lower hardness values shown in Table 3. But, as the samples are heated for longer, they approach a level of saturation corresponding to the proliferation of recrystallized grains throughout the majority of the microstructure, impinging upon the boundaries of other nuclei and relieving the microstructure of the internal distortions inherited from cold rolling, tending to converge with the furnace-treated samples.
Note that in the case of the 550 °C samples treated for 100 s, the amount of recrystallization induced by either heating method is negligible. The shorter duration and lower temperature are not sufficient to provide the necessary driving force to initiate recrystallization. This lack of change in the microstructure is reflected in the microhardness values as well as the recrystallized fractions from EBSD. By contrast, raising the annealing temperature to 600 °C provides the necessary driving force for substantial recrystallization to occur, even at the briefest duration of 100 s. The amount of recrystallization is significant enough to reveal the differences between the two heating methods, with recrystallized fractions in the Gleeble-treated samples exceeding their furnace counterparts. A comparison between reduction levels for the same heating method showed the expected trend of increasing the initial recrystallized fractions with increased amounts of cold reduction [35]. With longer annealing durations, the recrystallized fractions converged to full saturation for both methods, with the convergence accelerated by the higher annealing temperature.
To further analyze the recrystallization kinetics and activation energies as a function of the amount of cold-rolled reduction and the heating method, the resultant recrystallized fractions from microhardness were fitted to a Johnson–Mehl–Avrami–Kolmogorov (JMAK) relationship, defined as
X = 1 e x p k t n
with X being the recrystallized fraction and t being the corresponding time (in seconds). The JMAK constants are determined using a least-squares linear fit of l n l n 1 1 X plotted against l n t . Figure 7 depicts the fitting for each of the samples, grouped by cold-rolling reduction and temperature. The resultant values of the fitting constants are listed in Table 4.
For all samples annealed at 550 °C, the kinetic exponent (n) values of 2–2.5 were within the expected range of 1–4, with 1 being the idealized case for site saturation under 1-dimensional growth, and 4 being the idealized case for 3-dimensional growth with a constant nucleation rate [36,37]. Values of n in the lower range of coefficients have been attributed to partially constrained grain growth, given the deviation from the idealized case of isotropic growth in all three dimensions after nucleation [36]. Such deviation from idealization has been documented in materials with significant cold rolling, wherein slopes were found to drop lower than 1.7, even reaching values on the order of 1 in certain cases [38,39]. Values of n significantly below 1 (as seen for the samples annealed at 600 °C) can be indicative of rapid recrystallization occurring very early into the heat treatment, to where the detectable behavior contains a more significant contribution of grain growth over time [40].
The term k is defined to be directly proportional to the product of the first power of the nucleation rate N ˙ and the third power of the growth rate G ˙ [36]
k = f N ˙   G ˙ 3 4
where f is a shape factor with value 4 3 π . For each temperature and reduction level, the higher values of k observed in the Gleeble-treated samples point towards a greater amount of transformation than in identical furnace treatments. The strong effect of growth rate on k is apparent when comparing both annealing temperatures, where the significantly higher value of k for the 600 °C further corroborates the contribution of grain growth that was suggested by the kinetic exponent n.
Using the JMAK coefficients obtained above, the activation energies for recrystallization using each of the methods is calculated by assuming an Arrhenius relationship of the form
R a t e = C e x p Q R T
where Q represents the activation energy, C is a pre-exponential factor, R is the universal gas constant, and T is the absolute temperature. The rate term is conventionally defined as the reciprocal of time required to reach 50% recrystallization (denoted as t0.5), as defined by the JMAK equation [36]. Since the Arrhenius relationship has two unknowns, the two different temperatures for each pair of reduction and heating method are used to define the two equations required to solve the system. The resultant activation energies are listed in Table 5. While the values observed are of the same order of magnitude as those reported for recrystallization in steels [41,42,43], they are somewhat higher than typical, likely a consequence of the skewed kinetic coefficient of the JMAK model at 600 °C where recrystallized fractions had rapidly approached saturation.

4. Conclusions

The brief but comprehensive study presented herein examined the evolution of recrystallization using a matrix of 60 samples involving various cold-rolling reductions, heating methods, soak temperatures, and durations. Recrystallized fractions were observed using microhardness and EBSD and compared at each reduction and soak temperature between heating methods, which included conventional (radiative) heating and direct resistance heating in a Gleeble thermomechanical simulator.
  • On aggregate, the Gleeble-treated samples showed a tendency to recrystallize more rapidly than the furnace-treated samples, especially during the initial stages of nucleation and growth. This trend was reflected in recrystallized fractions obtained via both hardness and EBSD.
  • Annealing at the higher soak temperature of 600 °C led to faster recrystallization when measured after the first soak duration of 100 s. Combined with the faster initial transformation during Gleeble treatment, the increased recrystallization activity was further amplified by increased cold reduction, with reduction levels of 45%, 60%, and 75% exhibiting respective recrystallized fractions of 29%, 46%, and 67% during furnace treatment versus 53%, 72%, and 85% during Gleeble treatment.
  • Annealing for longer durations led to a convergence of the microstructures and recrystallized fractions from both heating methods, with 550 °C treatments saturating at near-complete recrystallization after 10,000 s and the 600 °C treatments doing so by the 5000 s mark. While the behavior at convergence is equivalent between the two heating methods, the faster initial recrystallization rates in the Gleeble must be taken into consideration when upscaling the processing parameters to large-scale manufacturing using conventional heating methods, particularly when annealing heavily distorted (cold-rolled) microstructures for short durations.
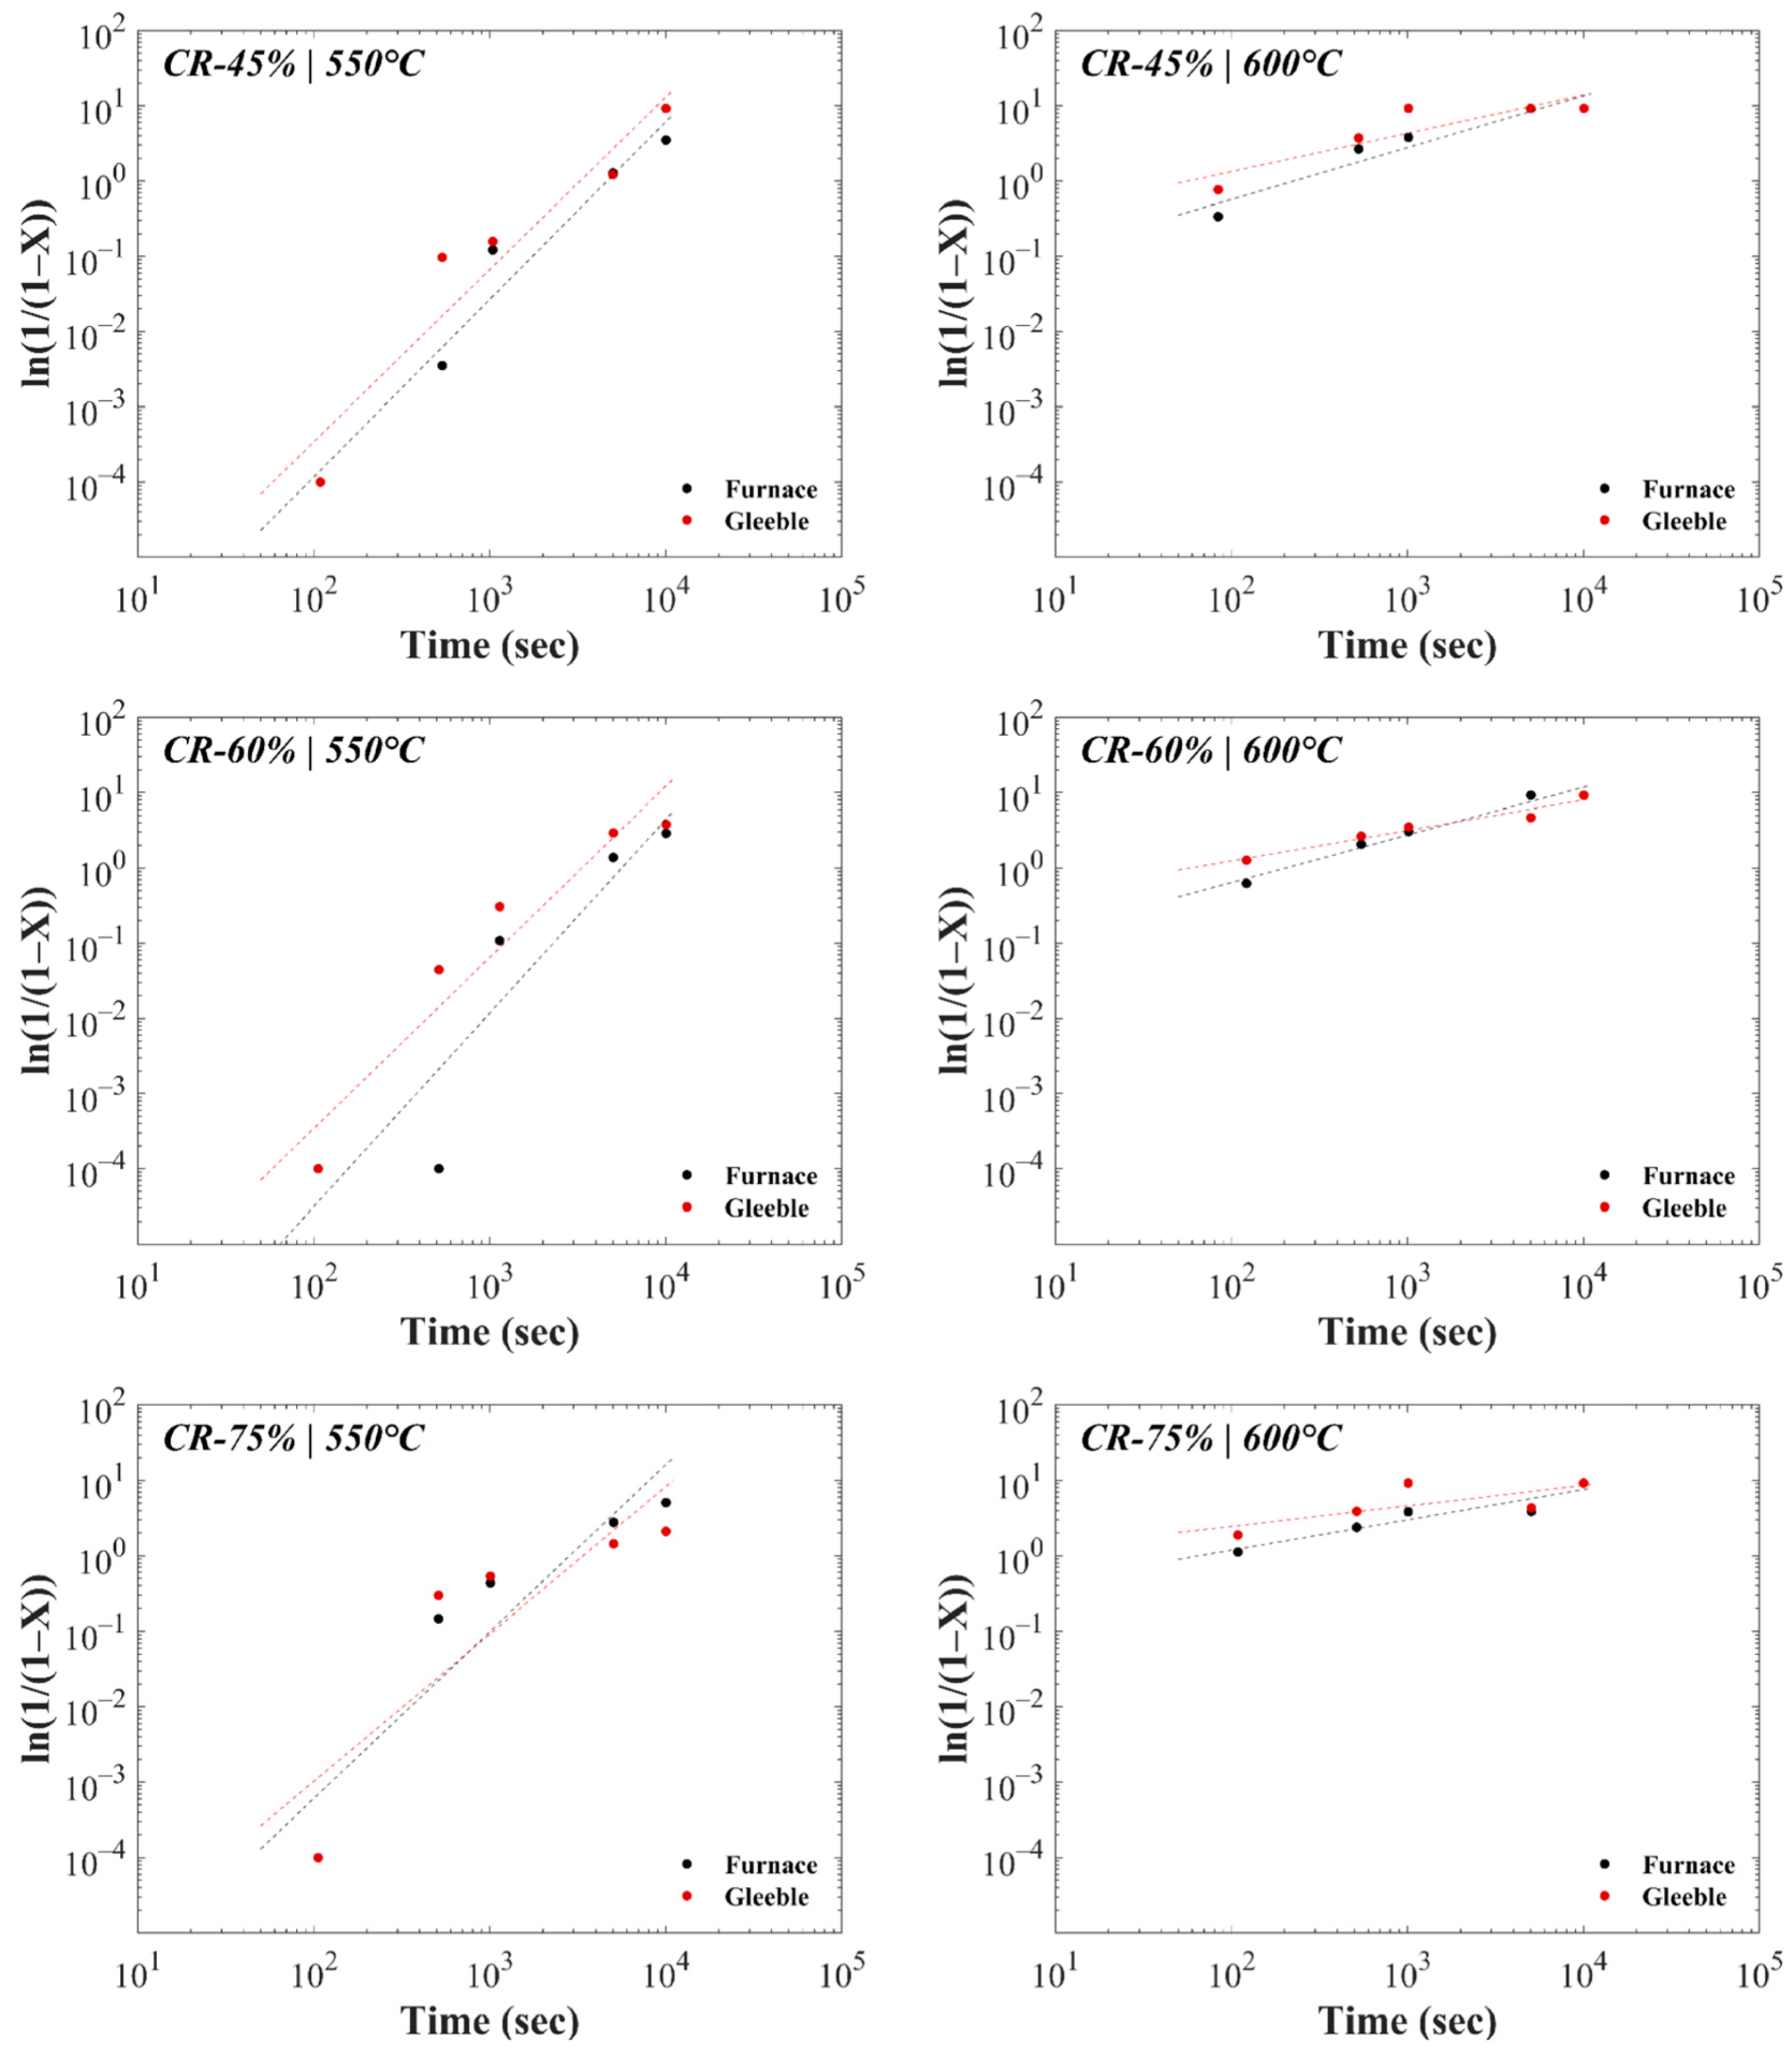
  • Analysis of transformation kinetics using the JMAK relationship pointed towards greater transformation activity during Gleeble treatment, with the effects of grain growth becoming dominant at 600 °C.
  • Activation energies determined using JMAK coefficients were of similar order of magnitude as other published values for steels and showed an increasing trend with increased cold reduction. Within each reduction level, the activation energy for the Gleeble-heated case was higher than its furnace-heated counterpart, although these computed values inherit the significant contribution of grain growth at 600 °C.

Author Contributions

Conceptualization, D.V.I. and S.M.; formal analysis, D.V.I., S.M. and Y.P.; investigation, D.V.I. and S.M.; resources, H.R.; writing—original draft preparation, D.V.I. and S.M.; writing—review and editing, D.V.I., S.M. and Y.P.; visualization, D.V.I. and S.M.; supervision, H.R. All authors have read and agreed to the published version of the manuscript.

Funding

This research received no external funding.

Data Availability Statement

The data generated and support the findings of this article are available from the corresponding author upon reasonable request.

Acknowledgments

The authors would like to acknowledge Mississippi State University and the Center for Advanced Vehicular Systems (CAVS) for the research capabilities that facilitated the work presented herein.

Conflicts of Interest

The authors declare no conflict of interest.

Appendix A. EBSD Maps of All Samples

Figure A1. CR-45% EBSD maps of inverse pole figure (color) overlaid upon image quality (grayscale). Columns (from left to right) correspond to Furnace 550 °C, Gleeble 550 °C, Furnace 600 °C, and Gleeble 600 °C, respectively. Rows (top to bottom) correspond to soak times of 100 s, 500 s, 1000 s, 5000 s, and 10,000 s, respectively.
Crystals 13 01650 g0a1
Figure A2. CR-60% EBSD maps of inverse pole figure (color) overlaid upon image quality (grayscale). Columns (from left to right) correspond to Furnace 550 °C, Gleeble 550 °C, Furnace 600 °C, and Gleeble °C, respectively. Rows (top to bottom) correspond to soak times of 100 s, 500 s, 1000 s, 5000 s, and 10,000 s, respectively.
Crystals 13 01650 g0a2
Figure A3. CR-75% EBSD maps of inverse pole figure (color) overlaid upon image quality (grayscale). Columns (from left to right) correspond to Furnace 550 °C, Gleeble 550 °C, Furnace 600 °C, and Gleeble °C, respectively. Rows (top to bottom) correspond to soak times of 100 s, 500 s, 1000 s, 5000 s, and 10,000 s, respectively.
Crystals 13 01650 g0a3

References

  1. Gleeble Thermal-Mechanical Simulators. Available online: www.gleeble.com (accessed on 9 December 2021).
  2. Troitskii, O.A.; Likhtman, V.I. The Effect of the Anisotropy of Electron and γ Radiation on the Deformation of Zinc Single Crystals in the Brittle State. Dokl. Akad. Nauk SSSR 1963, 148, 332–334. [Google Scholar]
  3. Sprecher, A.F.; Mannan, S.L.; Conrad, H. Overview No. 49: On the Mechanisms for the Electroplastic Effect in Metals. Acta Metall. 1986, 34, 1145–1162. [Google Scholar] [CrossRef]
  4. Okazaki, K.; Kagawa, M.; Conrad, H. A Study of the Electroplastic Effect in Metals. Scr. Metall. 1978, 12, 1063–1068. [Google Scholar] [CrossRef]
  5. Conrad, H.; Karam, N.; Mannan, S.; Sprecher, A.F. Effect of Electric Current Pulses on the Recrystallization Kinetics of Copper. Scr. Metall. 1988, 22, 235–238. [Google Scholar] [CrossRef]
  6. Park, J.-W.; Jeong, H.-J.; Jin, S.-W.; Kim, M.-J.; Lee, K.; Kim, J.J.; Hong, S.-T.; Han, H.N. Effect of Electric Current on Recrystallization Kinetics in Interstitial Free Steel and AZ31 Magnesium Alloy. Mater. Charact. 2017, 133, 70–76. [Google Scholar] [CrossRef]
  7. Poliak, E.I.; Lee, S.W.; Seo, D.H.; Choo, W.Y. Effect of Electric Current Heating on Hot Deformation Resistance and Microstructure of Steels. Met. Mater. 1999, 5, 563–570. [Google Scholar] [CrossRef]
  8. Rahnama, A.; Qin, R. Room Temperature Texturing of Austenite/Ferrite Steel by Electropulsing. Sci. Rep. 2017, 7, 42732. [Google Scholar] [CrossRef] [PubMed]
  9. Noell, P.J.; Rodelas, J.M.; Ghanbari, Z.N.; Laursen, C.M. Microstructural Modification of Additively Manufactured Metals by Electropulsing. Addit. Manuf. 2020, 33, 101128. [Google Scholar] [CrossRef]
  10. Conrad, H. Effects of Electric Current on Solid State Phase Transformations in Metals. Mater. Sci. Eng. A 2000, 287, 227–237. [Google Scholar] [CrossRef]
  11. Kim, M.-J.; Lee, K.; Oh, K.H.; Choi, I.-S.; Yu, H.-H.; Hong, S.-T.; Han, H.N. Electric Current-Induced Annealing during Uniaxial Tension of Aluminum Alloy. Scr. Mater. 2014, 75, 58–61. [Google Scholar] [CrossRef]
  12. Bodyako, M.N.; Loiko, Y.M.; Pavlyukevich, B.L.; Parkhimovich, V.I. Recrystallization Diagrams for Induction Heating. Met. Sci. Heat Treat. 1962, 2, 57–59. [Google Scholar] [CrossRef]
  13. Shahmir, H.; Nili-Ahmadabadi, M.; Razzaghi, A.; Mohammadi, M.; Wang, C.T.; Jung, J.M.; Kim, H.S.; Langdon, T.G. Using Dilatometry to Study Martensitic Stabilization and Recrystallization Kinetics in a Severely Deformed NiTi Alloy. J. Mater. Sci. 2015, 50, 4003–4011. [Google Scholar] [CrossRef]
  14. Oberdorfer, B.; Steyskal, E.-M.; Sprengel, W.; Pippan, R.; Zehetbauer, M.; Puff, W.; Würschum, R. Recrystallization Kinetics of Ultrafine-Grained Ni Studied by Dilatometry. J. Alloys Compd. 2011, 509, S309–S311. [Google Scholar] [CrossRef]
  15. Liu, G.; Li, J.; Zhang, S.; Wang, J.; Meng, Q. Dilatometric Study on the Recrystallization and Austenization Behavior of Cold-Rolled Steel with Different Heating Rates. J. Alloys Compd. 2016, 666, 309–316. [Google Scholar] [CrossRef]
  16. Krawczynska, A.T.; Lewandowska, M.; Kuziak, R.; Kurzydłowski, K.J. Recrystallization and Grain Growth in Nano-Structured Austenitic Stainless Steel under Electric Current Heating. Phys. Status Solidi (C) 2010, 7, 1380–1383. [Google Scholar] [CrossRef]
  17. Fabrègue, D.; Mouawad, B.; Hutchinson, C.R. Enhanced Recovery and Recrystallization of Metals Due to an Applied Current. Scr. Mater. 2014, 92, 3–6. [Google Scholar] [CrossRef]
  18. Huang, K.; Cayron, C.; Logé, R.E. The Surprising Influence of Continuous Alternating Electric Current on Recrystallization Behaviour of a Cold-Rolled Aluminium Alloy. Mater. Charact. 2017, 129, 121–126. [Google Scholar] [CrossRef]
  19. Nicolaÿ, A.; Franchet, J.M.; Cormier, J.; Logé, R.E.; Fiorucci, G.; Fausty, J.; Van Der Meer, M.; Bozzolo, N. Influence of Joule Effect Heating on Recrystallization Phenomena in Inconel 718. Met. Mater. Trans. A 2021, 52, 4572–4596. [Google Scholar] [CrossRef]
  20. Van Iderstine, D.; Mujahid, S.; Paudel, Y.; Rhee, H. Effects of Direct Resistance Heating on Recrystallization in Cold-Worked Steels. In Report of the 2022 Department of Defense Steels Summit; Limmer, K.R., Field, D.M., Sebeck, K.M., Gonzales, M., Soto-Medina, S., Draper, M.C., Nath, M., Kudzal, A., Payton, E.J., Eds.; DEVCOM Army Research Laboratory: Adelphi, MD, USA, 2023; p. 37. [Google Scholar]
  21. McMaster-Carr. Available online: https://www.mcmaster.com/ (accessed on 2 August 2023).
  22. Thermo-Calc Software TCFE9 Steels/Fe-Alloys Database. Available online: https://thermocalc.com/products/databases/steel-and-fe-alloys/ (accessed on 24 January 2022).
  23. ASM International (Ed.) Heat Treating. In ASM Handbook; ASM International: Materials Park, OH, USA, 1991; Volume 4, ISBN 978-0-87170-379-8. [Google Scholar]
  24. Metal Forming Equipment & Machines. Available online: https://www.fenn-torin.com/ (accessed on 30 October 2023).
  25. Ushioda, K.; Hutchinson, W.B.; Ågren, J.; Von Schlippenbach, U. Investigation of Structure and Texture Development during Annealing of Low-Carbon Steel. Mater. Sci. Technol. 1986, 2, 807–815. [Google Scholar] [CrossRef]
  26. Scanning Electron Microscopes (SEM) For Applications in Academia and Industry. Available online: https://www.zeiss.com/microscopy/en/products/sem-fib-sem/sem.html (accessed on 30 October 2023).
  27. Electron Backscatter Diffraction (EBSD). Available online: https://www.edax.com/products/ebsd/ (accessed on 30 October 2023).
  28. Dziaszyk, S.; Payton, E.J.; Friedel, F.; Marx, V.; Eggeler, G. On the Characterization of Recrystallized Fraction Using Electron Backscatter Diffraction: A Direct Comparison to Local Hardness in an IF Steel Using Nanoindentation. Mater. Sci. Eng. A 2010, 527, 7854–7864. [Google Scholar] [CrossRef]
  29. Wilson® VH3100 Vickers & Knoop Hardness Testers. Available online: https://www.buehler.com/products/hardness-testing/vickers-knoop-hardness-testers/wilson-vh3100-vickers-knoop-hardness-testers/ (accessed on 30 October 2023).
  30. E28 Committee ASTM E92; Test Methods for Vickers Hardness and Knoop Hardness of Metallic Materials. ASTM International: West Conshohocken, PA, USA, 2023.
  31. E04 Committee ASTM E384; Test Method for Microindentation Hardness of Materials. ASTM International: West Conshohocken, PA, USA, 2022.
  32. EDAX OIM Analysis. Available online: https://www.edax.com/products/ebsd/oim-analysis (accessed on 30 October 2023).
  33. Huang, J.; Poole, W.J.; Militzer, M. Austenite Formation during Intercritical Annealing. Met. Mat. Trans. A 2004, 35, 3363–3375. [Google Scholar] [CrossRef]
  34. Purcek, G.; Saray, O.; Karaman, I.; Maier, H.J. High Strength and High Ductility of Ultrafine-Grained, Interstitial-Free Steel Produced by ECAE and Annealing. Met. Mat. Trans. A 2012, 43, 1884–1894. [Google Scholar] [CrossRef]
  35. Dieter, G.E. McGraw-Hill series in materials science and engineering. In Mechanical Metallurgy, 3rd ed.; McGraw-Hill: New York, NY, USA, 1986; ISBN 978-0-07-016893-0. [Google Scholar]
  36. Humphreys, F.J.; Hatherly, M. Recrystallization and Related Annealing Phenomena, 2nd ed.; Elsevier: Amsterdam, the Netherlands; Boston, MA, USA, 2004; ISBN 978-0-08-044164-1. [Google Scholar]
  37. Porter, D.A.; Easterling, K.E.; Sherif, M.Y. Phase Transformations in Metals and Alloys, 3rd ed.; CRC Press: Boca Raton, FL, USA, 2009; ISBN 978-1-4200-6210-6. [Google Scholar]
  38. Vandermeer, R.A.; Gordon, P. Recovery and Recrystallization of Metals; Interscience Publishers: New York, NY, USA, 1963. [Google Scholar]
  39. Samajdar, I.; Verlinden, B.; Van Houtte, P.; Vanderschueren, D. Recrystallisation Kinetics in IF-Steel: A Study on the Sluggish Recrystallisation Behaviour. Scr. Mater. 1997, 37, 869–874. [Google Scholar] [CrossRef]
  40. Raabe, D. Recovery and Recrystallization: Phenomena, Physics, Models, Simulation. In Physical Metallurgy; Elsevier: Amsterdam, The Netherlands, 2014; pp. 2291–2397. ISBN 978-0-444-53770-6. [Google Scholar]
  41. Etesami, S.A.; Enayati, M.H. Microstructural Evolution and Recrystallization Kinetics of a Cold-Rolled, Ferrite-Martensite Structure During Intercritical Annealing. Met. Mater. Trans. A 2016, 47, 3271–3276. [Google Scholar] [CrossRef]
  42. Dutta, S.; Panda, A.K.; Mitra, A.; Chatterjee, S.; Roy, R.K. Microstructural Evolution, Recovery and Recrystallization Kinetics of Isothermally Annealed Ultra Low Carbon Steel. Mater. Res. Express 2020, 7, 016554. [Google Scholar] [CrossRef]
  43. Jeong, K.; Jin, S.-W.; Kang, S.-G.; Park, J.-W.; Jeong, H.-J.; Hong, S.-T.; Cho, S.H.; Kim, M.-J.; Han, H.N. Athermally Enhanced Recrystallization Kinetics of Ultra-Low Carbon Steel via Electric Current Treatment. Acta Mater. 2022, 232, 117925. [Google Scholar] [CrossRef]
Figure 1. (a) Specimen dimensions and layout relative to rolling direction (RD), transverse direction (TD), and normal direction (ND). (b) Location of plane being analyzed in present study. Red/green wires represent K-type thermocouples attached to the center of the RD-TD face.
Crystals 13 01650 g001
Figure 2. Schematic illustrating how soak time was defined for furnace heat treatments.
Crystals 13 01650 g002
Figure 3. Gleeble setup used for heat treatment, pictured at the instant of water quench.
Crystals 13 01650 g003
Figure 4. Schematic showing location of area used for EBSD scan (top). After scanning, the same region is used for microhardness testing, with a grid of nine indents per sample arranged as shown (bottom).
Crystals 13 01650 g004
Figure 5. Examples of EBSD maps showing inverse pole figure (top row) and grain average misorientation (bottom row), both overlaid with image quality. Sample underwent 75% cold reduction followed by heat treatment at 550 °C for 1000 s using furnace (left) and Gleeble (right). Additional EBSD maps for full 60-sample test matrix are available in Appendix A. All EBSD maps presented in this manuscript are in the as-scanned state without any post-processing (cleanup/reindexing) applied to the data in order to preserve as much microstructural information as possible.
Crystals 13 01650 g005
Figure 6. Plots depicting recrystallization fraction as a function of time for treatments performed at 550 °C (left column) and 600 °C (right column). The rows correspond to 45%, 60%, and 75% reduction from top to bottom, respectively. Within each figure, data shown in black originates from furnace-treated samples while data shown in red originates from Gleeble-treated samples. Open circles correspond to recrystallized fractions from EBSD (area fraction with GAM ≤ 1°). Solid squares and accompanying error bars are averages and standard deviations of recrystallized fractions determined from hardness measurements based on Equation (1) (729 measurements per data point).
Crystals 13 01650 g006
Figure 7. Plots depicting the fitting of recrystallized fractions (points) using JMAK model (lines) for treatments performed at 550 °C (left column) and 600 °C (right column). The rows correspond to 45%, 60%, and 75% reduction from top to bottom, respectively. Within each figure, data shown in black originates from furnace-treated samples while data shown in red originates from Gleeble-treated samples. Coefficients corresponding to least-squares fit lines on log–log plots are listed in Table 4.
Crystals 13 01650 g007
Table 1. Chemical composition of steel used in the current study, per certificate from manufacturer.
ElementCMnSiCrCuMoNiVPS
Amount (wt%)0.1900.7600.0100.0500.0200.0020.0100.0010.0190.007
Table 2. Cold rolling (CR) schedule with corresponding thickness values (in mm).
PassCR-45%CR-60%CR-75%
0 (Initial Thickness)6.3036.1676.153
15.8475.8475.792
25.4835.4975.470
35.1195.1385.116
44.7654.7744.755
54.4014.4284.392
64.0344.0604.016
73.6643.6843.675
83.4473.4373.443
9-3.1723.160
10-2.8452.845
11-2.5482.537
12--2.153
13--1.801
14--1.554
15--1.499
Reduction %45.3%58.7%75.6%
Table 3. Vickers microhardness values (HV0.5) for samples with varying cold reduction amounts annealed using multiple methods, temperatures, and durations. Averages and standard deviations obtained using nine indentations per sample.
Cold
Reduction
Annealing
Time (s)
550 °C600 °C
FurnaceGleebleFurnaceGleeble
45%100223.5 ± 4.3217.2 ± 5.9195.2 ± 7.5177.1 ± 9.6
500215.9 ± 5.4209.4 ± 4.3148.3 ± 4.4144.9 ± 7.2
1000207.8 ± 5.0205.5 ± 7.5144.8 ± 9.6135.3 ± 5.5
5000163.6 ± 12.9164.9 ± 11.7134.8 ± 2.7131.4 ± 2.7
10,000145.4 ± 6.8131.6 ± 3.3135.1 ± 4.0131.7 ± 2.9
60%100231.5 ± 3.8226.6 ± 8.0182.4 ± 10.6160.8 ± 6.8
500224.8 ± 7.3217.9 ± 5.7147.8 ± 3.6143.1 ± 5.3
1000213.0 ± 9.0199.3 ± 6.8141.1 ± 3.5139.7 ± 3.2
5000158.4 ± 7.1141.7 ± 5.3133.5 ± 3.8138.0 ± 6.7
10,000141.9 ± 4.0139.1 ± 4.5136.0 ± 4.5134.8 ± 5.1
75%100244.9 ± 4.1243.5 ± 7.3175.1 ± 5.5158.1 ± 4.7
500227.6 ± 4.9216.0 ± 4.1152.2 ± 5.8145.1 ± 4.2
1000206.6 ± 7.2200.6 ± 12.6145.3 ± 6.1142.8 ± 4.5
5000149.3 ± 5.0166.3 ± 5.2145.1 ± 5.3144.5 ± 4.8
10,000143.7 ± 4.5155.1 ± 18.1142.4 ± 4.9142.0 ± 4.9
Table 4. JMAK fitting constants based on cold reduction (CR), heating method (F-Furnace vs. G-Gleeble), and temperature (550 °C vs. 600 °C).
Cold ReductionHeating Method-Temperaturenk
45%F-550 °C2.362.23 × 10−9
G-550 °C2.298.97 × 10−9
F-600 °C0.692.40 × 10−2
G-600 °C0.511.28 × 10−1
60%F-550 °C2.572.23 × 10−10
G-550 °C2.289.65 × 10−9
F-600 °C0.633.50 × 10−2
G-600 °C0.401.95 × 10−1
75%F-550 °C2.212.27 × 10−8
G-550 °C1.951.26 × 10−7
F-600 °C0.401.85 × 10−1
G-600 °C0.277.02 × 10−1
Table 5. Activation energies for recrystallization grouped by amount of cold reduction and heating method.
Cold ReductionHeating MethodActivation Energy
(kJ/mol)
45%Furnace405.79
Gleeble550.74
60%Furnace449.48
Gleeble574.09
75%Furnace539.02
Gleeble955.02
Disclaimer/Publisher’s Note: The statements, opinions and data contained in all publications are solely those of the individual author(s) and contributor(s) and not of MDPI and/or the editor(s). MDPI and/or the editor(s) disclaim responsibility for any injury to people or property resulting from any ideas, methods, instructions or products referred to in the content.

