Article

The Effect of Isoniazid–Maltitol Solid Dispersions on Aqueous Solubility and Permeability

1
Department of Pharmaceutical Sciences, School of Pharmacy, Sefako Makgatho Health Sciences University, Pretoria 0208, South Africa
2
Centre of Excellence for Pharmaceutical Sciences (Pharmacen), North-West University, Potchefstroom 2520, South Africa
3
School of Pharmacy, University of the Western Cape, Robert Sobukwe Drive, Bellville, Cape Town 7130, South Africa
*
Authors to whom correspondence should be addressed.
Crystals 2023, 13(11), 1568; https://doi.org/10.3390/cryst13111568
Submission received: 2 October 2023 / Revised: 26 October 2023 / Accepted: 30 October 2023 / Published: 2 November 2023
(This article belongs to the Section Crystal Engineering)

Abstract

:
Maltitol (MAL) is a well-known polyol with potential pharmaceutical applications. Unlike other polyols, its utilization as a carrier for solid dispersions (SDs) has not been adequately investigated. This research studied the feasibility of MAL as an SD carrier to enhance the biopharmaceutical properties of a BCS class I/III drug, isoniazid (INH). SDs of INH–MAL were prepared by the fusion method, and physicochemical characteristics were investigated to determine the solid-state habit, solubility and permeation enhancement of INH. Fourier-transform infrared (FT-IR) spectroscopy demonstrated significant peak broadening for the SDs consisting of a higher MAL concentration. Powder X-ray diffraction indicated a decrease in degree of crystallinity with increasing MAL concentration. Hot-stage microscopy (HSM) and scanning electron microscopy (SEM) revealed that INH–MAL molar ratios affect the type of SD prepared via the fusion method. Results from the equilibrium solubility studies indicated significant INH solubility improvement (p < 0.05) with SDs in comparison with the pure drug and physical mixtures. The artificial membrane permeation assay (PAMPA) of INH was positively affected by the presence of MAL. The results of the study indicated the potential for MAL as a carrier in the preparation of SDs for the solubility and/or permeability enhancement of drugs.

1. Introduction

Isoniazid (INH) (Figure 1a), a first-line anti-tuberculosis drug, is classified as a borderline Biopharmaceutical Classification System (BCS) Class I or III drug [1]. Based on its low permeability (log p = −0.64 at 25 °C) and the effect of excipients such as lactose on the absorption places the drug close to Class III [2,3]. It has been reported that deoxidizing saccharides such as lactose and maltose interact with INH and alter the drug absorption detrimentally [1]. Lactose is one of the very commonly used excipients (~60–70% of formulations) due to its high water solubility and good flow properties [4].
The preparation of drug-containing solid dispersions is one of the most studied strategies to improve drug solubility and dissolution, all in an effort to enhance drug bioavailability after oral administration [5]. Various types of solid dispersions exist, where the drug can exist in an amorphous or crystalline state, either suspended or molecularly mixed in a carrier matrix. This could allow the formation of two-phase or one-phase solid dispersions, and in both instances, the carrier may be either amorphous or crystalline [6,7]. In particular, amorphous solid dispersions have been reported for permeability enhancement of BCS Class II and IV drugs [8,9,10]. As explained by Narula et al. [11], the enhanced permeability can be attributed to the particle size reduction of the drug, which can promote membrane permeation beyond the natural aqueous solubility of the drug. The reduction in particle size substantially increases the solubility and dissolution rate by forming a metastable drug-rich transient phase, which results in increasing the permeability through multiple mechanisms such as the “reservoir” and “shuttle” effects [12]. Further to this, the use of excipients can modulate intestinal metabolism and efflux mechanisms to improve bioavailability [9].
Several authors reported the use of sugar alcohols such as mannitol, sorbitol, and xylitol in the preparation of solid dispersions and their effect on the enhancement of the dissolution rate of poorly soluble drugs. However, only limited studies were reported for their role in the enhancement of permeability. Sugar alcohols, also termed polyols, are monosaccharides (erythritol, xylitol, sorbitol, mannitol) and disaccharides (lactitol, isomalt, maltitol). Currently, there are eight polyols approved by the US FDA, i.e., erythritol, hydrogenated starch hydrolysates, isomalt, lactitol, maltitol, mannitol, sorbitol, and xylitol [13,14]. Polyols are reported to be extremely stable to heat, enzymes, and chemical degradation [15]. The use of polyols is rapidly gaining interest in the formulation of various types of dosage forms, such as liquid oral preparations, lozenges, and tablets, to name but just a few. Polyols are low in caloric content, exhibit high nutritional value, and, most importantly, they are non-carcinogenic [16].
In previous studies, the effect of polyols (xylitol, sorbitol, maltitol, and mannitol) on the permeability of various BCS Class III drugs indicated no change to marginal increase in the permeability [14]. However, mannitol solid dispersions of olanzapine have been reported to enhance the permeability (two- to four-fold) across various biological membranes. The possible mechanisms suggested were the enhanced aqueous solubility due to reduced particle size, solubilization effect of the carrier, formation of a solid solution, change in crystal quality, and surface hydrophobicity of drug particles [17]. These studies indicate the potential use of polyols as permeation enhancers, coupled with solid-state modification of the drugs.
In the pharmaceutical field, mannitol and sorbitol are most frequently used. However, in comparison, maltitol shows potential as an excipient for pharmaceutical applications. Maltitol (Figure 1b), also called 4-O-α-d-glucopyranosyl-d-sorbitol, is highly stable and exhibits good sweetening power with a low caloric value and a lower glycemic index, thereby making this molecule a suitable excipient in the formulation of pediatric and diabetic friendly dosage forms [14,18]. It is the least hygroscopic among all polyols and only absorbs moisture at humidity levels above 80%, showing excellent compressibility, thereby ensuring it is used as a direct compressible excipient in the formulation of tablets [18,19]. In addition to the above, in terms of the laxative effect for which polyols are known, maltitol is the best-tolerated polyol [18]. Despite the favorable physicochemical properties and potential pharmaceutical applications, maltitol is under investigation as a carrier for solid dispersions. This study aimed to explore its role in the development of solid dispersions for the solubility and permeability enhancement of isoniazid.
Figure 1. Molecular structures of (a) INH and (b) MAL [1,14].
Crystals 13 01568 g001

2. Materials and Methods

2.1. Materials

Isoniazid (INH) was purchased from Sigma-Aldrich (St. Louis, MO, USA). Maltitol (MAL) was purchased from Glentham Life Sciences Ltd. (Corsham, UK). Chromatography grade acetonitrile was obtained from Labchem (Johannesburg, South Africa), and ultrapure water with a resistivity of 18.2 MΩ.cm was obtained from an Elga Veolia (High Wycombe, UK) water purification system. For the preparation of aqueous solutions, deionized water was produced by a Nanopure™ Water Purification System (Thermo Scientific, Waltham, MA, USA). All materials were used as provided, and no further purification process was performed.

2.2. Methods

2.2.1. Preparation of Physical Mixtures

The binary physical mixtures (PMs) were prepared by gently grinding the accurately weighed quantities of INH and MAL at different drug-to-sugar molar weight ratios of 3:1, 2:1, 1:1, 1:2, and 1:3 (w/w) (INH–MAL). INH and MAL were geometrically mixed using a mortar and pestle for 2 min to prepare a homogenous mixture. The physical mixtures were subsequently stored in a desiccator until further use.

2.2.2. Preparation of Solid Dispersions

Solid dispersions (SDs) of INH–MAL were prepared by the well-known fusion method. Physical mixtures of the different drug-to-polyol ratios viz. 3:1, 2:1, 1:1, 1:2, and 1:3 (w/w) were placed in a porcelain dish and melted on a heating mantle (Heidolph, Germany) at 170 ± 5 °C. The molten product was subsequently cooled to room temperature (RT). RT cooling was performed by simply leaving the molten product at room temperature (25 °C) until it was solidified. The solidified material was then stored in desiccators for 24 h before pulverization using a mortar pestle.

2.2.3. Physicochemical Characterization of Prepared Solid Dispersions

Differential Scanning Calorimetry (DSC)

INH, MAL, PMs, and prepared SDs were analyzed using a Mettler Toledo DSC3 (Mettler Toledo, Columbus, OH, USA). Approximately 5–10 mg of each sample was weighed into aluminum pans, which were subsequently sealed with a pin-holed aluminum lid. Samples were heated from 30–300 °C at a constant heating rate of 10 °C/min under a continuous flow of nitrogen at 50 mL/min. Analysis of the data was carried out using STARe software, version 17.00 (Mettler Toledo, USA).

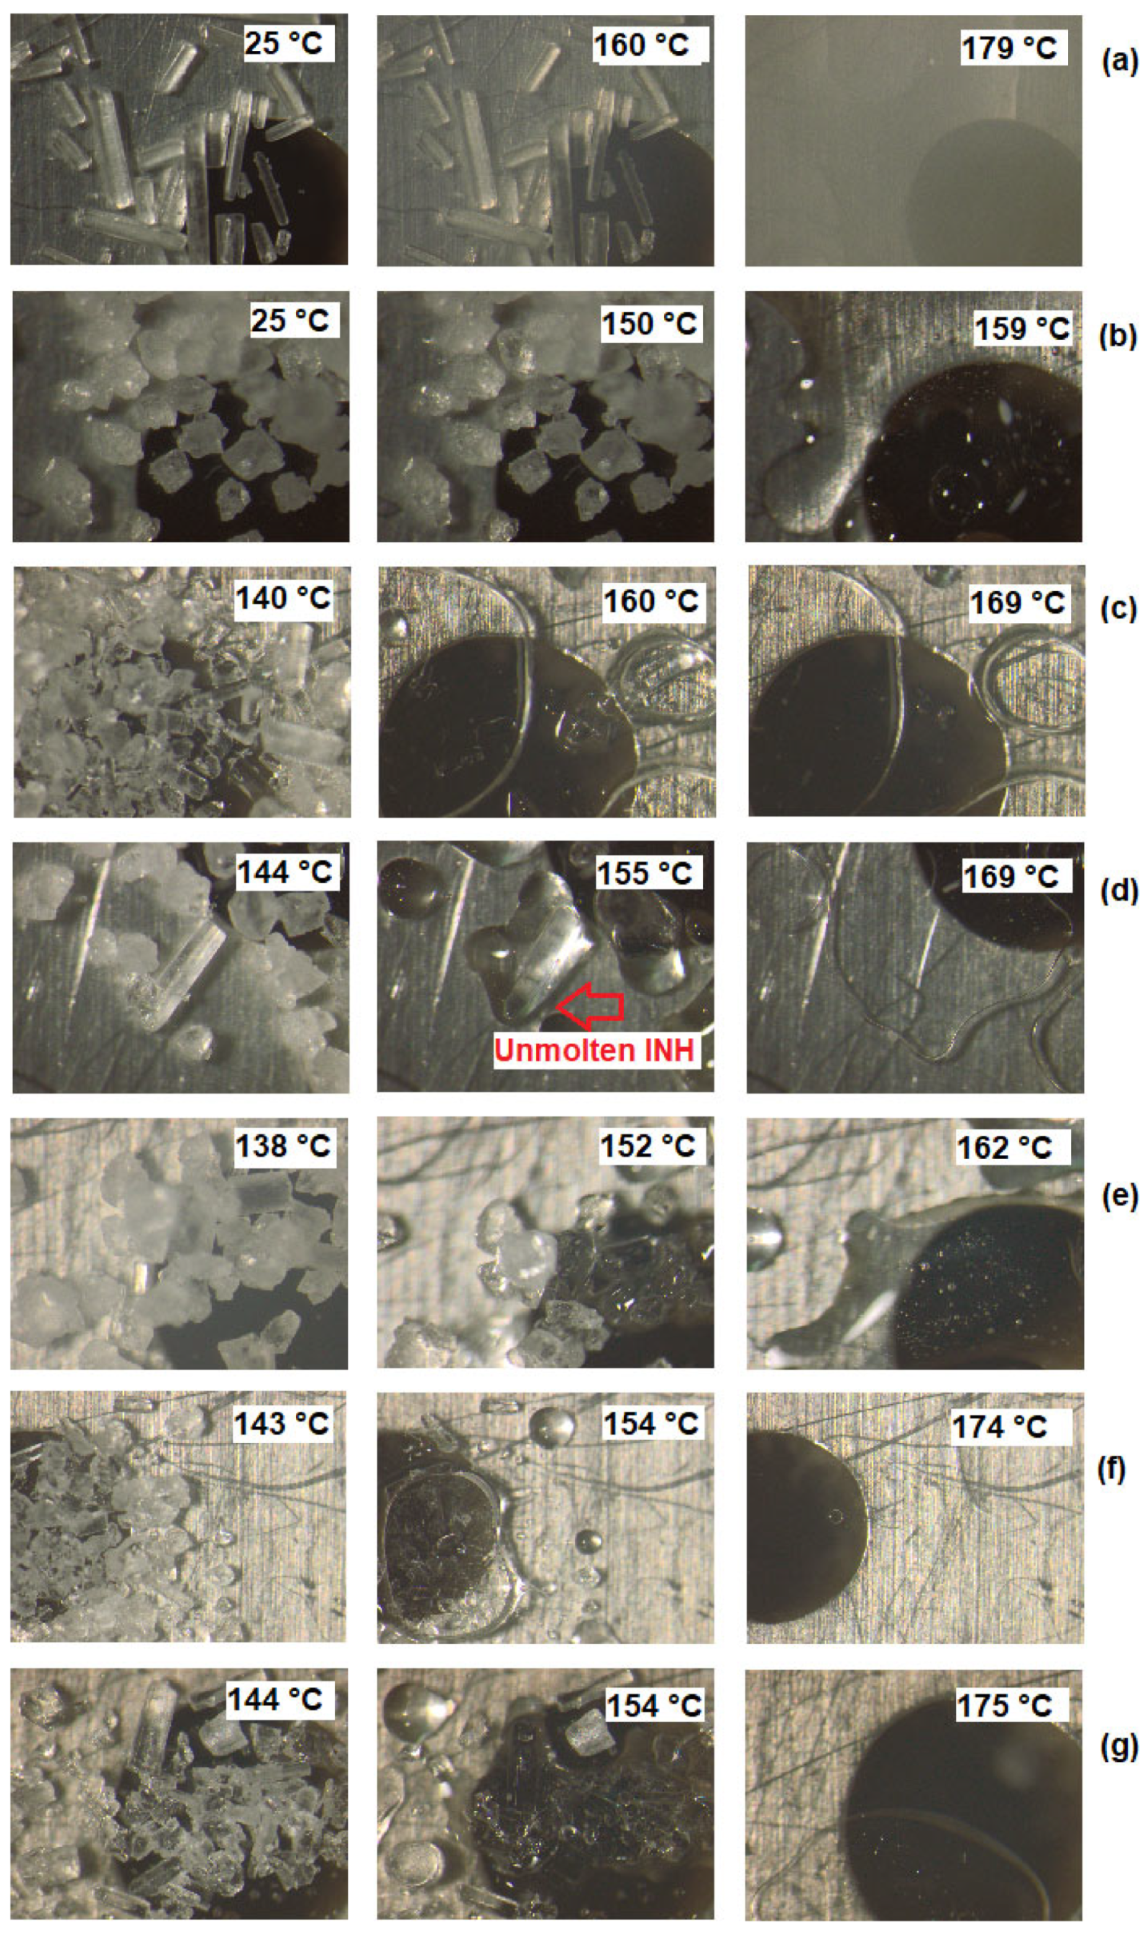
Hot-Stage Microscopy (HSM)

Hot-stage microscopy (HSM) was used as a supplementary technique to substantiate the DSC results. Analyses of the pure compounds, as well as PMs and SDs, were performed with a real-time Olympus UC30 (Tokyo, Japan) camera fitted to an Olympus SZX-ILLB200 (Tokyo, Japan) polarized light microscope to which a Linkam THMS600 heating stage equipped with a T95 LinkPad temperature controller (Surrey, UK) was attached. A small quantity of each sample was placed in between two microscope glass slides and heated at a heating rate of 10 °C/min. Photomicrographs were acquired at 40× magnification, and the temperatures at which the micrographs were taken were recorded.

Fourier-Transform Infrared Spectroscopy (FTIR)

FTIR spectra of pure INH, MAL, PMs, and SD formulations were recorded using a Cary 630 FTIR Spectrometer (Agilent Technologies, Santa Clara, CA, USA). The FTIR spectra were obtained in absorbance mode between 650–4000 cm−1 with 16 scans and 4 cm−1 resolution. The spectra were analyzed for change in intensity or absence or shift in the wave numbers of the characteristic peaks to determine any possible interactions between the INH and MAL in the PMs and SDs.

Powder X-ray Diffraction (PXRD)

The crystallinity of pure INH, MAL, PMs, and SD formulations were investigated by qualitative PXRD analysis. The PXRD patterns were recorded using a Bruker D2 Phaser X-ray diffractometer (Bruker, Billerica, USA) using Cu rays (λ = 1.54184 Å) at 30 kV and 30 mA current. Samples were packed onto a zero-background sample holder and analyzed over a range of 4–40°2Ɵ with a step width of 0.0162°/s and a scan speed of 1°/min.

Scanning Electron Microscopy (SEM)

Scanning electron microscopy (SEM) was used for visualization of surface morphology of pure and SD samples. The experiments were conducted using a scanning electron microscope, where samples were mounted on stainless-steel stubs, sputter coated with carbon (QT150ES, Quorum Technologies, East Sussex, UK), and examined with a Zeiss Supra 55VP Field Emission SEM (Carl Zeiss, Oberkochen, Germany) operating at 1 kV.

INH Content in SDs

An amount equivalent to 100 mg INH was weighed from each resultant SD, dispersed in distilled water, and sonicated for 10 min to achieve a clear solution. Each solution was diluted to 100 mL with distilled water to prepare a stock solution. One milliliter from the stock solution was further diluted to 100 mL with distilled water. A similar procedure was employed to prepare an INH reference standard solution with a concentration of 100 μg/mL.
Subsequently, samples were analyzed using an in-house developed method with high-performance liquid chromatography (HPLC). A Shimadzu (Kyoto, Japan) HPLC system consisting of a pump (model 515), an auto-sampler (ULTRA WISP 715), a UV detector (model 486), and Millennium 32 software was utilized. INH was analyzed at 265 nm using a Phenomenex Luna® C18 reversed-phase column 150 × 4.6 mm and 5 μm particle size (Torrance, CA, USA), at ambient temperature. A mobile phase consisting of acetonitrile and ultrapure water in the ratio of 60:40 (v/v) at a flow rate of 1.0 mL/min and an injection volume of 20 μL injection volume was used. Drug concentration was calculated by using the calibration curve in the range of 10–120 μg/mL with a correlation coefficient (r2) of 0.9946. The INH concentration was measured in triplicate, and the mean ± SD was reported.

Equilibrium Solubility Studies

Solubility studies were carried out on INH, INH–MAL PMs, and the prepared SDs by adding an excess amount of the samples to 5 mL distilled water in 10 mL glass polytop vials. The vials were sealed with Parafilm™ (Bemis, Neenah, WI, USA) and agitated at 100 rpm using a magnetic stirrer bar whilst the temperature of the samples was thermostatically controlled at 37 ± 0.5 °C. For INH, PMs, and SDs, solubility studies were conducted for 24 h. For INH and SDs, samples were collected at time intervals of 3, 6, 9, 12, 15, 30, 60, 120, 240, 480, and 1440 min. Collected samples were filtered through a 0.45 µm PVDF syringe filter into HPLC vials and subsequently analyzed using the described HPLC method. The solubility experiments were conducted in triplicate, and the mean ± SD was reported.

Parallel Artificial Membrane Permeability Assay (PAMPA)

To determine the membrane permeability of INH in combination with MAL, either as a PM or SD, the parallel artificial membrane permeability assay kit PAMPA-096 (BioAssay Systems, Hayward, CA, USA) was used. In this analysis, stock solutions (10 mM) of each INH–MAL combination (PMs and SDs) were prepared in phosphate-buffered saline (PBS) of pH 6.8. Dilutions of the stock solutions were made in PBS to allow permeability test solutions with a concentration of 500 µM. Equilibrium and blank controls were prepared as positive and negative controls, respectively. Following sample preparation, 300 µL PBS was added to each well of the acceptor plate. The addition of samples started with the careful application of 5 µL of 4% w/v lecithin in dodecane solution directly onto the surface of the membranes using a micropipette. Thereafter, 200 µL of each of the 500 µM dilutions of each sample in PBS was added to the donor plates. Similarly, 200 µL of each of the permeability controls was also added to the donor plates. Once all samples were pipetted into the relevant donor compartments, the donor plate was carefully placed into the acceptor plate wells to initiate the permeation process. The PAMPA kit was thereafter transferred to an incubator (Labotec, Johannesburg, South Africa). Incubation was performed at 37 ± 0.5 °C for 24 h, with samples extracted from the PAMPA plate from acceptor wells at 3, 6, 9, 15, 30, 60, 120, 240, 480, 960, and 1440 min. Duplicate acceptor wells were used for each time interval, and once the acceptor solution was removed, the well was not used again. Subsequently, the extracted donor and acceptor solutions were transferred to HPLC vials for analysis. Analyses of the donor solutions, acceptor solutions, equilibrium controls, and blank controls were conducted using the described HPLC method.

3. Results and Discussion

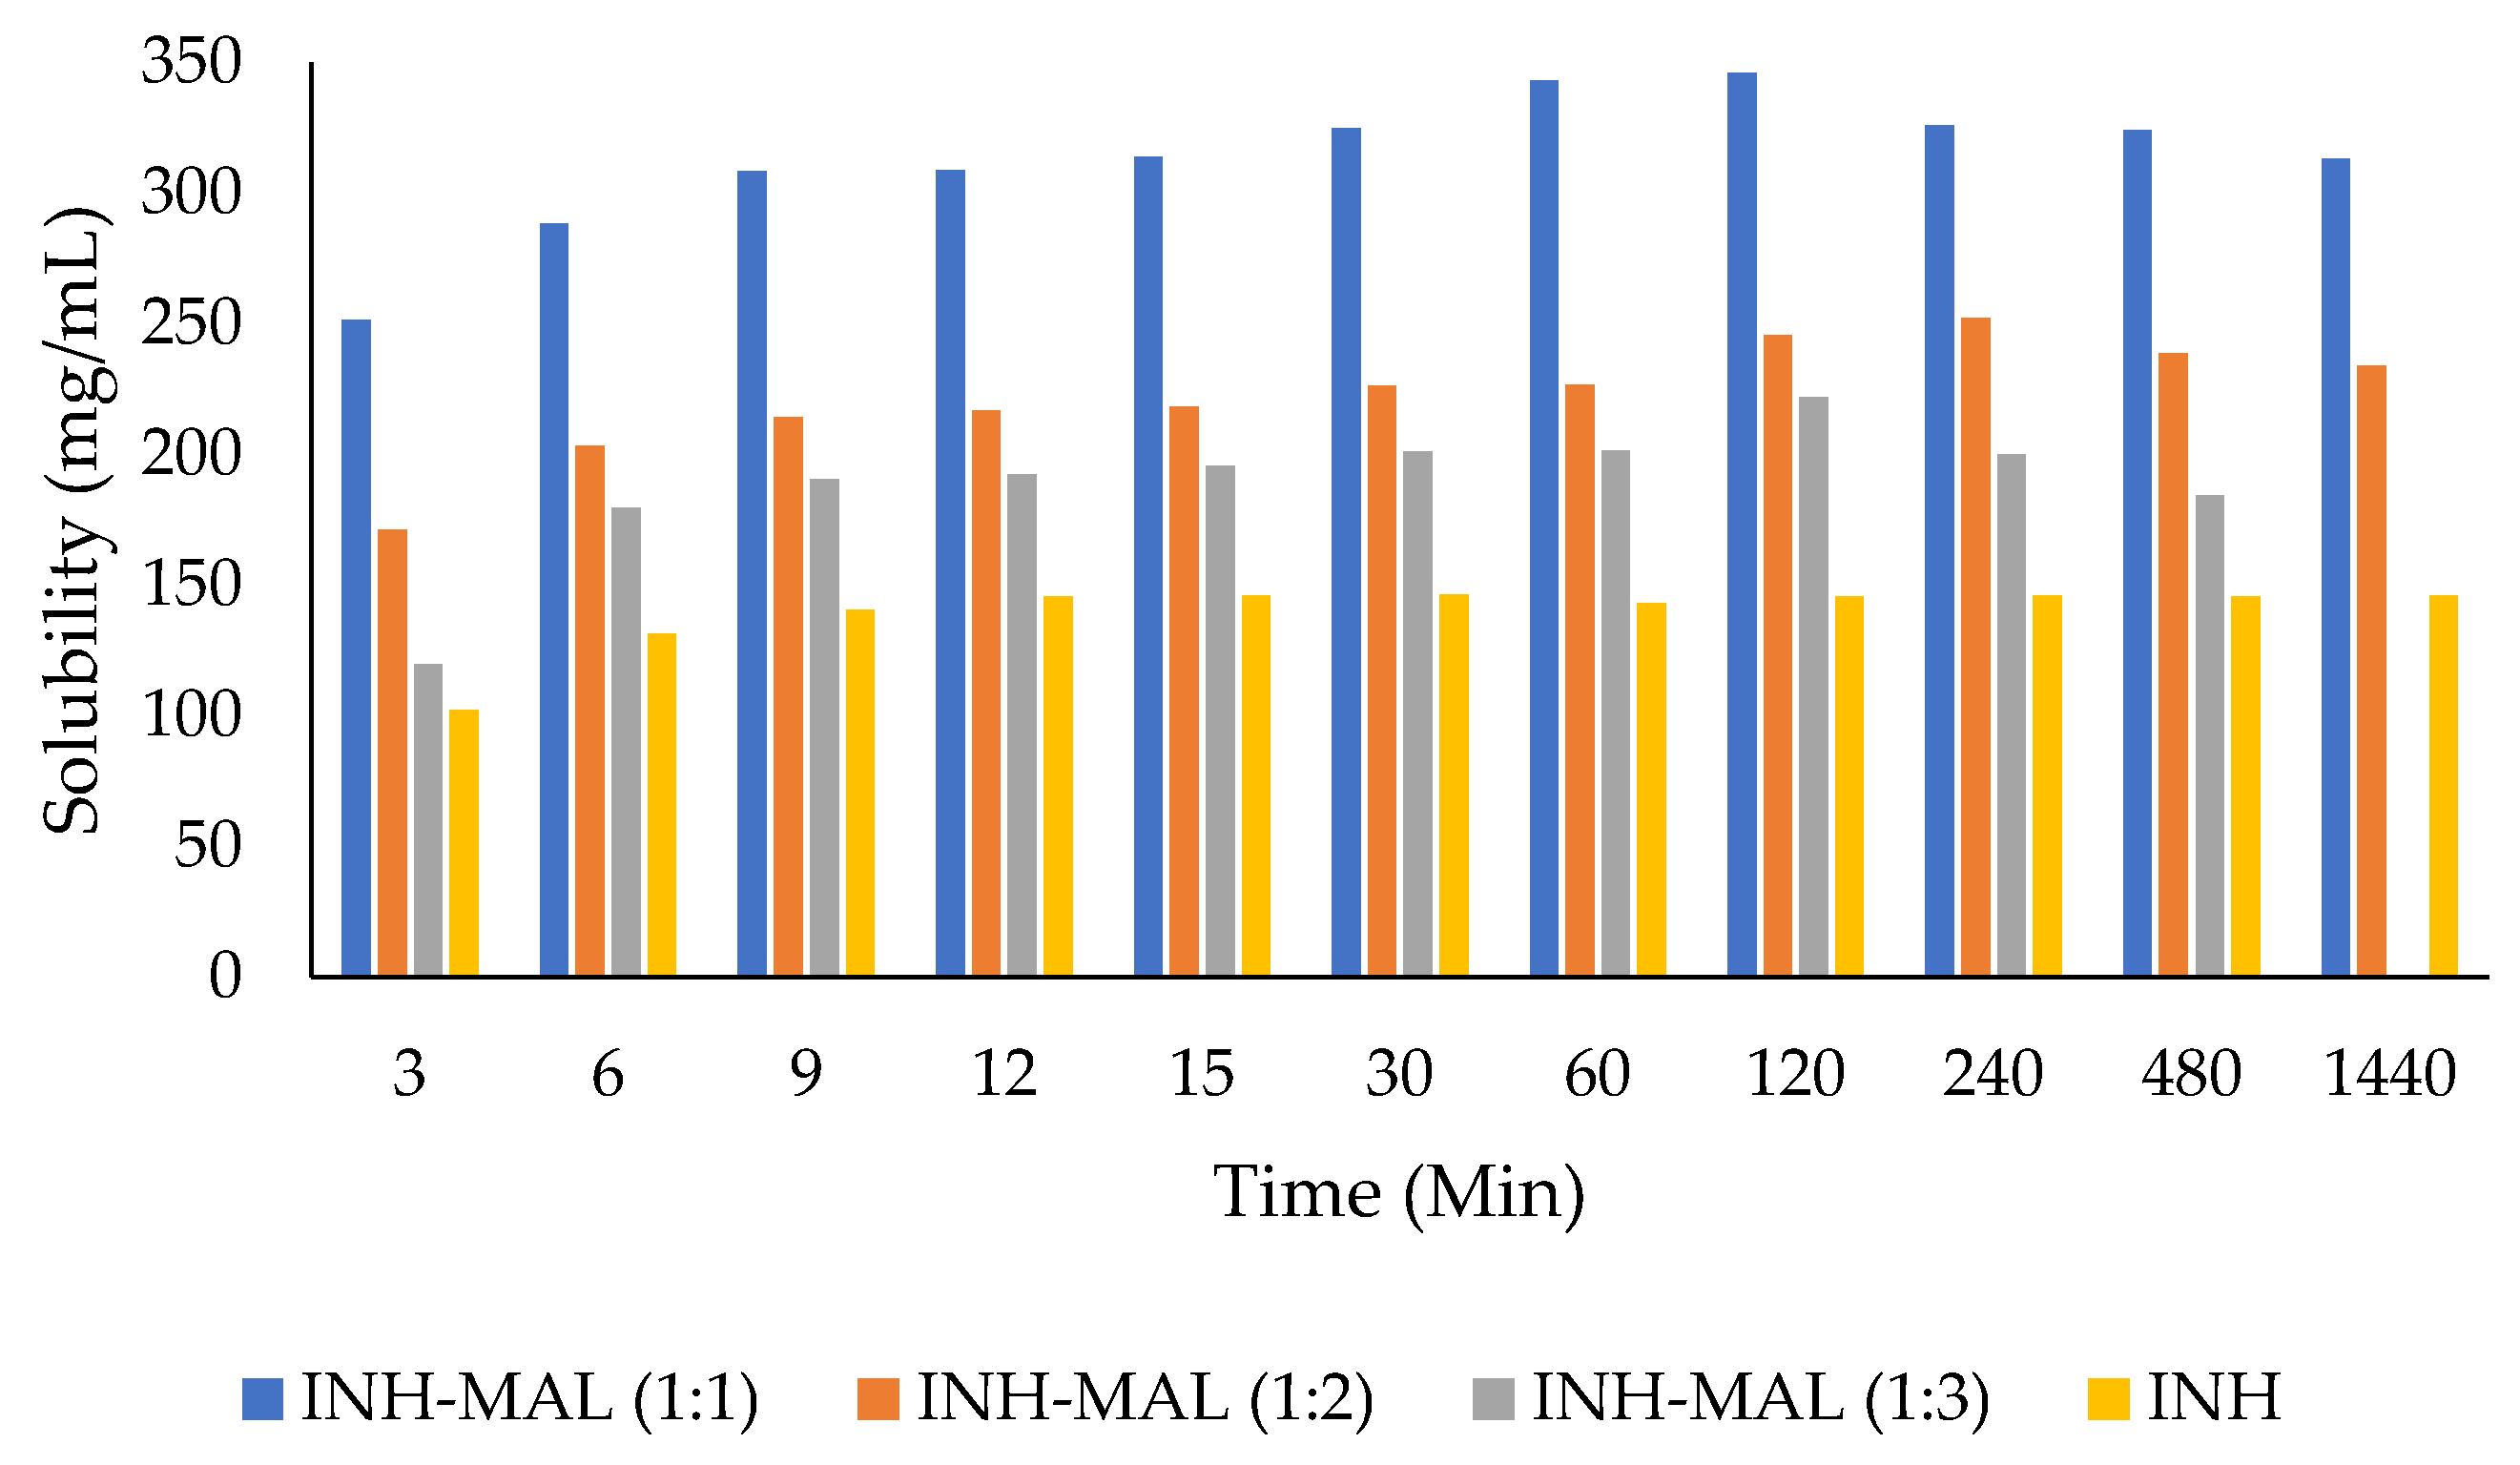
3.1. Solid-State Solubility of MAL–INH in Varying Molar Weight Ratios

This study explored the possibility of preparing INH SDs using MAL as a co-former or carrier. In order to investigate the miscibility of INH with MAL, the PMs prepared in the molar weight ratios of INH–MAL (2:1, 3:1, 1:1, 1:2, and 1:3) were analyzed using DSC. Figure 2 provides an overlay of the DSC thermograms obtained for the individual compounds and the resulting PMs. The observed sharp endothermic melting peaks of INH (174.33 °C) and MAL (153.50 °C) correspond well with those reported in the literature [18,20]. The DSC thermograms observed for PMs show melting point depression for both the INH and MAL and the peak broadening. The melting point for MAL and INH are reduced by ~12 to 13 °C. Such phenomenon can be attributed to drug dissolution and solubility in the carrier [21,22], which can further be attributed to the tendency of the drug to be in an amorphous state [22].
Figure 3 depicts the HSM micrographs obtained for INH, MAL, and each PM upon melting. It is a well-known fact that drug/co-former solubility or miscibility may be an indication of physical stability of the prepared co-amorphous system or SD [23].
The HSM data confirmed the interpretation of the DSC thermograms, with Figure 3a depicting the onset of INH melting at ~160 °C and complete melting at ~179 °C. The distinct tetragonal columnar particle morphology of crystalline INH was also observed. Figure 3b confirms the onset of melting of MAL at ~150 °C and complete melting at ~159 °C, with the particle morphology of MAL identified to be roughly cubic. For all the PMs, a lower onset of melting was observed, ranging from 138–144 °C. All PMs also exhibited partial miscibility of INH and MAL, which was observed as partial solubilization of the INH crystals in the molten MAL, followed by complete melting of all INH crystals at temperatures ranging from ~162–169 °C for INH–MAL (1:1), INH–MAL (1:2), and INH–MAL (1:3) mixtures. This was noted to be ~10 °C lower than that observed for pure INH. For the PMs consisting of higher INH molar ratios, i.e., INH–MAL (2:1) and INH–MAL (3:1), complete melting and solubilization of INH was observed at 174 °C and 175 °C, respectively. From Figure 2 and Figure 3, it was concluded that INH–MAL combinations show solubility of INH in molten MAL with the onset of melting of the combinations shifting to ~141–147 °C, which is approximately 6–12 °C lower than the melting point of pure MAL. It was further deduced that the higher INH molar ratios resulted in poor miscibility which could have a detrimental effect on the physical stability of potential solid dispersions (SDs). From these results, it was deduced that the preparation of potential INH–MAL SDs via the well-known fusion method could be possible.

3.2. Physicochemical Characterization of INH–MAL SDs Prepared via Heat Fusion

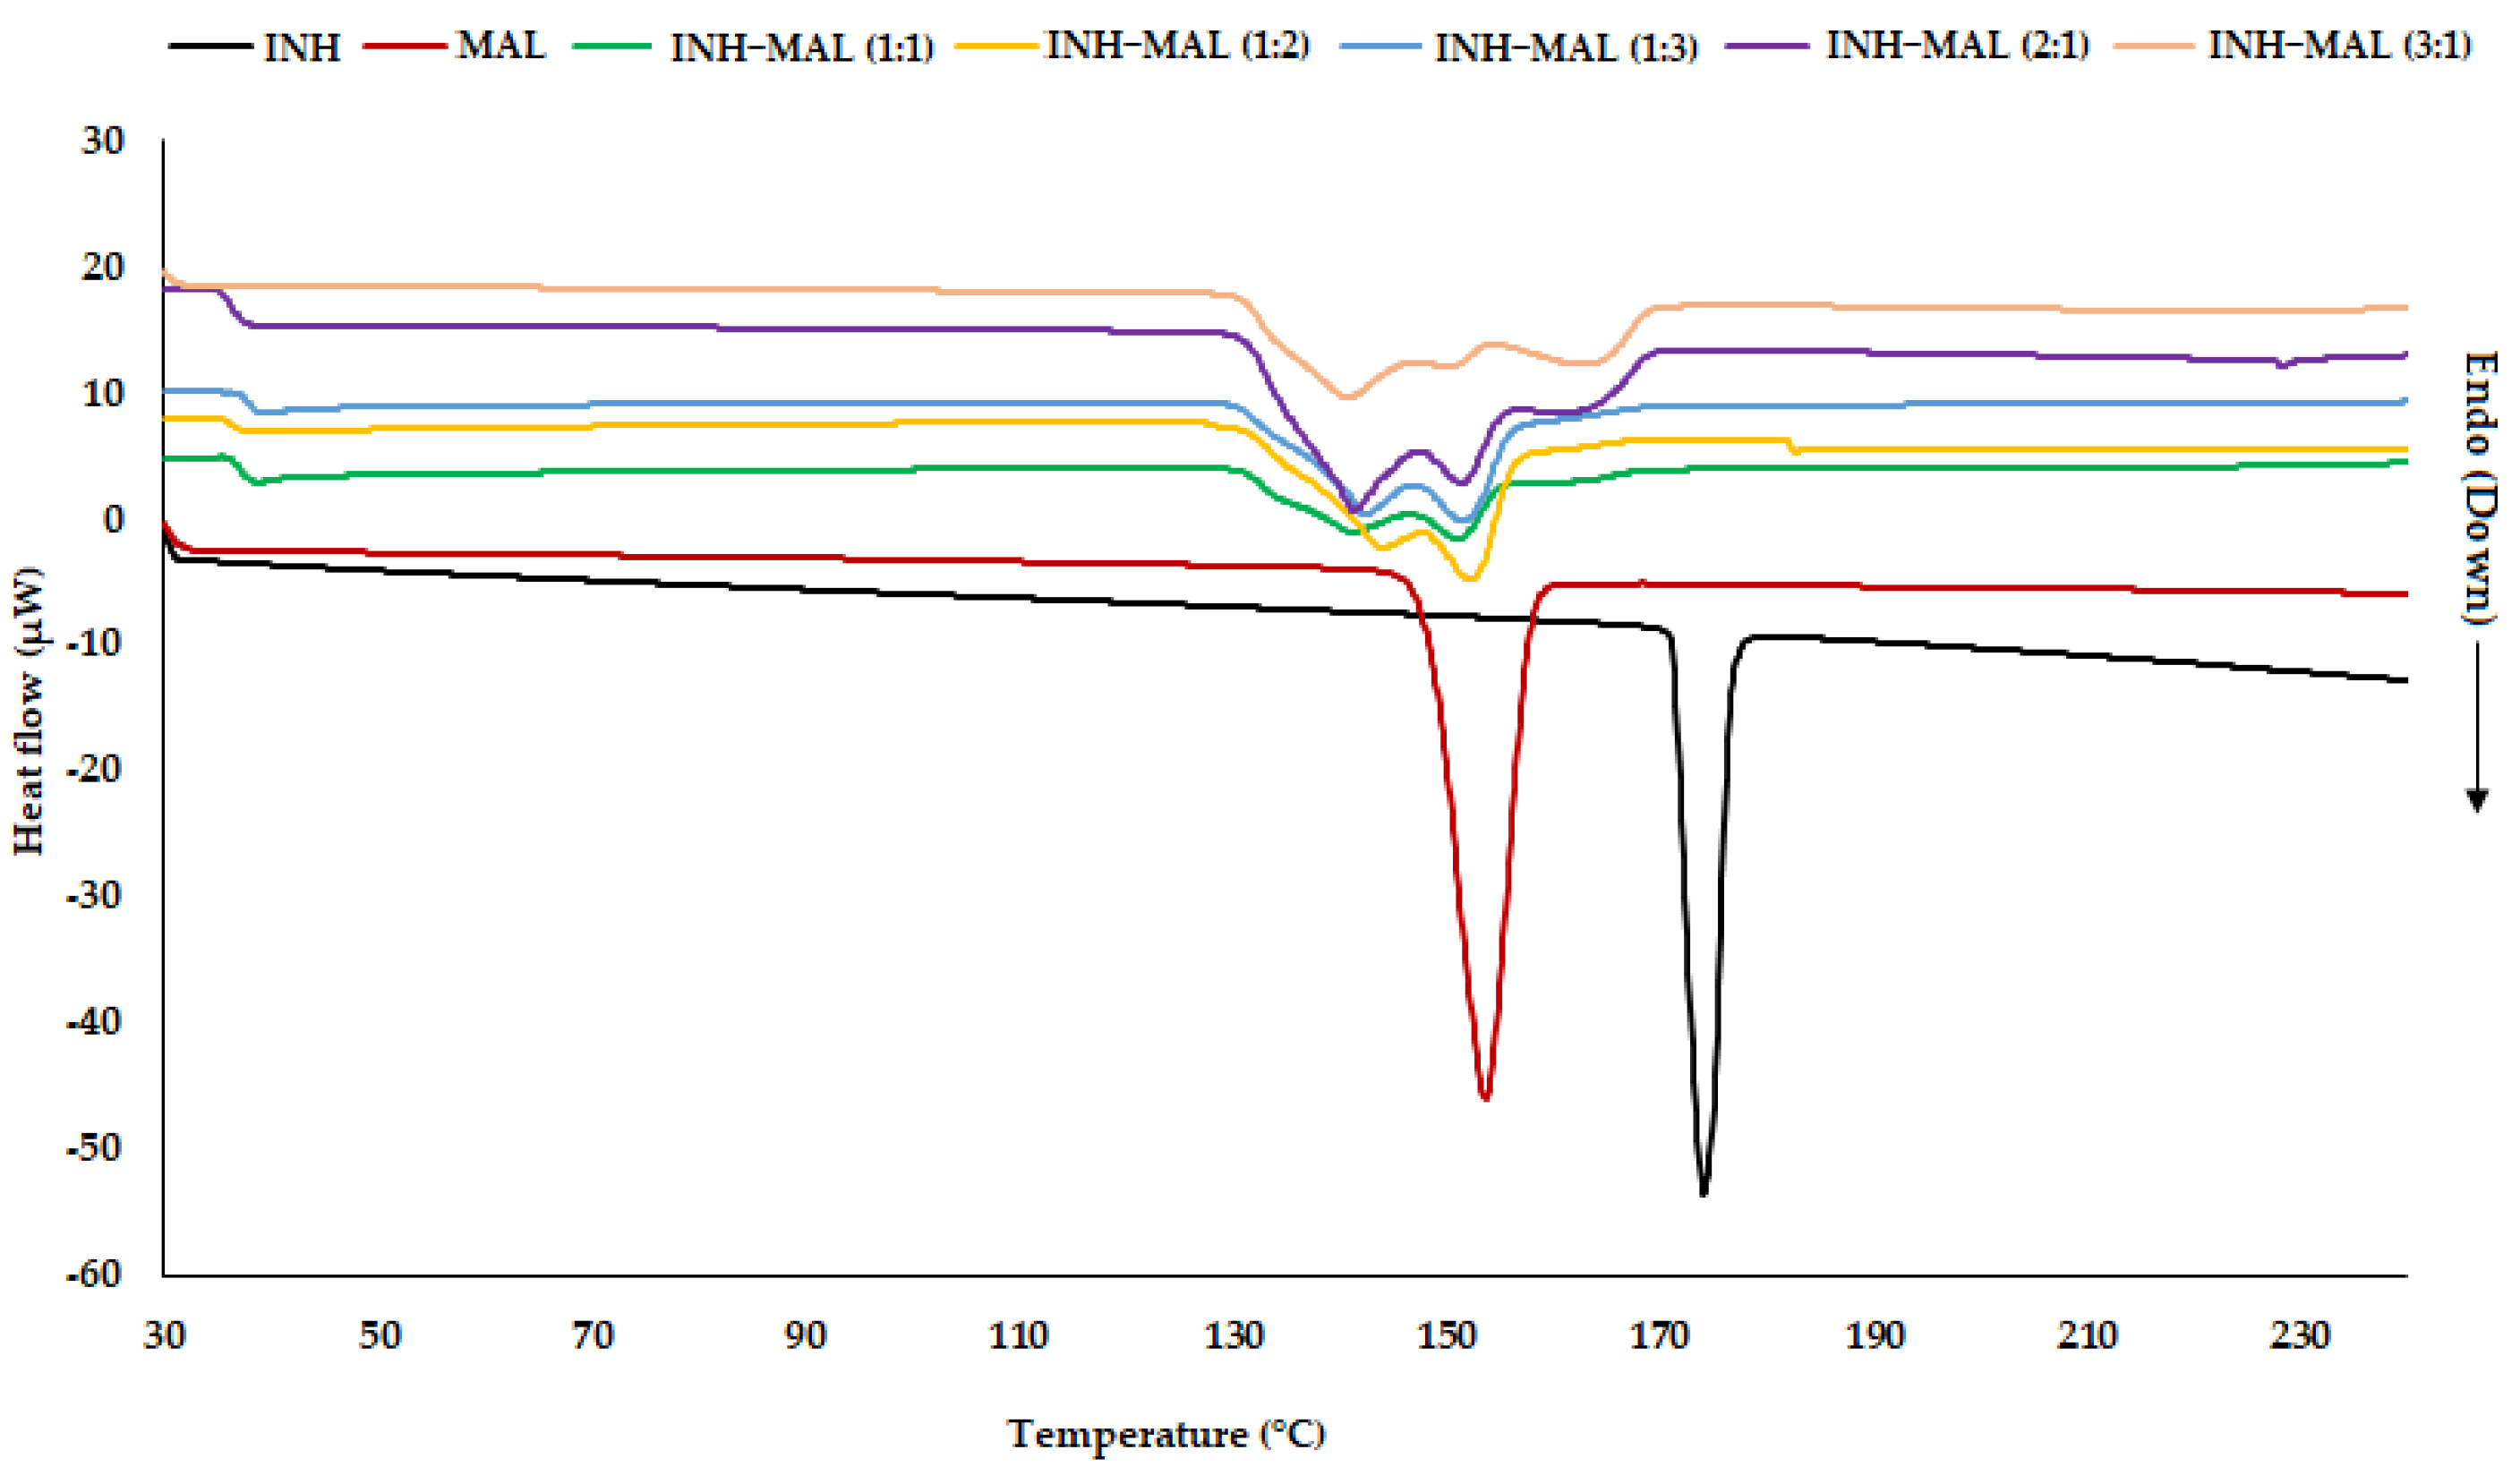
3.2.1. Thermal Analysis

The INH–MAL SDs were prepared by cooling the molten INH–MAL samples at room temperature until solidified. DSC analyses of the prepared INH–MAL SDs (Figure 4) showed varying results, with a glass transition (Tg) visible for INH–MAL (1:1) SD, INH–MAL (1:2) SD, INH–MAL (1:3) SD, and INH–MAL (3:1) SD at 56.00 °C, 49.33 °C, 49.83 °C, and 46.50 °C, respectively. For INH–MAL (2:1) SD, no discernible Tg was observed. Interestingly, a broad exotherm signifying a recrystallization event was observed for INH–MAL (1:1) SD, INH–MAL (2:1) SD, and INH–MAL (3:1) SD, with melting points observed at 86.17 °C, 68.50 °C, and 65.00 °C, respectively. No clear recrystallization thermal event was observed for INH–MAL (1:2) SD and INH–MAL (1:3) SD.
A shift in the peak melting temperature (Tm) was also observed in all the prepared SDs with melting temperatures in the following order: INH–MAL (1:1) SD < INH–MAL (1:2) SD < INH–MAL (1:3) SD < INH–MAL (2:1) SD < INH–MAL (3:1) SD, with the peak melting temperature of INH–MAL (1:1) SD quantified as 130.00 °C versus 154.66 °C for INH–MAL (3:1) SD. Interestingly, although recrystallization of the SDs was observed during sample heating, the observed melting temperatures were still significantly lower in comparison with pure MAL (153.50 °C) and pure INH (174.33 °C), respectively (Figure 2), thereby suggesting a molecular interaction between INH and MAL resulting in the recrystallization of a lower melting point solid-state form consisting of INH–MAL. The recrystallization of the SDs was investigated through HSM, and the resulting micrographs are depicted in Figure 5.
INH–MAL (1:1) SD exhibited a clear amorphous-like habit with no INH or MAL crystals visible post-preparation. Upon visual observation, it was concluded that INH and MAL, through the fusion method, probably formed a co-amorphous solid-state form. During the heating of this prepared SD, the Tg was observed at ~51 °C. This was signified by a loss in the glassy, hard state to a clearly soft, pliable state, identified by the red arrow in Figure 5a. Recrystallization of the INH–MAL (1:1) SD was observed at ~80 °C and was observed as opaque parts in the analyzed sample; however, it was noted that recrystallization did not occur throughout the whole sample and that it remained localized to regions within the overall sample, indicating the possible formation of a two-phase discontinuous solid dispersion. The recrystallized crystals were also noted to be very fine, needle-shaped, and with an almost feathery appearance. The thermal behavior observed for the INH–MAL (1:1) SD compared well with the DSC data reported in Figure 4.
For the INH–MAL (1:2) SD, a Tg was observed at ~60 °C, with very small recrystallized sections forming at ~130 °C, followed by almost immediate melting until complete melting was observed at ~130 °C (Figure 5b). This thermal behavior was significantly different from that observed with the INH–MAL (1:1) ratio SD, and here, it was hypothesized that the INH–MAL (1:2) ratio allows the formation of a single-phase (continuous) solid dispersion. A similar phenomenon was observed for INH–MAL (1:3) SD (Figure 5c), with a distinct Tg observed at ~58 °C. A very small recrystallized section of feathery habit crystals was observed at ~105 °C, followed by melting at 131.2 °C, and complete melting was observed at ~157 °C.
Contrary to these observations, the SDs prepared from the INH–MAL (2:1) and INH–MAL (3:1) PMs, as depicted in Figure 5d,e, showed opaque appearances immediately after preparation, which became more opaque during heating until ~70–80 °C, followed by distinct melting behavior, which correlated well with the melting temperature of pure INH (Figure 2 and Figure 3).

3.2.2. FTIR Analysis

Figure 6 exhibits the FTIR spectra obtained for INH, MAL, and the prepared SDs. The characteristic absorption peaks in the range of 3380–3257 cm−1 signify the O-H stretching and C-H stretching functional groups of the molecular structure of MAL (Figure 1b). In comparison with the prepared SDs, significant peak broadening was observed in this wavenumber range (Figure 6a), which could be an indication of the amorphization of MAL. The absorption peak at 3297 and 3098 cm−1 observed for pure INH is indicative of N-H stretching and C-H stretching (Figure 1a). For INH–MAL (2:1) and INH–MAL (3:1), the absorption peak at 3098 cm−1 was noted to be slightly intensified (Figure 6b), whilst for INH–MAL (1:1), INH–MAL (1:2), and INH–MAL (1:3), this peak disappeared completely, thereby suggesting that INH amorphization occurred in these SDs but not in the two SDs containing a higher molar ratio of INH. The absorption band at 2924 cm−1 (Figure 6c) observed for pure MAL also showed broadening, especially in INH–MAL (1:1), INH–MAL (1:2), and INH–MAL (1:3). The peak broadening signifies the amorphization of MAL. The absorption band at 1735 cm−1 observed for pure INH (Figure 6d), signifying C=O stretching, completely diminished in all the SDs. Hydrogen bonding to a carbonyl group lengthens the C=O bond and, as a result, lowers the absorption frequency. Due to various absorbance bands at lower frequencies than 1735 cm−1, it is not possible to identify to which frequency this vibration shifted. It is, however, hypothesized that due to the observed shift, hydrogen bonding between the hydroxyl group of the MAL and the carbonyl group attached to the primary amine of INH could have occurred. A similar hypothesis was presented for SDs of carbamazepine (CBZ), where intermolecular hydrogen bonding formed between the hydroxyl group of the lactose and the carbonyl group of the CBZ attached to the primary amide [24,25].

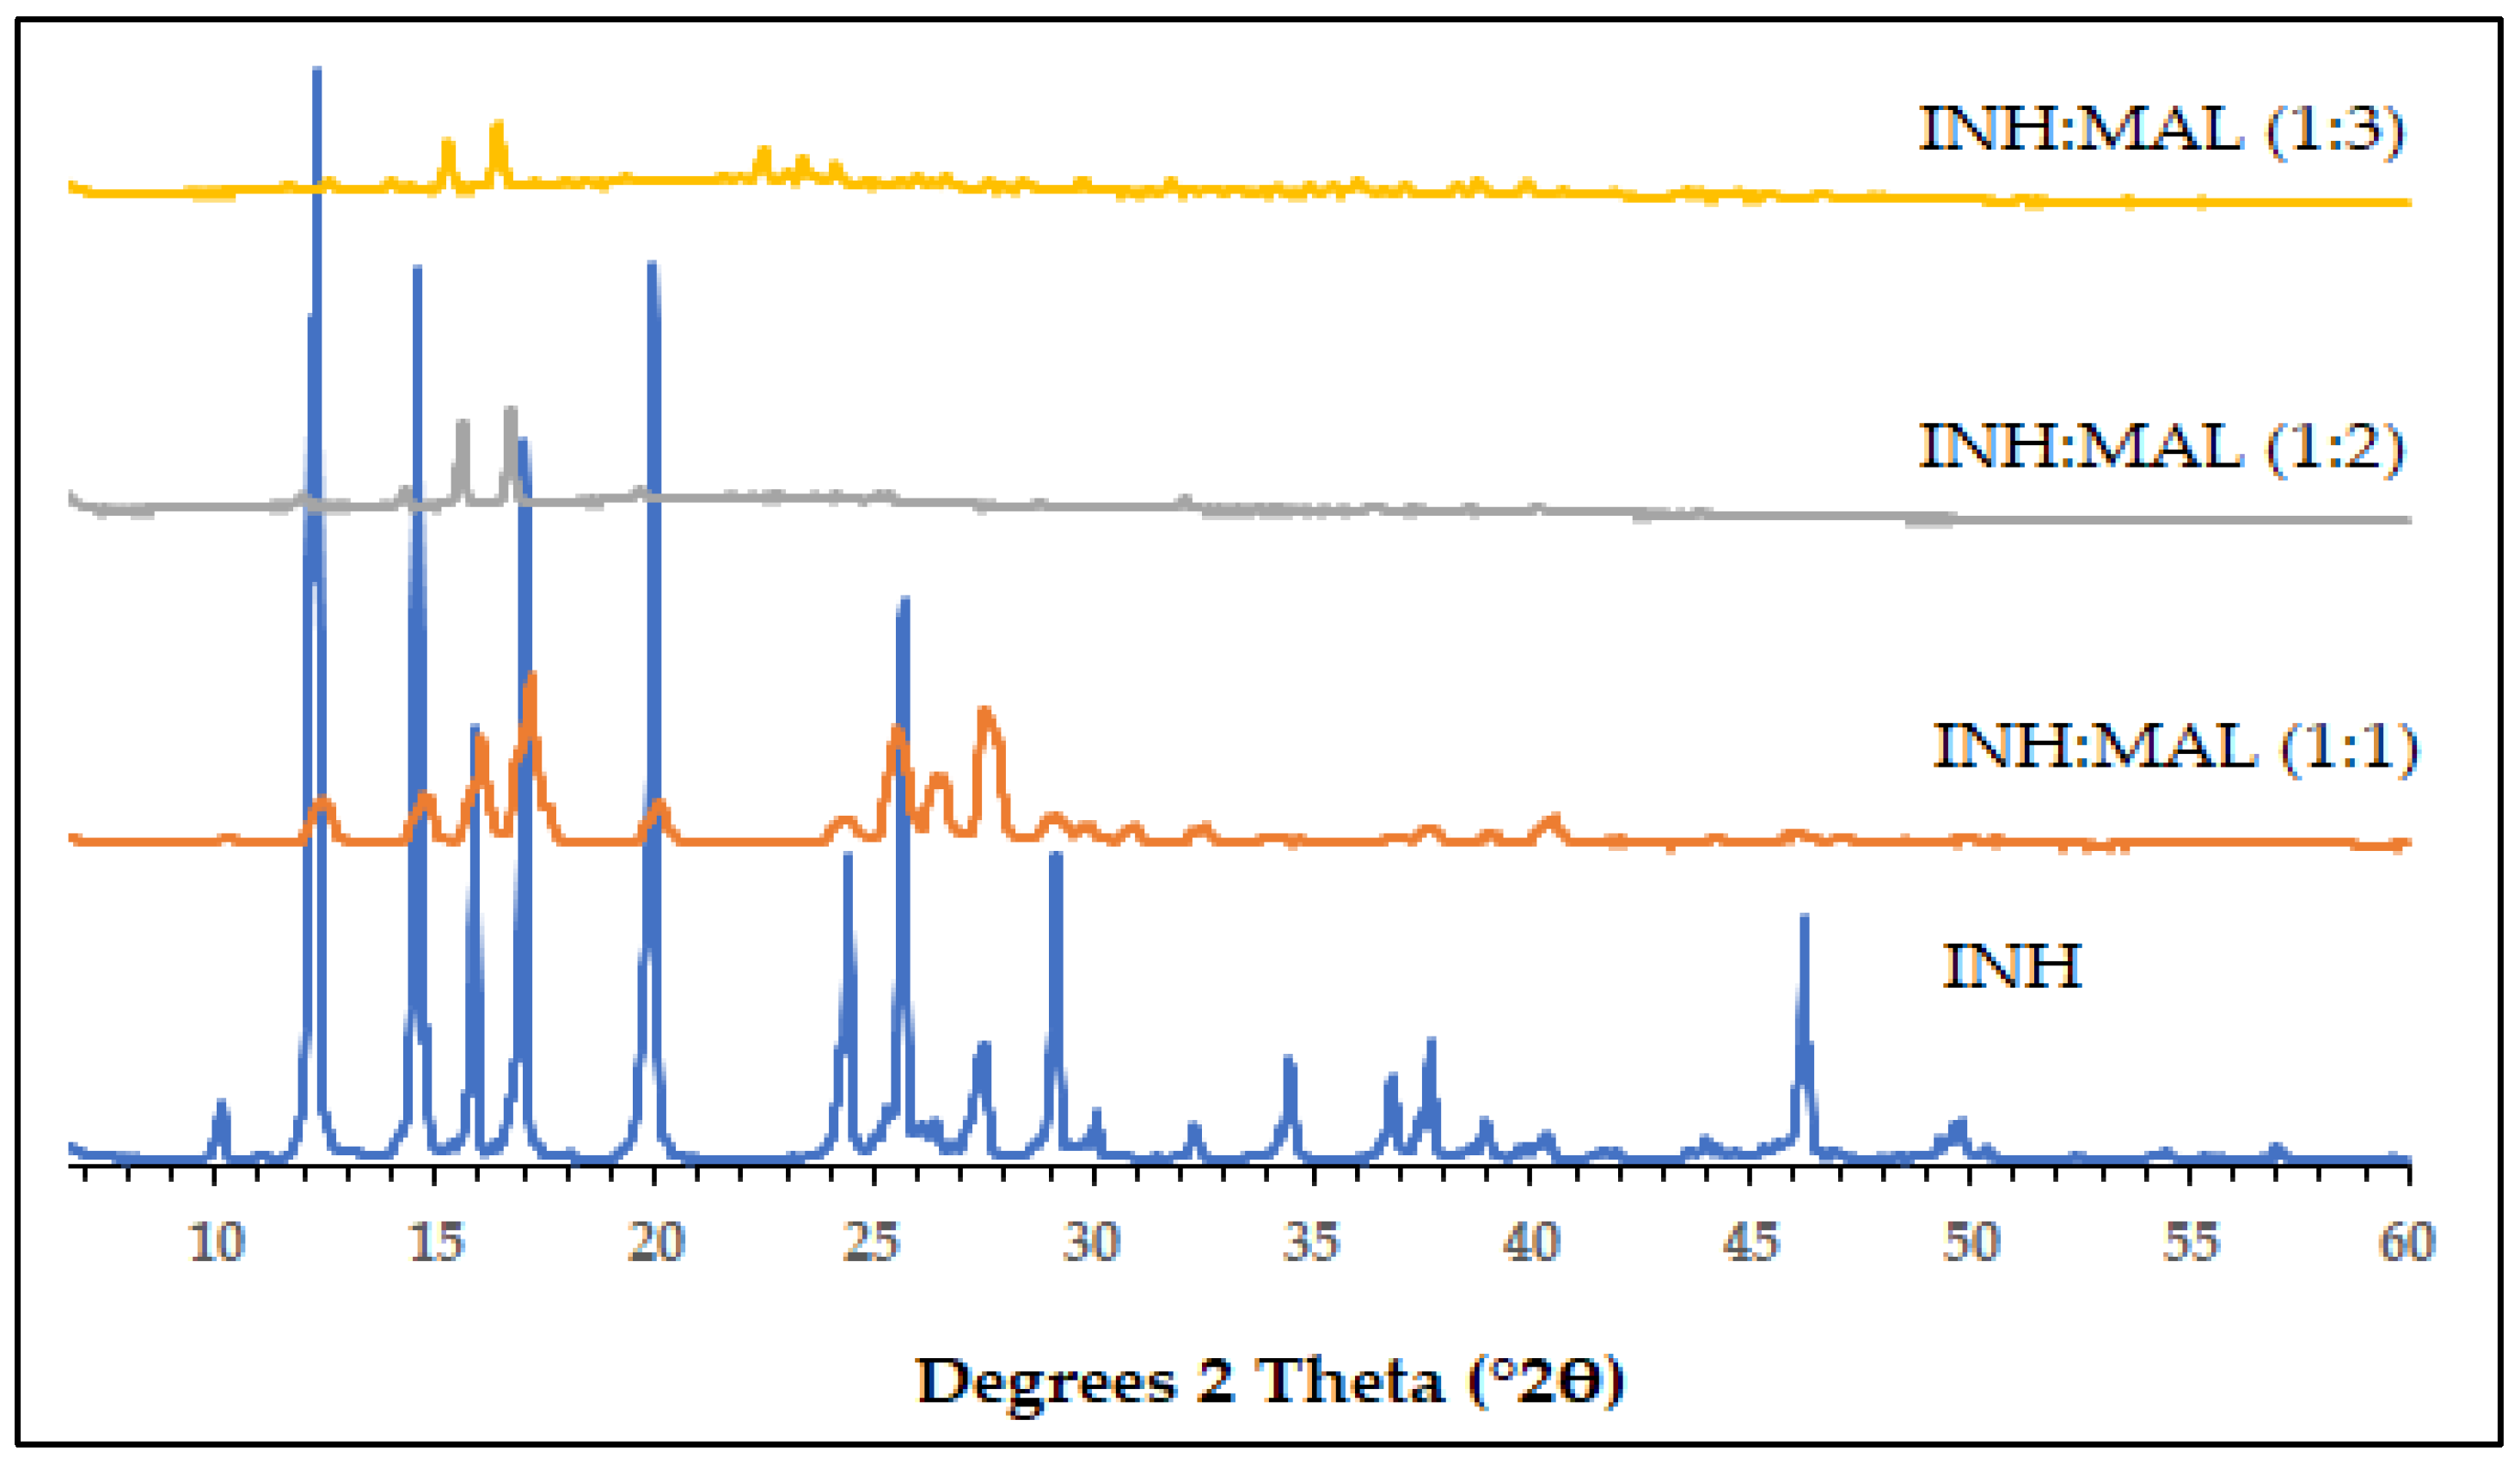
3.2.3. PXRD Analysis
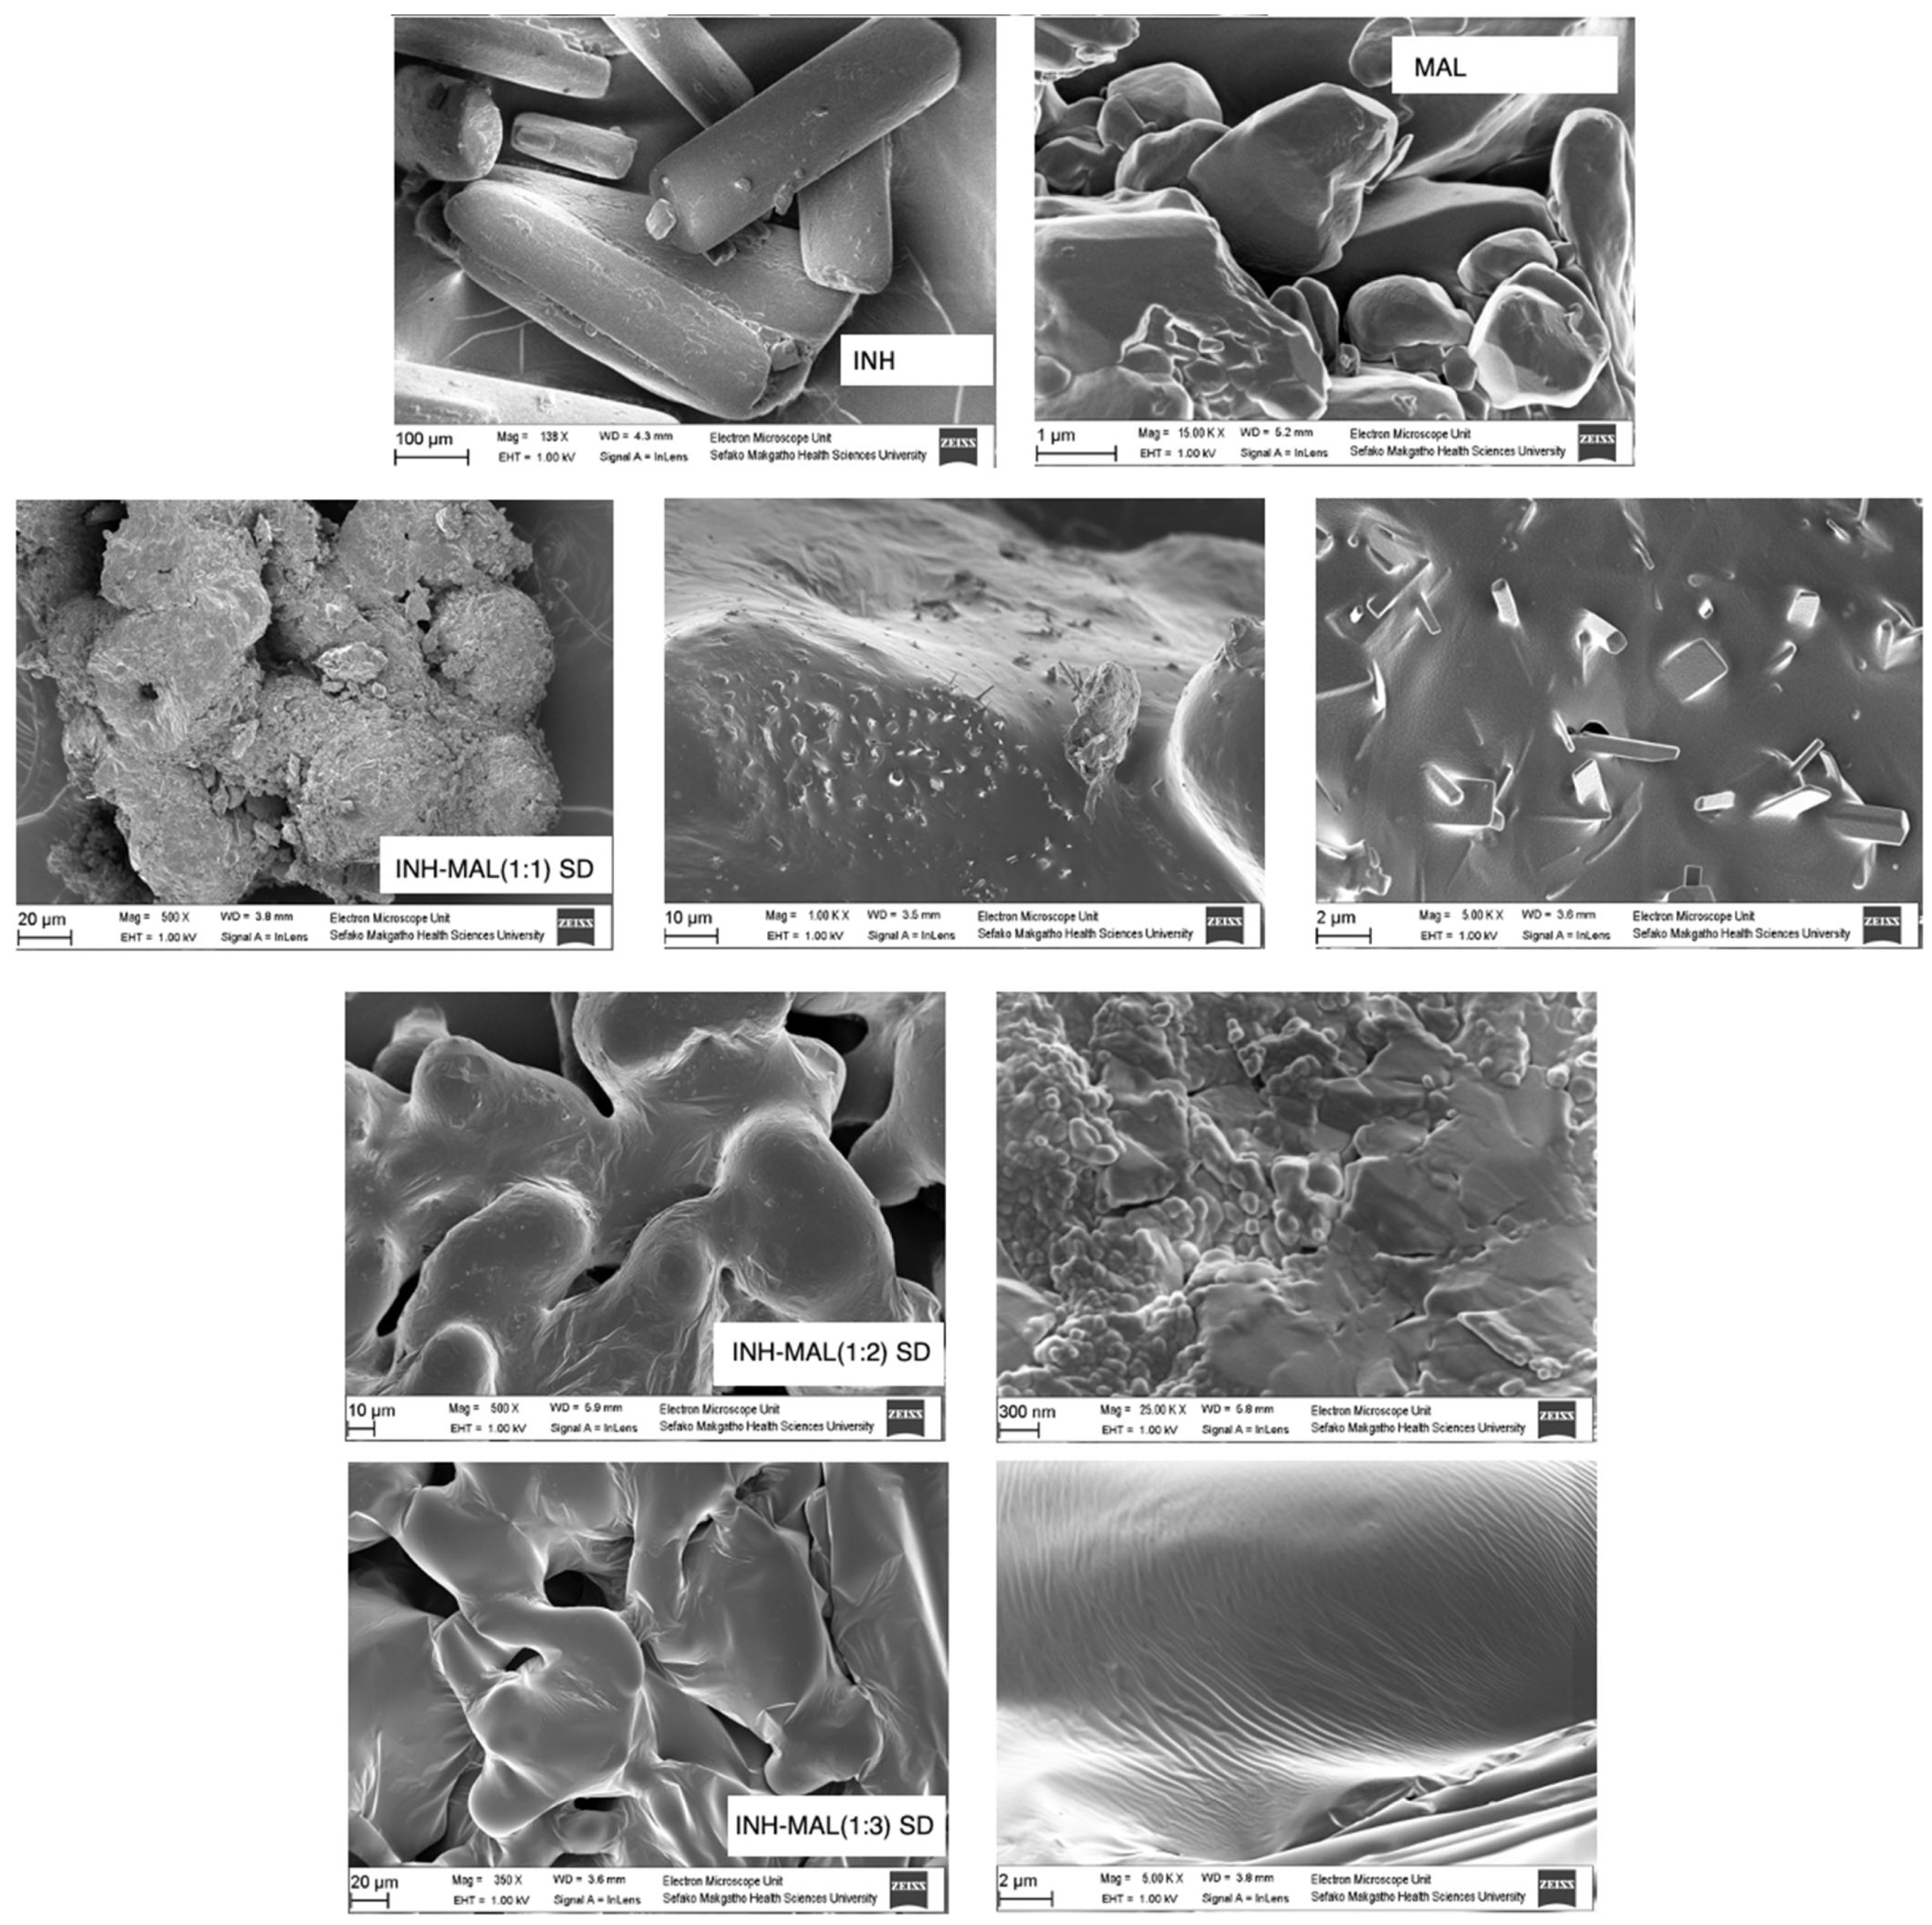
The INH PXRD pattern exhibits several characteristic peaks at 2θ between 10 to 50° (peaks at 2θ = 10.2, 12,3, 14.6, 15.9, 16.9, 20.3, 24.3, 25.7, 26.9, 29.1, and 46.1°). The calculated PXRD values from the experiment correspond to the reported work [20]. The calculated values further confirm that it is INH polymorph I [26]. The MAL PXRD showed several peaks of low intensity with three major peaks at 23.47, 28.96, and 33.73°2θ. From PXRD analysis, the INH–MAL (3:1) SD sample, as depicted in Figure 7, showed diffraction peaks at 12.16, 14.52, 15.82, 16.85, 19,79, 24.11, 25.33, 26.13, 27.47, 29.07, 30.76, and 32.39°2Ɵ, which corresponds with the characteristic diffraction peaks observed for pure INH. Although diffused and significantly lower intensity diffraction peaks were observed for the INH–MAL (2:1), it was concluded that these broad diffraction peaks were attributed to INH, suggesting incomplete amorphization of the drug in combination with MAL. The PXRD pattern for the SD prepared in the equimolar ratio resembled a typical amorphous halo. However, a very close look at the diffractogram indicated the presence of one of the INH characteristic peaks (peak at 2θ = 27.6°) at a very low intensity. However, the SDs with higher MAL ratios exhibited completely diffused PXRD diffractograms, with the typical amorphous halo observed for INH–MAL (1:2) and INH–MAL (1:3). It was therefore deduced that higher molar concentrations of MAL facilitate amorphization of both compounds due to the absence of diffraction peak characteristics for both INH and MAL. On the other hand, incomplete amorphization was observed in the SDs containing higher molar ratios of INH. These results are also substantiated by the obtained FTIR results (Figure 6).

3.2.4. SEM Analysis

In order to gain a better understanding of the particle morphology of the resulting SDs and confirm the amorphous habit as established from PXRD analysis (Figure 7), SEM analysis was conducted. Since only INH–MAL (1:1), INH–MAL (1:2), and INH–MAL (1:3) showed promising indications of formed SDs, it was decided that only these three samples would be investigated further. Figure 8 depicts the observed morphology for INH, which is signified by a tetragonal columnar particle shape, whilst the particle morphology observed for MAL appeared irregularly angular. An SEM micrograph obtained at 500× magnification revealed an irregular, amorphous morphology with particles appearing agglomerated. When the same sample was observed at 1000× magnification, small columnar particles protruding from a smooth amorphous structure were observed. Upon viewing the sample at a higher magnification of 5000×, the definitive tetragonal columnar INH particles were clearly identified as embedded in the amorphous MAL matrix. These observations are in good correlation with the PXRD data (Figure 7), where INH is crystallized in the INH–MAL (1:1) SD matrix, subsequently exhibiting significantly smaller crystallites in comparison with INH raw material. This was apparent from the pure INH particles showing particle size significantly greater than 100 µm, in comparison with the INH particles in the MAL matrix (1:1) showing particles of 2 µm and larger. The SEM micrographs observed for INH–MAL (1:2) SD and INH–MAL (1:3) SD showed complete amorphous morphology, which is in agreement with FTIR (Figure 6) and PXRD data (Figure 7), thus indicating that complete amorphization of INH and MAL is dependent on the molar ratio of the two compounds.

3.2.5. Equilibrium Solubility Testing

INH content in the SDs was found to be close to 100%, ranging between 98.22 ± 0.59 and 101.54 ± 1.54 (%). The equilibrium solubility of INH, when incorporated into INH–MAL PMs and INH–MAL SDs, was investigated and compared with the equilibrium aqueous solubility of pure INH. Table 1 outlines the INH aqueous solubility results. The aqueous solubility of INH improved when combined with MAL in 3:1, 2:1, and 1:1 molar ratios as PMs, but when combined in PMs consisting of higher MAL concentrations (1:2 and 1:3), lower INH solubility was observed. This phenomenon is explained based on the extremely high solubility of MAL in water (175% w/w) [18]; therefore, more MAL solubilizes quicker, thereby saturating the fixed volume used for solubility testing and, thus, affecting INH, with a lower aqueous solubility in comparison with MAL. For all INH–MAL SDs, an increase in INH solubility was observed, with the most significant increase (p = 0.016; p < 0.05) observed with the INH–MAL (1:1) SD.
INH–MAL (1:1) was characterized as a two-phase, discontinuous solid dispersion, whilst INH–MAL (1:2) and INH–MAL (1:3) were characterized as one-phase (molecular), continuous solid dispersions. Based on this, it was hypothesized that the latter two solid dispersions would exhibit the highest aqueous solubility in comparison with INH–MAL (1:1); however, the contrary was observed. The same trend was, however, also observed with the INH–MAL PMs, where an increase in the MAL concentration resulted in a decrease in INH solubility compared to that quantified for the INH–MAL (1:1) SD. This was attributed to the increase in viscosity of the solutions due to an increase in MAL concentration but also based on the higher and quicker solubility of MAL in comparison with INH, as described above. A slight decrease in solubility was observed for all the SDs (Figure 9) after 2 h, indicating possible recrystallization of the INH. To note, samples for INH–MAL (1:3) SD at 1440 min could not be analyzed due to high viscosity and difficulties with filtering the sample. To understand the phenomenon of the decrease in solubility, insoluble residues were collected at the end of the solubility test and analyzed using PXRD.
The solid residues were retrieved by subjecting the solubility samples to centrifugation at 13,000× g RPM for 1 min. Subsequently, supernatants were discarded, and solid residues were dried at ambient temperature and analyzed with PXRD [27]. From the figure depicted below (Figure 10), some of the characteristic peaks of INH could be seen among the residues studied. While the INH–MAL (1:1) SD presented most of the characteristic peaks (peaks at 2θ = 10.4, 12,6, 14.9, 16.1, 17.2, 20.2, 24.6, 25.6, 26.6, 27.6, and 29.3), the 1:2 (peaks at 2θ = 12.0, 14.3, 15.6, 16.7, and 19.8) and 1:3 (peaks at 2θ = 12.6, 15.4, 16.5, and 24.2) SDs also presented some of the characteristic peaks at a very low intensity. These observations confirm the recrystallization of INH during solubility, indicating the sensitivity of these SDs to moisture. Although exposed to a high level of moisture during solubility testing, the recrystallization of INH in the analyzed solubility residues could potentially suggest recrystallization of INH when exposed to high levels of humidity during storage, an aspect that would need further investigation under the International Council for Harmonization (ICH) conditions for stability [28].

3.3. INH Permeability Testing through Parallel Artificial Membrane Permeation (PAMPA) Assay

Based on the aqueous equilibrium solubility quantified for INH when combined with MAL, either as PMs or SDs, it was considered important to determine the effect that the combinations and SDs could have on INH permeability. The membrane permeation of INH was subsequently determined utilizing the well-known PAMPA assay [29]. Though the permeation enhancement could only be seen after 240 min, the positively affected MAL concentration is higher than INH for both SDs. The SDs improve the passive permeation of INH, with the final Pe value as 9.9 ± 0.37 × 10⁻⁶ cm/s for INH–MAL (1:1) SD, 9.2 ± 0.26 × 10⁻⁶ cm/s for INH–MAL (1:2) SD, and 7.5 ± 0.18 × 10⁻⁶ cm/s for INH–MAL (1:3) SD, in comparison with the INH bulk 5.4 ± 0.07 × 10⁻⁶ cm/s (Figure 11). A required recovery of >80% was achieved for all the samples tested, which confirms the reliability of the results, and an acceptable in vitro prediction is obtained [2].
Except for INH–MAL (1:1) PM, the permeation enhancement was found to be significantly higher (p < 0.01) for INH–MAL PMs and SDs of 1:1, 1:2, and 1:3. Interestingly, permeation enhancement by PMs increased with increasing MAL concentration, and though insignificant, an opposite trend was observed for SDs. To note, both PMs and SDs with MAL concentration less than INH showed significantly lower permeability (See Table 2).

4. Conclusions

This study investigated the potential of MAL to be used as an SD carrier for the BCS Class I/III drug, INH. Furthermore, the ability of MAL to enhance drug solubility and, potentially, membrane permeation after oral administration was explored. Thermal analysis showed that PMs of INH and MAL in varying molar ratios possess some level of miscibility. However, the higher the molar ratio of INH, the less compound miscibility was observed. The preparation of SDs using the well-known fusion method followed by cooling of the molten samples to room temperature proved to be successful. During the physicochemical characterization of the prepared SDs, PXRD analyses exhibited the typical amorphous halo that is considered characteristic of co-amorphous solid-state forms. The same conclusion was made during the interpretation of FTIR results, which indicated peak broadening and diminished absorption bands for INH, thereby suggesting that INH and MAL were co-amorphized during the fusion method. DSC analysis substantiated this conclusion; however, both HSM and SEM studies proved that INH was not completely amorphized in all the prepared SDs but rather that through the fusion method, and depending on the MAL concentration, either a one- or two-phase SD could be prepared. Complete amorphization of both INH and MAL was observed in the INH–MAL (1:2) SD and INH–MAL (1:3) SD, but in the INH–MAL (1:1) SD, small crystallites isolated as metastable drug-rich phases were identified. Microscopy revealed that these drug-rich phases consisted of very fine crystallites, thereby positively affecting INH solubility and membrane permeation by having significantly reduced-size drug particles embedded into an amorphous carrier matrix. The information gained from this study could have a mentionable impact on future formulations of INH in which the dose may be reduced based on not only the enhancement of the aqueous solubility but also the membrane permeation thereof when in combination with MAL. Since MAL is considered safe for use in older adults, diabetic patients, and children, its combination with INH could change the formulation options currently available for these vulnerable patient groups.

Author Contributions

Conceptualization, M.S.P., M.A., M.M. and A.W.; methodology, M.S.P., M.A. and M.M.; formal analysis, M.S.P. and M.A.; investigation, M.S.P. and M.A.; resources, M.S.P.; data curation, M.S.P. and M.A.; writing—original draft preparation, M.S.P. and M.A.; writing—review and editing, M.S.P., M.A., M.M. and A.W.; supervision, M.A., M.M. and A.W. All authors have read and agreed to the published version of the manuscript.

Funding

This research received no external funding.

Institutional Review Board Statement

Not applicable.

Informed Consent Statement

Not applicable.

Data Availability Statement

The data collected in this study are presented and available in this article.

Conflicts of Interest

The authors declare no conflict of interest.

References

  1. Becker, C.; Dressman, J.; Amidon, G.; Junginger, H.; Kopp, S.; Midha, K.; Shah, V.; Stavchansky, S.; Barends, D. Biowaiver Monographs for Immediate Release Solid Oral Dosage Forms: Isoniazid. J. Pharm. Sci. 2007, 96, 522–531. [Google Scholar] [CrossRef] [PubMed]
  2. European Medicines Agency. ICH Guideline M9 on Biopharmaceutics Classification System Based Biowaivers; European Medicines Agency: Amsterdam, The Netherlands, 2018; Volume 44. [Google Scholar]
  3. Isoniazid. In Handbook of Anti-Tuberculosis Agents; Elsevier: Amsterdam, The Netherlands, 2008; Volume 88, pp. 112–116. Available online: https://www.sciencedirect.com/science/article/pii/S1472979208700118?via%3Dihub (accessed on 26 August 2023).
  4. Hebbink, G.A.; Dickhoff, B.H.J. Application of Lactose in the Pharmaceutical Industry. In Lactose: Evolutionary Role, Health Effects, and Applications; Elsevier Inc.: Amsterdam, The Netherlands, 2019; pp. 175–229. ISBN 9780128117200. [Google Scholar]
  5. França, M.; Martins Marcos, T.; Costa, P.F.; Bazzo, G.; Nicolay Pereira, R.; Gerola, A.; Stulzer, H. Eutectic Mixture and Amorphous Solid Dispersion: Two Different Supersaturating Drug Delivery System Strategies to Improve Griseofulvin Release Using Saccharin. Int. J. Pharm. 2022, 615, 121498. [Google Scholar] [CrossRef] [PubMed]
  6. Williams, H.D.; Trevaskis, N.L.; Charman, S.A.; Shanker, R.M.; Charman, W.N.; Pouton, C.W.; Porter, C.J.H. Strategies to Address Low Drug Solubility in Discovery and Development Strategies to Address Low Drug Solubility in Discovery and Development. Pharmacol. Rev. 2013, 65, 315–499. [Google Scholar] [CrossRef] [PubMed]
  7. Tran, T.T.D.; Tran, P.H.L. Molecular Interactions in Solid Dispersions of Poorly Water-Soluble Drugs. Pharmaceutics 2020, 12, 745. [Google Scholar] [CrossRef] [PubMed]
  8. Huang, R.; Han, J.; Wang, R.; Zhao, X.; Qiao, H.; Chen, L.; Li, W.; Di, L.; Zhang, W.; Li, J. Surfactant-Free Solid Dispersion of BCS Class IV Drug in an Amorphous Chitosan Oligosaccharide Matrix for Concomitant Dissolution in Vitro–Permeability Increase. Eur. J. Pharm. Sci. 2019, 130, 147–155. [Google Scholar] [CrossRef] [PubMed]
  9. Vasconcelos, T.; Prezotti, F.; Araújo, F.; Lopes, C.; Loureiro, A.; Marques, S.; Sarmento, B. Third-Generation Solid Dispersion Combining Soluplus and Poloxamer 407 Enhances the Oral Bioavailability of Resveratrol. Int. J. Pharm. 2021, 595, 120245. [Google Scholar] [CrossRef]
  10. Panizzon, G.P.; Bueno, F.G.; Ueda-Nakamura, T.; Nakamura, C.V.; Dias Filho, B.P. Manufacturing Different Types of Solid Dispersions of BCS Class Iv Polyphenol (Daidzein) by Spray Drying: Formulation and Bioavailability. Pharmaceutics 2019, 11, 492. [Google Scholar] [CrossRef]
  11. Narula, A.; Sabra, R.; Li, N. Mechanisms and Extent of Enhanced Passive Permeation by Colloidal Drug Particles. Mol. Pharm. 2022, 19, 3085–3099. [Google Scholar] [CrossRef]
  12. Andrews, G.P.; Qian, K.; Jacobs, E.; Jones, D.S.; Tian, Y. High Drug Loading Nanosized Amorphous Solid Dispersion (NASD) with Enhanced in Vitro Solubility and Permeability: Benchmarking Conventional ASD. Int. J. Pharm. 2023, 632, 122551. [Google Scholar] [CrossRef]
  13. Lenhart, A.; Chey, W.D. A Systematic Review of the Effects of Polyols on Gastrointestinal Health and Irritable Bowel Syndrome. Adv. Nutr. 2017, 8, 587–596. [Google Scholar] [CrossRef]
  14. Grembecka, M. Sugar Alcohols. In Encyclopedia of Food Chemistry; Elsevier: Amsterdam, The Netherlands, 2018; pp. 265–275. ISBN 9780128140451. [Google Scholar]
  15. Embuscado, M.E. Polyols. In Optimising Sweet Taste in Foods; Spillane, W.J., Ed.; Woodhead Publishing: Sawston, UK, 2006; pp. 153–174. ISBN 9781845690083. [Google Scholar]
  16. Priya, K.; Gupta, V.R.M.; Srikanth, K. Natural Sweeteners: A Complete Review. J. Pharm. Res. 2011, 4, 2034–2039. [Google Scholar]
  17. Krishnamoorthy, V.; Priya, V.; Prasad, R. Physicochemical Characterization and in Vitro Dissolution Behavior of Olanzapine-Mannitol Solid Dispersions. Braz. J. Pharm. Sci. 2012, 48, 243–255. [Google Scholar] [CrossRef]
  18. Kearsley, M.W.; Deis, R.C. Maltitol Powder. In Sweeteners and Sugar Alternatives in Food Technology; Wiley: Hoboken, NJ, USA, 2012; pp. 295–308. ISBN 9780470659687. [Google Scholar]
  19. Bourduche, F.; Sanchez-Ballester, N.M.; Bataille, B.; Lefèvre, P.; Sharkawi, T. Structure-Property Relationship of Amorphous Maltitol as Tableting Excipient. AAPS PharmSciTech 2020, 21, 281. [Google Scholar] [CrossRef]
  20. Ngilirabanga, J.B.; Aucamp, M.; Pires Rosa, P.; Samsodien, H. Mechanochemical Synthesis and Physicochemical Characterization of Isoniazid and Pyrazinamide Co-Crystals with Glutaric Acid. Front. Chem. 2020, 8, 595908. [Google Scholar] [CrossRef]
  21. Medarević, D.; Djuriš, J.; Barmpalexis, P.; Kachrimanis, K.; Ibrić, S. Analytical and Computational Methods for the Estimation of Drug-Polymer Solubility and Miscibility in Solid Dispersions Development. Pharmaceutics 2019, 11, 372. [Google Scholar] [CrossRef] [PubMed]
  22. Almeida e Sousa, L.; Dömötör, K.J.; Paiva, M.; Cacela, C. Drug-Polymer Solubility Determination: A New Thermodynamic Model Free from Lattice Theory Assumptions. Pharm. Res. 2019, 36, 175. [Google Scholar] [CrossRef] [PubMed]
  23. Chavan, R.B.; Thipparaboina, R.; Kumar, D.; Shastri, N.R. Co Amorphous Systems: A Product Development Perspective Co Amorphous Systems: A Product Development Perspective. Int. J. Pharm. 2016, 515, 403–415. [Google Scholar] [CrossRef]
  24. Hirasawa, N.; Okamoto, H.; Danjo, Z. Lactose as a Low Molecular Weight Carrier of Solid Dispersions for Carbamazepine and Ethenzamide. Chem. Pharm. Bull. 1999, 3, 417–420. [Google Scholar] [CrossRef]
  25. Coates, J. Interpretation of Infrared Spectra, A Practical Approach. In Encyclopedia of Analytical Chemistry; Meyers, R.A., Ed.; John Wiley & Sons Ltd.: Chichester, UK, 2000; pp. 10815–10837. [Google Scholar]
  26. Zhang, K.; Fellah, N.; Shtukenberg, A.G.; Hu, C.; Ward, M.D. Drug Isoniazid. CrystEngComm 2020, 22, 2705–2708. [Google Scholar] [CrossRef]
  27. Shi, K.; Li, M. Optimisation of Pharmaceutical Cocrystal Dissolution Performance through a Synergistic Precipitation Inhibition. Pharm. Res. 2023, 40, 2051–2069. [Google Scholar] [CrossRef]
  28. ICH Committee. International Conference on Harmonization (ICH). Guidance for Industry: Q1A(R2) Stability Testing of New Drug Substances and Products. 2003. Available online: https://www.ema.europa.eu/en/ich-q1a-r2-stability-testing-new-drug-substances-drug-products-scientific-guideline (accessed on 26 August 2023).
  29. De Stefani, C.; Lodovichi, J.; Albonetti, L.; Salvatici, M.C.; Quintela, J.C.; Bilia, A.R.; Bergonzi, M.C. Solubility and Permeability Enhancement of Oleanolic Acid by Solid Dispersion in Poloxamers and γ-CD. Molecules 2022, 27, 3042. [Google Scholar] [CrossRef] [PubMed]
Figure 2. An overlay of the DSC thermograms obtained for pure INH, MAL, and the PMs of INH–MAL in the molar ratios of 1:1, 1:2, 1:3, 2:1, and 3:1.
Crystals 13 01568 g002
Figure 3. Micrographs obtained from HSM analyses of (a) INH, (b) MAL, (c) INH–MAL (1:1), (d) INH–MAL (1:2), (e) INH–MAL (1:3), (f) INH–MAL (2:1), and (g) INH–MAL (3:1).
Crystals 13 01568 g003
Figure 4. An overlay of the DSC thermograms obtained for the prepared SDs of INH−MAL consisting of varying INH−MAL molar ratios, with * signifying Tg and red lines signifying peak recrystallization temperatures.
Crystals 13 01568 g004
Figure 5. HSM micrographs obtained for the prepared solid dispersions INH–MAL (1:1) SD, INH–MAL (1:2) SD, INH–MAL (1:3) SD, INH–MAL (2:1) SD, and INH–MAL (3:1) SD during heating at 10 °C/min from ambient temperature until complete melting was observed.
Crystals 13 01568 g005
Figure 6. An overlay of the FTIR spectra obtained for INH and MAL in comparison with the prepared SDs of INH–MAL consisting of varying INH–MAL molar ratios, with (a) indicating the wavenumber range 3380–3257 cm-1, (b) indicating the characteristic INH absorbance band at 3098 cm−1, (c) signifying the absorption band of MAL at 2924 cm−1, and (d) highlighting the characteristic absorbance peak at 1735 cm-1 for INH.
Crystals 13 01568 g006
Figure 7. PXRD diffractograms obtained for pure INH, MAL, and the prepared SDs of INH–MAL in the molar ratios of 3:1, 2:1, 1:1, 1:2, and 1:3.
Crystals 13 01568 g007
Figure 8. SEM micrographs obtained for INH, MAL, INH–MAL (1:1), INH–MAL (1:2), and INH–MAL (1:3).
Crystals 13 01568 g008
Figure 9. Histogram comparing the equilibrium solubility of INH and INH–MAL SDs (1:1, 1:2, and 1:3) at different sampling points.
Crystals 13 01568 g009
Figure 10. Overlay of PXRD diffractograms obtained for pure INH and solid residues of INH–MAL SDs post-solubility.
Crystals 13 01568 g010
Figure 11. Effective permeability (Pe) of INH in comparison with INH permeation from INH–MAL PMs and INH–MAL SDs.
Crystals 13 01568 g011
Table 1. Summary of equilibrium solubility of INH in combination with MAL in varying molecular ratios and the equilibrium solubility of the prepared INH–MAL SDs at 37 ± 0.5 °C.
SampleEquilibrium Solubility ± SD 1 (mg/mL)Solubility Increase (%)
INH146.1 ± 2.4-
INH–MAL (3:1) PM149.7 ± 2.92.4
INH–MAL (3:1) SD163.8 ± 4.312.1
INH–MAL (2:1) PM155.3 ± 3.66.3
INH–MAL (2:1) SD188.6 ± 2.729.1
INH–MAL (1:1) PM155.9 ± 4.16.7
INH–MAL (1:1) SD345.9 ± 1.1136.8
INH–MAL (1:2) PM136.1 ± 3.9-
INH–MAL (1:2) SD252.2 ± 1.372.6
INH–MAL (1:3) PM135.5 ± 3.8-
INH–MAL (1:3) SD221.9 ± 3.051.9
1 SD denotes standard deviation.
Table 2. Mean Pe values of INH and INH–MAL PMs and SDs with varying molar ratios.
SampleMean Pe ± S.D
at 480 min
(10−6 cm/s)
Mean Pe ± S.D
at 960 min
(10−6 cm/s)
Mean Pe ± S.D
at 1440 min
(10−6 cm/s)
p-ValueRecovery (%)
INH3.8 ± 2.165.5 ± 0.075.4 ± 0.07-80.0 ± 1.37
INH–MAL (1:1) PM5.0 ± 0.094.9 ± 0.745.9 ± 0.010.2895.0 ± 0.71
INH–MAL (1:1) SD7.1 ± 0.269.7 ± 2.269.9 ± 0.370.00193.7 ± 0.71
INH–MAL (1:2) PM4.5 ± 0.088.1 ± 1.538.2 ± 0.010.00288.1 ± 0.77
INH–MAL (1:2) SD5.3 ± 1.949.4 ± 0.409.2 ± 0.260.00191.1 ± 0.70
INH–MAL (1:3) PM2.1 ± 0.397.1 ± 1.599.7 ± 0.280.00183.4 ±1.28
INH–MAL (1:3) SD4.6 ± 1.807.5 ± 1.057.5 ± 0.180.00783.5 ± 0.62
INH–MAL (2:1) PM2.1 ± 0.255.3 ± 0.253.6 ± 0.090.01182.1 ± 0.45
INH–MAL (2:1) SD1.1 ± 0.113.2 ± 0.993.1 ± 0.010.004100.9 ± 0.33
INH–MAL (3:1) PM1.0 ± 0.483.2 ± 0.502.4 ± 0.020.00280.9 ± 0.30
INH–MAL (3:1) SD1.0 ± 1.012.8 ± 0.991.9 ± 0.380.00283.0 ± 0.19
Disclaimer/Publisher’s Note: The statements, opinions and data contained in all publications are solely those of the individual author(s) and contributor(s) and not of MDPI and/or the editor(s). MDPI and/or the editor(s) disclaim responsibility for any injury to people or property resulting from any ideas, methods, instructions or products referred to in the content.

