1. Introduction
Electrochemical removal of organic pollutants is a promising technology with huge possibilities for the further improvement of efficiency [
1,
2]. The introduction of innovative anode materials is one of the strategies to obtain satisfactory anode performances [
3,
4,
5], although it often results in complex and expensive solutions. Namely, the most prominent state-of-the-art anode materials include efficient but expensive boron-dopped diamond (BDD) [
6,
7,
8,
9], as well as metallic oxides and their composites [
10,
11,
12]. Although the sophisticated design undoubtedly contributes to the optimisation of performance, an electrochemical setup for depollution should also be affordable, easy to prepare, and made of economically acceptable and sustainable materials. So far, the carbon-based electrodes [
13] have shown good effectiveness for the depletion of initial pollutants in sulphate [
14,
15] and chlorine [
16,
17] electrolytes. Some investigations of composite carbon-based materials deposited on low-cost stainless steel (SS) supports as efficient anodes for electrooxidative depollution in sulphate electrolytes have been done recently in our laboratory [
18,
19,
20].
Electrochemical oxidation of dyes (either as model pollutants which can be successfully tracked by UV-Vis spectrometry, or real toxic or carcinogenic contaminants), has been the subject of numerous studies. As the common dye-factory effluents contain about 500–600 ppm of dyes, the majority of literature studies are focused on 100 ppm or higher dyes concentrations [
21,
22]. On the other hand, the electrochemical depollution of dyes in the low concentration range (up to 20 ppm) represents a challenge by itself, due to the limited precision and sensitivity of UV-Vis spectrometry as a main tracking technique. For the same reason, studies on degradation dyes mixtures [
23,
24] are scarce. However, the investigation of degradation processes in such systems is still of potential interest for application at the laboratory scale (e.g., for reliable on-site removal of indicator dyes and tracers), as well as for further fine processing of treated effluents.
When the initial pollutants are degraded, knowing the remnant degradation products and the reaction mechanism is of particular importance. In an ideal 100% effective case, OH-radical-mediated depollution results in the total mineralisation of organic pollutants up to CO
2, water, and inorganic salts [
25]. However, the degree of total mineralisation on common anodes rarely exceeds 30–40% [
26,
27]. Accordingly, avoiding the formation of undesired by-products is a particular challenge. For example, it is well known that in chlorine-based electrolytes toxicity is often increased compared to initial compounds [
28,
29,
30].
In this contribution, we provide an analysis of the performance of low-cost, easy-to-prepare composite electrodes deposited on cheap stainless steel support for the degradation of a low-concentration mixture of phenol-based dyes. A comparative investigation of electrochemical degradation of a mixture of three phenol-based dyes: bromocresol green (BCG), cresol red (CR), and thymol blue (TB), on three composite, stainless steel supported carbon/metal-oxide electrodes: GNP@SS, SnO2/GNP@SS, and TiO2/GNP@SS, has been performed. Prepared electrodes were characterised by XRD, FTIR, and electrochemical techniques (CV and LSV). The degradation kinetics of the dyes mixture was tracked by UPLC and GC-MS chromatography. The final degree of mineralisation of the initial mixture was measured by TOC analysis.
2. Materials and Methods
2.1. Anode Preparation
The preparation procedure of nanocomposite anodes (GNP@SS, SnO
2/GNP@SS and TiO
2/GNP@SS) has already been explained in detail in our previous publications [
18,
19,
20]. Commercial GNP (graphene nanoplatelets—surface area 750 m
2/g, Sigma-Aldrich, Germany, Taufkirchen), as a supporting carbon nanomaterial, and two different metal oxides (SnO
2 and TiO
2) were used. The SnO
2 particles were synthesised by the sol-gel method proposed by Kose et al. [
31] and their nano size was confirmed by TEM analysis [
19]. Commercial TiO
2 anatase powder (Sigma Aldrich, Germany, Taufkirchen) was used.
The synthesis procedure of metal oxides/carbon nanocomposites was simplified compared to [
19,
20]: by sonification for 6 h, commercial GNP and nanosize oxides were directly dispersed in dimethylformamide (DMF, Fisher Chemical, Loughborough, UK) in a ratio of 3.5: 1 (
w/
w, %). When homogenous suspension (4.5 mg/mL) was obtained, it was dripped onto the stainless steel (SS) supporting electrodes with a surface area of 2 cm
2 (1 × 2 cm). The portion of 50 µL of suspension was applied six times (300 µL in total) with drying under a 250 W IR lamp (Philips, The Netherlands, Amsterdam) between each loading. After that, the electrodes were left overnight in the oven at 60 °C. The same dispersion procedure in DMF, and anode preparation, was applied to bare commercial GNP with the difference that the concentration of prepared suspension was 2 mg/mL. For repeatability tests, prior to each use, the electrodes were washed with demineralised water and dried in the oven for at least 3 h.
2.2. Anode Characterisation
2.2.1. FTIR Analysis
FTIR spectroscopy was performed using Nicolet iS5 FTIR spectrometer (Thermo Fisher Scientific, Waltham, MA, USA). FTIR spectra were measured in the range of 4000–400 1/cm using the KBr pellet technique.
2.2.2. XRD Analysis
The X-ray diffraction measurement was performed on a PW 1050 X-ray powder diffractometer (Philips, Amsterdam, The Netherlands) using Ni-filtered Cu Kα radiation and Bragg–Brentano focusing geometry. The diffraction intensity was recorded in the range of 10–70° with a step size of 0.02° and a counting time of 3 s per step.
Sizes of TiO
2 and SnO
2 crystallites were estimated using the Scherrer equation [
32]:
where
is the mean size of the crystallite,
is a dimensionless shape-dependent constant (approximately 0.9),
is a wavelength of CuK-alpha irradiation,
is the half-value breadth of the diffracted beam, and
is Bragg’s angle.
2.2.3. Electrochemical Measurements
Electrochemical measurements were done with Gamry Instrument-Interface 1000 potentiostat/Galvanostat (Gamry Instruments, Warminster, PA, USA) at room temperature using an electrochemical cell with a three-electrode configuration. Pt and Ag/AgCl (saturated KCl) were used as counter and reference electrodes, respectively, while the working electrodes were GNP@SS, TiO2/GNP@SS, and SnO2/GNP@SS. Cyclic voltammetry (CV) and linear sweep voltammetry (LSV) were performed in 0.1 M Na2SO4 as supporting electrolytes (saturated with high purity N2 for 20 min). CV tests were performed from −1.2 to 2 V with a sweep rate of 100 mV/s. LSV was conducted from 0 to 3 V at a sweep rate of 50 mV/s.
2.3. Electrooxidative Degradation
2.3.1. Preparation of Dyes Mixture Solution
The solution to be electrooxidised using investigated electrodes was prepared by dissolving three indicator dyes in the form of powder: bromocresol green (BCG), cresol red (CR), and thymol blue (TB), in 0.1 M Na
2SO
4. The total concentration of the obtained solution, the dyes mixture, was 15 ppm: the mass concentration of each dye in the mixture was equal (5 ppm). Structural formulas of the used dyes are given in
Table 1.
2.3.2. Degradation of Dyes Mixture and 0.1 M Na2SO4
The electrooxidative degradation of the dyes mixture, a 15 ppm solution of dyes in 0.1 M Na2SO4, was studied through chronopotentiometric experiments in a two-electrode electrolytic cell: GNP@SS, SnO2/GNP@SS, and TiO2/GNP@SS were used as working electrodes, and an SS electrode was used as a counter electrode. The surface area of the electrodes was 2 cm2 (1 × 2 cm). The measurements were performed on Gamry Instrument—Interface 1000 Potentiostat/Galvanostat/ZRA06230, at room temperature at a current density of 10 mA/cm2.
Electrooxidative treatment of the electrolyte, 0.1 M Na2SO4, was performed under the same experimental conditions. In all degradation experiments, 60 mL of prepared solutions were treated for 6 h.
2.3.3. UV-Vis Characterisation
In order to establish an experimental framework, the electrolyte (0.1 M Na
2SO
4) and 15 ppm dyes mixture (solutions with 5 ppm of each dye in 0.1 M Na
2SO
4) were electrochemically treated for 150 min applying a current density of 10 mA/cm
2. UV-Vis absorption spectra of the initial solutions and the solutions obtained after the degradation at investigated electrodes are represented in the
Supplementary Material (Figures S1 and S2, respectively). The absorption spectra were recorded in the range of 200–700 nm, on UV-Vis spectrophotometer Lambda 35 (Perkin Elmer, Waltham, MA, USA). The maximum absorbance peak (at 615 nm) was used to track the decolourisation of the dyes mixture.
2.3.4. GC-MS Analysis
For GC-MS analysis, an Agilent Technologies 7890B gas chromatograph (Agilent, Santa Clara, CA, USA) coupled with a 5977 MSD mass detector was used. The gas chromatograph was equipped with a capillary column HP-5 MS Inert ((5% phenyl)-methylpolysiloxane, 30 m × 0.25 mm, film thickness 0.25 μm from Agilent Technologies). For data processing, MassHunter Qualitative analysis software from Agilent Technologies was used. Samples were prepared by derivatisation with acetic anhydride and extraction with dichloromethane. The injector was operated at 250 °C. The oven temperature was raised from 60 °C to 150 °C at a heating rate of 30 °C/minute, then, from 150 °C to 240 °C at a heating rate of 20 °C/min and isothermally held for 2 minutes, then, from 240 °C to 320 °C at a heating rate 50 °C/min and isothermally held for 5 min. A carrier gas helium at 1.0 mL/min was used. The injection volume was 1 μL and samples were injected in a splitless mode. The mass detector was operated at the ionisation energy of 70 eV in the 50–550 amu. The solvent delay was 3 min. The identification of degradation products was accomplished by comparing their MS spectra to those available in MS libraries from the NIST MS spectra database.
2.3.5. UPLC Analysis
For quantification of BCG, CR, and TB in the mixture, the Waters ACQUITY Ultra Performance Liquid Chromatography (UPLC) System coupled with a UV detector controlled by Empower Software was used (Waters Corporation, Milford, MA, USA). The system was equipped with an ACQUITY UPLC BEH C18 column with the dimensions 1.7 µm, 100 mm × 2.1 mm (Waters Corporation, USA). The analysis was done under isocratic conditions with a mobile phase consisting of 0.1% trifluoroacetic acid (TFA) in water and acetonitrile: water (90:10). The eluent flow rate was 0.2 mL/min and the injection volume was 6 µL. Quantification of all analytes was done on the wavelength of 410 nm.
2.3.6. DFT Calculations
For DFT calculations, a
pwscf code of the Quantum ESPRESSO package was used [
33].
Ultrasoft pseudopotentials based on GGA-PBE approximation [
34] with plane wave kinetic energy cutoff of 50 eV were implemented. Isolated cresol red molecule was geometrically optimised in a 30 × 30 × 30 A
3 cell, using Martyna–Tuckermann [
35] correction to prevent interaction between periodic images. A Fukui index of radical attack susceptibility represents the reactivity of an atom towards a radical attack, and was calculated from the equation [
36]:
where f
A0 is the Fukui index of cresol red susceptibility to the radical attack, and q(N + 1) and q(N − 1) are the Lowdin charges [
37] of the cresol red molecule with one added and one subtracted electron, respectively. XcrySDen software [
38] was used for the graphical representation.
2.3.7. TOC Analysis
The mineralisation of the dyes mixture after 6 h of electrolysis at the investigated anodes was calculated as the abatement of total organic carbon (TOC) which was measured on a TOC-LCPH analyzer (Shimadzu Co., Kyoto, Japan). Mineralisation efficiency was calculated from the equation:
3. Results
3.1. Anode Characterisation
3.1.1. FTIR Analysis
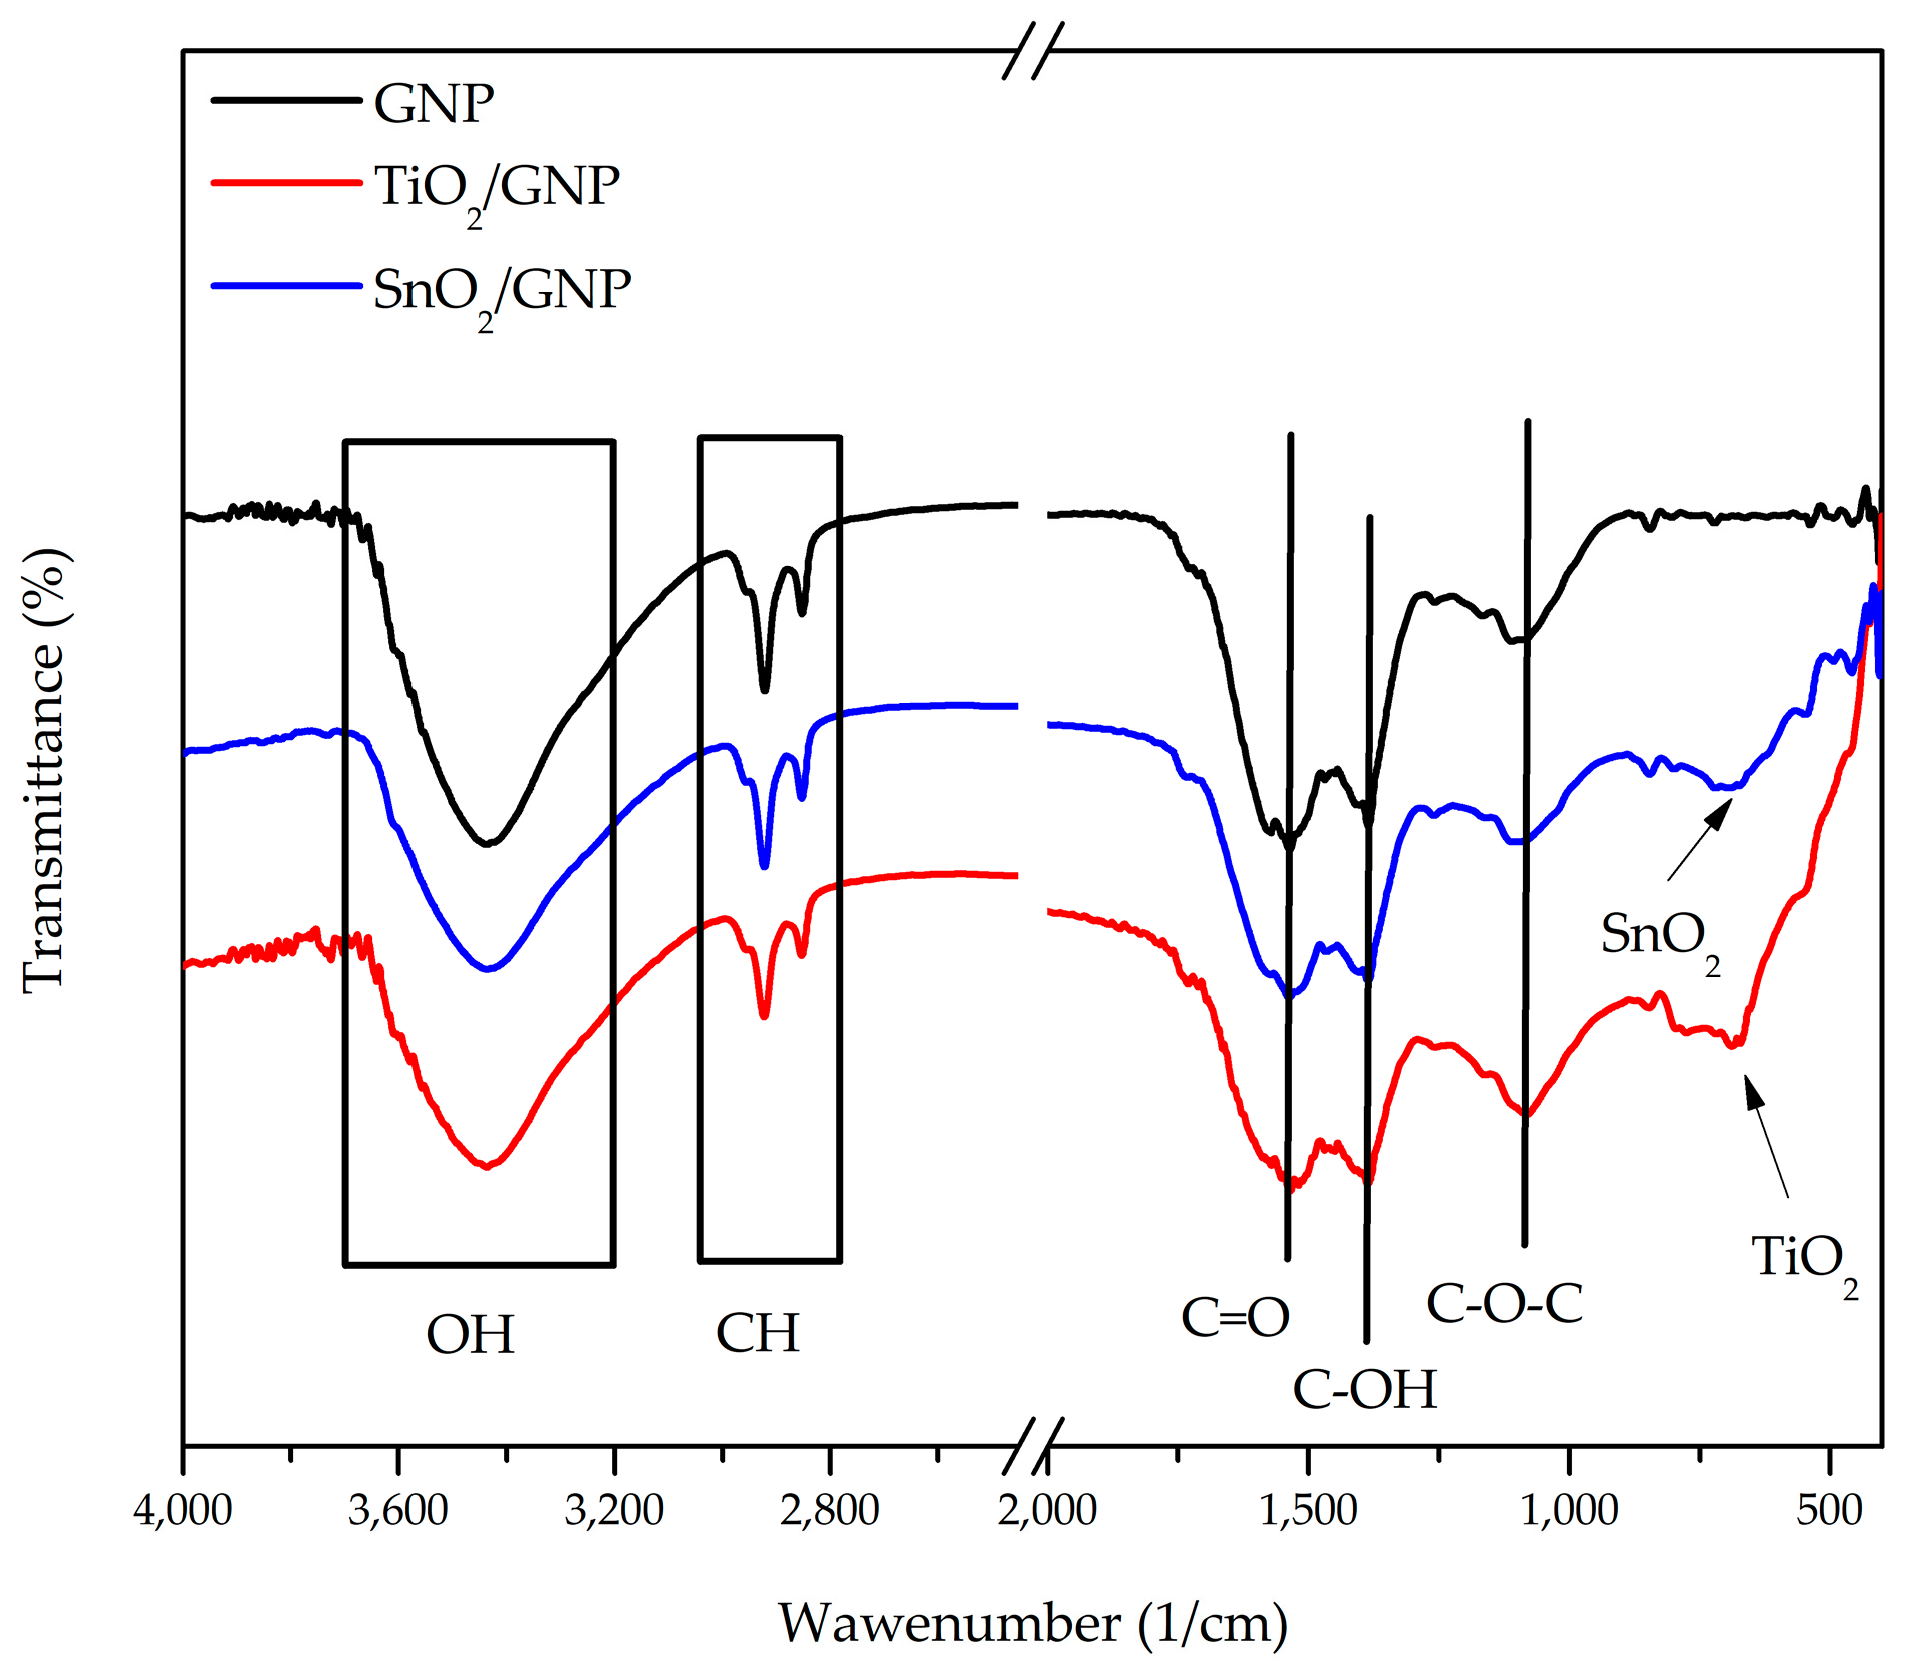
The carbon-based composite materials were analyzed by FTIR spectroscopy prior to the electrochemical degradation experiments. The resulting FTIR spectra are represented in
Figure 1:
As can be seen from
Figure 1, all spectra showed bands typical for carbon materials in the region of 4000 1/cm to 400 1/cm. A broad bandlocated at around 3400 1/cm, corresponds to the OH vibration. Triple bands located at 2956–2806 1/cm indicates the presence of C-H stretching vibrations [
39]. Oxygen functionalities are detected in the region of 1600 1/cm to 1000 1/cm. Bands centred at 1535 1/cm, 1387 1/cm, and 1080 1/cm correspond to the C=O, C-OH, and C-O-C functional groups, respectively [
40]. On the other side, bands < 1000 1/cm correspond to the presence of oxide [
41]. Bands at around 670 1/cm, which appear in the case of TiO
2/GNP and SnO
2/GNP, could be attributed to TiO
2 or SnO
2. The obtained results confirm that the carbonaceous structure of GNP has been kept after composite preparation, with no residual impurities.
3.1.2. XRD Analysis
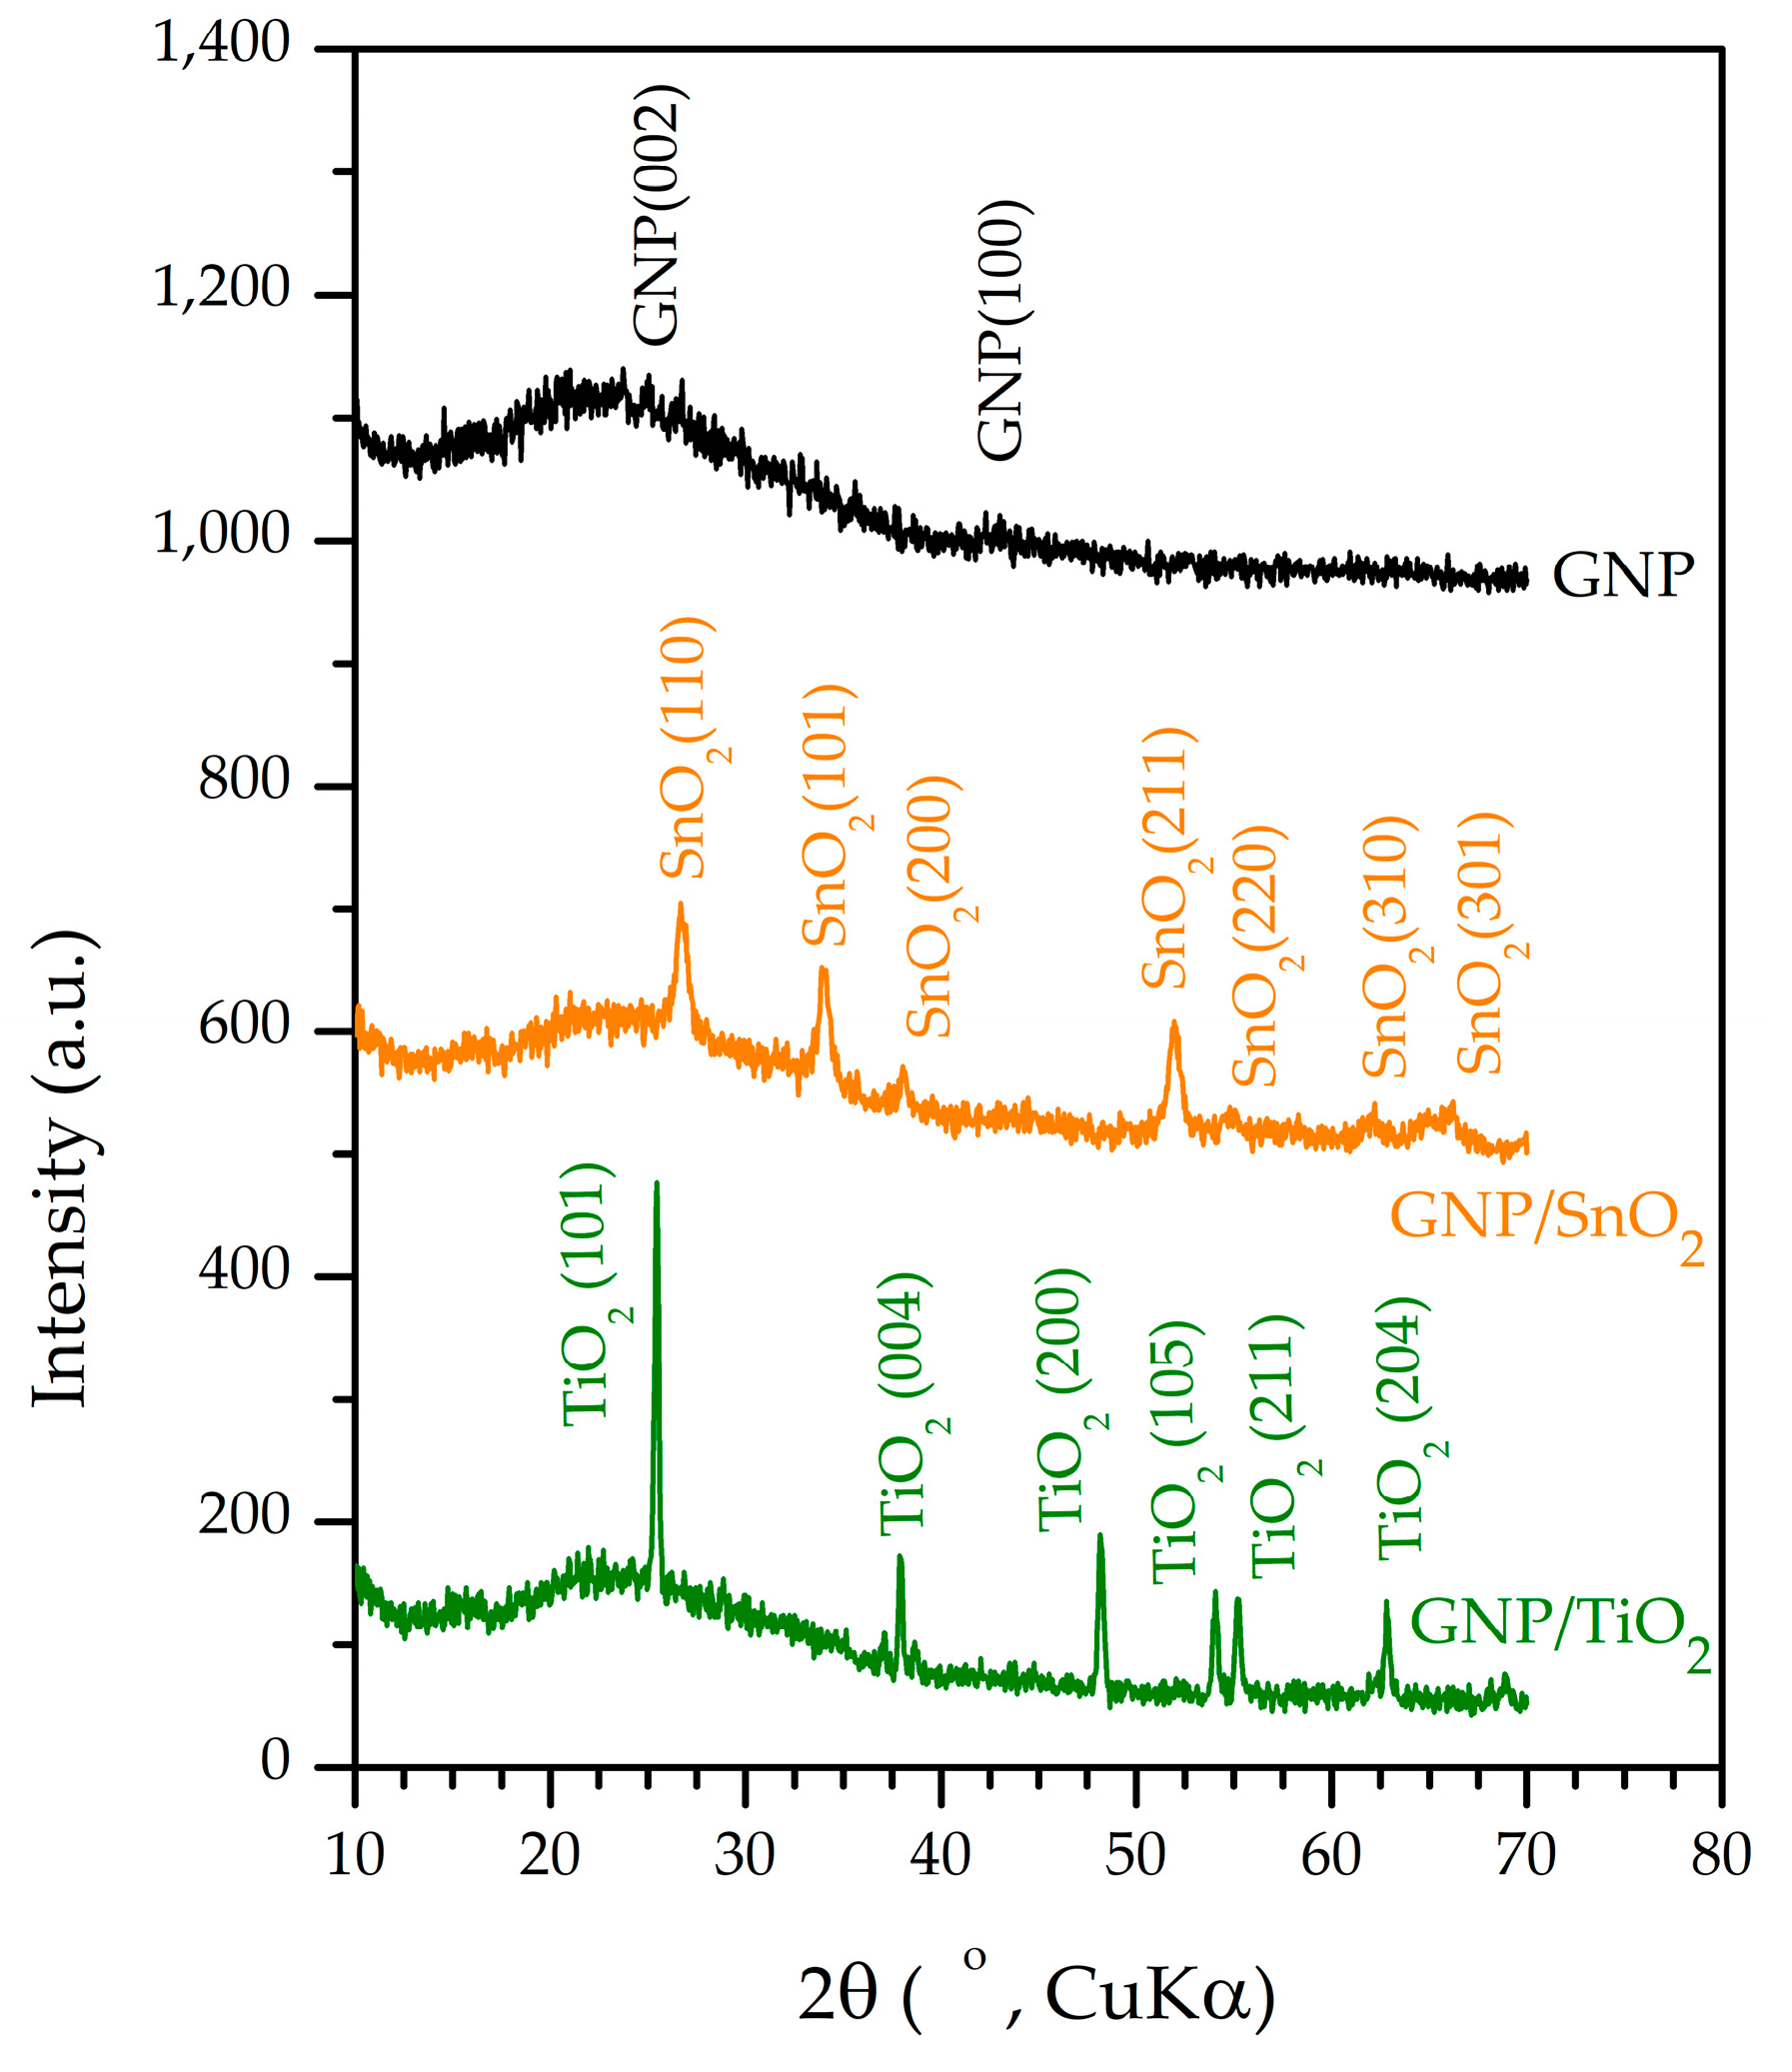
XRD analysis measurements of the investigated carbon-based electrode coatings were performed after the dyes mixture was electrochemically degraded for 6 h at 10 mA/cm
2. Difractograms are represented in
Figure 2.
XRD reveals the disordered structure of the carbon sample with two broad reflections of graphite (PDF 1-646). XRD patterns of composite samples have distinguished crystalline peaks of SnO
2 (Cassiterite, PDF 41-1445) and TiO
2 (Anatase, PDF 21-1272) phase superponed on an amorphous carbon profile, as can be seen in
Figure 2. There is no evidence of any additional crystalline phase. Initial structures of SnO
2 and TiO
2 are kept during the process of electrooxidation without additional phase formation.
Based on the Scherrer equation (Equation (1)), applied to the peaks at 2 θ = 25.5 degrees for TiO2, and 26 degrees for SnO2, the estimated average crystallite sizes were 42 nm for TiO2 and 13 nm for SnO2.
3.1.3. Electrochemical Characterisation
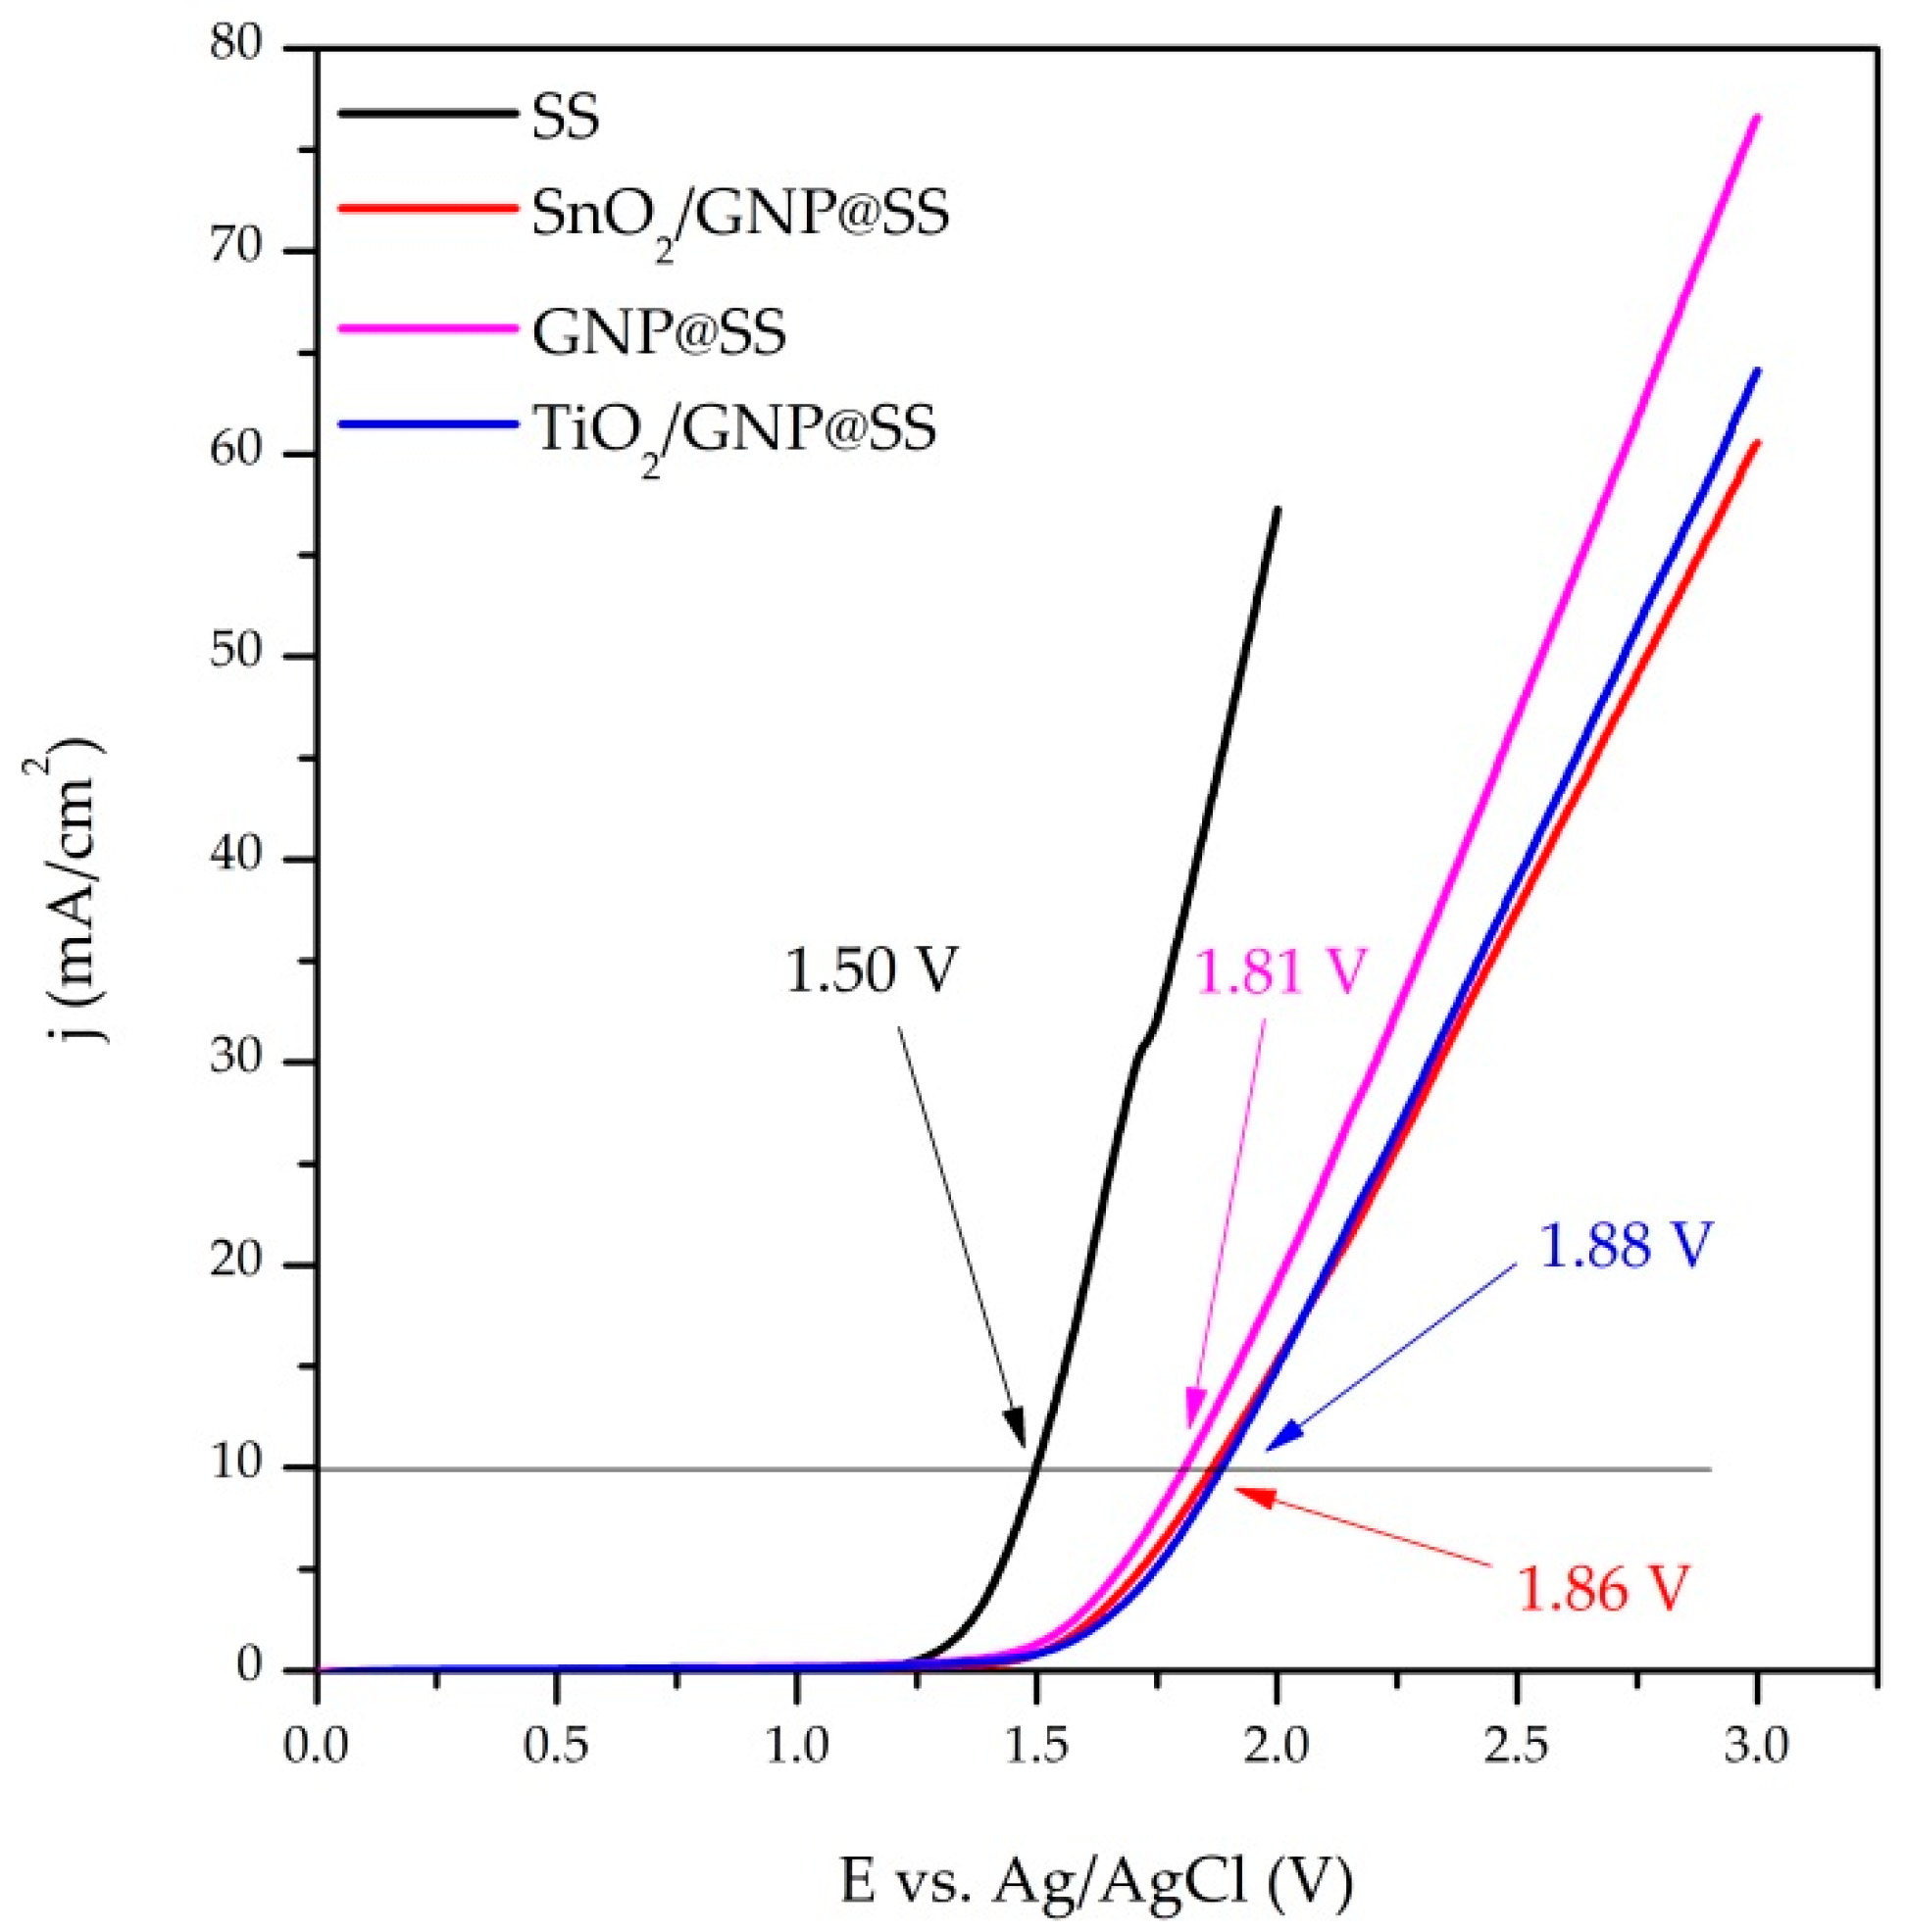
All prepared electrodes were investigated by linear sweep voltammetry (LSV) and cyclic voltammetry (CV).
The onset potentials of the oxygen evolution reaction (OER) were evaluated from LSV curves (
Figure 3). The OER onset potentials (versus Ag/AgCl) follow the following order: 1.50 V, 1.81 V, 1.86 V, and 1.88 V for SS, GNP@SS, SnO
2/GNP@SS, and TiO
2/GNP@SS, respectively. The most negative onset potential in the investigated electrolyte was found for the SS electrode. On the other side, SnO
2/GNP and TiO
2/GNP move the OER to more positive values and therefore increase the operating voltage of the electrode, thus being more suitable for electrochemical oxidation.
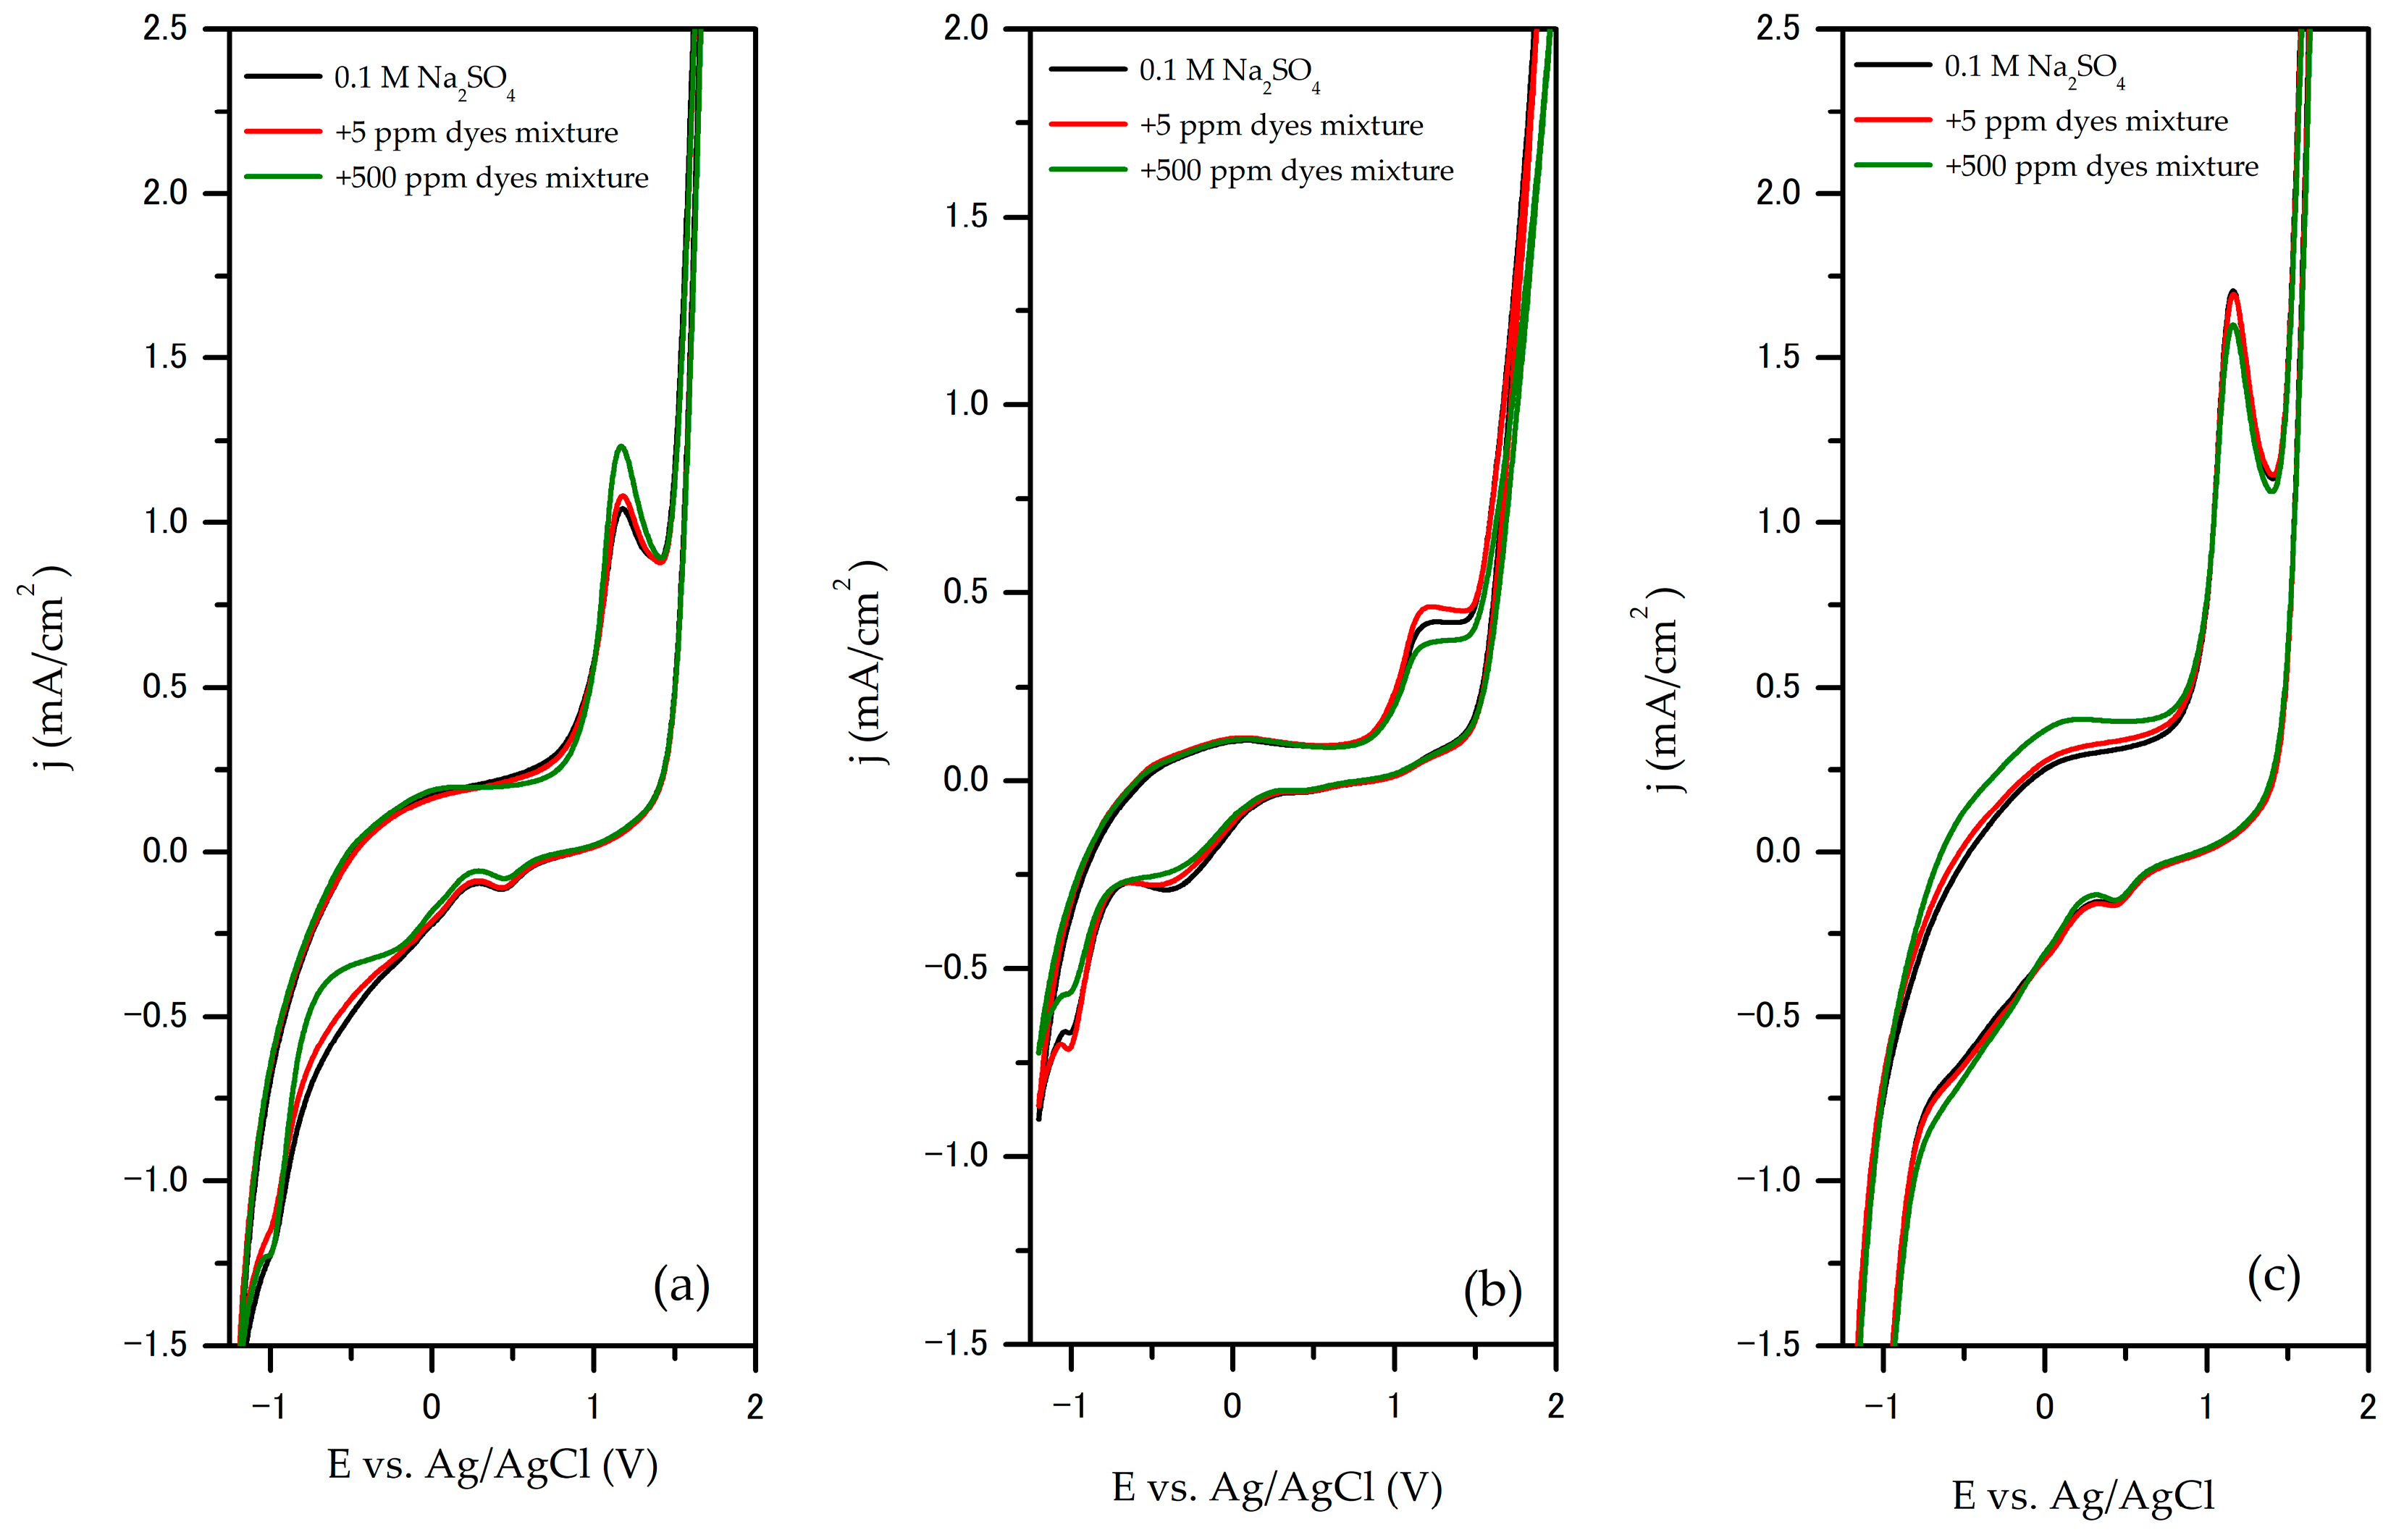
The electrochemical oxidation of the dye mixture on the SnO
2/GNP@SS, GNP@SS, and TiO
2/GNP@SS electrodes was investigated based on the change of shape and characteristics of the cyclic voltammograms (CV) obtained at different concentrations of the dye mixture in 0.1 M Na
2SO
4 as supporting electrolyte. Cyclic voltammograms obtained for 0.1 M Na
2SO
4 (electrolyte) and for solutions with the lowest (5 ppm) and the highest concentration of dyes mixture (500 ppm) are compared in
Figure 4a–c. The results obtained for the whole range of investigated concentrations are presented in the
Supplementary Material (Figure S3).
In all cases, CV curves have the same shape without the appearance of new peaks in the presence and absence of the dye mixture, which indicates that direct electron transfer between the anode surface and dye does not occur. From the literature, the oxidation peaks at 1.19 V vs. Ag/AgCl (1.8 V vs. RHE) can be attributed to the oxidation of hydroxyl radicals from the electrolyte [
42,
43]. This suggests that the electrochemical oxidation of the dye mixture occurs indirectly via hydroxyl radicals.
As can be seen in
Figure 4a, the CV of the SnO
2/GNP@SS electrode shows an increase in peak anodic current density and a slight shift of the peak potential to positive values when the concentration of the dye mixture in the supporting electrolyte increases from 5 to 500 ppm, confirming that the oxidation is taking place. For the TiO
2/GNP@SS electrodes (
Figure 4b), a rising in the peak anode current density and a slight shift in the peak potential to positive values can be observed upon the addition of a 5 ppm dye mixture. However, with a further increasing concentration of the dye mixture, the peak anodic current density decreased, due to the passivation of the electrode. On the other hand, the CV of the GNP@SS electrode (
Figure 4c) displays that a peak anodic current density constantly decreases with the addition of a dye mixture in the system. This is probably due to the fact that the active sites on the electrode surface are occupied by oxidation products and passivation of the electrode occurs, i.e., the electrode surface becomes blocked and the peak anodic current density decreases. These effects of passivation of the electrode during oxidation of the phenol-like compound have also been observed by other authors [
44,
45,
46].
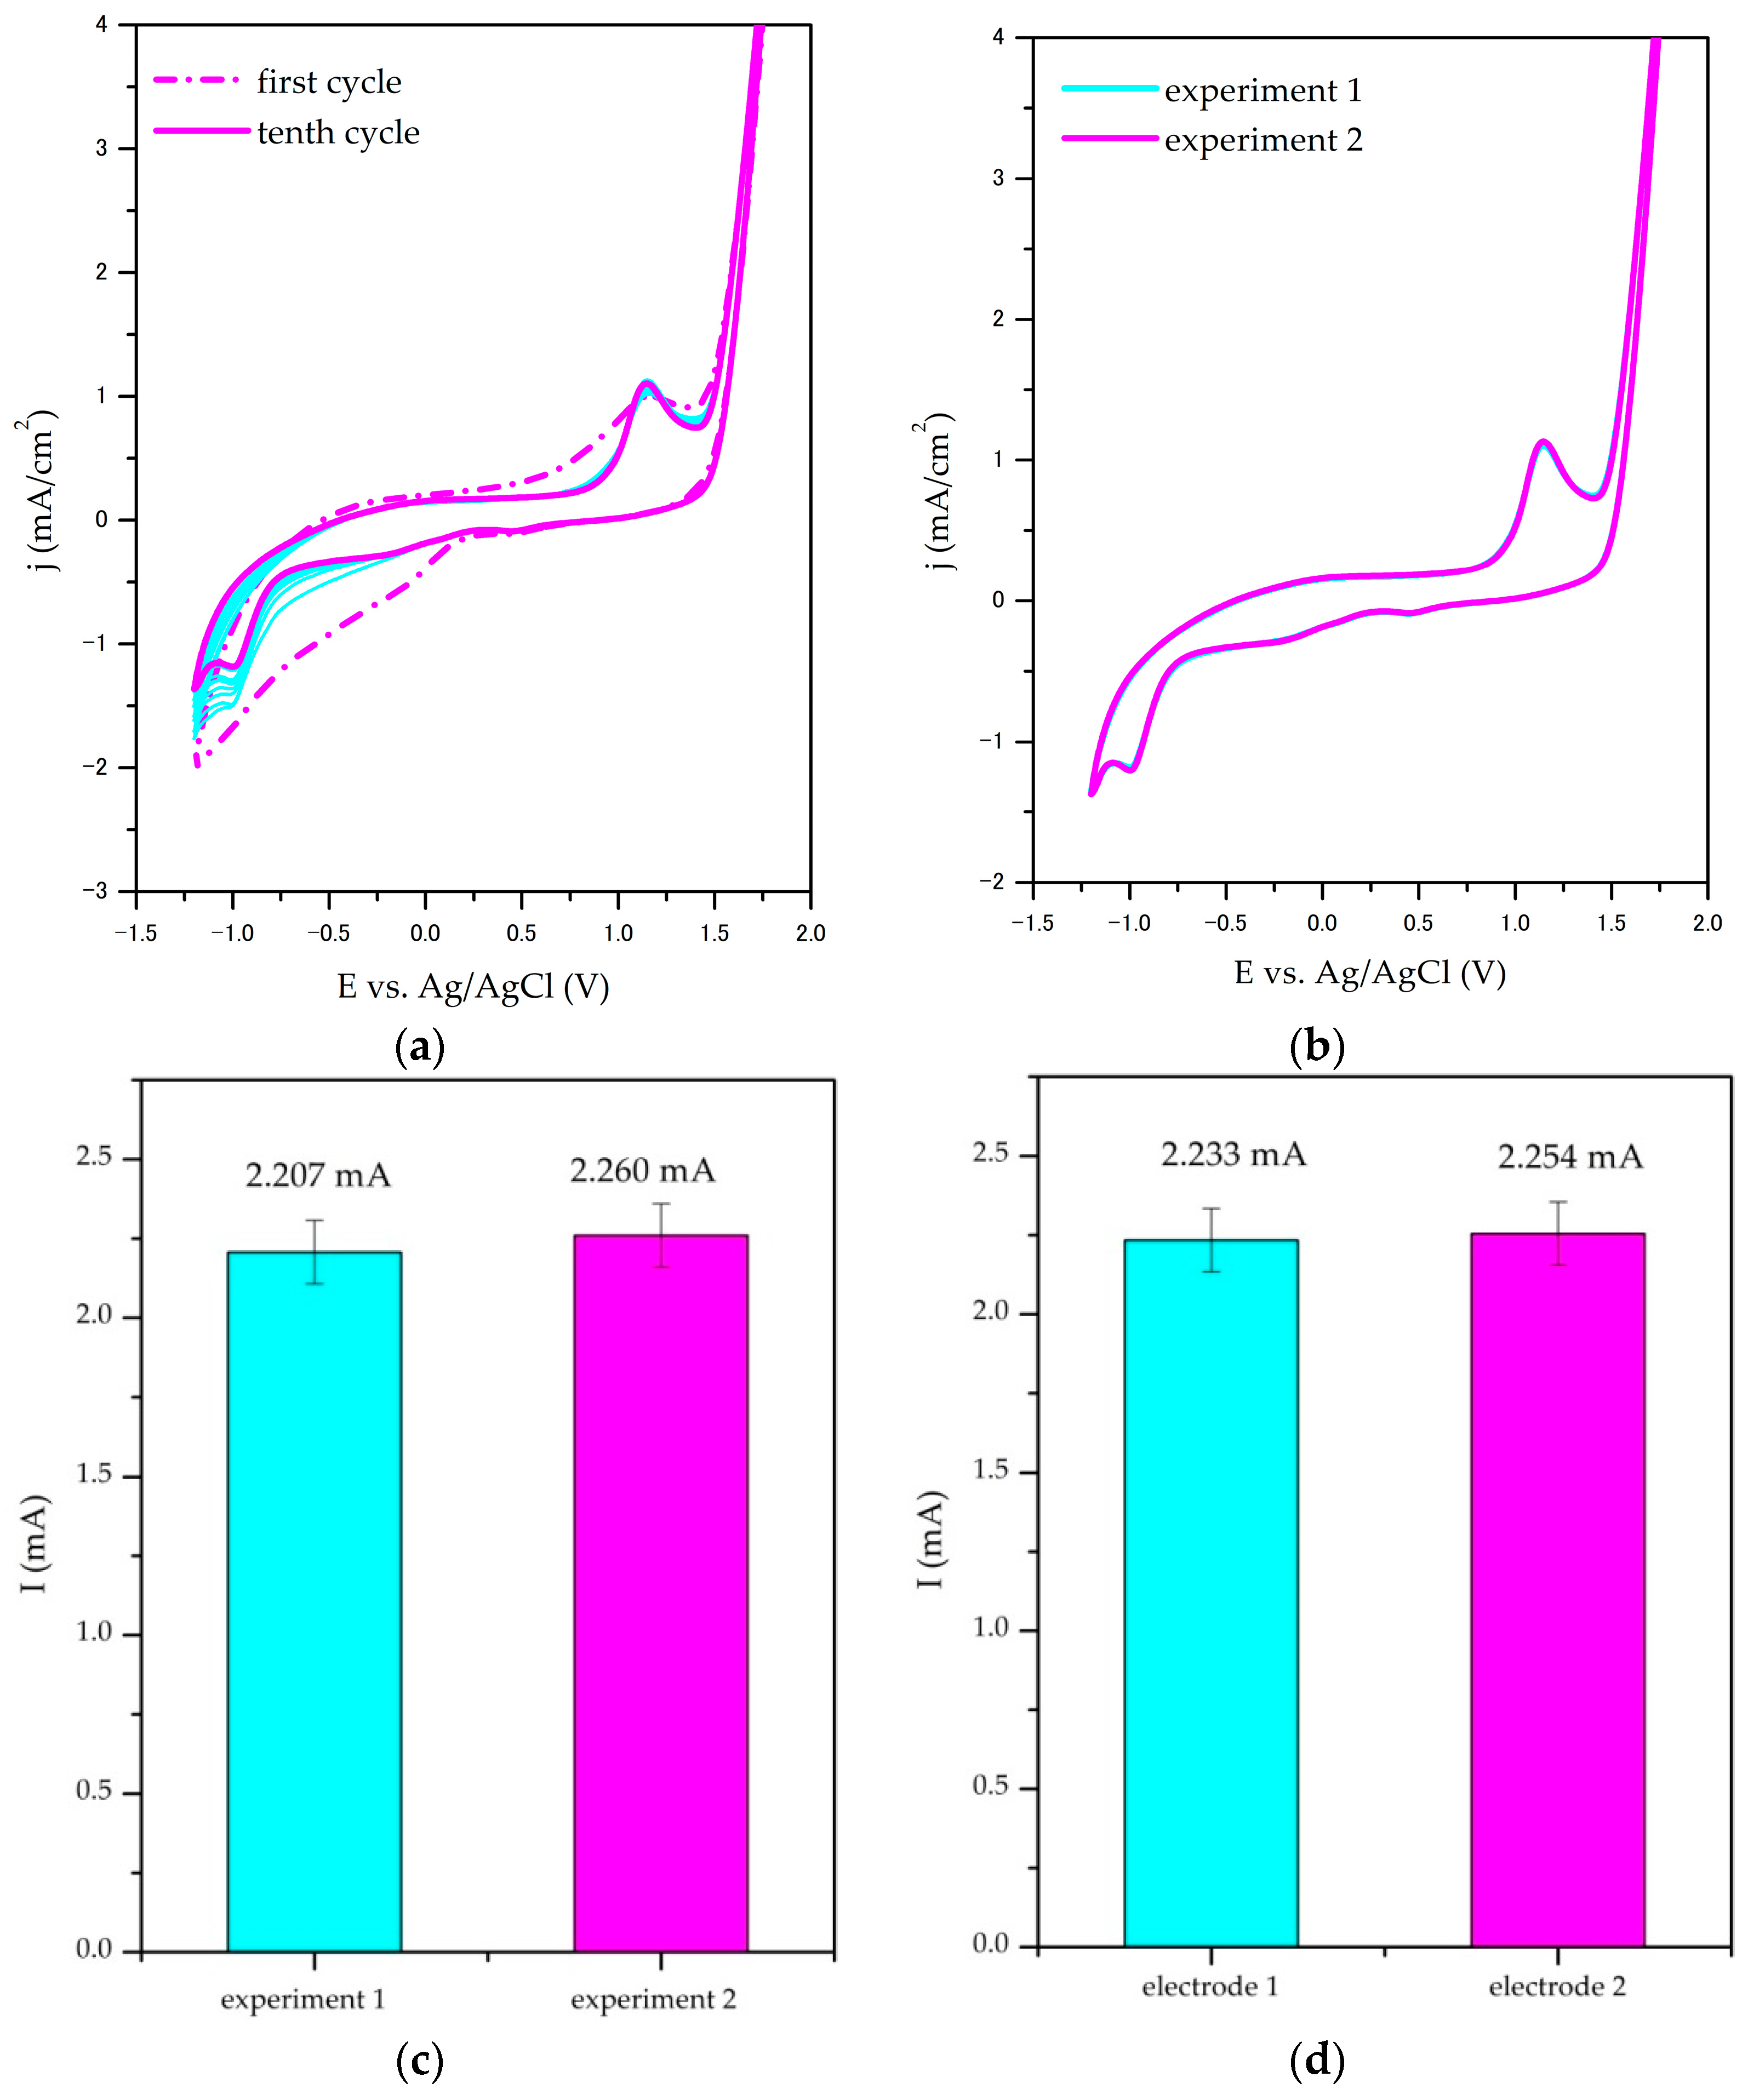
3.1.4. Stability, Repeatability, and Reproducibility Studies
Stability, repeatability, and reproducibility studies were scrutinised by analysing the shape and the characteristic anodic peak current density of the cyclic voltammograms (CVs) obtained in 0.1 M Na
2SO
4 as supporting electrolytes. To confirm the repeatability, two individual experiments were performed with the same electrode, and within reproducibility studies, the performance of two independent nanocomposite electrodes was compared. For the SnO
2/GNP@SS electrode, the results are presented in
Figure 5a–d with additional results that are given in the
Supplementary Material (Figure S4). For the TiO
2/GNP@SS and GNP@SS electrodes, similar results were obtained.
The results of cyclic stability experiments confirmed the stability of nanocomposite electrodes for electrochemical oxidation: the change of peak current density from the first to the tenth cycle was estimated to be less than 10% for all investigated electrodes (9% for the SnO
2/GNP@SS electrode presented in
Figure 5a). The results of chronopotentiometric measurements that were performed during electrochemical degradation further confirm the stability of prepared electrodes (
Supplementary Material, Figure S5). As visible from the repeatability CV measurements (
Figure 5b), there are no significant differences between the curve shape. The obtained peak anodic currents vary 2–10% in repeatability experiments (2.3% for peaks presented in
Figure 5c) and less than 8% in reproducibility experiments (1% for peaks obtained for two independent SnO
2/GNP@SS electrodes presented in
Figure 5d). Obtained results confirm that the investigated electrodes can be prepared and operate with satisfactory repeatability and reproducibility.
3.2. Degradation of Dyes Mixture in 0.1 M Na2SO4
3.2.1. Degradation Kinetics
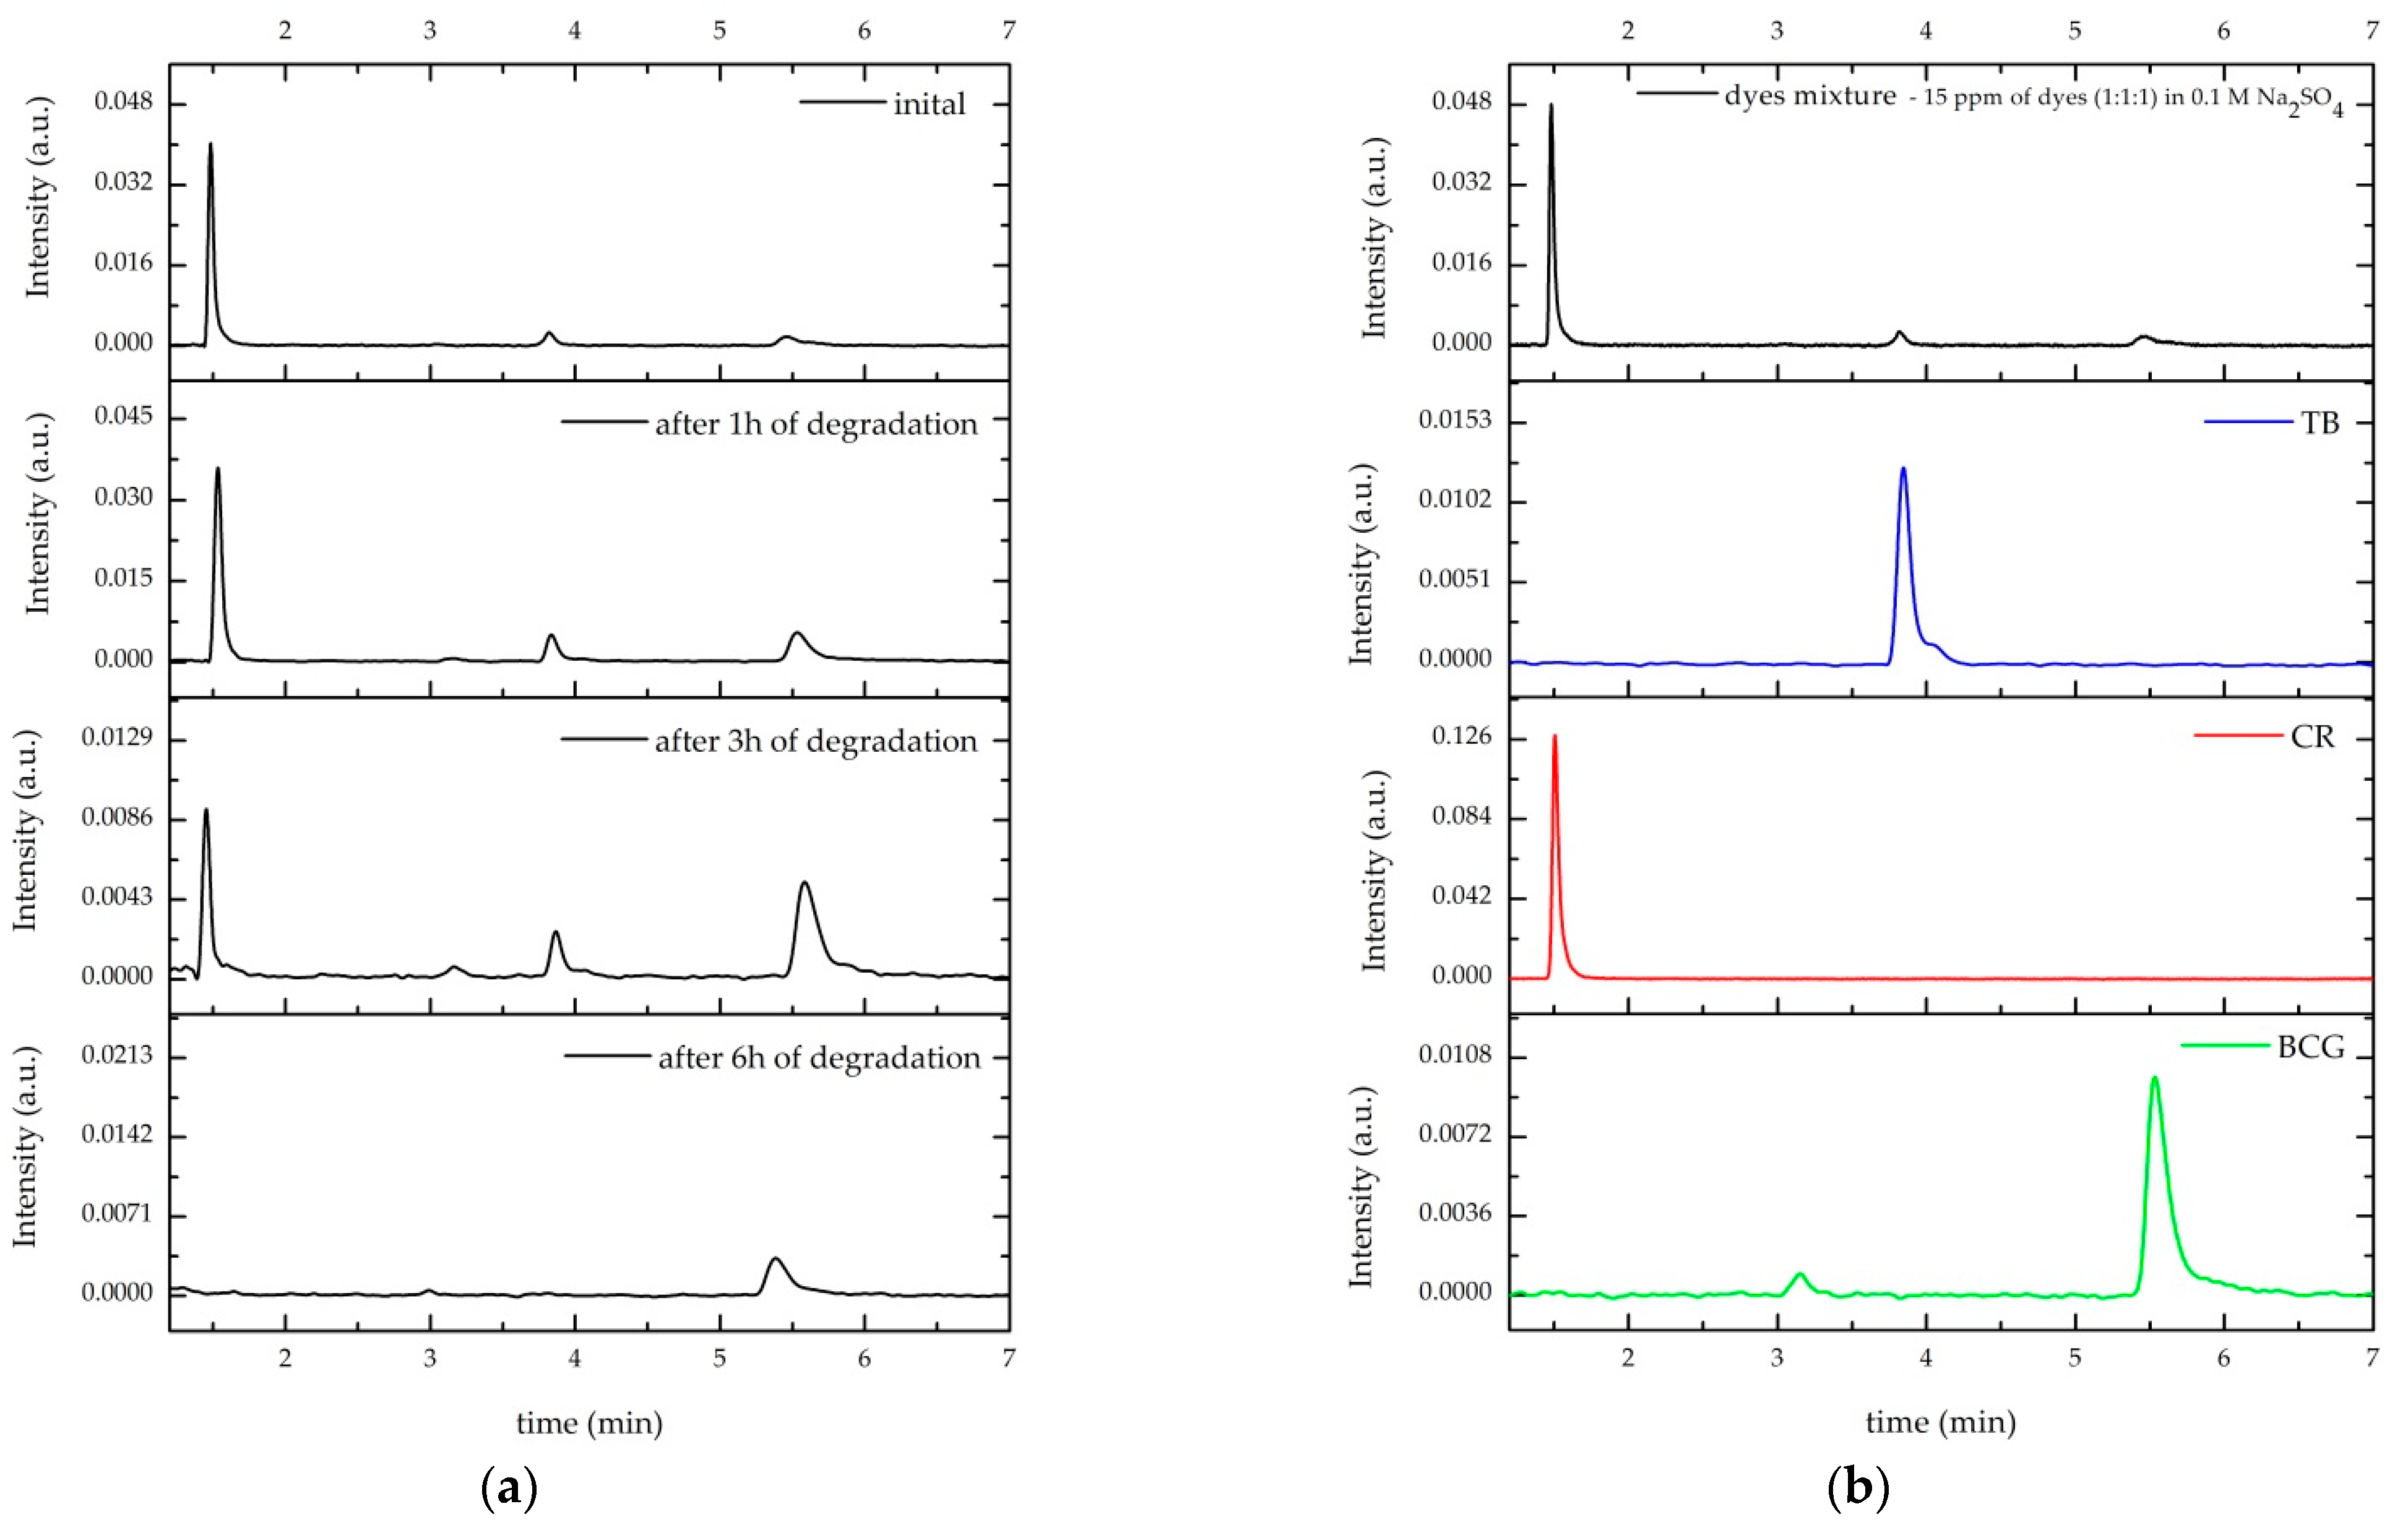
The concentrations of the dyes mixtures during the electrochemical treatment were tracked by UPLC analysis. The initial solution (15 ppm of the dyes mixture in 0.1 M Na
2SO
4 with mass ratios of dyes BCG:CR:TB = 1:1:1) was electrochemically degraded at the investigated electrodes for 6 h at a current density of 10 mA/cm
2. As a representative, the LC-UV chromatograms of the initial dyes mixture and the solutions obtained after 1 h, 3 h, and 6 h of degradation at the GNP electrode are shown in
Figure 6a. Individual chromatograms of the treated dyes mixture and its components (BCG, CR, and TB) are compared in
Figure 6b.
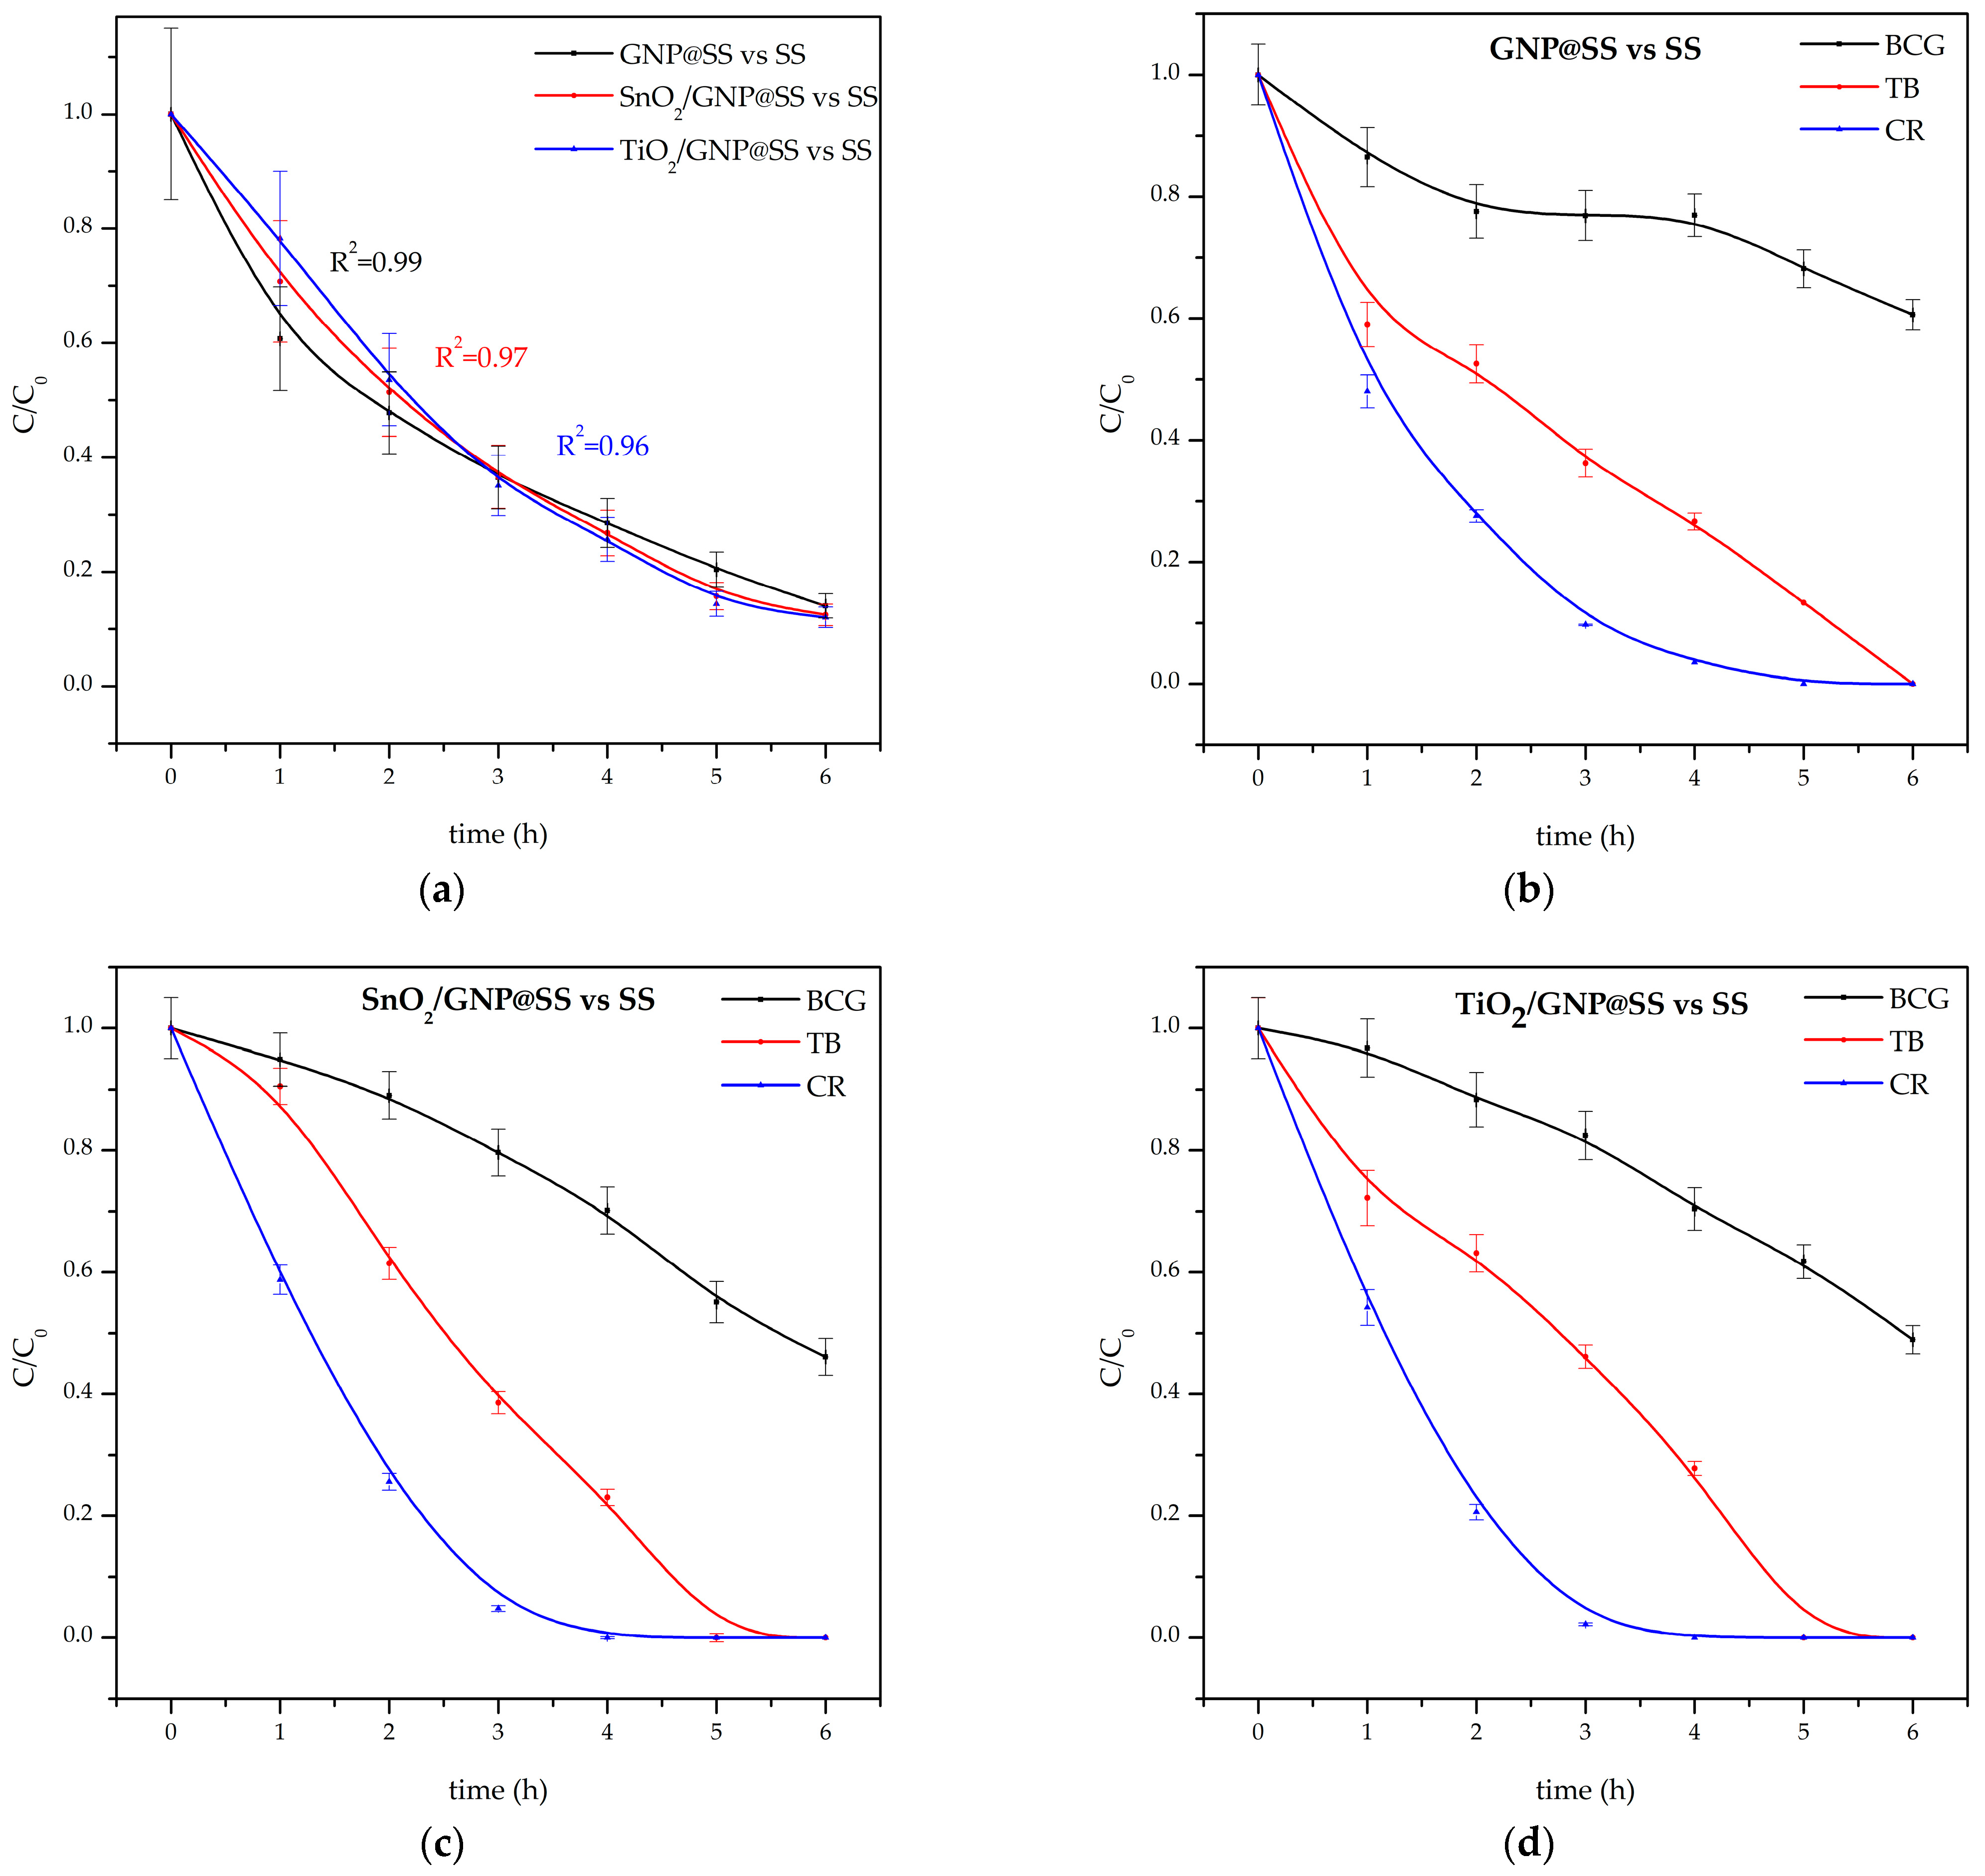
Based on the UPLC tracking, the individual concentrations of mixture components were calculated. The total depletion of all dyes in the mixture was calculated from the ratio between the sum of molar concentrations of all dyes at the moment time (h) and time = 0 h. For all investigated electrodes, the total and individual degradation curves are represented in
Figure 7a–d.
Figure 7a represents the final degradation degree after 6 h of electrolysis at 10 mA/cm
2 at all electrodes; summary degradation efficiency was about 86%.
The degradation data were fitted with pseudo-first-order and the fit has shown good agreement with experimental data for cresol red, and reasonable agreement for the total depletion of the mixture. First-order rate constants are represented in
Table 2:
A general trend of the degradation rate increasing in the order GNP@SS < TiO
2/GNP@SS ≈ SnO
2/GNP@SS was observed. Such results are in an agreement as well as the previous investigations, including DFT calculations of the anode reactivity towards electrochemical oxidation [
19]. The improvement of the degradation rate constant upon the addition of TiO
2 and SnO
2 is most obvious for cresol red, achieving 48% on TiO
2/GNP@SS. On the other hand, the degradation rate and its efficiency on all electrodes is significantly lower for bromcresol green and thymol blue. Cresol red is efficiently degraded on all electrodes within the first 3 h, while only 50% of bromcresol green is degraded for the same time. As the investigated compounds mainly differ in the structure of phenol ring substituents, the observed results were used to propose a possible degradation pathway of cresol red.
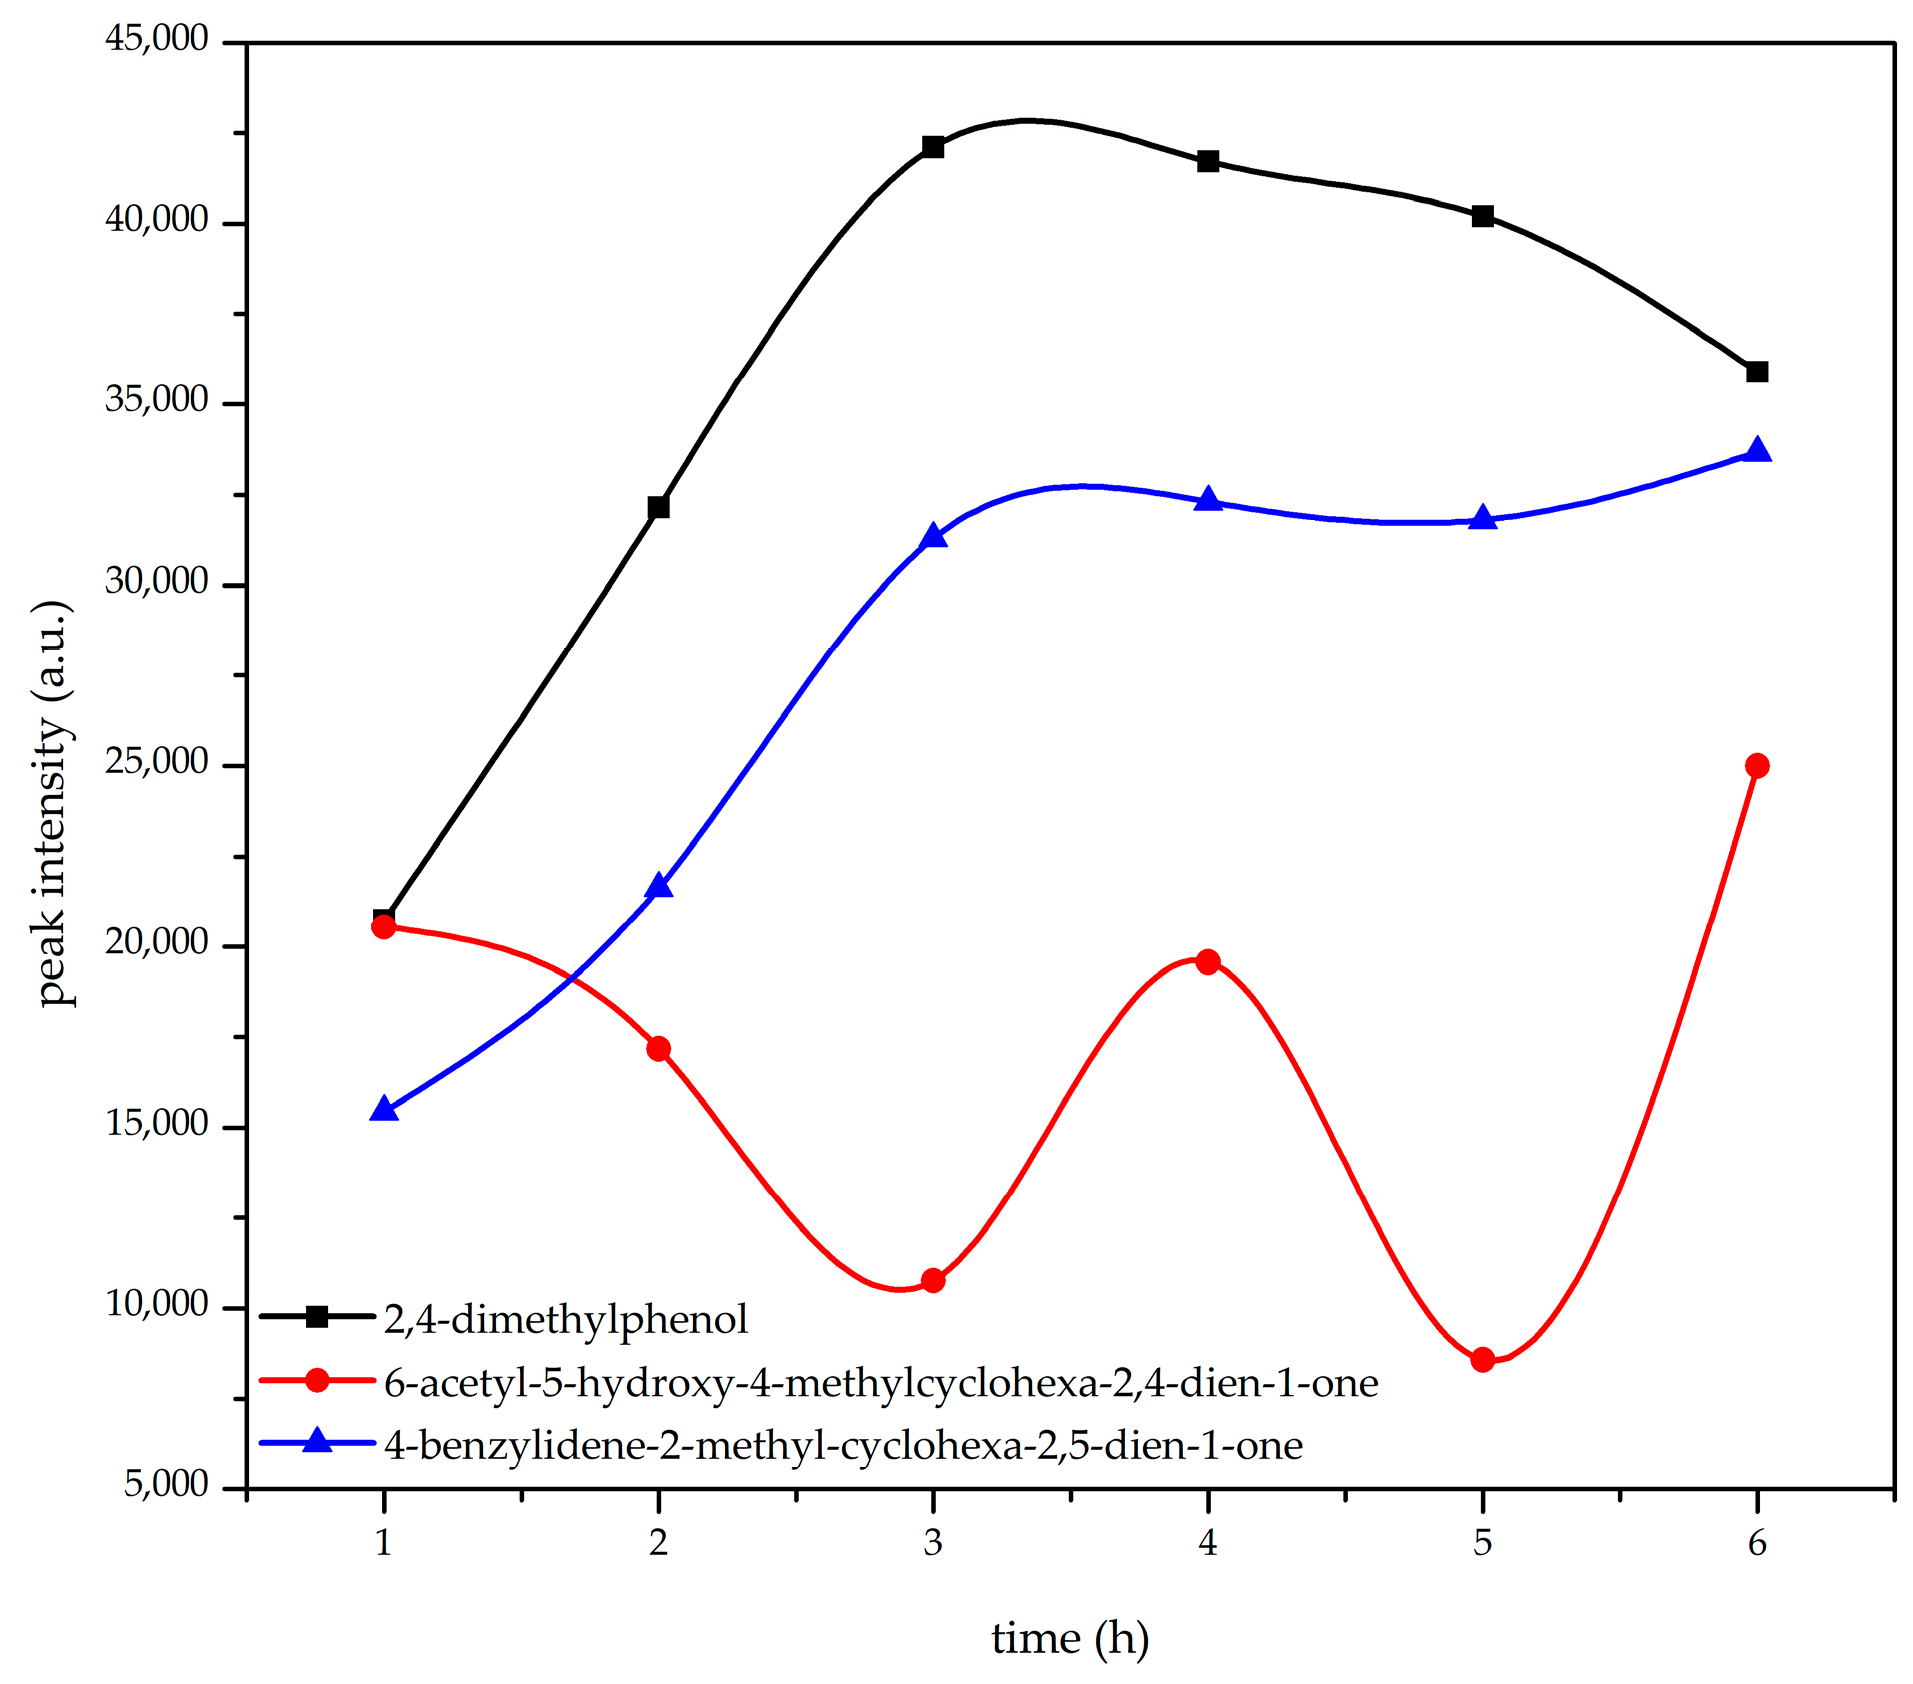
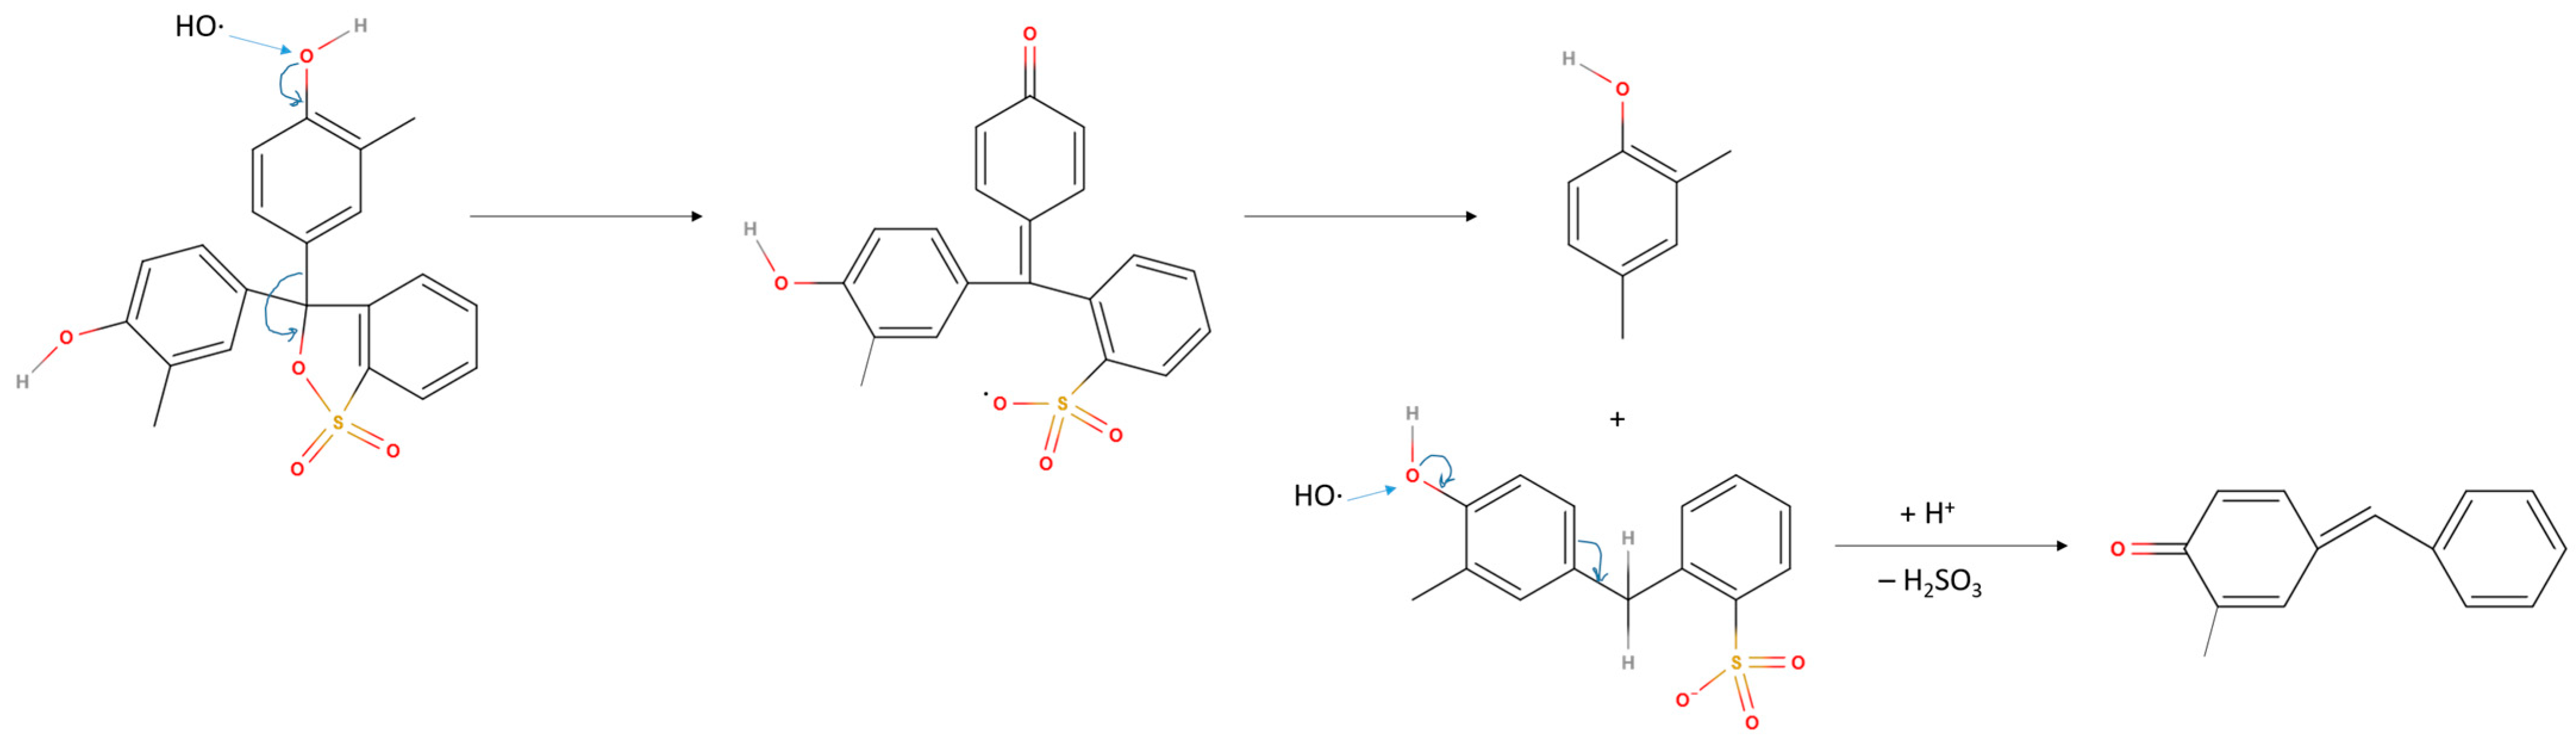
3.2.2. Degradation Products and Mechanisms
The degradation products of 15 ppm cresol red in 0.1 M Na
2SO
4, detected by GC-MS analysis, are presented in
Table 3. The analysis was performed for all investigated carbon-based electrodes, at an applied current density of 10 mA/cm
2. Chromatograms of products obtained during the treatment of the dyes mixture at the GNP electrode are given in the
Supplementary Material (Figure S6).
Aromatic compounds oxidised to various extents are commonly reported as the products of the oxidation of organic pollutants [
47,
48]. Relative peak intensities of the identified products were tracked for 6 h of degradation of cresol red on the GNP@SS electrode, and are represented in
Figure 8:
The GC-MS analysis confirms that the electrochemical oxidation results in the breakage of the dye skeleton up to the phenol and bisphenol structures oxidised to various extents. Based on the detected products, and the observation that cresol red is more efficiently oxidised than thymol blue and bromocresol green because of their voluminous substituent groups, the hydroxyl group of phenol ring is proposed to be the probable site of the attack of OH-radicals, previously denoted as the crucial oxidising agent (
Section 3.1.3). The proposed reaction mechanism of cresol red with an OH-radical is represented in
Figure 9.
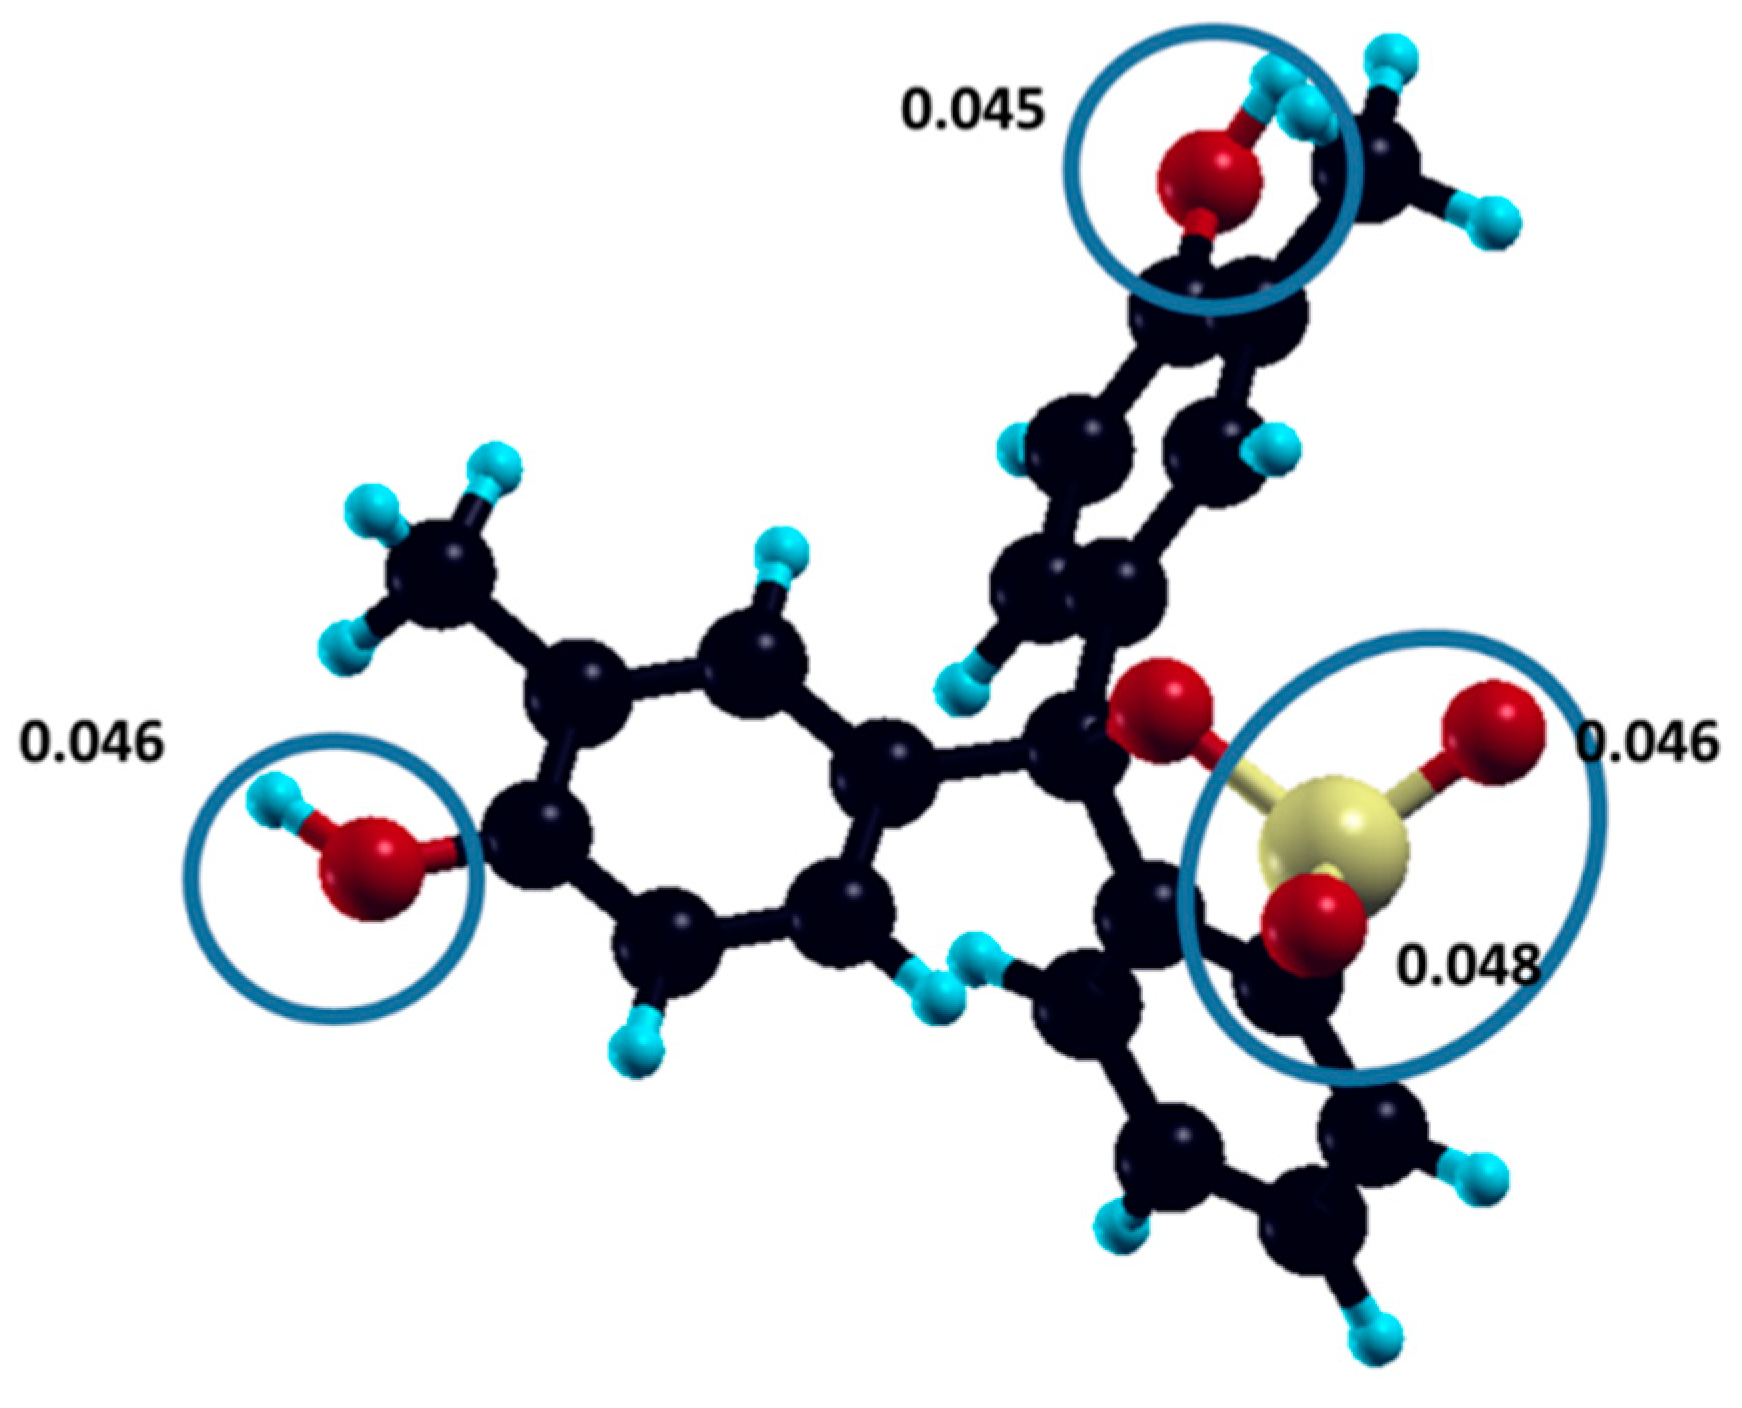
In order to confirm the pathway of dye molecule degradation, the reactivity of cresol red molecules towards radical attack was estimated from a DFT-calculated electronic structure and Fukui indices [
36]. The atoms of cresol red molecules with the highest calculated susceptibility to radical attack—oxygen atoms of hydroxyl and sulpho groups—are denoted, with assigned f
A0 values, in
Figure 10.
3.2.3. TOC Analysis
TOC measurements were performed before the electrolysis was begun (initial TOC 8.58 mg/L) and after the dyes mixtures were electrochemically treated at a current density of 10 mA/cm2.
The results, i.e., the TOC analysis performed after the initial dyes mixtures were electrooxidated for 6 h at investigated electrodes, are represented in
Table 4.
As can be seen from
Table 4, the final degree of mineralisation is in the range between 30% and 35% for all tested electrodes, which is in accordance with literature data [
23] and observed indisposition of BCG to electrochemical degradation. Also, Ma et al. [
49] have reported that the TOC abatement decreases with the increase in the concentration of sulphate in the electrolyzed solution, pointing to the potential role of sulphate as a mineralisation limiting factor.
4. Discussion
Low-cost composite carbon-metal oxide electrodes on SS support were prepared and characterised by FTIR, XRD, and electrochemical techniques (LSV and CV). The performed stability, repeatability, and reproducibility studies have shown satisfactory results. The FTIR spectra of the composite materials, which were recorded prior to the electrochemical degradation experiments, showed all the bands typical of carbon materials, indicating that the graphene surface retains the common structure, with no detected residual impurities as a consequence of the composite preparation process. XRD analysis, which was performed after the electrochemical degradation, confirmed the coexistence of persistent carbon and crystalline metal-oxide phases. The crystallite sizes estimated using the Scherrer equation (Equation (1)) indicate that the nanocrystalline structure of the SnO2 and TiO2 composite parts is retained even after electrochemical degradation has been performed.
LSV measurements have confirmed that deposition of the composites on the SS electrode has resulted in the OER overpotential upshift. The overall conclusion that the OER overpotential is dictated by the carbon part of the composites is in good agreement with the results of our previous DFT and experimental studies on similar composite materials [
19]. On all cyclic voltammograms, a characteristic peak at 1.19 V, ascribed to OH-radical oxidation, supports the statement that the OH-radical is a main reagent for indirect electrochemical oxidation of organic dyes in the system. Moreover, in the presence of a dye mixture in concentrations up to 500 ppm, there were no observed currents that could be attributed to the direct electron transfer between the electrode and the dye, confirming that the dye oxidation occurs indirectly, via the adsorbed OH-radical.
Electrochemical oxidation of the dye mixture has been tracked by UPLC, due to the previously established inability of UV-Vis spectrometry to track multiple overlapping peaks in the spectra of the dye mixture. Results revealed that the oxidation rate and efficiency mainly depend on the dye structure, i.e., on the structure of phenolic ring substituents. Moreover, composite electrodes exhibited an improved degradation rate compared to the GNP@SS electrode, being most obvious in the degradation of cresol red. The observed correlation of dye structure with depletion rate was used to reconstruct the OH-radical-mediated degradation mechanism, which comprises the OH-radical attack on the oxygen atom of the phenolic group as the initial step. The proposed mechanism is corroborated by the DFT calculations of susceptibility to radical attack, confirming that the oxygen heteroatoms of the dye are most prone to be attacked first. On the other hand, in GC-MS analysis there was no reliable proof of aliphatic compounds originating from the deterioration of dye structure, implying that no significant breaking of the aromatic rings was achieved. However, the GC-MS findings agree well with previous literature data for similar materials.
Moreover, TOC analysis has shown a mineralisation extent of about 30–35%, poorly depending on the electrode structure, which is also in good agreement with previous literature data on sulphate-based electrolytes.
The present study generally implies that phenolic dyes can be successfully degraded in sulphate-based media using low-cost, simply prepared carbon composite anodes deposited on stainless steel tiles. Observed electrode passivation at high dye concentrations confirms that optimal performance is expected in the low concentration range.
The prepared electrodes exhibited sustainable performance (satisfactory operating stability and reproducibility), at least when used at a low current density of 10 mA/cm2. Moreover, it was shown that the degradation kinetics, mostly determined by the dye structure itself, can be improved by the involvement of TiO2 and SnO2 in the composite coating. On the other hand, the limited ability of the electrogenerated OH-radical to deteriorate the phenolic structures still implies a need for awareness of the residual products, knowledge of the degradation mechanism, and further strategies for the improvement of degradation efficiency. The results provide a systematic insight into the processes of electrochemical degradation of a series of similar dyes on a series of similar electrodes, thus presenting a sound basis for further development of laboratory-scale and larger industrial systems using the same methodology.
Supplementary Materials
The following supporting information can be downloaded at:
https://www.mdpi.com/article/10.3390/cryst13010125/s1, Figure S1: Comparison of the UV-Vis spectra of separate dyes (5 ppm of dye in 0.1 M Na
2SO
4) and dyes mixture (15 ppm of dyes in 0.1 M Na
2SO
4). Figure S2: UV-Vis absorption spectra of 15 ppm dyes mixtures (5 ppm of each dye in 0.1 M Na
2SO
4) (left panels) and electrolyte solutions (0.1 M Na
2SO
4) (right panels) that were electrochemically treated for 150 min at a current density of 10 mA/cm
2 at (a) a GNP@SS electrode; (b) a SnO
2/GNP@SS electrode; (c) a TiO
2/GNP@SS electrode.
Figure S3: Cyclic voltammograms of (a) GNP@SS; (b) SnO
2/GNP@SS; and (c) TiO
2/GNP@SS electrodes in 0.1 M Na
2SO
4 with different dyes mixture concentrations, at scan speed 100 mV/s.
Figure S4: Stability and repeatability studies of the second independently investigated SnO
2/GNP@SS electrode: (a) cyclic stability; (b) repeatability—cyclic voltammograms of two individual experiments with the same electrode; (c) repeatability—peak currents comparison. Figure S5: Chronopotentiograms of investigated nanocomposite electrodes, recorded during the degradation of the dyes mixture (5 ppm of each dye in 0.1 M Na
2SO
4, 15 ppm in total) at a current density of 10 mA/cm
2. Figure S6: GC-MS analysis: chromatograms of solutions obtained during the degradation of the dyes mixture at the GNP electrode at a current density of 10 mA/cm
2. Identified products are numbered: peak 1 at 5.50 min corresponds to 6-acetyl-5-hydroxy-4-methylcyclohexa-2,4-dien-1-one, peak 2 at 7.10 min corresponds to 2,4-dimethylphenol, and peak 3 at 9.63 min 4-benzylidene-2-methyl-cyclohexa-2,5-dien-1-one. Table S1: Fukui indices of radical attack susceptibility and Lowdin charges of all cresol red atoms.
Author Contributions
Conceptualisation, D.V.A. and M.J.D.; Methodology, D.V.A., A.K., N.Z. and T.B.; Validation, D.A., B.S. and T.B.; Formal analysis, D.V.A. and M.J.D.; Investigation, M.J.D., A.K., and N.Z.; Resources, D.A., B.S., T.B. and N.Z.; Data curation, M.J.D. and D.V.A.; Writing—original draft preparation, D.V.A., M.J.D. and N.Z.; Writing—review and editing, D.A., B.S. and T.B.; Visualisation, M.J.D. and A.K.; Supervision, D.V.A.; Project administration, T.B.; Funding acquisition, T.B. and N.Z. All authors have read and agreed to the published version of the manuscript.
Funding
This research was funded by Ministarstvo Prosvete, Nauke i Tehnološkog Razvoja, grant number 451-03-68/2022-14/200017 and the Science Fund of the Republic of Serbia, PROMIS, #6062667, HISUPERBAT.
Institutional Review Board Statement
Not applicable.
Informed Consent Statement
Not applicable.
Data Availability Statement
Not applicable.
Acknowledgments
The authors express their gratefulness to Miloš D. Milović for providing XRD data and valuable discussions. This work was supported by the Ministry of Education, Science and Technological Development of the Republic of Serbia; grant number 451-03-68/2022-14/200017. N.Z. would like to acknowledge the financial support of the Science Fund of the Republic of Serbia, PROMIS, #6062667, HISUPERBAT.
Conflicts of Interest
The authors declare no conflict of interest.
References
- Oturan, M.A. Electrochemical Advanced Oxidation Technologies for Removal of Organic Pollutants from Water. Environ. Sci. Pollut. Res. 2014, 21, 8333–8335. [Google Scholar] [CrossRef] [Green Version]
- Morin-Crini, N.; Lichtfouse, E.; Crini, G. Emerging Contaminants Vol. 2: Remediation; Springer International Publishing: Cham, Switzerland, 2021; Volume 66, ISBN 978-3-030-69089-2. [Google Scholar]
- Feng, H.; Yu, J.; Tang, L.; Zeng, G.; Tang, W.; Wang, J.; Luo, T.; Peng, B.; Song, B.; Wang, L.; et al. Tuning Electron Density Endows Fe1−xCoxP with Exceptional Capability of Electrooxidation of Organic Pollutants. Environ. Sci. Technol. 2019, 53, 13878–13887. [Google Scholar] [CrossRef]
- Qiao, J.; Xiong, Y. Electrochemical Oxidation Technology: A Review of Its Application in High-Efficiency Treatment of Wastewater Containing Persistent Organic Pollutants. J. Water Process Eng. 2021, 44, 102308. [Google Scholar] [CrossRef]
- Salazar-Banda, G.R.; de Oliveira Santiago Santos, G.; Duarte Gonzaga, I.M.; Dória, A.R.; Barrios Eguiluz, K.I. Developments in Electrode Materials for Wastewater Treatment. Curr. Opin. Electrochem. 2021, 26, 100663. [Google Scholar] [CrossRef]
- Barrios, J.A.; Becerril, E.; De León, C.; Barrera-Díaz, C.; Jiménez, B. Electrooxidation Treatment for Removal of Emerging Pollutants in Wastewater Sludge. Fuel 2015, 149, 26–33. [Google Scholar] [CrossRef]
- Ganiyu, S.O.; Oturan, N.; Raffy, S.; Cretin, M.; Esmilaire, R.; van Hullebusch, E.; Esposito, G.; Oturan, M.A. Sub-Stoichiometric Titanium Oxide (Ti4O7) as a Suitable Ceramic Anode for Electrooxidation of Organic Pollutants: A Case Study of Kinetics, Mineralization and Toxicity Assessment of Amoxicillin. Water Res. 2016, 106, 171–182. [Google Scholar] [CrossRef]
- Ganiyu, S.O.; Gamal El-Din, M. Insight into In-Situ Radical and Non-Radical Oxidative Degradation of Organic Compounds in Complex Real Matrix during Electrooxidation with Boron Doped Diamond Electrode: A Case Study of Oil Sands Process Water Treatment. Appl. Catal. B Environ. 2020, 279, 119366. [Google Scholar] [CrossRef]
- Ryan, D.R.; Maher, E.K.; Heffron, J.; Mayer, B.K.; McNamara, P.J. Electrocoagulation-Electrooxidation for Mitigating Trace Organic Compounds in Model Drinking Water Sources. Chemosphere 2021, 273, 129377. [Google Scholar] [CrossRef]
- Chen, Y.; Tu, Y.; Bai, Y.; Li, J.; Lu, J. Electrosorption Enhanced Electrooxidation of a Model Organic Pollutant at 3D SnO2-Sb Electrode in Superimposed Pulse Current Mode. Chemosphere 2018, 195, 63–69. [Google Scholar] [CrossRef] [PubMed]
- El-Kacemi, S.; Zazou, H.; Oturan, N.; Dietze, M.; Hamdani, M.; Es-Souni, M.; Oturan, M.A. Nanostructured ZnO-TiO2 Thin Film Oxide as Anode Material in Electrooxidation of Organic Pollutants. Application to the Removal of Dye Amido Black 10B from Water. Environ. Sci. Pollut. Res. 2017, 24, 1442–1449. [Google Scholar] [CrossRef]
- Ognjanović, M.; Stanković, D.M.; Fabián, M.; Vranješ-Đurić, S.; Antić, B.; Dojčinović, B. Tailoring IONP Shape and Designing Nanocomposite IONS@GN toward Modification of SPCE to Enhance Electrochemical Degradation of Organic Dye. Mater. Res. Express 2020, 7, 015509. [Google Scholar] [CrossRef]
- Nabizadeh Chianeh, F.; Avestan, M.S. Application of Central Composite Design for Electrochemical Oxidation of Reactive Dye on Ti/MWCNT Electrode. J. Iran. Chem. Soc. 2020, 17, 1073–1085. [Google Scholar] [CrossRef]
- Samarghandi, M.R.; Dargahi, A.; Shabanloo, A.; Nasab, H.Z.; Vaziri, Y.; Ansari, A. Electrochemical Degradation of Methylene Blue Dye Using a Graphite Doped PbO2 Anode: Optimization of Operational Parameters, Degradation Pathway and Improving the Biodegradability of Textile Wastewater. Arab. J. Chem. 2020, 13, 6847–6864. [Google Scholar] [CrossRef]
- Zhai, L.F.; Duan, M.F.; Qiao, M.X.; Sun, M.; Wang, S. Electro-Assisted Catalytic Wet Air Oxidation of Organic Pollutants on a MnO@C/GF Anode under Room Condition. Appl. Catal. B Environ. 2019, 256, 117822. [Google Scholar] [CrossRef]
- Nordin, N.; Pisal, M.A.F.; Razman, N.I.H.; Jaafar, N.F. Electrochemical Degradation of Reactive Blue 21 and Synthetic Textile Effluent by Using Co47.5/C47.5-PVC5 Composite Electrode. Acta Chim. Slov. 2019, 66, 284–293. [Google Scholar] [CrossRef] [Green Version]
- Vaghela, N.R.; Nath, K. Reduced Graphene Oxide Coated Graphite Electrodes for Treating Reactive Turquoise Blue 21 Rinse Water Using an Indirect Electro-Oxidation Process. SN Appl. Sci. 2020, 2, 1839. [Google Scholar] [CrossRef]
- Savić, B.G.; Stanković, D.M.; Živković, S.M.; Ognjanović, M.R.; Tasić, G.S.; Mihajlović, I.J.; Brdarić, T.P. Electrochemical Oxidation of a Complex Mixture of Phenolic Compounds in the Base Media Using PbO2-GNRs Anodes. Appl. Surf. Sci. 2020, 529, 147120. [Google Scholar] [CrossRef]
- Ječmenica Dučić, M.; Aćimović, D.; Savić, B.; Rakočević, L.; Simić, M.; Brdarić, T.; Vasić Anićijević, D. Is It Possible to Restrain OER on Simple Carbon Electrodes to Efficiently Electrooxidize Organic Pollutants? Molecules 2022, 27, 5203. [Google Scholar] [CrossRef] [PubMed]
- Simić, M.; Savić, B.; Ognjanović, M.; Stanković, D.; Relić, D.; Aćimović, D.; Brdarić, T. Degradation of Bisphenol A on SnO2-MWCNT Electrode Using Electrochemical Oxidation. J. Water Process Eng. 2023, 51, 103416. [Google Scholar] [CrossRef]
- Rodríguez-Narváez, O.M.; Picos, A.R.; Bravo-Yumi, N.; Pacheco-Alvarez, M.; Martínez-Huitle, C.A.; Peralta-Hernández, J.M. Electrochemical Oxidation Technology to Treat Textile Wastewaters. Curr. Opin. Electrochem. 2021, 29, 100806. [Google Scholar] [CrossRef]
- Martínez-Huitle, C.A.; dos Santos, E.V.; de Araújo, D.M.; Panizza, M. Applicability of Diamond Electrode/Anode to the Electrochemical Treatment of a Real Textile Effluent. J. Electroanal. Chem. 2012, 674, 103–107. [Google Scholar] [CrossRef] [Green Version]
- Orts, F.; del Río, A.I.; Molina, J.; Bonastre, J.; Cases, F. Electrochemical Treatment of Real Textile Wastewater: Trichromy Procion HEXL®. J. Electroanal. Chem. 2018, 808, 387–394. [Google Scholar] [CrossRef]
- Mahmoudian, F.; Nabizadeh Chianeh, F.; Sajjadi, S.M. Simultaneous Electrochemical Decolorization of Acid Red 33, Reactive Orange 7, Acid Yellow 3 and Malachite Green Dyes by Electrophoretically Prepared Ti/NanoZnO-MWCNTs Anode: Experimental Design. J. Electroanal. Chem. 2021, 884, 115066. [Google Scholar] [CrossRef]
- Kapalka, A.; Fóti, G.; Comninellis, C. Basic Principles of the Electrochemical Mineralization of Organic Pollutants for Wastewater Treatment. In Electrochemistry for the Environment; Comninellis, C., Chen, G., Eds.; Springer: New York, NY, USA, 2010; pp. 1–23. ISBN 978-0-387-68318-8. [Google Scholar]
- Orts, F.; del Río, A.I.; Molina, J.; Bonastre, J.; Cases, F. Study of the Reuse of Industrial Wastewater After Electrochemical Treatment of Textile Effluents without External Addition of Chloride. Int. J. Electrochem. Sci. 2019, 14, 1733–1750. [Google Scholar] [CrossRef]
- Duan, X.; Ma, F.; Yuan, Z.; Chang, L.; Jin, X. Electrochemical Degradation of Phenol in Aqueous Solution Using PbO2 Anode. J. Taiwan Inst. Chem. Eng. 2013, 44, 95–102. [Google Scholar] [CrossRef]
- Sun, M.; Ye, Z.; Xing, D.; Xu, Z.; Zhang, C.; Fu, D. Rethinking Electrochemical Oxidation of Bisphenol A in Chloride Medium: Formation of Toxic Chlorinated Oligomers. Sci. Total Environ. 2022, 830, 154825. [Google Scholar] [CrossRef]
- Lazarević-Pašti, T.D.; Bondžić, A.M.; Pašti, I.A.; Vasić, V.M. Indirect Electrochemical Oxidation of Organophosphorous Pesticides for Efficient Detection via Acetylcholinesterase Test. Pestic. Biochem. Physiol. 2012, 104, 236–242. [Google Scholar] [CrossRef]
- Chatzisymeon, E.; Xekoukoulotakis, N.P.; Coz, A.; Kalogerakis, N.; Mantzavinos, D. Electrochemical Treatment of Textile Dyes and Dyehouse Effluents. J. Hazard. Mater. 2006, 137, 998–1007. [Google Scholar] [CrossRef]
- Köse, H.; Aydin, A.O.; Akbulut, H. The Effect of Temperature on Grain Size of SnO 2 Nanoparticles Synthesized by Sol-Gel Method. Acta Phys. Pol. A 2014, 125, 345–347. [Google Scholar] [CrossRef]
- Patterson, A.L. The Scherrer Formula for X-ray Particle Size Determination. Phys. Rev. 1939, 56, 978–982. [Google Scholar] [CrossRef]
- Giannozzi, P.; Baroni, S.; Bonini, N.; Calandra, M.; Car, R.; Cavazzoni, C.; Ceresoli, D.; Chiarotti, G.L.; Cococcioni, M.; Dabo, I.; et al. QUANTUM ESPRESSO: A Modular and Open-Source Software Project for Quantum Simulations of Materials. J. Phys. Condens. Matter 2009, 21, 395502. [Google Scholar] [CrossRef] [PubMed]
- Perdew, J.P.; Burke, K.; Ernzerhof, M. Generalized Gradient Approximation Made Simple. Phys. Rev. Lett. 1996, 77, 3865–3868. [Google Scholar] [CrossRef] [Green Version]
- Martyna, G.J.; Tuckerman, M.E. A Reciprocal Space Based Method for Treating Long Range Interactions in Ab Initio and Force-Field-Based Calculations in Clusters. J. Chem. Phys. 1999, 110, 2810–2821. [Google Scholar] [CrossRef]
- Padmanabhan, J.; Parthasarathi, R.; Sarkar, U.; Subramanian, V.; Chattaraj, P.K. Effect of Solvation on the Condensed Fukui Function and the Generalized Philicity Index. Chem. Phys. Lett. 2004, 383, 122–128. [Google Scholar] [CrossRef]
- Löwdin, P.O. On the Nonorthogonality Problem. In Advances in Quantum Chemistry; Löwdin, P.O., Ed.; Elsevier: Amsterdam, The Netherlands, 1970; Volume 5, pp. 185–199. ISBN 978-0-12-034805-3. [Google Scholar]
- Kokalj, A. XCrySDen—A New Program for Displaying Crystalline Structures and Electron Densities. J. Mol. Graph. Model. 1999, 17, 176–179. [Google Scholar] [CrossRef]
- Sulaiman, N.S.; Mohamad Amini, M.H.; Danish, M.; Sulaiman, O.; Hashim, R.; Demirel, S.; Demirel, G.K. Characterization and Ofloxacin Adsorption Studies of Chemically Modified Activated Carbon from Cassava Stem. Materials 2022, 15, 5117. [Google Scholar] [CrossRef]
- Sreńscek-Nazzal, J.; Kamińska, A.; Miądlicki, P.; Wróblewska, A.; Kiełbasa, K.; Wróbel, R.J.; Serafin, J.; Michalkiewicz, B. Activated Carbon Modification towards Efficient Catalyst for High Value-Added Products Synthesis from Alpha-Pinene. Materials 2021, 14, 7811. [Google Scholar] [CrossRef]
- Chen, H.; Ding, L.; Sun, W.; Jiang, Q.; Hu, J.; Li, J. Synthesis and Characterization of Ni Doped SnO2 Microspheres with Enhanced Visible-Light Photocatalytic Activity. RSC Adv. 2015, 5, 56401–56409. [Google Scholar] [CrossRef]
- Koppenol, W.H.; Liebman, J.F. The Oxidizing Nature of the Hydroxyl Radical. A Comparison with the Ferryl Ion (FeO2+). J. Phys. Chem. 1984, 88, 99. [Google Scholar] [CrossRef]
- Villamena, F.A. Chemistry of Reactive Species. In Reactive Species Detection in Biology; Villamena, F.A., Ed.; Elsevier: Amsterdam, The Netherlands, 2017; pp. 13–64. ISBN 978-0-12-420017-3. [Google Scholar]
- Wang, J.; Martinez, T.; Yaniv, D.R.; McCormick, L.D. Scanning Tunneling Microscopic Investigation of Surface Fouling of Glassy Carbon Surfaces Due to Phenol Oxidation. J. Electroanal. Chem. Interfacial Electrochem. 1991, 313, 129–140. [Google Scholar] [CrossRef]
- Duan, X.; Tian, L.; Liu, W.; Chang, L. Study on Electrochemical Oxidation of 4-Chlorophenol on a Vitreous Carbon Electrode Using Cyclic Voltammetry. Electrochim. Acta 2013, 94, 192–197. [Google Scholar] [CrossRef]
- Ghanam, A.; Lahcen, A.A.; Amine, A. Electroanalytical Determination of Bisphenol A: Investigation of Electrode Surface Fouling Using Various Carbon Materials. J. Electroanal. Chem. 2017, 789, 58–66. [Google Scholar] [CrossRef]
- Bhaskar Raju, G.; Thalamadai Karuppiah, M.; Latha, S.S.; Latha Priya, D.; Parvathy, S.; Prabhakar, S. Electrochemical Pretreatment of Textile Effluents and Effect of Electrode Materials on the Removal of Organics. Desalination 2009, 249, 167–174. [Google Scholar] [CrossRef]
- Weschenfelder, S.E.; José, H.J.; Gebhardt, W.; Schröder, H.F. Monitoring the Physicochemical and Chemical Treatment of Textile Wastewater Using GC/MS, LC/MS and -MS/MS Techniques. Sep. Sci. Technol. 2007, 42, 1535–1551. [Google Scholar] [CrossRef]
- Ma, P.; Ma, H.; Sabatino, S.; Galia, A.; Scialdone, O. Electrochemical Treatment of Real Wastewater. Part 1: Effluents with Low Conductivity. Chem. Eng. J. 2018, 336, 133–140. [Google Scholar] [CrossRef]
Figure 1.
FTIR spectra of GNP, SnO2/GNP, and TiO2/GNP.
Figure 1.
FTIR spectra of GNP, SnO2/GNP, and TiO2/GNP.
Figure 2.
XRD patterns of the carbon-based coatings after the electrochemical degradation at 10 mA/cm2 for 6 h.
Figure 2.
XRD patterns of the carbon-based coatings after the electrochemical degradation at 10 mA/cm2 for 6 h.
Figure 3.
Linear sweep voltammograms of all investigated electrodes in 0.1 M Na2SO4 at a scanning rate of 50 mV/s.
Figure 3.
Linear sweep voltammograms of all investigated electrodes in 0.1 M Na2SO4 at a scanning rate of 50 mV/s.
Figure 4.
Cyclic voltammograms of (a) SnO2/GNP@SS; (b) TiO2/GNP@SS; (c) GNP@SS electrodes in 0.1 M Na2SO4 with different concentrations of dyes mixture, at scan speed 100 mV/s.
Figure 4.
Cyclic voltammograms of (a) SnO2/GNP@SS; (b) TiO2/GNP@SS; (c) GNP@SS electrodes in 0.1 M Na2SO4 with different concentrations of dyes mixture, at scan speed 100 mV/s.
Figure 5.
Stability, repeatability and reproducibility studies of SnO2/GNP@SS electrode: (a) cyclic stability; (b) repeatability—cyclic voltammograms of two individual experiments with the same electrode; (c) repeatability—peak currents comparison; (d) reproducibility—comparison of peak currents obtained with two independent electrodes.
Figure 6.
UPLC analysis: (a) Chromatograms of initial dyes mixture and solutions obtained during the degradation at GNP electrode at current density 10 mA/cm2; (b) Individual chromatograms of dyes mixture and its components (BCG, CR, and TB).
Figure 6.
UPLC analysis: (a) Chromatograms of initial dyes mixture and solutions obtained during the degradation at GNP electrode at current density 10 mA/cm2; (b) Individual chromatograms of dyes mixture and its components (BCG, CR, and TB).
Figure 7.
Degradation of dyes mixture (15 ppm dyes mixture in 0.1 M Na2SO4, mass ratio BCG:CR:TB = 1:1:1) at 10 mA/cm2: (a) total dyes depletion at all investigated electrodes; (b–d) individual depletion of mixture components at GNP@SS, SnO2/GNP@SS, and TiO2/GNP@SS electrodes, respectively.
Figure 7.
Degradation of dyes mixture (15 ppm dyes mixture in 0.1 M Na2SO4, mass ratio BCG:CR:TB = 1:1:1) at 10 mA/cm2: (a) total dyes depletion at all investigated electrodes; (b–d) individual depletion of mixture components at GNP@SS, SnO2/GNP@SS, and TiO2/GNP@SS electrodes, respectively.
Figure 8.
Relative peak intensities of degradation products identified by GCMS analysis.
Figure 8.
Relative peak intensities of degradation products identified by GCMS analysis.
Figure 9.
Probable degradation mechanism of cresol red.
Figure 9.
Probable degradation mechanism of cresol red.
Figure 10.
DFT calculated Fukui indices of radical attack for the most susceptible oxygen atoms. For comparison, Fukui indices for all atoms are given in
Supplementary Material (Table S1).
Figure 10.
DFT calculated Fukui indices of radical attack for the most susceptible oxygen atoms. For comparison, Fukui indices for all atoms are given in
Supplementary Material (Table S1).
Table 1.
Dyes used for preparation of electrolyzed mixture in 0.1 M Na2SO4.
Table 2.
Pseudo-first-order rate constants of degradation of cresol red and total dyes mixture.
Table 2.
Pseudo-first-order rate constants of degradation of cresol red and total dyes mixture.
| Electrode | kcresol red, 1/min | kmixture, 1/min |
|---|
| GNP@SS | 0.83 ± 0.01 | 0.306 ± 0.001 |
| GNP/SnO2@SS | 0.99 ±0.08 | 0.375 ± 0.002 |
| GNP/TiO2@SS | 1.23 ± 0.20 | 0.352 ± 0.001 |
Table 3.
Products obtained during electrochemical degradation, identified by GC-MS analysis.
Table 3.
Products obtained during electrochemical degradation, identified by GC-MS analysis.
| Compound | Structural Formula | Characteristic Ions (m/z) |
| 6-acetyl-5-hydroxy-4-methylcyclohexa-2,4-dien-1-one | ![Crystals 13 00125 i004]() | 166, 125, 111 |
| 2,4-dimethylphenol | ![Crystals 13 00125 i005]() | 122, 107, 121 |
| 4-benzylidene-2-methyl-cyclohexa-2,5-dien-1-one | ![Crystals 13 00125 i006]() | 196, 120, 91 |
Table 4.
Degree of mineralisation (%) obtained by TOC analysis at the investigated electrodes.
Table 4.
Degree of mineralisation (%) obtained by TOC analysis at the investigated electrodes.
| Electrode | Mineralisation Efficiency, % |
|---|
| GNP@SS | 30.63 |
| SnO2/GNP@SS | 35.19 |
| TiO2/GNP@SS | 32.86 |
| Disclaimer/Publisher’s Note: The statements, opinions and data contained in all publications are solely those of the individual author(s) and contributor(s) and not of MDPI and/or the editor(s). MDPI and/or the editor(s) disclaim responsibility for any injury to people or property resulting from any ideas, methods, instructions or products referred to in the content. |
© 2023 by the authors. Licensee MDPI, Basel, Switzerland. This article is an open access article distributed under the terms and conditions of the Creative Commons Attribution (CC BY) license (https://creativecommons.org/licenses/by/4.0/).


 ,
, 


