
Study of Crack-Propagation Mechanism of Al0.1CoCrFeNi High-Entropy Alloy by Molecular Dynamics Method
Abstract
:1. Introduction
2. Computational Methods
3. Results and Discussion
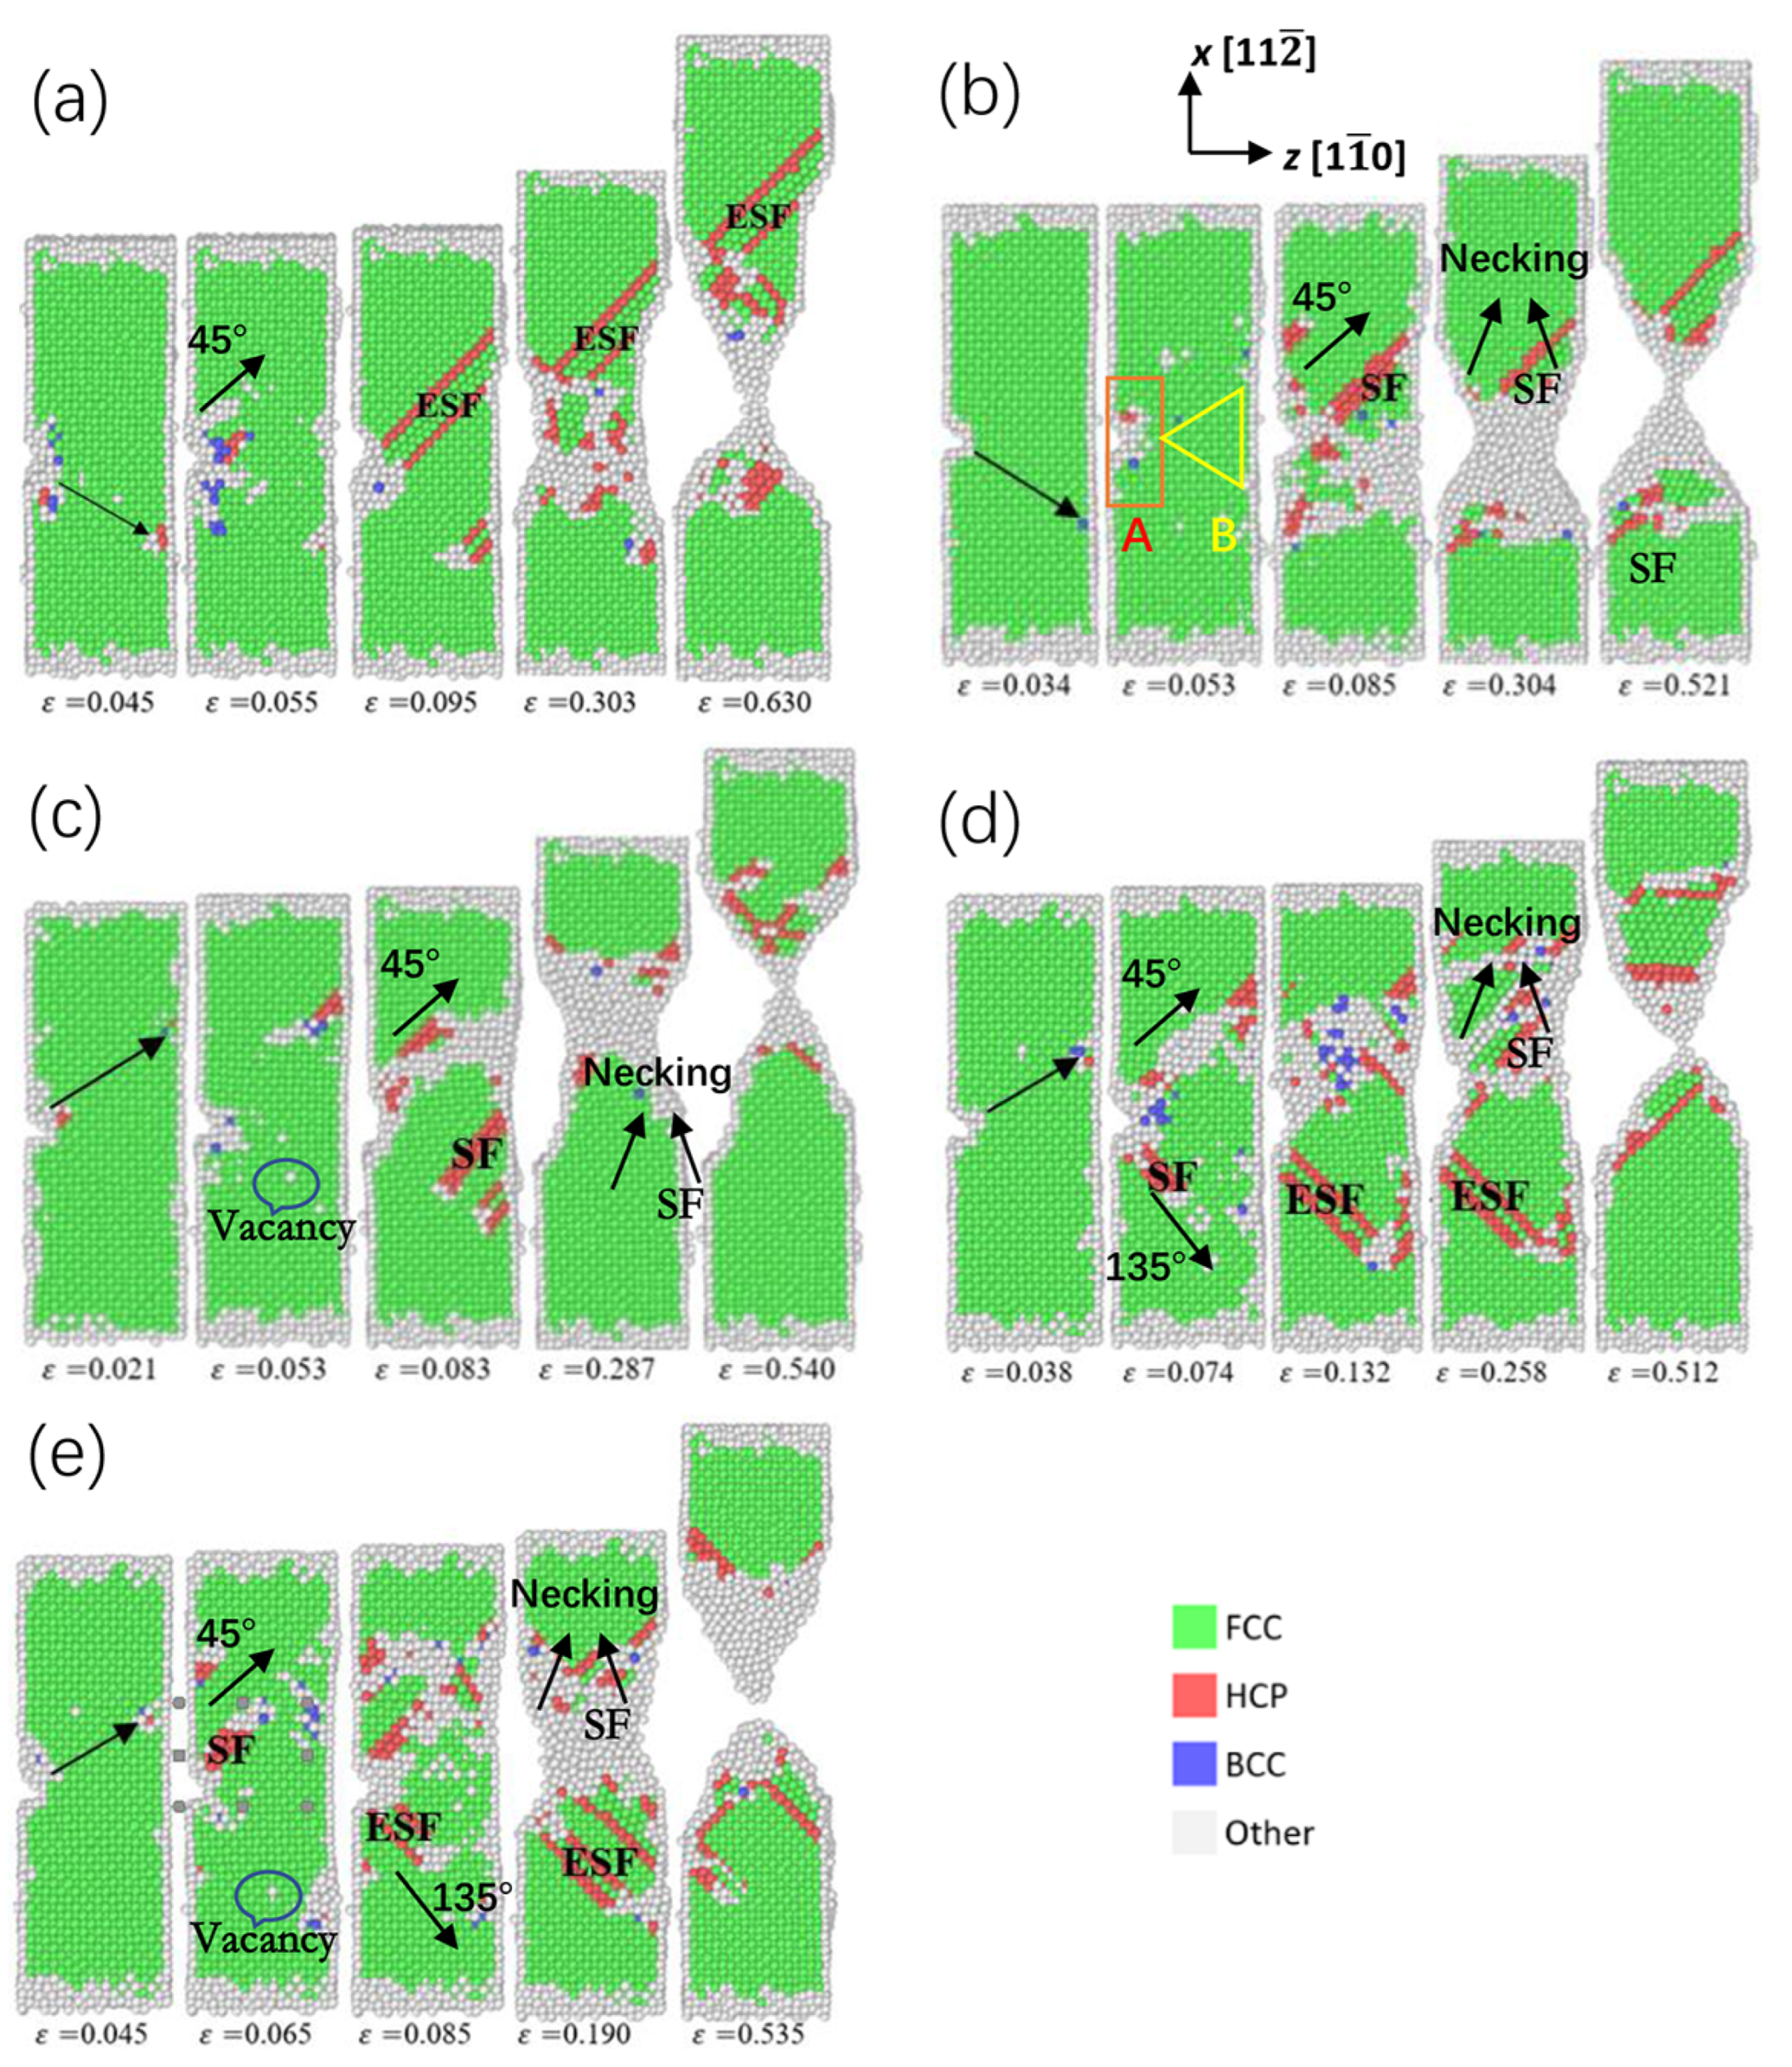
3.1. Crack Propagation for SC-HEA
3.2. Crack Propagation for GB-HEA
4. Conclusions
Author Contributions
Funding
Institutional Review Board Statement
Informed Consent Statement
Data Availability Statement
Conflicts of Interest
References
- Yeh, J.W.; Chen, S.K.; Lin, S.J.; Gan, J.Y.; Chin, T.S.; Shun, T.T.; Chang, S.Y. Nanostructured high-entropy alloys with multiple principal elements: Novel alloy design concepts and outcomes. Adv. Eng. Mater. 2004, 6, 299–303. [Google Scholar] [CrossRef]
- Zhang, Y.; Zuo, T.T.; Tang, Z.; Gao, M.C.; Dahmen, K.A.; Liaw, P.K.; Lu, Z.P. Microstructures and properties of high-entropy alloys. Prog. Mater. Sci. 2014, 61, 1–93. [Google Scholar] [CrossRef]
- Choudhuri, D.; Komarasamy, M.; Ageh, V. Investigation of plastic deformation modes in Al0.1CoCrFeNi high entropy alloy. Mater. Chem. Phys. 2018, 217, 308–314. [Google Scholar] [CrossRef]
- Cheng, S.-H.; Sun, C.-T. Size-dependent fracture toughness of nanoscale structures: Crack-tip stress approach in molecular dynamics. J. Nanomech. Micromech. 2014, 4, A414001. [Google Scholar] [CrossRef]
- Liu, C.-X.; Wang, R.; Jian, Z.-Y. The Influence of Grain Boundaries on Crystal Structure and Tensile Mechanical Properties of Al0.1CoCrFeNi High-Entropy Alloys Studied by Molecular Dynamics Method. Crystals 2022, 12, 48. [Google Scholar] [CrossRef]
- Sun, Z.; Shi, C.; Liu, C.; Shi, H.; Zhou, J. The effect of short-range order on mechanical properties of high entropy alloy Al0.3CoCrFeNi. Mater. Des. 2022, 223, 111214. [Google Scholar] [CrossRef]
- Yang, Y.-C.; Liu, C.-X.; Lin, C.-Y.; Xia, Z.-H. Core Effect of Local Atomic Configuration and Design principles in AlxCoCrFeNi High-Entropy Alloys. Scr. Mater. 2020, 178, 181–186. [Google Scholar] [CrossRef]
- Zhang, Z.; Mao, M.M.; Wang, J.; Gludovatz, B.; Zhang, Z.; Mao, S.X.; Ritchie, R.O. Nanoscale origins of the damage tolerance of the high-entropy alloy CrMnFeCoNi. Nat. Commun. 2015, 6, 10143. [Google Scholar] [CrossRef] [PubMed] [Green Version]
- Liu, C.-X.; Yang, Y.-C.; Xia, Z.-H. Deformation Mechanism in Al0.1CoCrFeNi Σ3(111)[1[1 with combining macron]0] High Entropy Alloys-Molecular Dynamics Simulation. RSC Adv. 2020, 10, 27688–27696. [Google Scholar]
- Li, L.; Chen, H.; Fang, Q.; Li, J.; Liu, F.; Liu, Y.; Liaw, P.K. Effect of temperature and strain rate on plastic deformation mechanisms of nanocrystalline high-entropy alloys. Intermetallics 2020, 120, 106741. [Google Scholar] [CrossRef]
- Wang, Z.-N.; Li, J.; Fang, Q.-H.; Liu, B.; Zhang, L.-C. Investigation into nanoscratching mechanical response of AlCrCuFeNi high-entropy alloys using atomic simulation. Appl. Surf. Sci. 2017, 416, 470–481. [Google Scholar] [CrossRef]
- Daw, M.-S.; Baskes, M.-I. Embedded-atom method: Derivation and application to impurities, surfaces, and other defects in metals. Phys. Rev. B 1984, 29, 6443–6453. [Google Scholar] [CrossRef] [Green Version]
- Lim, T.-C. The relationship between Lennard-Jones (12–6) and Morse potential functions. Z. Fur Nat. A J. Phys. Sci. 2003, 58, 615–617. [Google Scholar] [CrossRef]
- Soylu, A.; Bayrak, O.; Boztosun, I. Effect of the velocity-dependent potentials on the energy eigenvalues of the Morse potential. Open Phys. 2012, 10, 953–959. [Google Scholar] [CrossRef] [Green Version]
- Roller, D.; Tran, F.; Blaha, P. Merits and limits of the modified Becke-Johnson exchange potential. Phys. Rev. B 2011, 83, 173–184. [Google Scholar]
- Yang, Y.-C.; Liu, C.-X.; Lin, C.-Y.; Xia, Z.-H. The effect of local atomic configuration in high-entropy alloys on the dislocation behaviors and mechanical properties. Mater. Sci. Eng. A 2021, 815, 141253. [Google Scholar] [CrossRef]
- Wang, J.; Yu, L.-M.; Yuan, H.-A.; Li, H.-J.; Liu, Y.-C. Effect of Crystal Orientation and He Density on Crack Propagation Behavior of bcc-Fe. Acta Metall. Sin. 2018, 54, 47–54. [Google Scholar]
- Payne, M.C.; Teter, M.P.; Allan, D.C.; Arias, T.A.; Joannopoulos, A.J. Iterative minimization techniques for abinitio total-energy calculations: Molecular dynamics and conjugate gradients. Rev. Mod. Phys. 1992, 64, 1045–1097. [Google Scholar] [CrossRef] [Green Version]
- Li, W.; Liaw, P.-K.; Gao, Y. Fracture resistance of high entropy alloys: A review. Intermetallics 2018, 99, 69–83. [Google Scholar] [CrossRef]
- Liu, G. In situ TEM Study of AlCoCrFeNi Dual-Phase High-Entropy Alloy. Master’s Thesis, Zhejiang University, Hangzhou, China, 2019; pp. 41–47. [Google Scholar]
- Bahramyan, M.; Mousavian, R.T.; Brabazon, D. Study of the plastic deformation mechanism of TRIP–TWIP high entropy alloys at the atomic level. Int. J. Plast. 2020, 127, 102649. [Google Scholar] [CrossRef]


| Strain Rate/s−1 | 5 × 10⁸ | 8 × 10⁸ | 1 × 10⁹ | 2 × 10⁹ | 5 × 10⁹ |
|---|---|---|---|---|---|
| Yield strength/GPa | 5.7786 | 5.9517 | 5.7458 | 6.1128 | 6.4878 |
| Young’s modulus/GPa | 66.8081 | 52.4974 | 69.2321 | 89.7900 | 74.7483 |
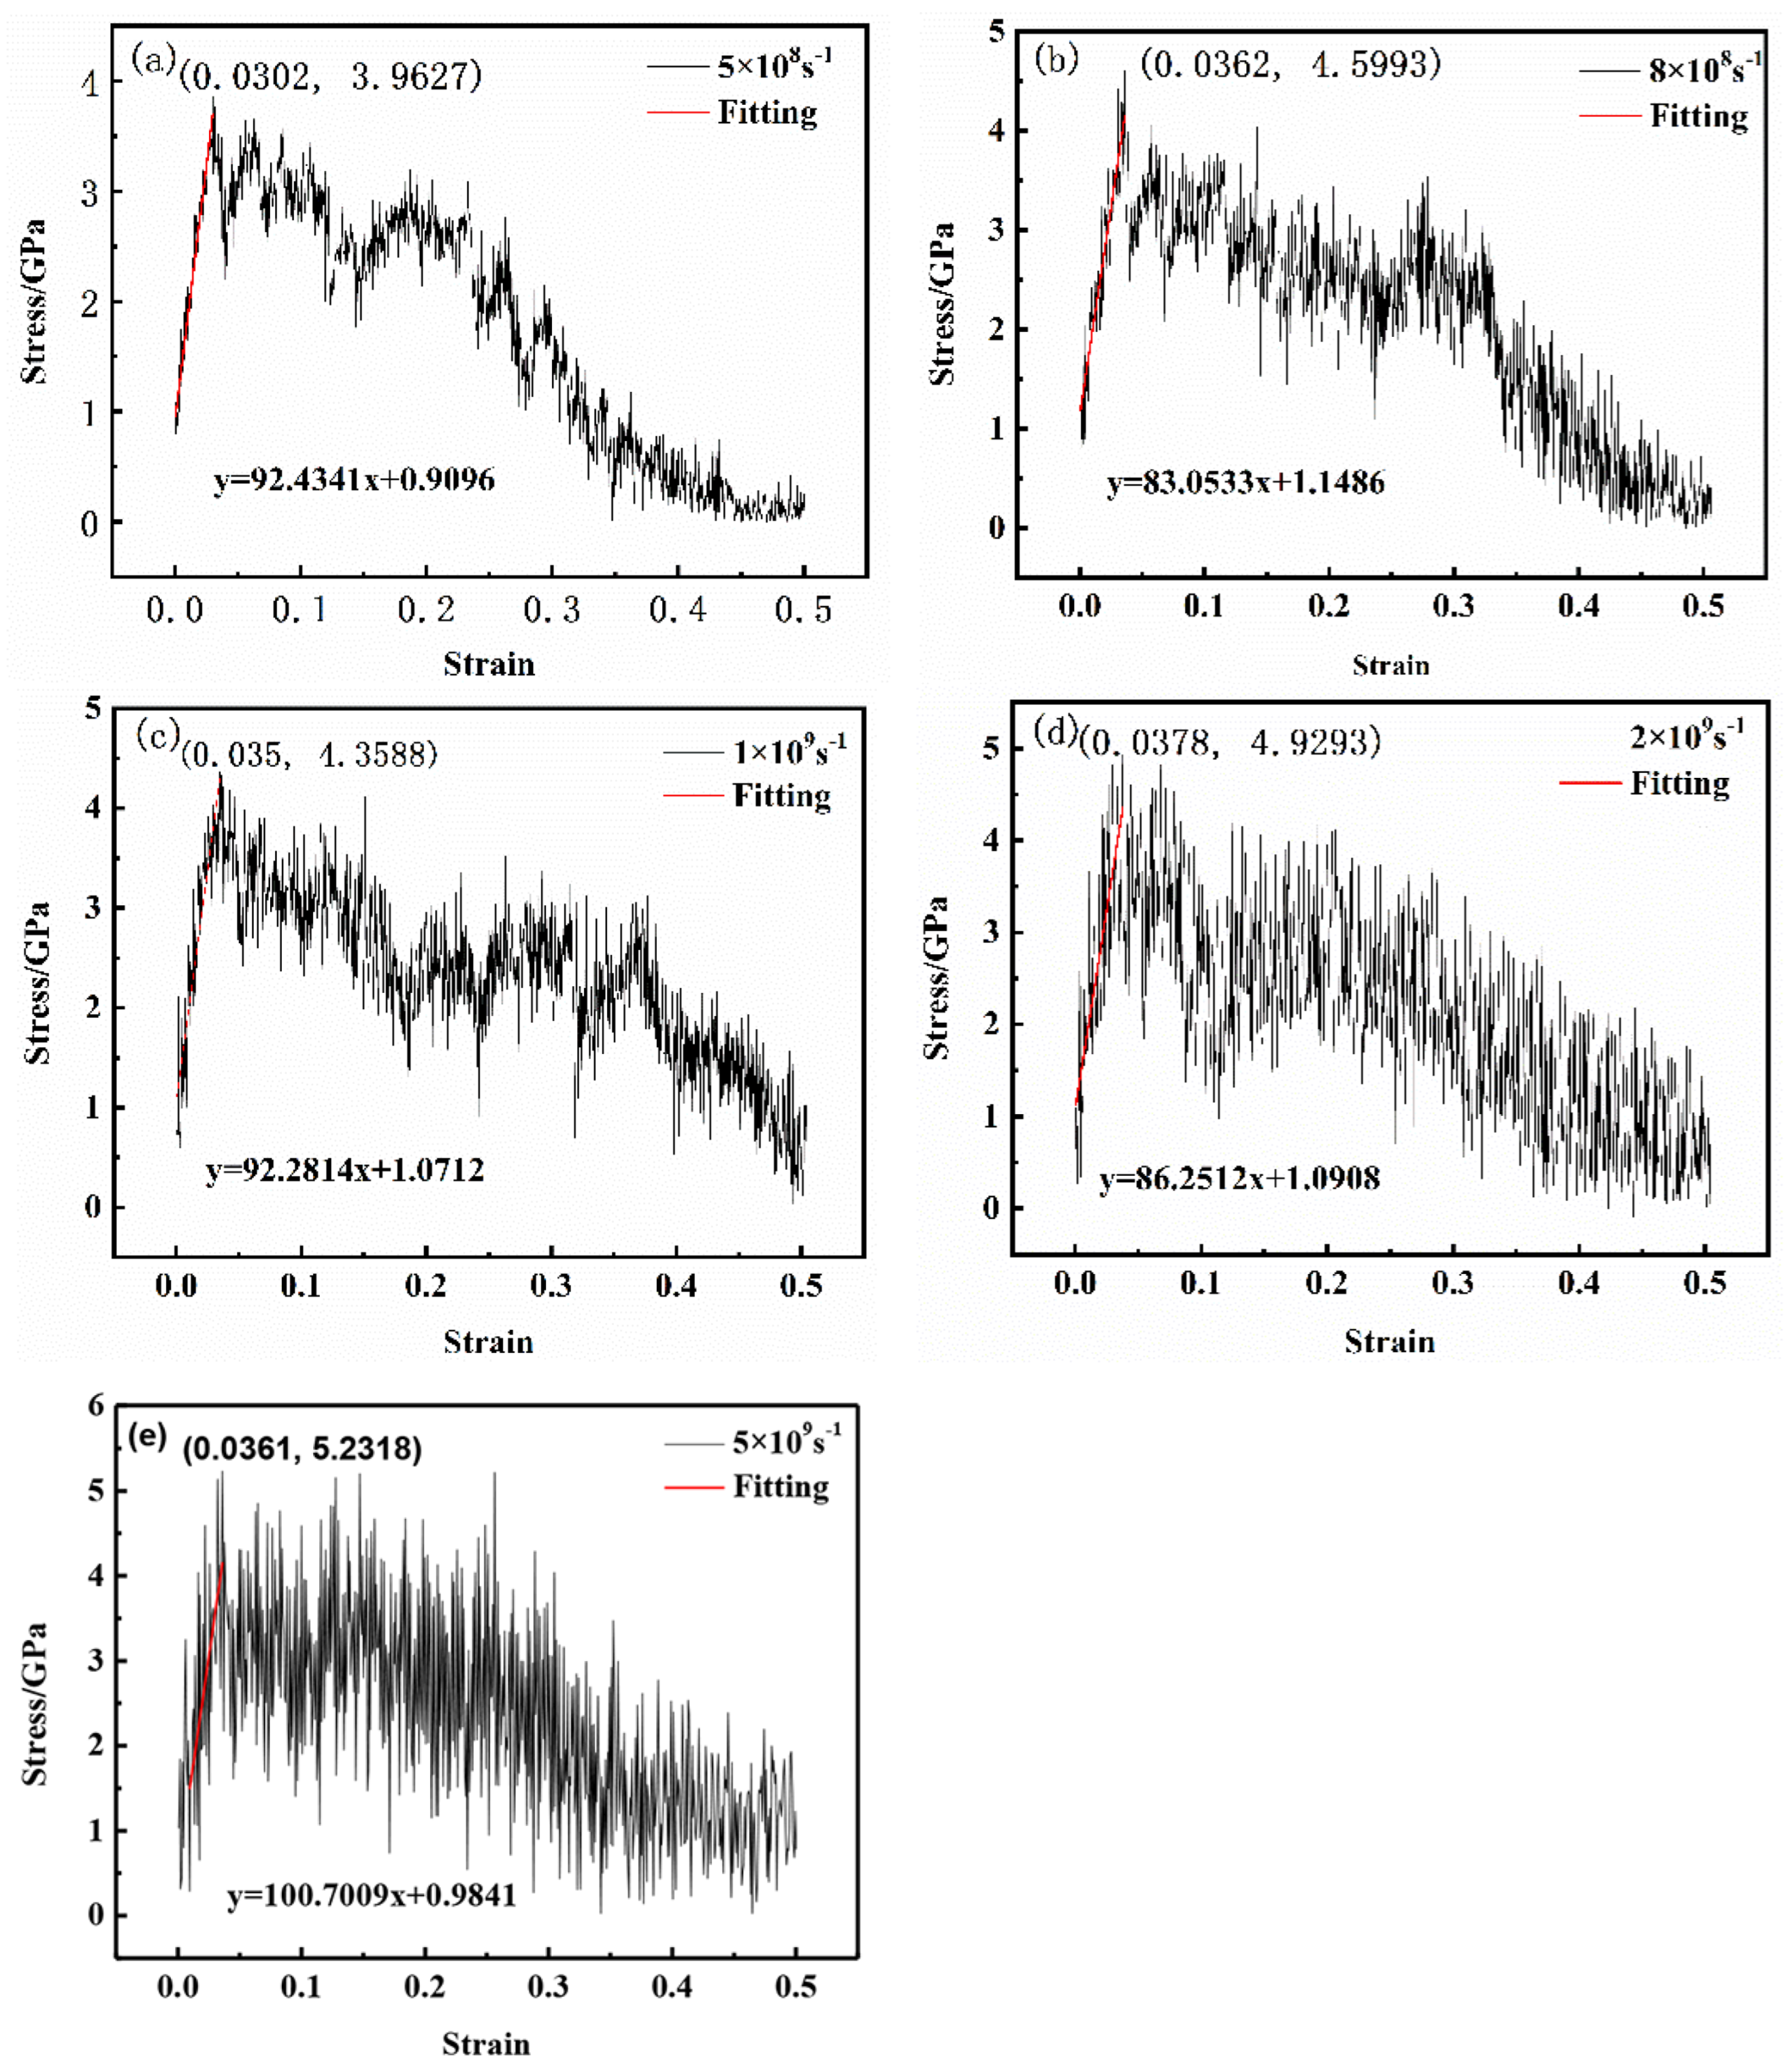
| Strain Rate/s−1 | 5 × 10⁸ | 8 × 10⁸ | 1 × 10⁹ | 2 × 10⁹ | 5 × 10⁹ |
|---|---|---|---|---|---|
| Yield strength/GPa | 3.9627 | 4.5993 | 4.3588 | 4.9293 | 5.2318 |
| Young’s modulus/GPa | 92.4341 | 83.0533 | 92.2814 | 86.2512 | 100.7009 |
Disclaimer/Publisher’s Note: The statements, opinions and data contained in all publications are solely those of the individual author(s) and contributor(s) and not of MDPI and/or the editor(s). MDPI and/or the editor(s) disclaim responsibility for any injury to people or property resulting from any ideas, methods, instructions or products referred to in the content. |
© 2022 by the authors. Licensee MDPI, Basel, Switzerland. This article is an open access article distributed under the terms and conditions of the Creative Commons Attribution (CC BY) license (https://creativecommons.org/licenses/by/4.0/).
Share and Cite
Liu, C.; Yao, Y. Study of Crack-Propagation Mechanism of Al0.1CoCrFeNi High-Entropy Alloy by Molecular Dynamics Method. Crystals 2023, 13, 11. https://doi.org/10.3390/cryst13010011
Liu C, Yao Y. Study of Crack-Propagation Mechanism of Al0.1CoCrFeNi High-Entropy Alloy by Molecular Dynamics Method. Crystals. 2023; 13(1):11. https://doi.org/10.3390/cryst13010011
Chicago/Turabian StyleLiu, Cuixia, and Yu Yao. 2023. "Study of Crack-Propagation Mechanism of Al0.1CoCrFeNi High-Entropy Alloy by Molecular Dynamics Method" Crystals 13, no. 1: 11. https://doi.org/10.3390/cryst13010011