
Stress Analysis of KDP Single Crystals Caused by Thermal Expansion Mismatch during Traditional Growth

Abstract
:1. Introduction
2. Simulation
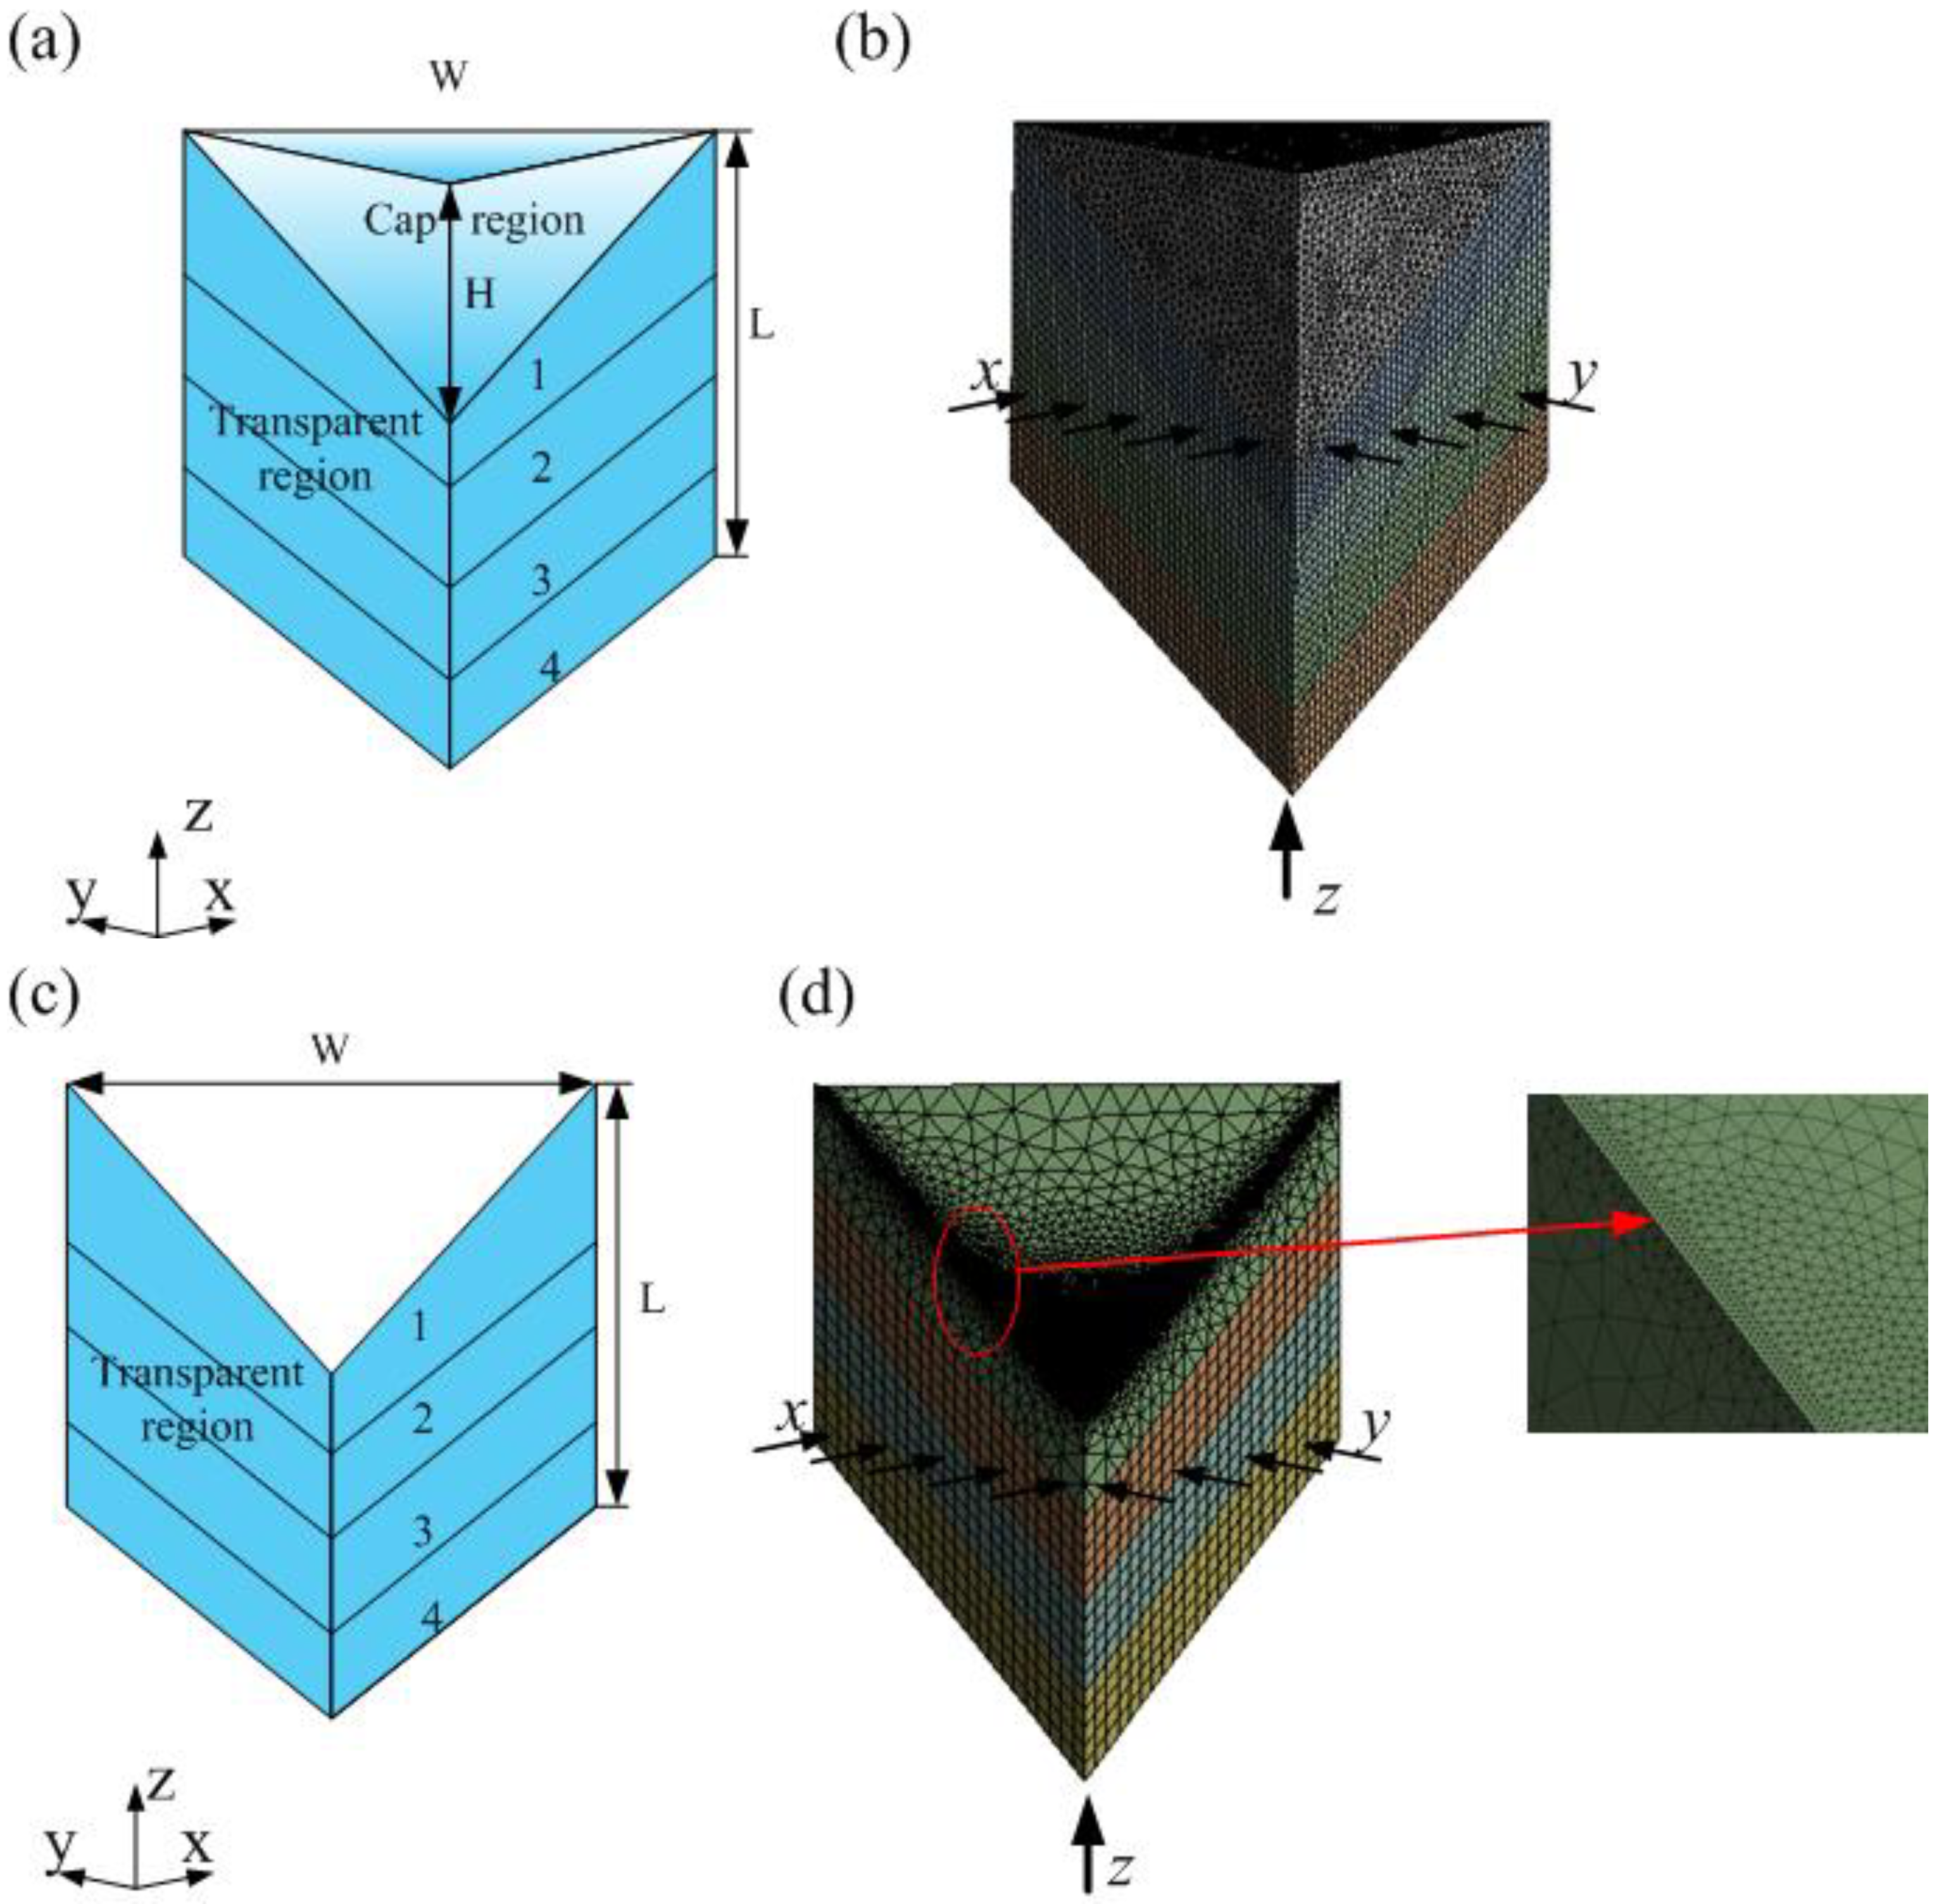
2.1. Physical Model
2.2. Thermoelastic Stress Analysis
3. Results
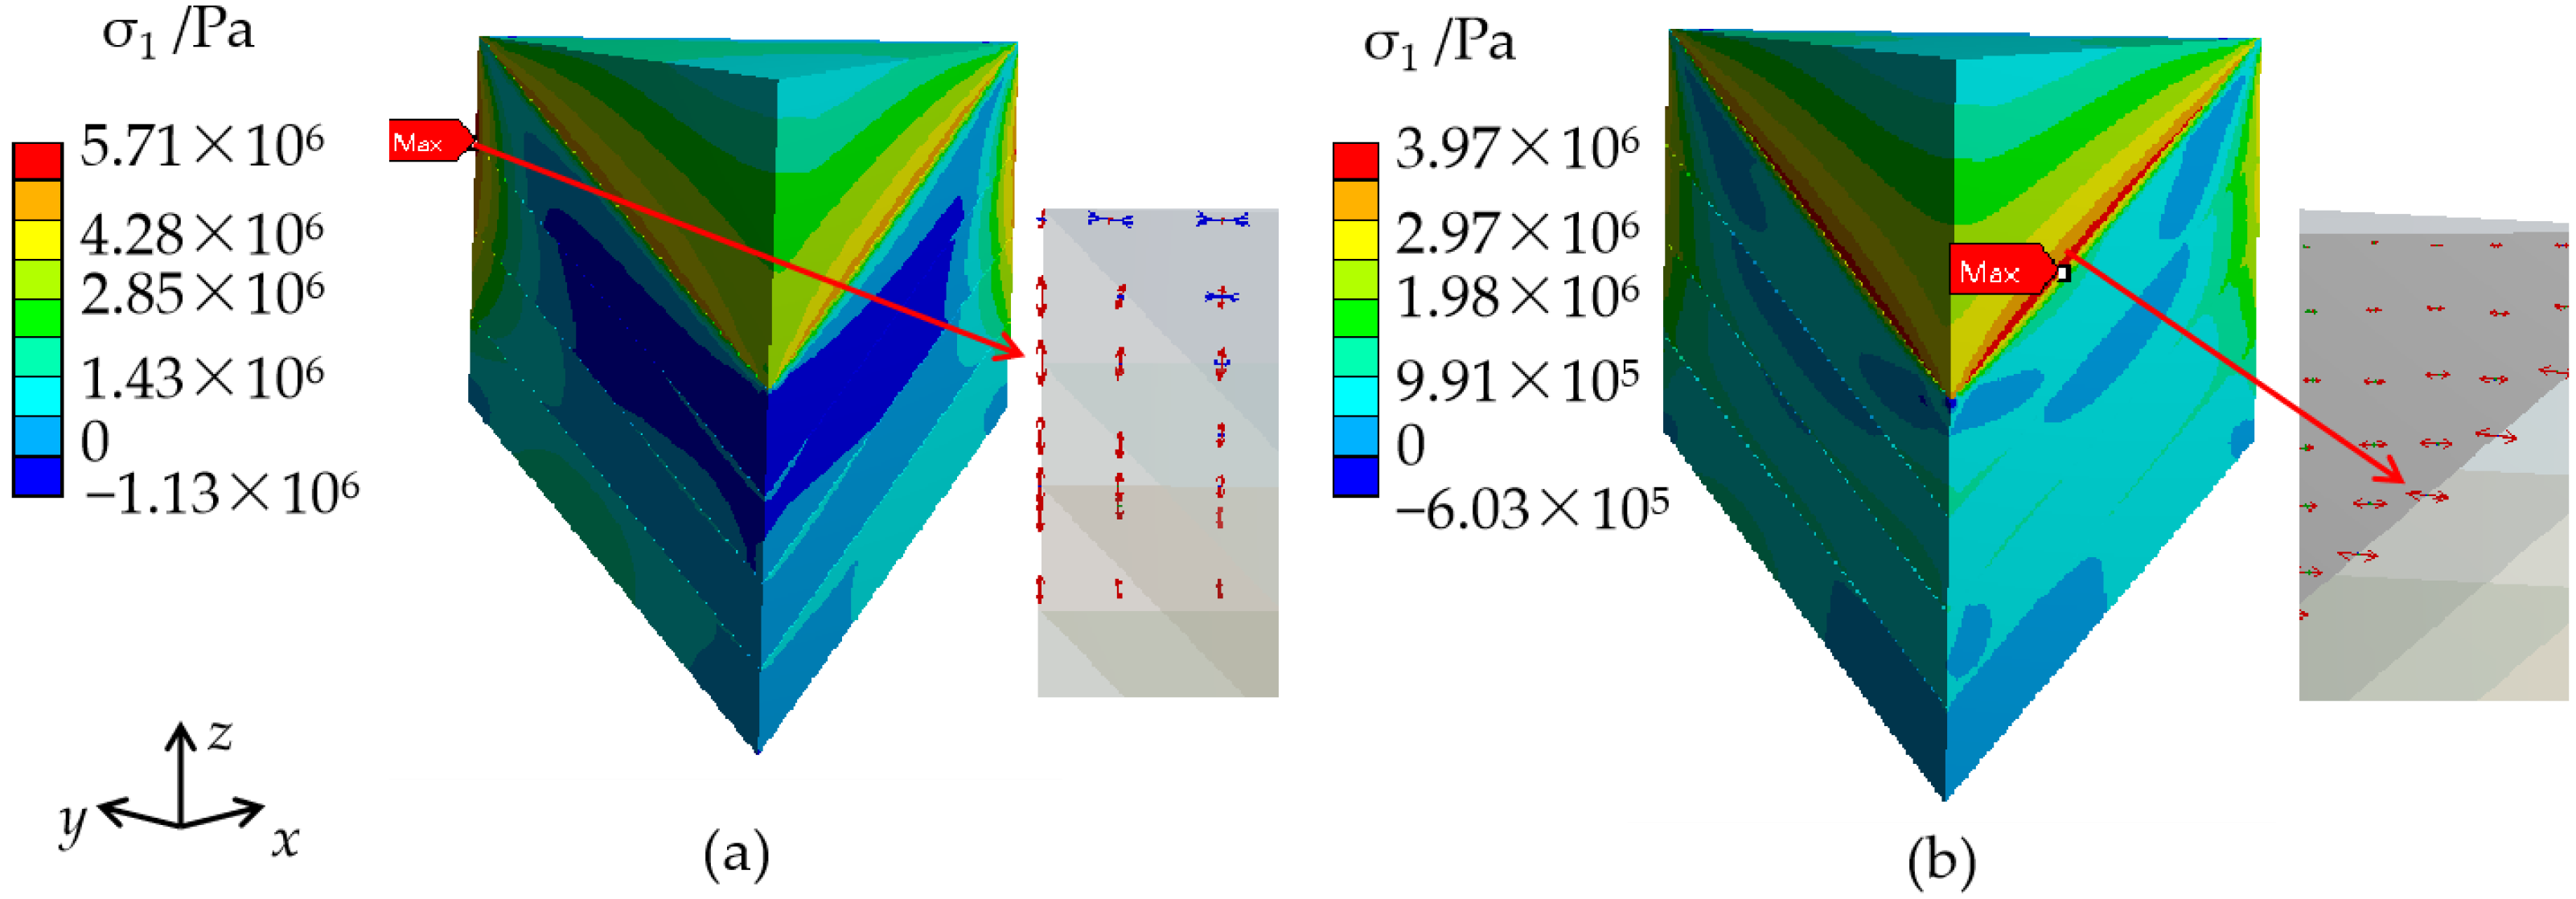
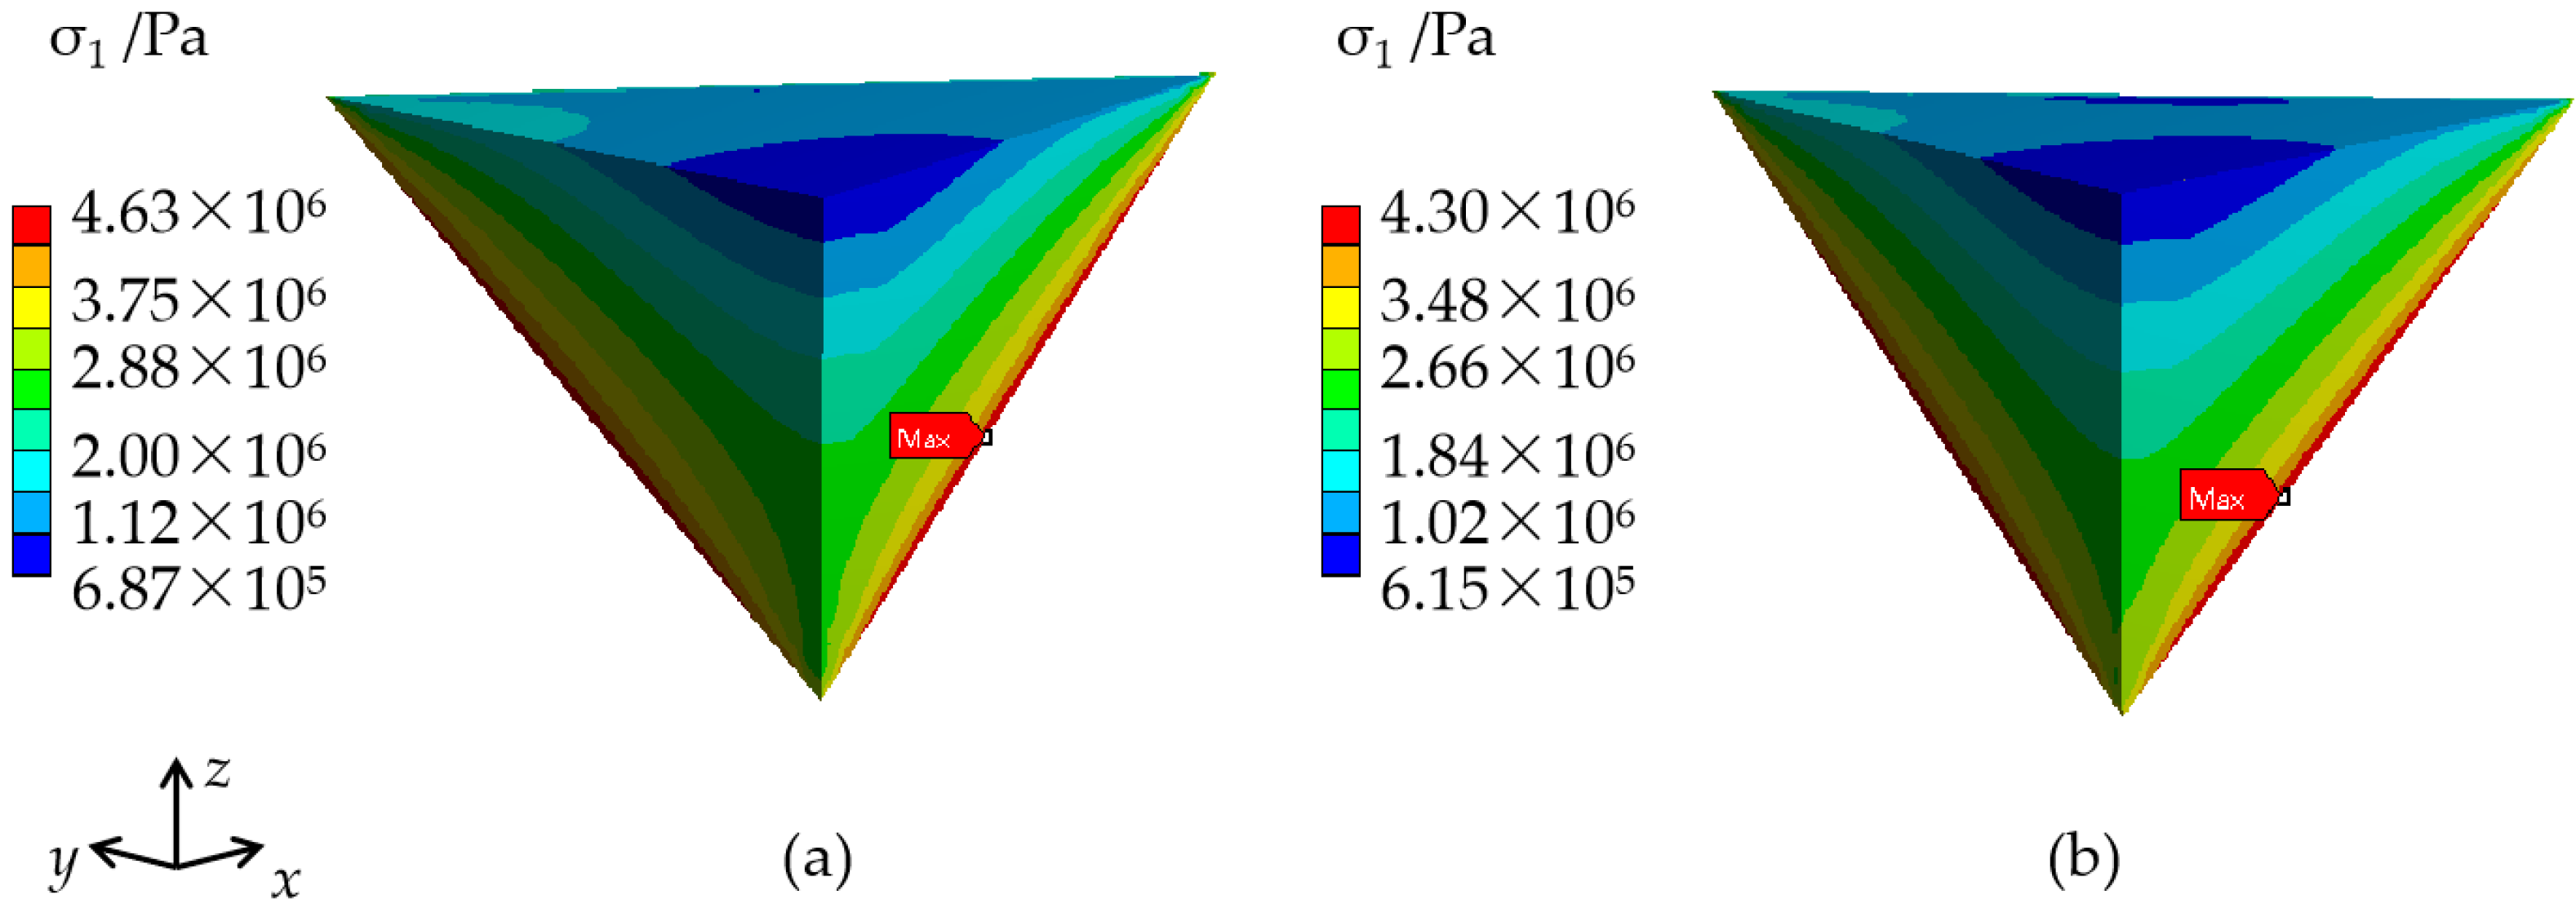
3.1. Stress in KDP Crystals including the Cap Region
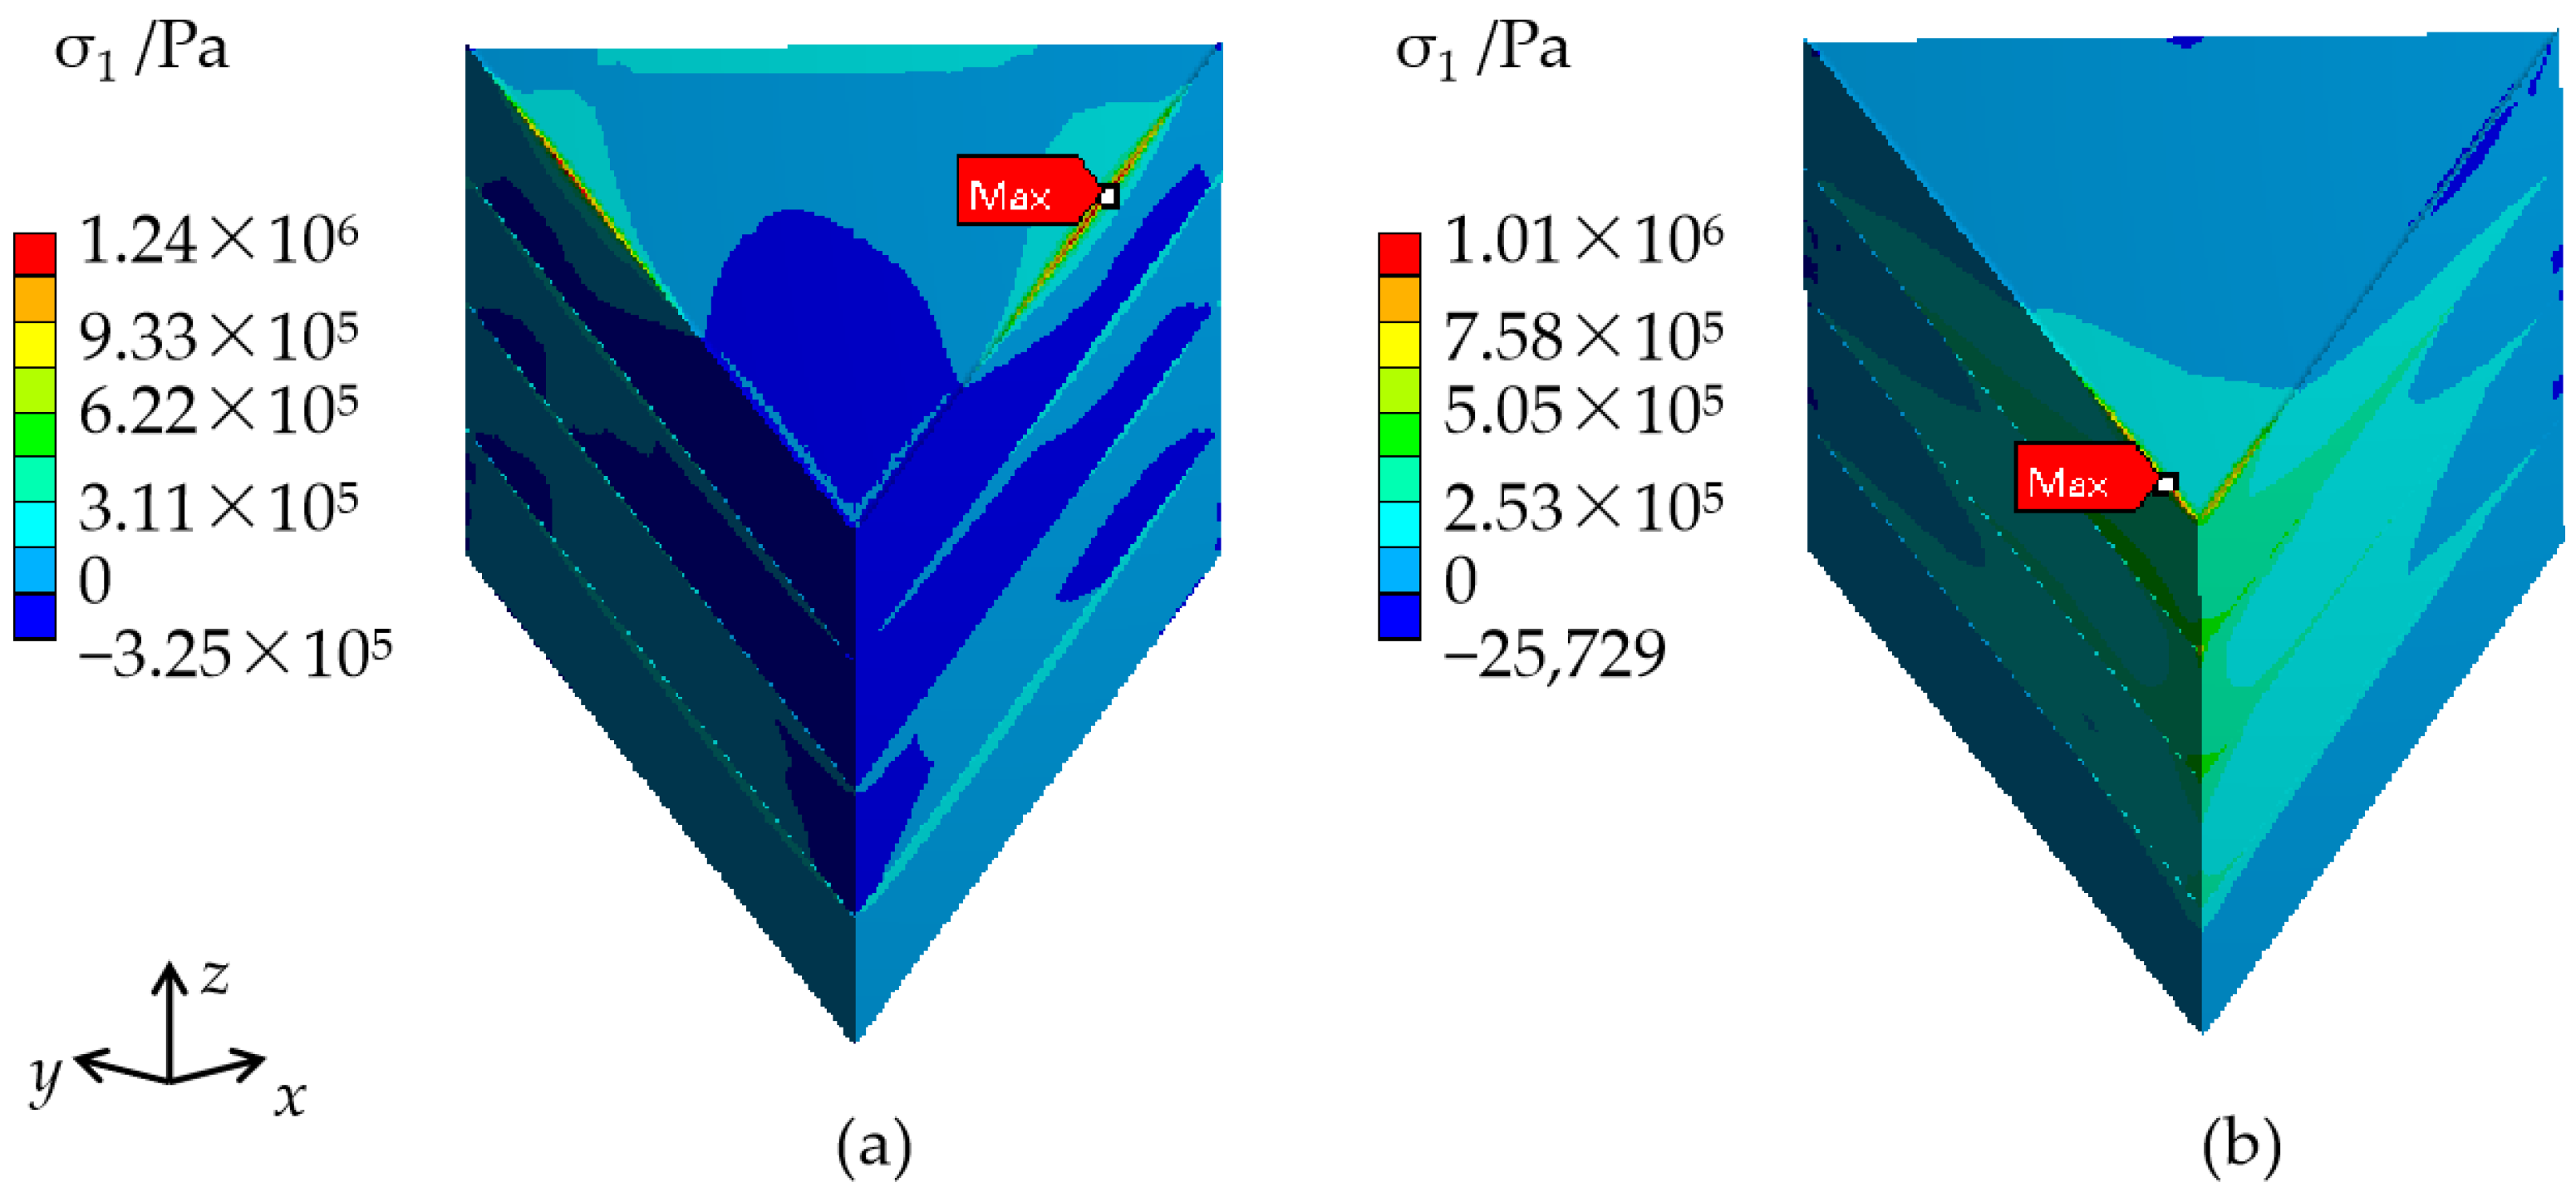
3.1.1. Effect of the Thermal Expansion Coefficient Variation Trend
3.1.2. Effect of the Thermal Expansion Coefficient Changing Range
3.1.3. Effect of the Thermal Expansion Coefficient Variation in One Direction
3.1.4. Effect of Crystal Size
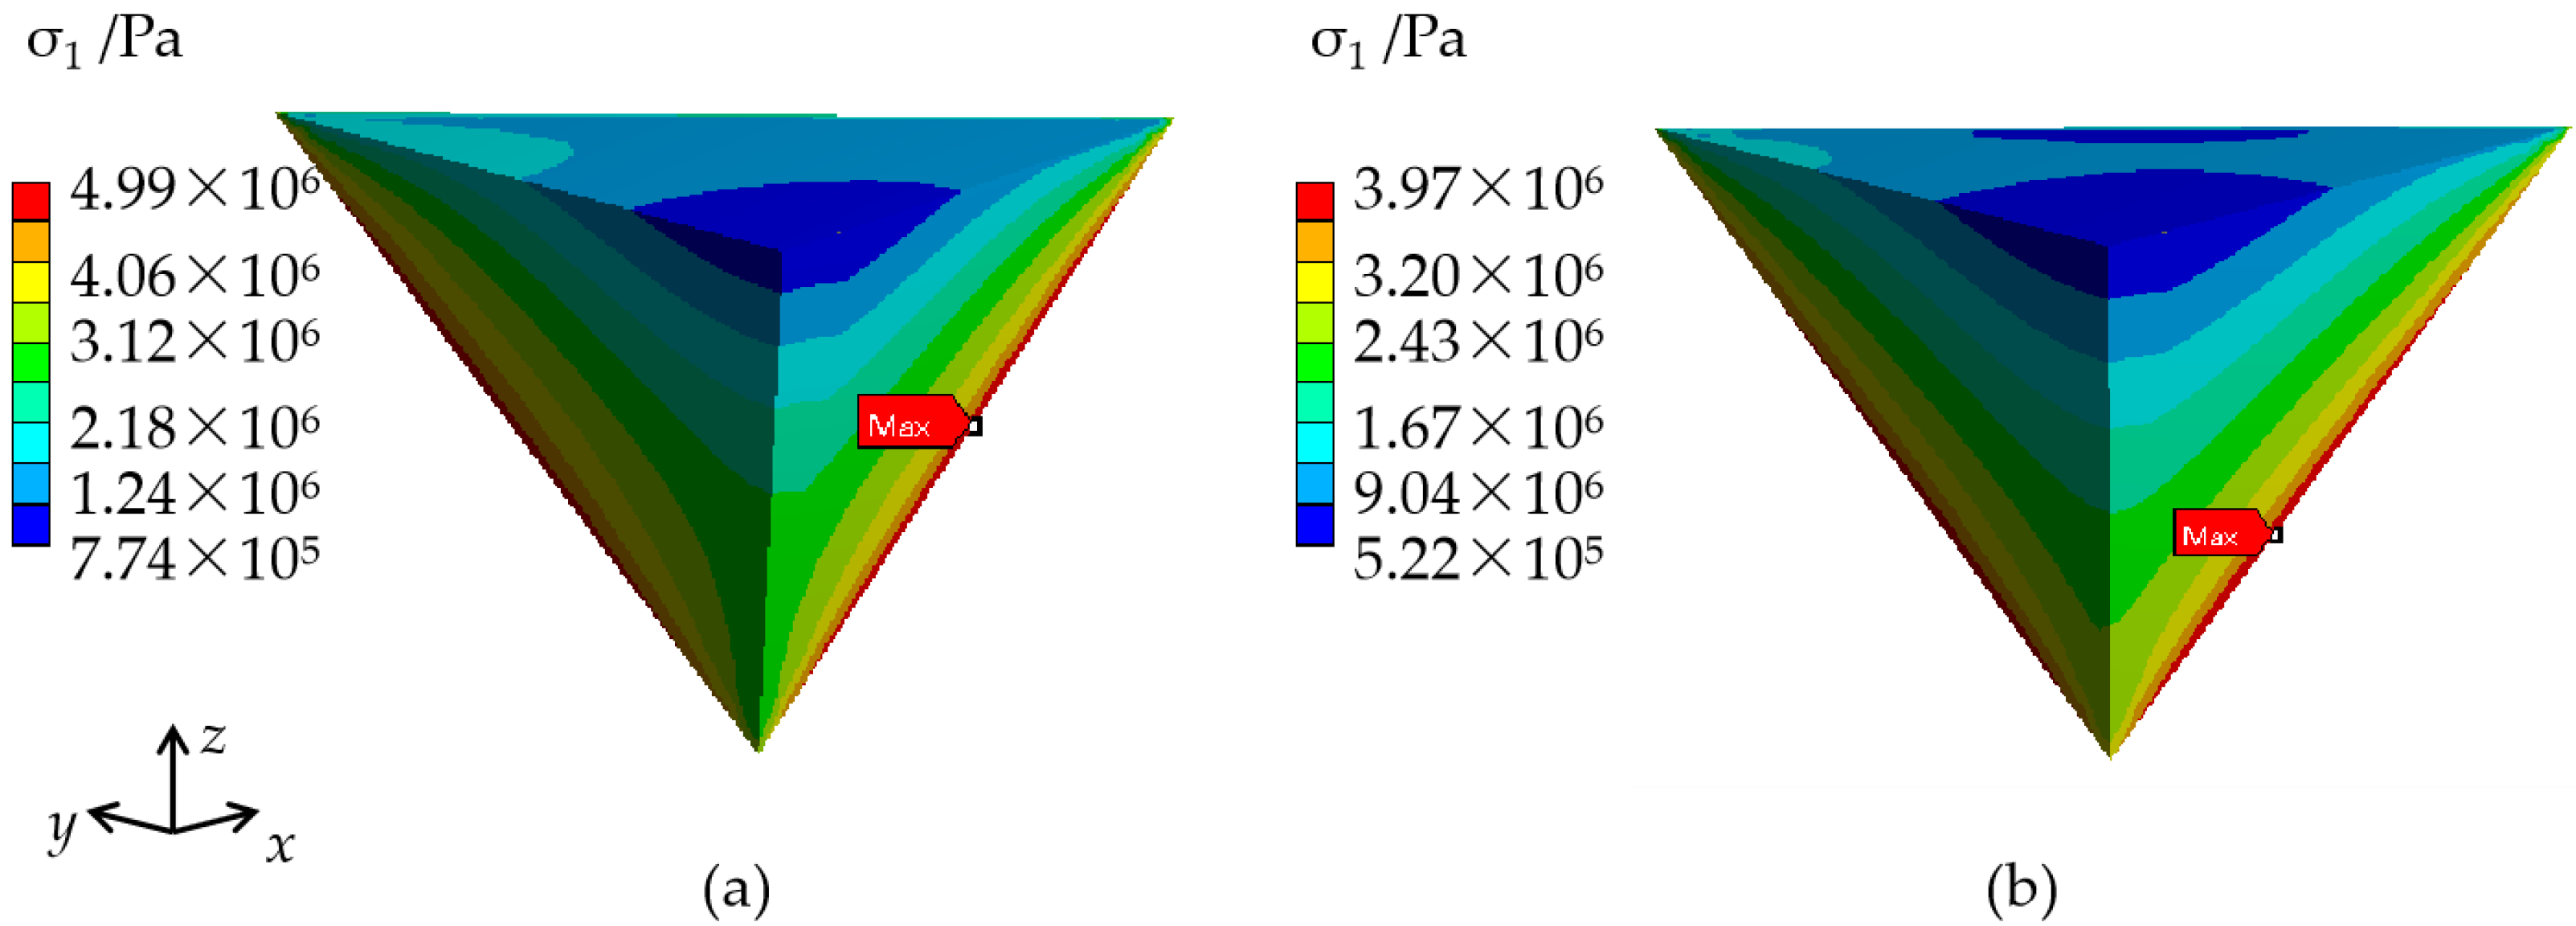
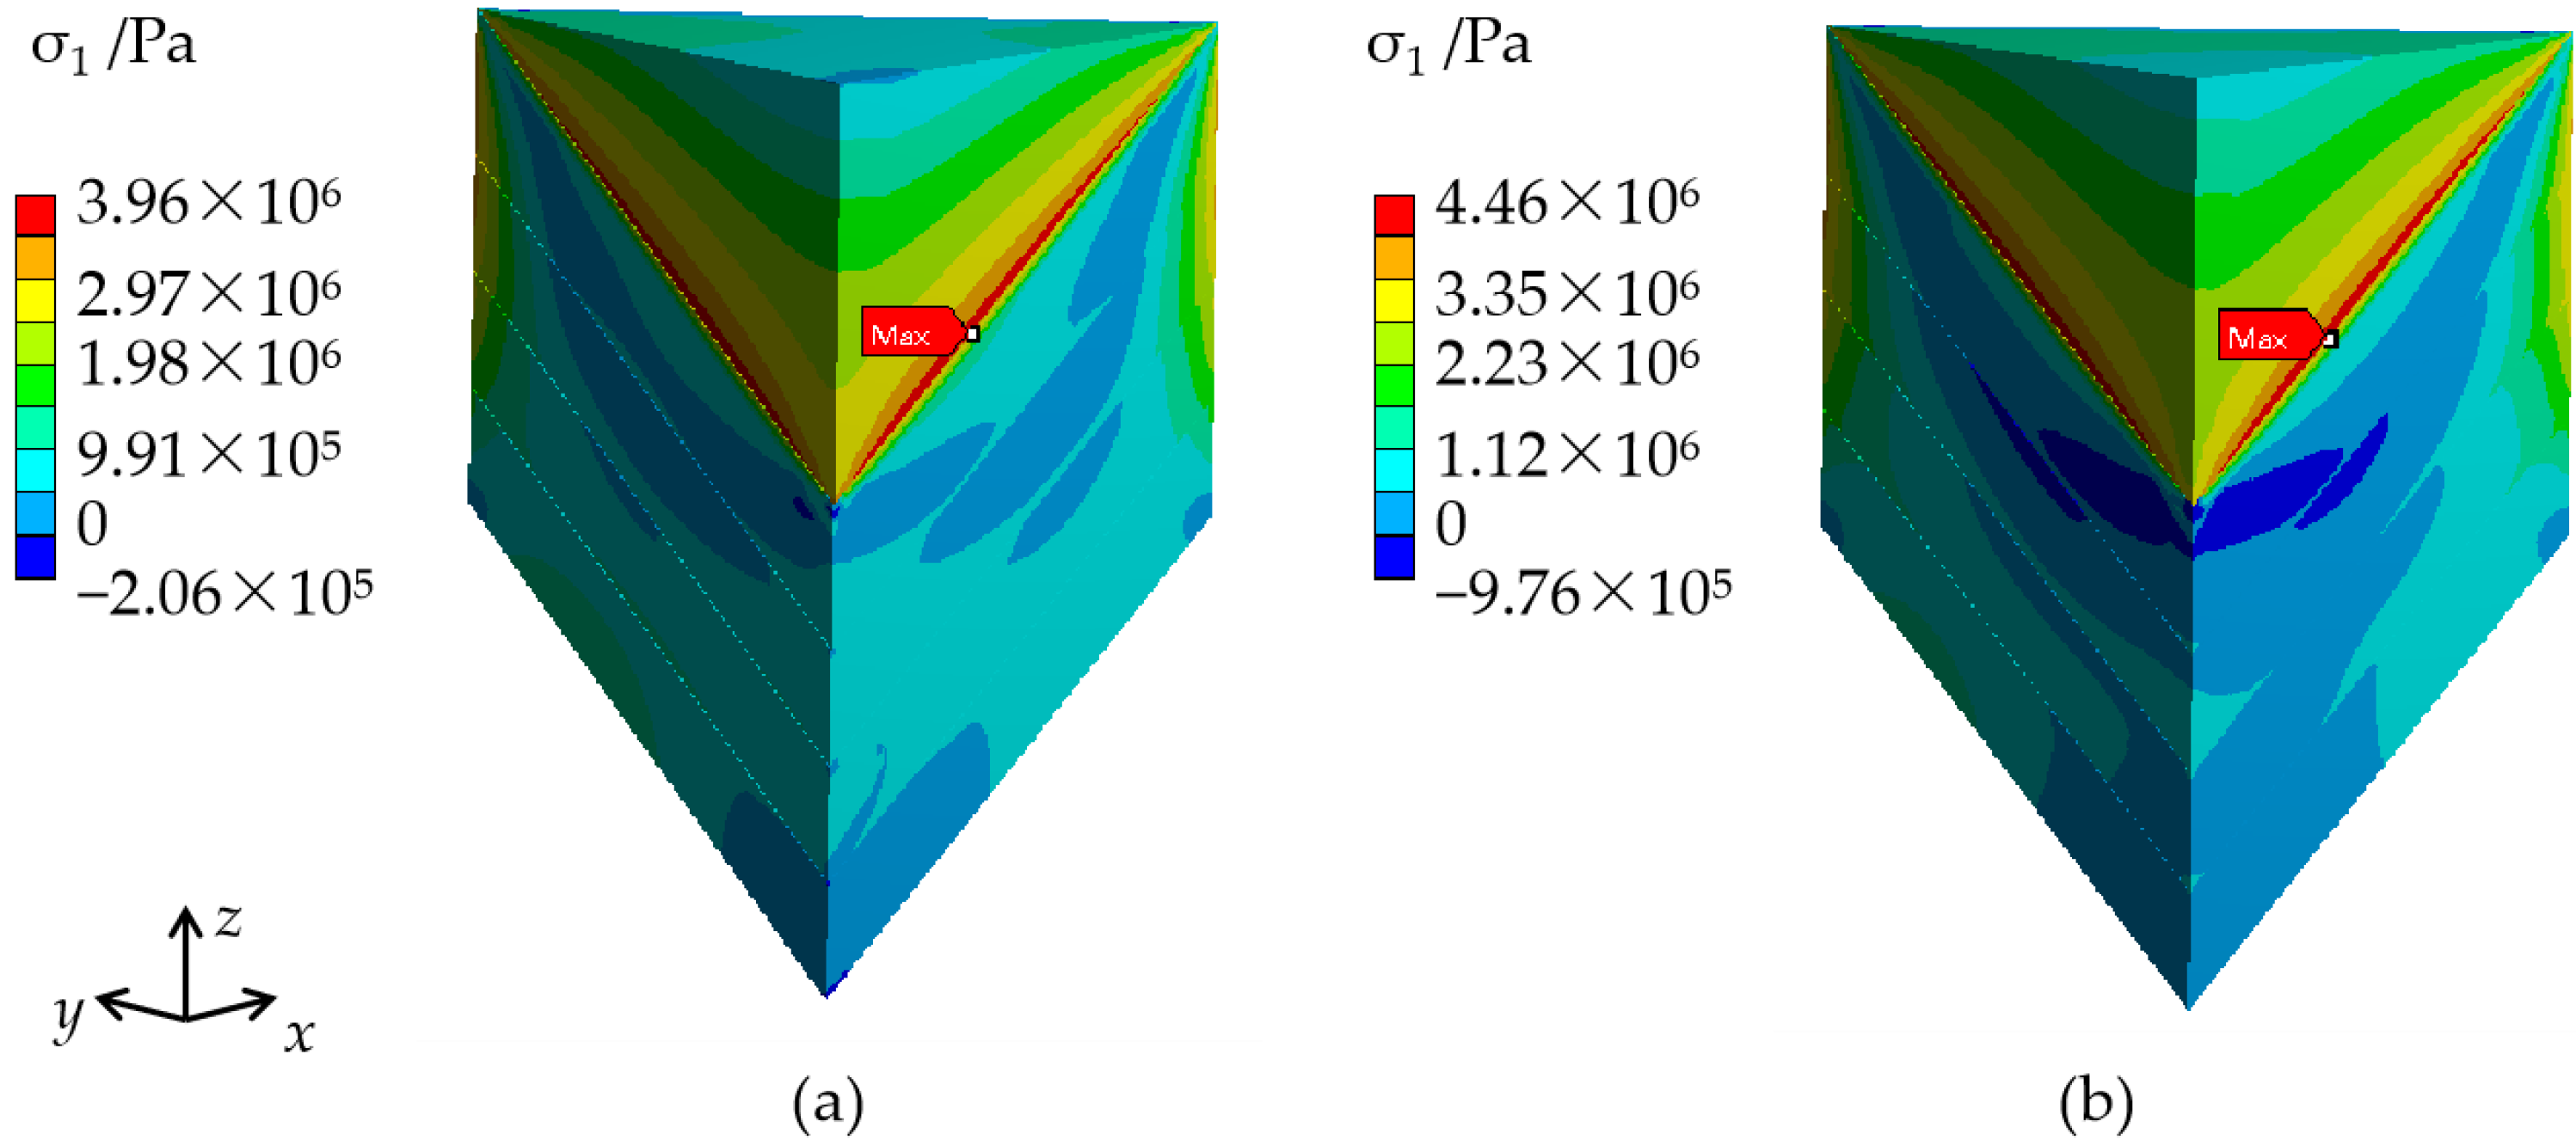
3.2. Stress in KDP Crystals without including the Cap Region
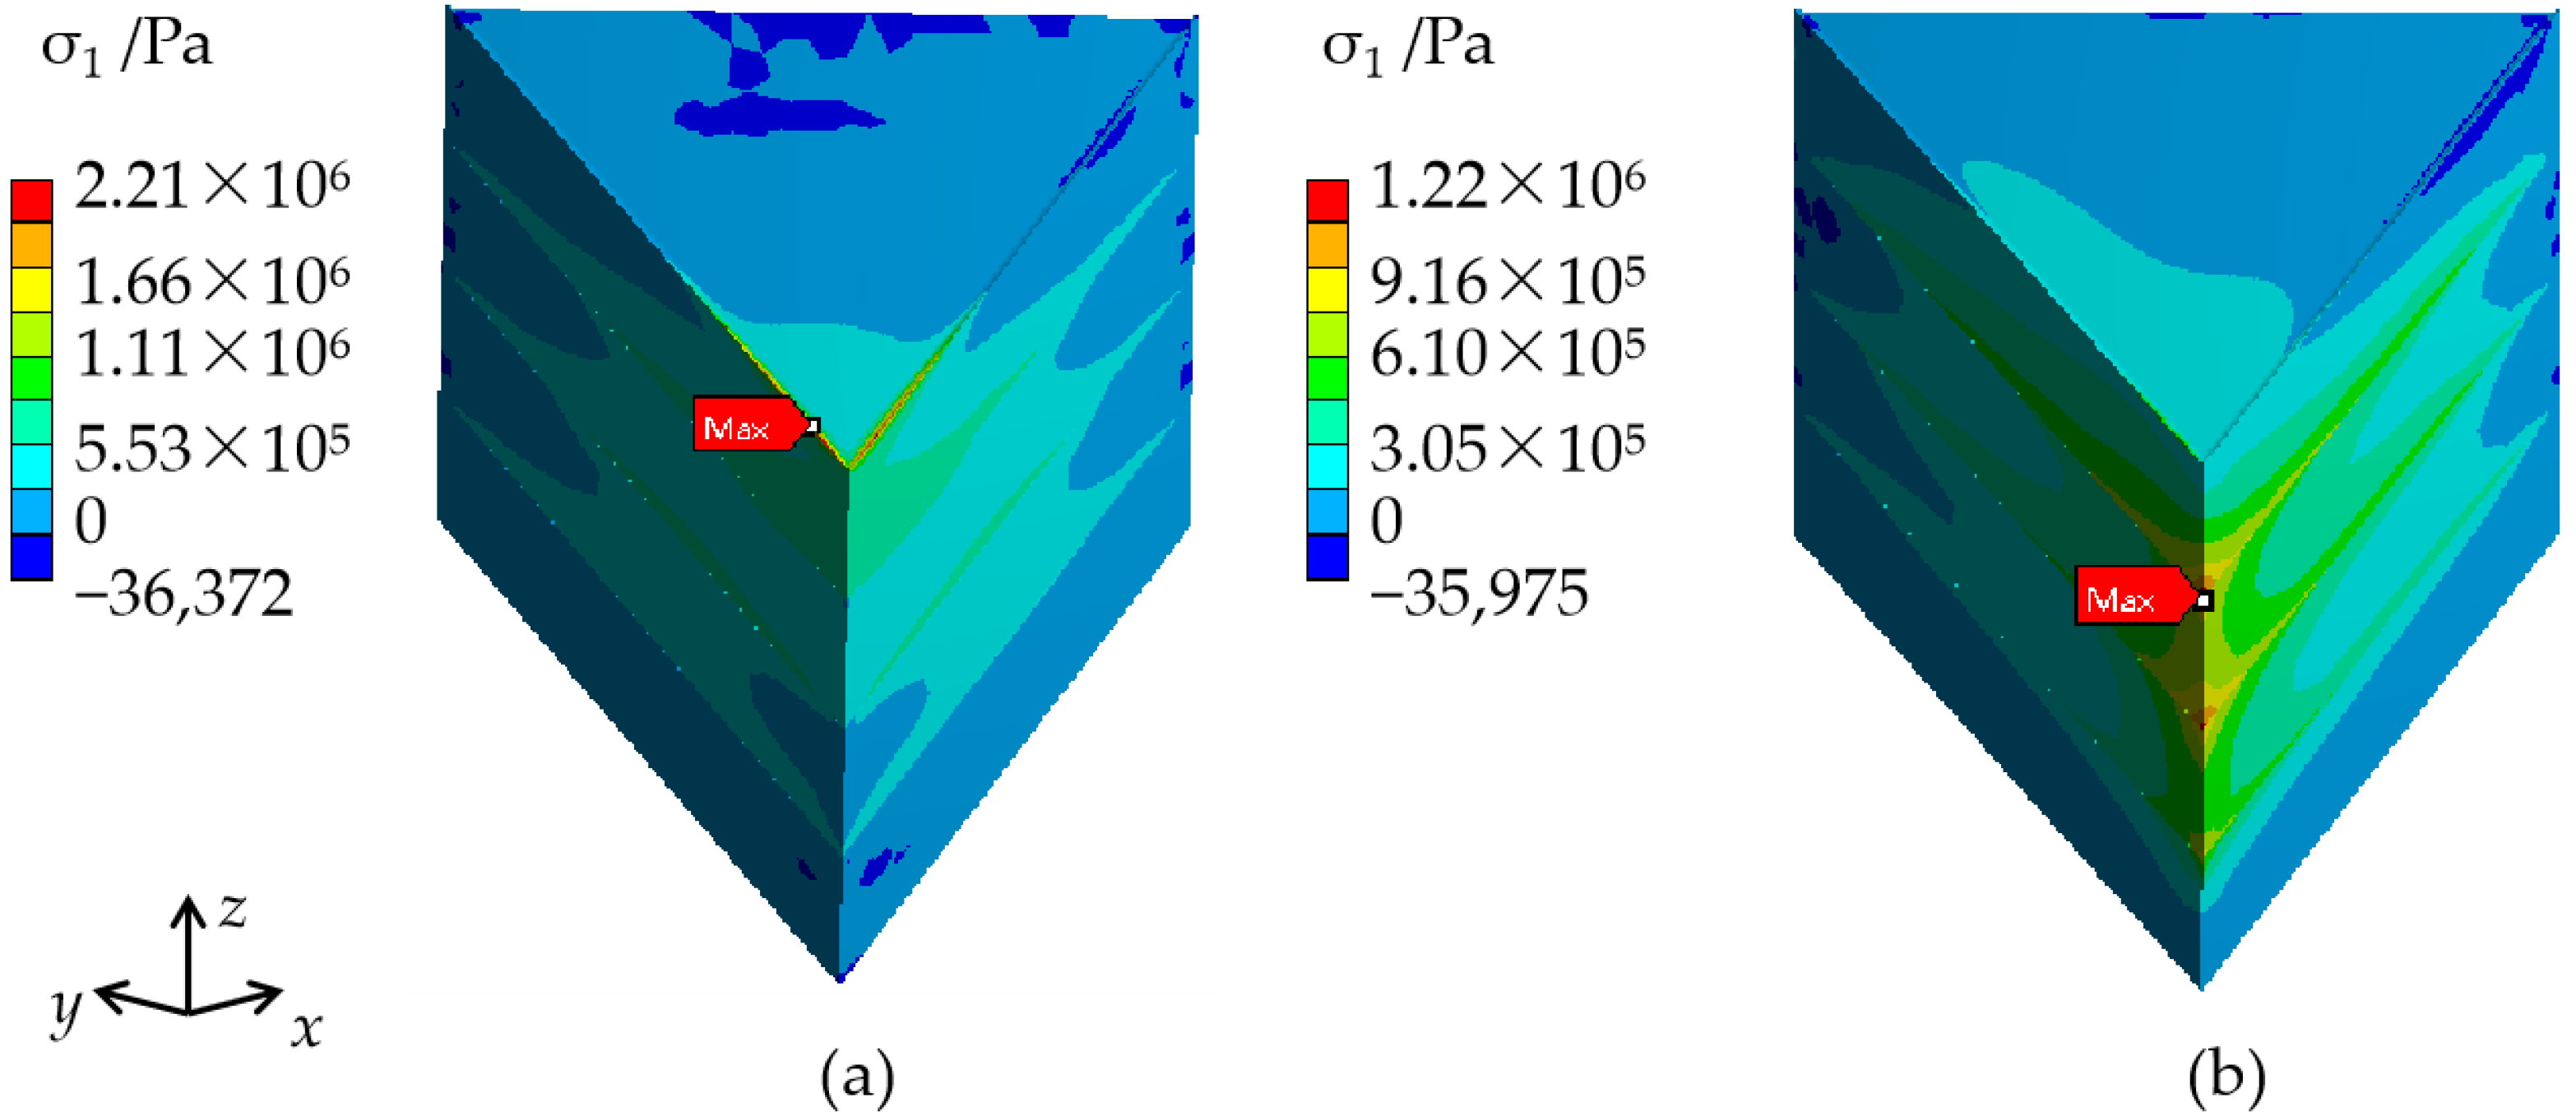
3.2.1. Effect of the Thermal Expansion Coefficient Variation Trend
3.2.2. Effect of the Decreased Thermal Expansion Coefficient Changing Range
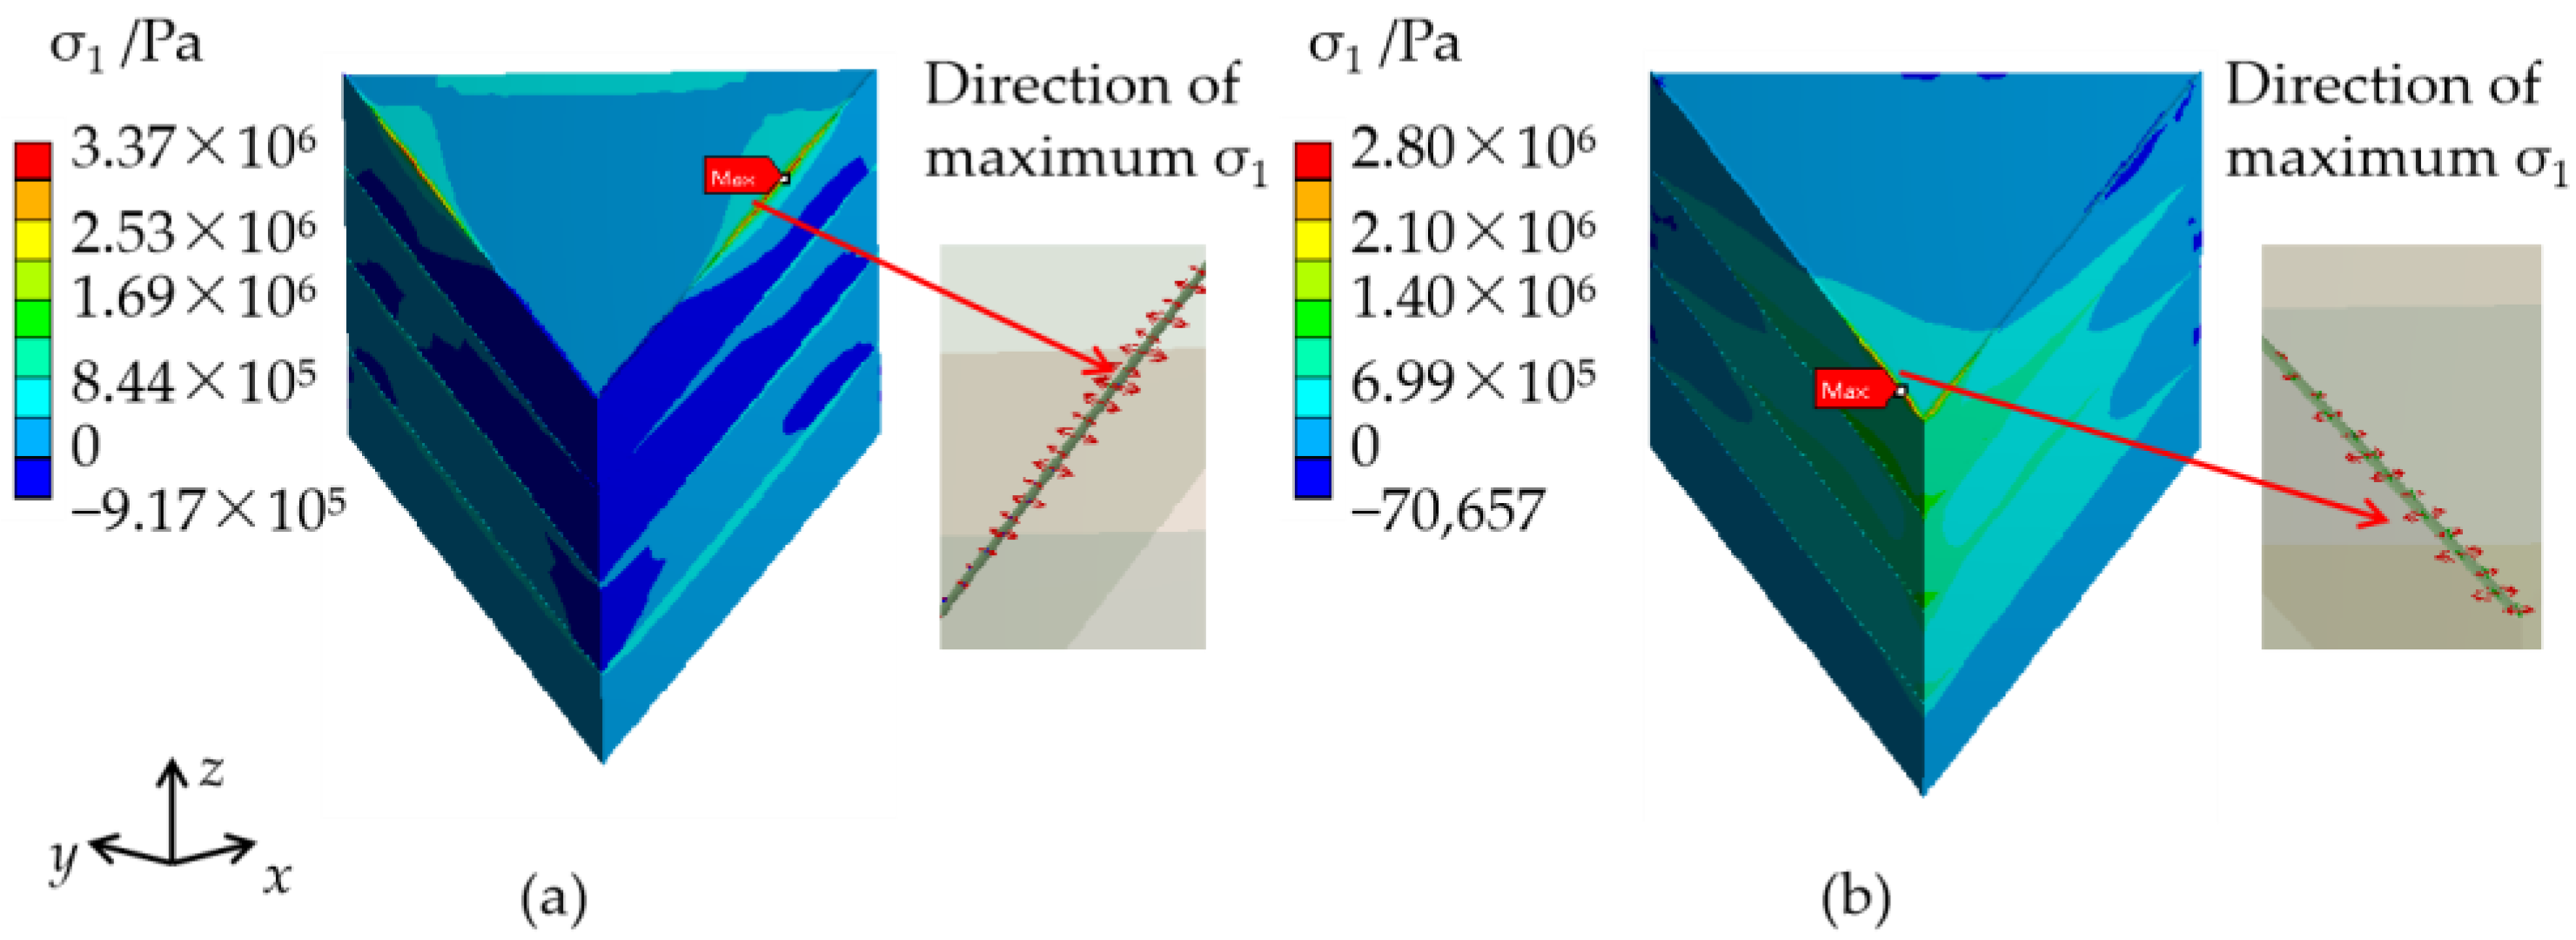
3.2.3. Effect of the Thermal Expansion Coefficient Variation along One Direction
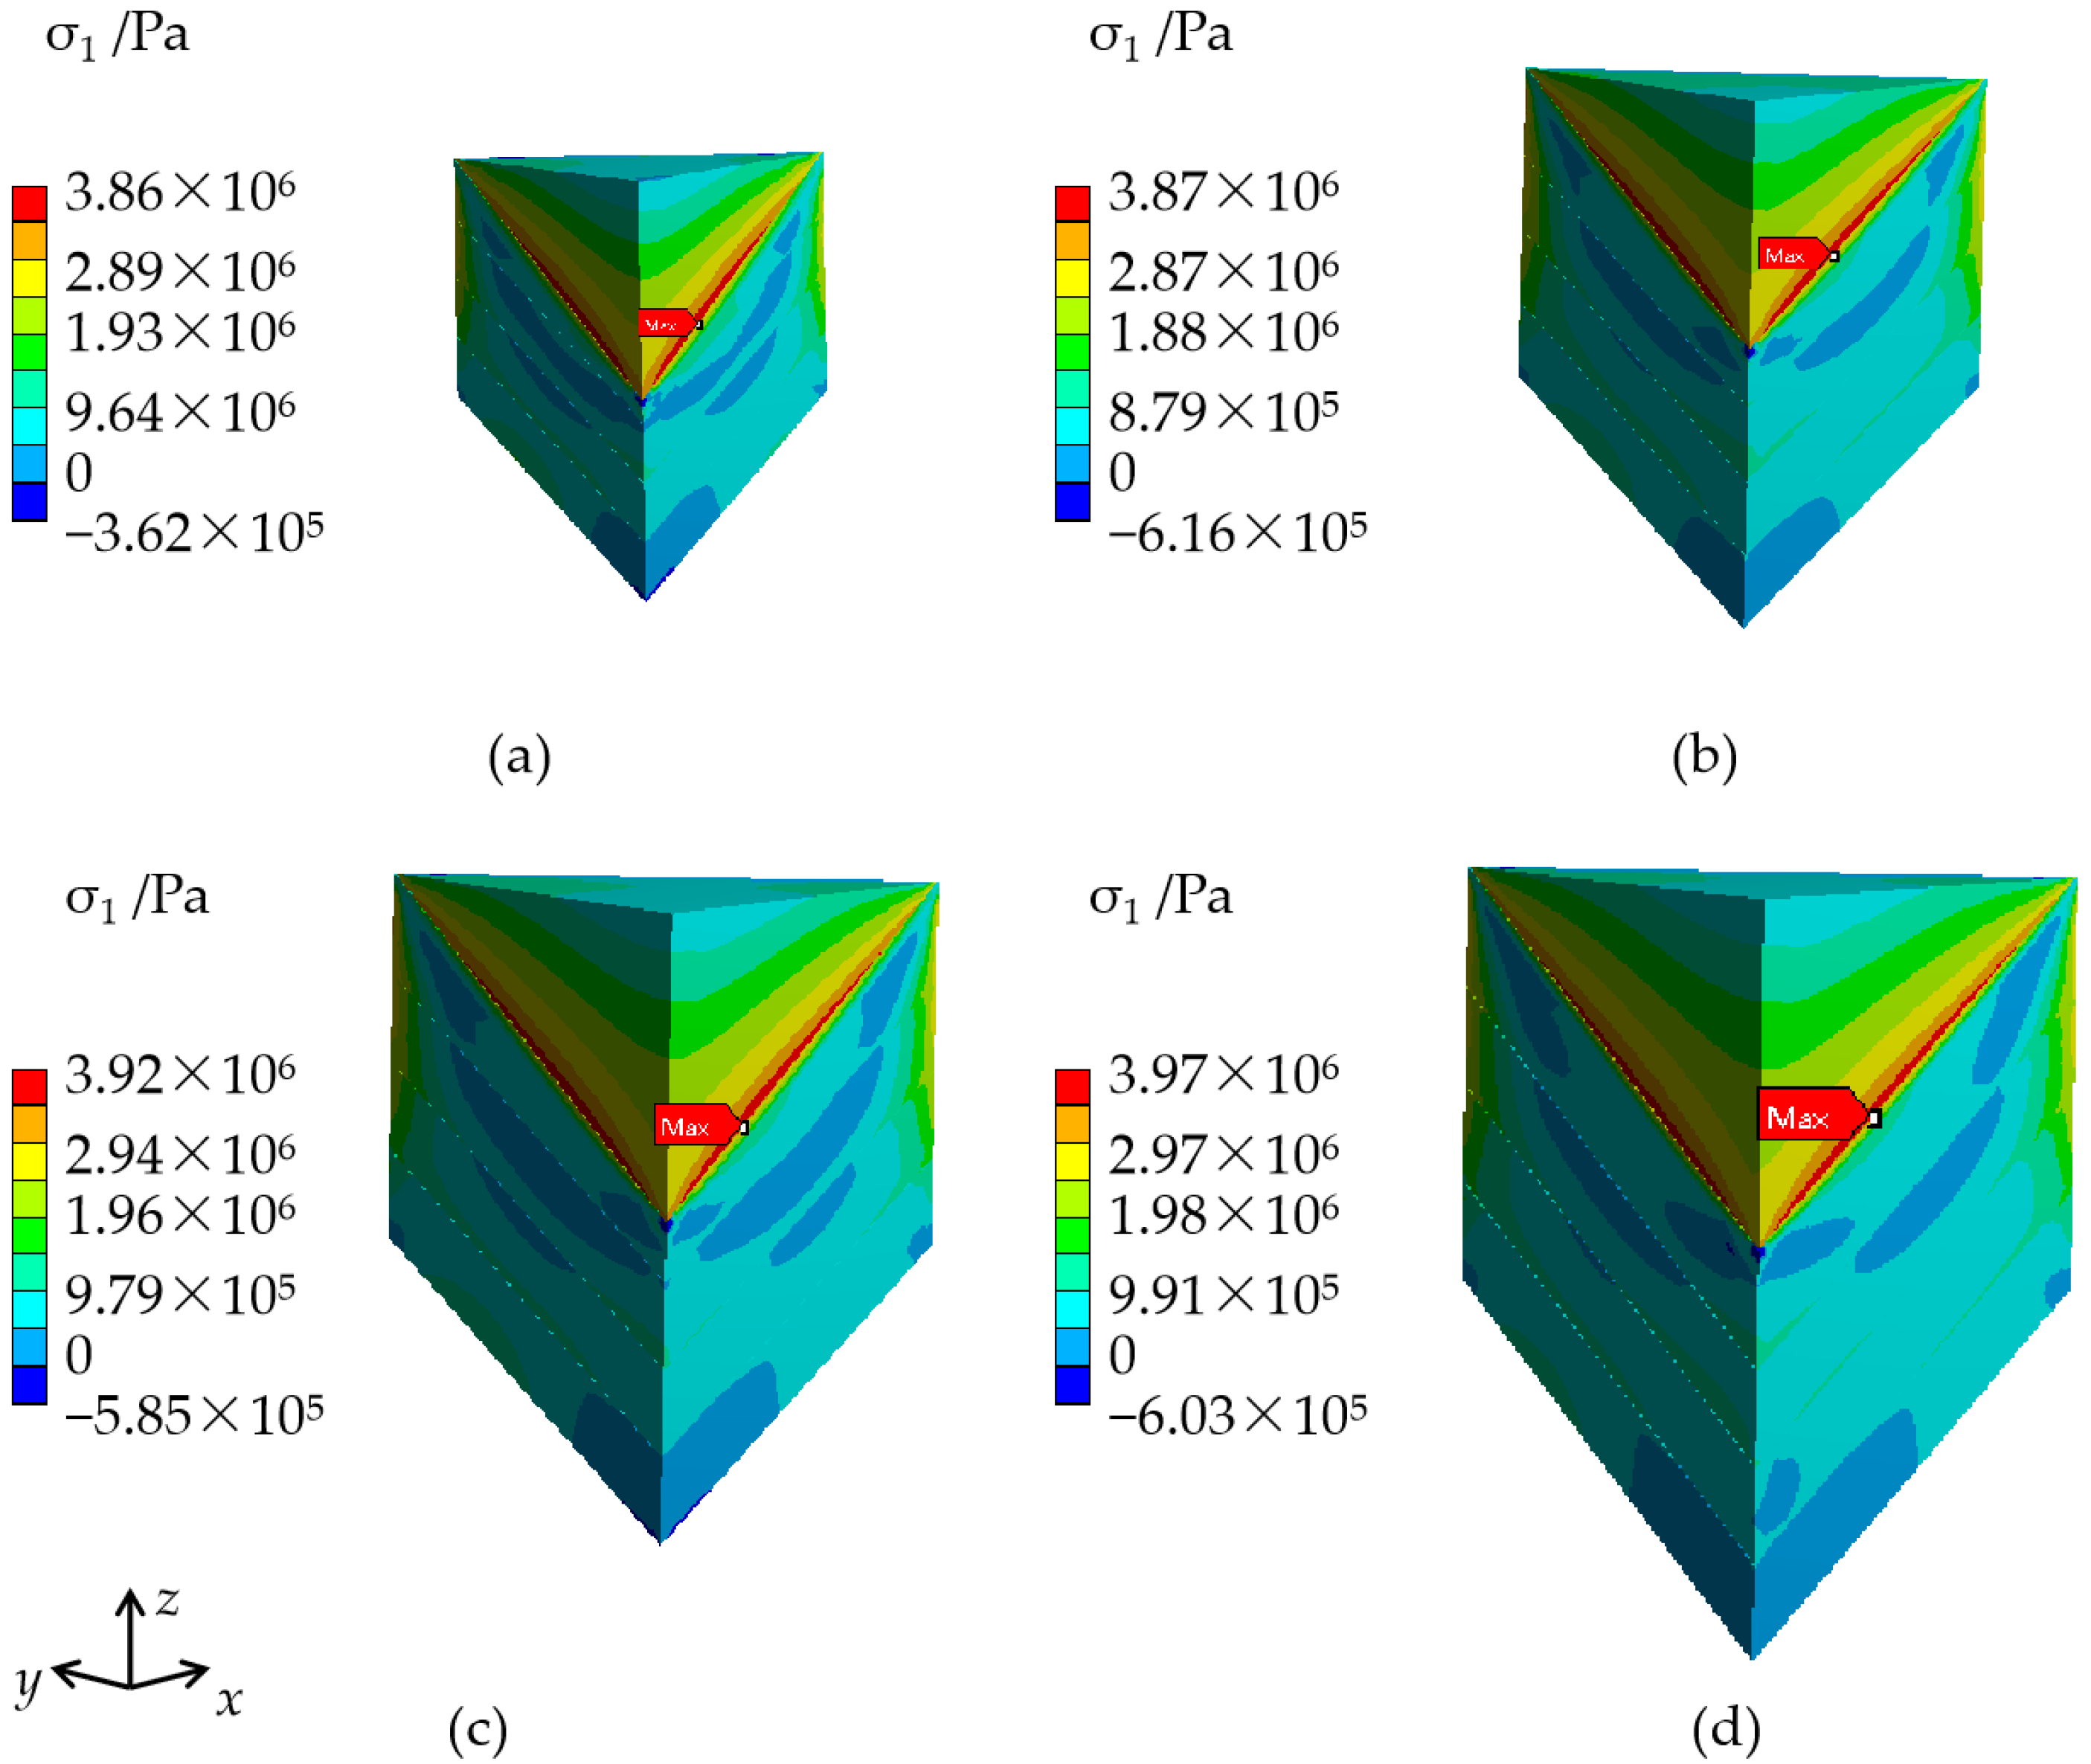
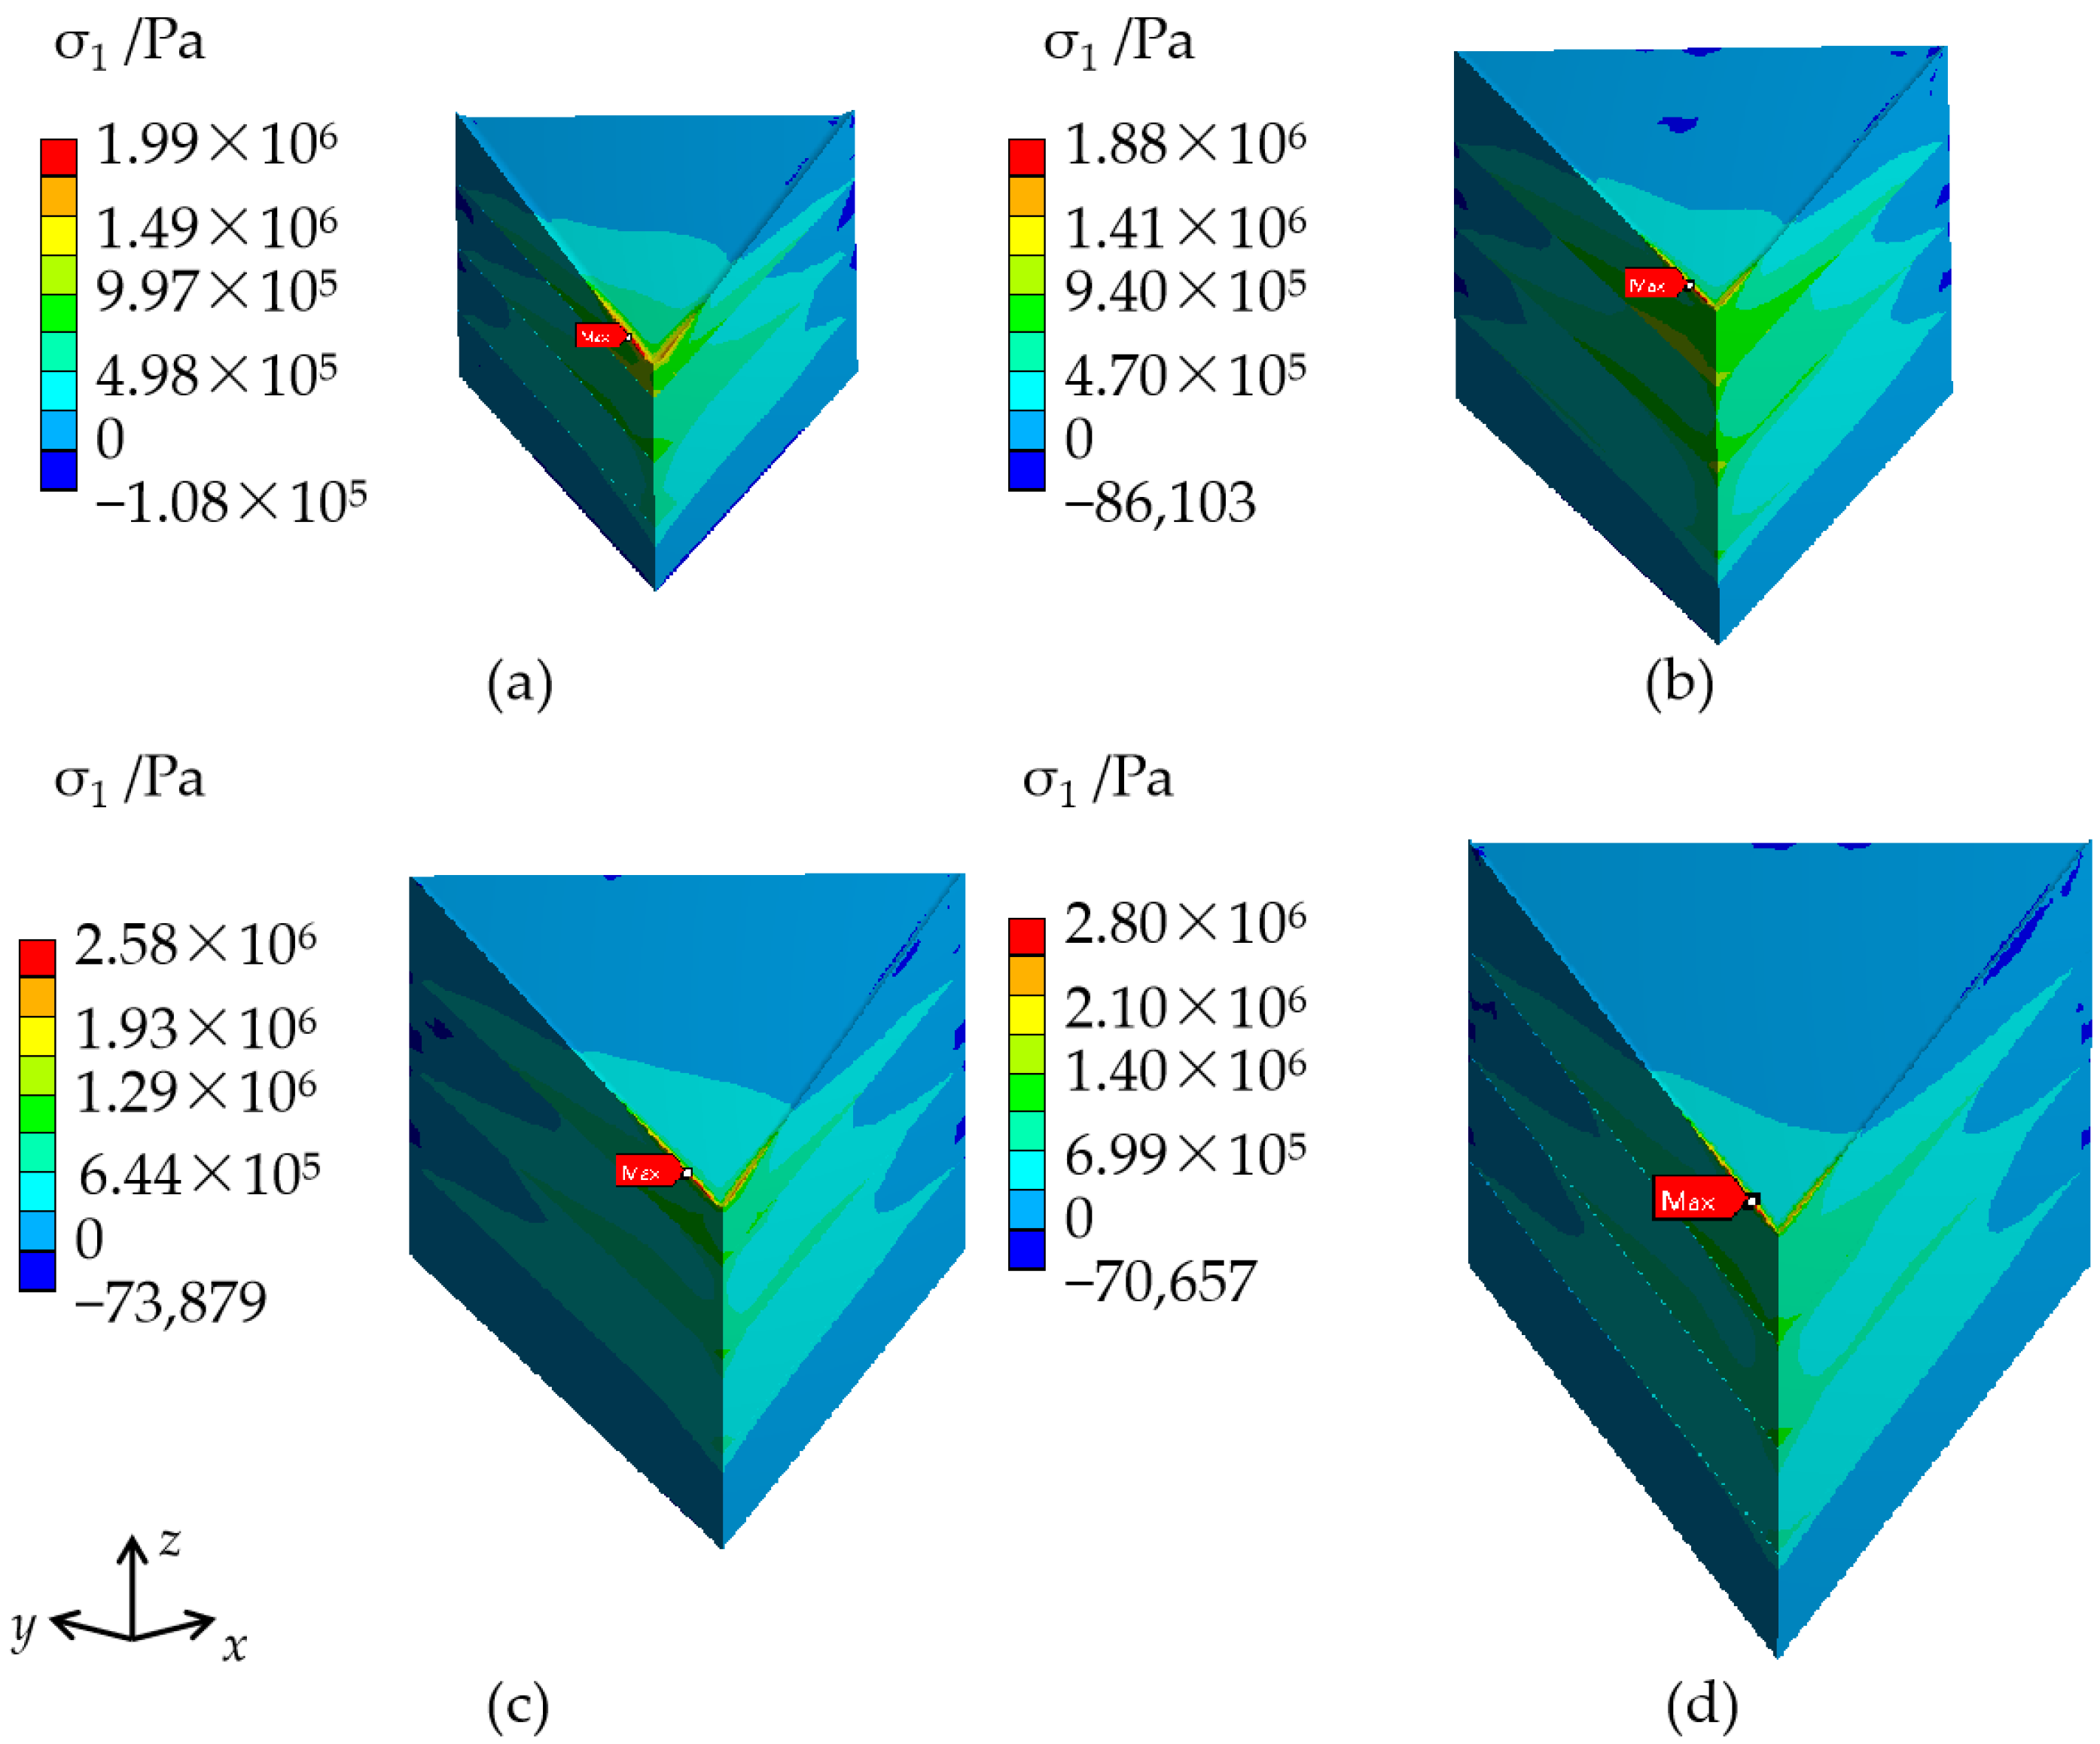
3.2.4. Effect of Crystal Size
4. Discussion
5. Conclusions
Author Contributions
Funding
Data Availability Statement
Conflicts of Interest
References
- Pang, Q.; Shu, Z.; Kuang, L.; Xu, Y. Effect of actual frequency features generated in machining process on the temperature and thermal stress of potassium dihydrogen phosphate crystal. Mater. Today Commun. 2021, 29, 102984. [Google Scholar] [CrossRef]
- Zaitseva, N.; Carman, L. Rapid growth of KDP-type crystals. Growth Charact. Mater. 2001, 43, 1–118. [Google Scholar] [CrossRef]
- Li, G. Rapid Z-plate seed regeneration of large size KDP crystal from solution. J. Cryst. Growth 2008, 310, 36–39. [Google Scholar] [CrossRef]
- Liu, L.; Wang, S.; Liu, G.; Wang, D.; Li, W.; Ding, J. Research on Thermal Expansion Coefficient of Large-aperture KDP/DKDP Crystals. J. Synth. Cryst. 2015, 44, 1443–1447. (In Chinese) [Google Scholar]
- Liu, L. Study on the Thermal Property and Uniformity of Large KDP/DKDP Crystals. M.D. Thesis, Shandong University, Shandong, China, 2015. [Google Scholar]
- Sun, Y.; Wang, S.; Jiang, T.; Gu, Q.; Wang, B.; Sun, S.; Xu, X.; Ding, J.; Liu, W. Effect of Na+ on the thermal expansion and hardness of KDP crystals. J. Funct. Mater. 2013, 44, 1768–1771. (In Chinese) [Google Scholar]
- Sun, Y. Study on the Mechanical Properties and Cracking Phenomenon of KDP Crystal. Ph.D. Thesis, Shandong University, Shandong, China, 2012. [Google Scholar]
- Guo, Z.; Yan, S.; Reiter, G. Formation of Stacked Three-Dimensional Polymer “Single Crystals”. Macromolecules 2021, 54, 4918–4925. [Google Scholar] [CrossRef]
- Yu, Y.-J.; Byeon, D.-S.; Shin, Y.-J.; Choi, S.-H.; Lee, M.-H.; Lee, W.-J.; Jeong, S.-M. Residual stress analysis of 4H-SiC crystals obtained by a top-seeded solution growth method. CrystEngComm 2017, 19, 6731–6735. [Google Scholar] [CrossRef]
- Liu, S.; Wang, Z.; Guo, J.; Shi, Z.; Ren, X.; Yang, Q. Thermal-mismatch-stress induced deformation zone on primary-carbide/austenite interface. Mater. Lett. 2019, 248, 55–59. [Google Scholar] [CrossRef]
- Huang, P.; Wang, S.; Wang, D.; Liu, H.; Liu, G.; Xu, L. Study on the cracking of a KDP seed crystal caused by temperature nonuniformity. CrystEngComm 2018, 20, 3171–3178. [Google Scholar] [CrossRef]
- Huang, P.; Wang, D.; Li, W.; Liu, H.; Liu, G.; Wang, S. Crack of KDP Crystals Caused by Temperature-nonuniformity. J. Chin. Ceram. Soc. 2018, 46, 929–937. (In Chinese) [Google Scholar]
- Huang, P.; Wang, S.; Ding, J.; Wang, D.; Wang, B.; Liu, H.; Xu, L.; Zhang, L.; Li, X.; Liu, Y. Study on the thermal stress evolution in large scale KDP crystals during the crystal extraction process. RSC Adv. 2019, 9, 20706–20714. [Google Scholar] [CrossRef] [PubMed]
- Su, R.; Liu, H.; Liang, Y.; Yu, F. Residual thermal stress of a mounted KDP crystal after cooling and its effects on second harmonic generation of a high-average-power laser. Opt. Laser Technol. 2017, 87, 43–50. [Google Scholar] [CrossRef]
- Zhang, N.; Zhang, Q.; Wang, S.; Sun, Y. Numerical Simulation Analysis of mechanical effect of large size KDP crystals during the extraction process. J. Funct. Mater. 2011, 42, 2133–2136. (In Chinese) [Google Scholar]
- Zhang, Q.; Zhang, N.; Wang, S.; Liu, D. Scale Effect Analysis of Growth Cracking in Large Size KDP Crystals. J. Funct. Mater. 2009, 40, 1584–1587, 1590. (In Chinese) [Google Scholar]
- Zhang, Q.; Liu, D.; Wang, S.; Zhang, N.; Mu, X.; Sun, Y. Mechanical Parameters Test and Analysis for KDP Crystals. J. Synth. Cryst. 2009, 38, 1313–1319. [Google Scholar]
- Miyazaki, N.; Koizumi, N. Analysis of cracking of lithium tantalate (LiTaO3) single crystals due to thermal stress. J. Mater. Sci. 2006, 41, 6313–6321. [Google Scholar] [CrossRef]
- Quinn, G.D. Weibull Strength Scaling for Standardized Rectangular Flexure Specimens. J. Am. Ceram. Soc. 2003, 86, 508–510. [Google Scholar] [CrossRef]
- Torres, Y.; Bermejo, R.; Gotor, F.J.; Chicardi, E.; Llanes, L. Analysis on the mechanical strength of WC-Co cemented carbides under uniaxial and biaxial bending. Mater. Des. 2014, 55, 851–856. [Google Scholar] [CrossRef]
- Farahani, F.; Gholamipour, R. Statistical weibull analysis of compressive fracture strength of (Zr55Cu30Al10Ni5)99Nb1 bulk metallic glass. J. Alloy. Compd. 2017, 695, 2740–2744. [Google Scholar] [CrossRef]
- Huang, P.; Liu, H.; Zhang, L.; Li, X.; Wang, S. Dependence of bending strength on orientations of KDP crystals. CrystEngComm 2022, 24, 1738–1743. [Google Scholar] [CrossRef]


| Material | Density (kg·m−3) | Heat Conductivity (W·m−1·K−1) | Thermal Expansion Coefficient (K−1) | Young’s Modulus (GPa) | Poisson’s Ratio |
|---|---|---|---|---|---|
| KDP crystal | 2338 | 1.34⊥c 1.21‖c | List in the next table according to different cases | Represented by Equation (2) | |
| Cap region | 2200 * | 1.09 * | 4.894e−5 * | 19.63 | 0.06 |
| 1 | 2 | 3 | 4 | Cap Region | The Maximum σ1 (MPa) | |
|---|---|---|---|---|---|---|
| Case1 | 23.1⊥c 39.2//c | 24.1⊥c 41.0//c | 25.1⊥c 42.8//c | 26.1⊥c 44.6//c | 48.94 (isotropy) | 5.71 |
| Case2 | 29.1⊥c 50.0//c | 28.1⊥c 48.2//c | 27.1⊥c 46.4//c | 26.1⊥c 44.6//c | 48.94 (isotropy) | 3.97 |
| 1 | 2 | 3 | 4 | Cap Region | Maximum σ1 of the Cap Region (MPa) | |
|---|---|---|---|---|---|---|
| Case 1 | 25.1⊥c 42.5//c | 25.5⊥c 43.2//c | 25.8⊥c 43.9//c | 26.1⊥c 44.6//c | 48.94 (isotropy) | 4.63 |
| Case 2 | 27.1⊥c 46.7//c | 26.7⊥c 46.0//c | 26.4⊥c 45.3//c | 26.1⊥c 44.6//c | 48.94 (isotropy) | 4.30 |
| 1 | 2 | 3 | 4 | |
|---|---|---|---|---|
| Case2-a (CTE change along the radial direction) | 29.1⊥c 44.6//c | 28.1⊥c 44.6//c | 27.1⊥c 44.6//c | 26.1⊥c 44.6//c |
| Case2-b (CTE change along the vertical direction) | 26.1⊥c 50.0//c | 26.1⊥c 48.2//c | 26.1⊥c 46.4//c | 26.1⊥c 44.6//c |
| Radial Dimension of KDP Crystals (cm) | The Height of the Cap Region (cm) | The Height of the Transparent Region (cm) | The Maximum σ1 (MPa) |
|---|---|---|---|
| 20 | 12 | 13 | 3.86 |
| 30 | 17 | 21 | 3.87 |
| 40 | 23 | 27 | 3.92 |
| 50 | 29 | 34 | 3.97 |
| The Maximum σ1 (MPa) | Position of the Maximum σ1 | Direction of the Maximum σ1 | |
|---|---|---|---|
| Case 1 | 3.37 | Edge of the interface of the cap region and the transparent region near the outside of the crystal | Vertical to the (010) plane |
| Case 2 | 2.80 | Edge of the interface of the cap region and the transparent region close to the apex of the cap region | Vertical to the (100) plane |
| Crystal Dimensions (cm) | Estimated Fracture Stress σW (MPa) | The Maximum Stress of Crystals, including the Cap Region(MPa) | The Maximum Stress of Crystals, without including the Cap Region (MPa) |
|---|---|---|---|
| 3.2 × 3.2 × 4.0 | 7.69 | -- | -- |
| 20 × 20 × 25 | 2.59 | 3.86 | 1.99 |
| 30 × 30 × 38 | 2.03 | 3.87 | 1.88 |
| 40 × 40 × 50 | 1.72 | 3.92 | 2.58 |
| 50 × 50 × 63 | 1.50 | 3.97 | 2.80 |
Publisher’s Note: MDPI stays neutral with regard to jurisdictional claims in published maps and institutional affiliations. |
© 2022 by the authors. Licensee MDPI, Basel, Switzerland. This article is an open access article distributed under the terms and conditions of the Creative Commons Attribution (CC BY) license (https://creativecommons.org/licenses/by/4.0/).
Share and Cite
Hu, Z.; Lan, M.; Huang, D.; Huang, P.; Wang, S. Stress Analysis of KDP Single Crystals Caused by Thermal Expansion Mismatch during Traditional Growth. Crystals 2022, 12, 1323. https://doi.org/10.3390/cryst12091323
Hu Z, Lan M, Huang D, Huang P, Wang S. Stress Analysis of KDP Single Crystals Caused by Thermal Expansion Mismatch during Traditional Growth. Crystals. 2022; 12(9):1323. https://doi.org/10.3390/cryst12091323
Chicago/Turabian StyleHu, Zhitao, Ming Lan, De Huang, Pingping Huang, and Shenglai Wang. 2022. "Stress Analysis of KDP Single Crystals Caused by Thermal Expansion Mismatch during Traditional Growth" Crystals 12, no. 9: 1323. https://doi.org/10.3390/cryst12091323