Article

Contrasting Effects of Laser Shock Peening on Austenite and Martensite Phase Distribution and Hardness of Nitinol

by
Rajesh Dora Tamiridi
1,2,
Rajendra Goud
1,
Prabhakaran Subramaniyan
3,
Kalainathan Sivaperuman
3,
Anand Kumar Subramaniyan
4,
Indrajit Charit
5,* and
Srikant Gollapudi
1,*
1
School of Minerals, Metallurgical and Materials Engineering, Indian Institute of Technology, Bhubaneswar 530 045, Odisha, India
2
GITAM School of Technology—GST, GITAM University, Visakhapatnam 530 045, Andhra Pradesh, India
3
Vellore Institute of Technology, Vellore 632 001, Tamil Nadu, India
4
Additive Manufacturing Research Laboratory, Department of Mechanical Engineering, Indian Institute of Technology Jammu, Nagrota 181 221, Jammu & Kashmir, India
5
Department of Nuclear Engineering and Industrial Management, University of Idaho, Idaho Falls, ID 83402, USA
*
Authors to whom correspondence should be addressed.
Crystals 2022, 12(9), 1319; https://doi.org/10.3390/cryst12091319
Submission received: 17 August 2022 / Revised: 13 September 2022 / Accepted: 13 September 2022 / Published: 18 September 2022
(This article belongs to the Special Issue Microstructure Characterization and Design of Alloys)

Abstract

:
Laser shock peening of cold rolled Nitinol was carried out at high power density (7 and 9 GW/cm2) and high overlap ratio (90%). Tensile surface residual stresses were generated in the peened material. An enhancement in surface microhardness from 351 for unpeened material to 375 and 394 VHN for the 7 and 9 GW/cm2 samples, respectively, was also observed. However, at a depth of 50 μm, the hardness of the peened material was lower than that of the as-received material. These contrasting observations were attributed to the change in the austenitic phase fraction brought about by laser interactions.

1. Introduction

Nitinol is a functional material well-known for its shape memory and superelastic behavior [1,2]. On account of these abilities, it has found applications as material for orthodontic braces, coronary artery stents, actuators and Chevrons at the exhaust of jet engines and actuators [3,4,5,6,7], where Chevrons are the saw tooth patterns seen on the trailing edges of some jet engine nozzles. In many of these applications, the fatigue behavior of Nitinol determines its service life [8,9,10]. Fatigue is the result of cyclic loading of a material and can cause the failure of material at applied stresses smaller than the yield strength of the material [11]. Introduction of compressive residual stresses in the surface or subsurface regions of the material has been found to be a successful way of enhancing the fatigue life of a material [11]. The compressive residual stresses can be introduced through surface engineering techniques such as shot peening [12] or laser shock peening [13,14].
In laser shock peening, the material to be peened is generally coated with a material which ablates upon exposure to the laser [15]. The ablation process creates plasma which intends to expand but is denied so by a confinement layer such as water or glass [15]. The confinement of the plasma causes the generation of shock waves which interact with the material on which the ablation layer is coated and introduces compressive residual stresses in the same [15].
Until date, there are few studies reporting the effect of laser shock peening on the microstructure and mechanical properties of Nitinol [16,17,18,19,20,21]. Table 1 provides a summary of the different laser peening studies on Nitinol. As is evident from the Table 1, except for the work of Liao et al. [17], the laser peening experiments on Nitinol are reported for low laser power densities, spot sizes greater than 1 mm [16,18,19,20,21] and low to medium overlap values. Hence there is a scope of investigating the laser peening behavior of Nitinol with smaller spot sizes and high overlap ratios. Considering the technological importance of Nitinol, these investigations are necessary to understand the window of parameters for achieving optimized properties. Hence the aim of this work is to conduct laser shock peening of Nitinol at laser power densities of 7 and 9 GW/cm2 with an overlap of 90%. Furthermore, we used black paint as the ablation layer and water as the confinement layer. The as-received Nitinol was in cold rolled condition and was partly austenitic and partly martensitic.

2. Experimental

Nitinol sheet (Ni 49.6 at.%–50.4 at.% Ti) bearing a nominal thickness of 2 mm was obtained from Johnson-Matthey, USA. Square samples (10 mm × 10 mm × 2 mm) were cut from this sheet using a low-speed diamond cutting saw for optical microscopy, X-ray diffraction (XRD) and micro-indentation studies. The as-received samples were polished to mirror finish with 1 μm diamond paste and then etched with a solution of 10 mL HF, 25 mL HNO3 and 150 mL of water using a cotton swab for a duration of 15 s approximately. The etched samples were subsequently studied with a Leica optical microscope. Differential scanning calorimetry studies were conducted on a Netzsch DSC 204 F1 Phoenix machine on 30 mg mass samples at 10 K/min scan rates (heating and cooling) in flowing nitrogen.
The laser shock peening process was carried out using a Q-Switch Nd:YAG solid state laser source (λ = 1064 nm, pulse duration = 10 ns and spot diameter = 0.8 mm) using two different laser powers 7 and 9 GW/cm2. The laser peening experiments were conducted at 298 K, i.e., ambient temperature. Prior to LSP, the surface of the 10 mm × 10 mm × 2 mm samples was polished with a 1500 grit sandpaper to ensure flatness and to remove any oxides present on the surface. Water and black paint were used as the confinement layer and ablation layer, respectively, and a zig-zag pattern was used for the peening process. A Rigaku X-ray Diffractometer with Cu Kα (λ = 1.54 Å) radiation, with beam spot size of 2 mm by 2 mm, was employed for phase identification and residual stress measurement of the as-received and shock peened samples. The residual stresses were measured using the sin 2 ψ technique. The samples were tilted to obtain the lattice strains for a certain {hkl} plane using the following equation [22]:
ε ϕ ψ { h k l } = d ϕ ψ d o d o = 1 2 S 2 { h k l } σ ϕ sin 2 ψ + S 1 { h k l } ( σ 11 + σ 22 )
where d o is the stress-free lattice spacing, S 1 { h k l } and S 2 { h k l } the X-ray elastic constants (XECs) of the material, and σ ϕ is the stress component along the S ϕ direction, which is expressed as:
σ ϕ = σ 11 cos 2 ϕ + σ 22 sin 2 ϕ
The (110) plane of austenite and its elastic modulus value of 75 GPa was chosen for the calculation of the residual stress. The residual stress measurements were on both the surface as well as at a depth of 50 μm from the surface. Similarly, the microhardness measurements were conducted on both the surface and at a depth of 50 μm using the Zwick Roell machine with an applied load of 100 gf and a dwell time of 10 s. The obtained microhardness was reported as an average of 10 measurements as VHN, i.e., Vickers Hardness Number. The samples at 50 μm depth were prepared by removing material from the surface of the material. Towards this end, initially, the samples were sequentially polished with 800, 1200 and 2000 grit sandpaper. Following that, the samples were electropolished. The electrolyte chosen for electropolishing was 90% by volume methanol and 10% by volume perchloric acid. Electropolishing was carried out at subzero temperatures (T~–10 °C) using a dry ice bath. A voltage of 17–20 volts was used, and electropolishing was carried out for 15 to 20 s. Using the above process, the material was removed, and the microhardness and residual stress tests could be conducted on the material at a depth of 50 μm depth.
Transmission electron microscopy (TEM) studies were undertaken on selected samples to understand the changes in microstructure brought about the laser peening samples. Towards this end, the as-received, 7 GW/cm2 and 9 GW/cm2 samples were studied. The TEM sample was extracted from the peened sample at a depth of 50 μm from the surface. The samples for TEM analysis were prepared on a UHR Dual Beam Focused Ion Beam system Helios Nanolab 600i from FEI, and the TEM studies were conducted using the Titan Themis from FEI at an acceleration voltage of 300 kV. Both bright field image and selected area diffraction pattern were captured from the sample.

3. Results and Discussion

Figure 1 provides the optical micrograph of the as-received material. The mean linear intercept method yielded a grain size of 38 ± 5 μm for the polycrystalline microstructure. Figure 1 also reveals a twinned microstructure indicative of the presence of martensite. Figure 2 provides the cooling and heating DSC scans of Nitinol. The multiple peaks appearing during forward transformation (B19′–B2) and reverse transformation (B2–B19′) shown in DSC curves of as-received Ni-Ti alloy have been identified. During cooling, the austenite (A) transforms into a variant of the R-phase called R1 which further transforms into another variant of the R-phase called R2, and this R2 transforms into the martensite (M) phase. During heating, the martensite phase converts into the R-phase which transforms into the austenite phase. This multistage transformation of austenite into martensite has been discussed in detail by Liu et al. [23], and our observations here are similar to those of Liu et al. The formation of the R-phase as an intermediate phase during A to M or M to A transformation is commonly observed in cold-worked Nitinol [24]. Hence, based on the DSC results, it can be concluded that the Nitinol material under study is a cold-worked material. This is supported by the optical micrograph (Figure 1) where self- accommodating martensite formed due to cold rolling is observed as twins within the austenite grains [25]. The presence of cold work in this material is also revealed through the X-ray diffraction patterns of the as-received material.
Figure 3a provides the X-ray diffraction patterns taken from the surface of the as-received material and 7 and 9 GW/cm2 peened material. The XRD peak of the as-received Nitinol was indexed, and the presence of two phases was revealed: (a) austenite and (b) martensite with austenite as the dominant phase. Furthermore, the XRD peak in the as-received material was quite broad. Generally, broad X-ray peaks are attributed to (a) amorphous materials, (b) nanocrystalline materials with grain size smaller than 100 nm and (c) materials subjected to high amount of cold work. In the case of the Nitinol under study, we believe the broad peaks seen in Figure 3a are due to the cold worked nature of the Nitinol. This was also the cause of the observation of martensite in the XRD peak of the as-received Nitinol. The effect of cold work was substantiated through our TEM results discussed at a later stage.
In contrast to the as-received material, the surface XRD patterns of shock peened material had sharper austenitic peaks. This indicates that the peening process had caused conversion of some of the martensite into austenite phase and also relieved some of the lattice strain present in the as-received material.
The XRD patterns taken at a depth of 50 μm as shown in Figure 3b show that the martensite peaks were more prominent compared to their corresponding surface XRD patterns. Figure 4 plots the ratio of the peak intensity of austenite to martensite (IA(110)/IM(111)) for all three samples using XRD data captured from surface and 50 μm depth to illustrate the effect of laser shock peening. At the surface, the value of this ratio iwas higher for the 9 GW/cm2 sample when compared to that of the 7 GW/cm2 sample and as-received material. This implies that martensite was indeed converting into austenite during the peening process and the effect was more prominent at higher laser power densities. At a depth of 50 μm, the (IA(110)/IM(111)) for 7 and 9 GW/cm2 was considerably lower when compared to that of their surface counterparts, which implies that the martensite fraction was higher for these samples at 50 μm depth. It was observed that the change in (IA(110)/IM(111)) with depth was more drastic for the peened material, whereas the as-received material was experiencing only a small reduction in this value. This implies that the laser interaction was influencing the austenite and martensite phase distribution considerably, and this had an effect on the mechanical properties of the material.
Figure 5a provides a plot of the surface hardness of the as-received, 7 and 9 GW/cm2 samples. As the Figure suggests, the microhardness of the as-received material was 351 ± 7 VHN, whereas the microhardness values of the 7 and 9 GW/cm2 peened samples were 375 ± 5 and 394 ± 5 VHN, respectively. This implies that the shock peening process had caused an increase in the surface hardness of the material, with the higher power density laser causing a greater increase in hardness.
At a depth of 50 μm, the microhardness of the as-received material was more or less similar to that of its surface counterpart, but the microhardness of the 7 and 9 GW/cm2 samples was lower when compared to that of their corresponding surface counterparts. Figure 5b provides a plot of the surface residual stress values of the as-received, 7 and 9 GW/cm2 samples. As the plot suggests, the as-received material had a compressive residual stress state (σxx = −419 MPa) in the surface region which converted into a tensile stress state following peening with σxx = 312 MPa and σxx = 449 MPa for 7 and 9 GW/cm2 samples, respectively. At a depth of 50 μm, the as-received material demonstrated a tensile residual stress state with σxx = 153 MPa, whereas the 7 and 9 GW/cm2 samples provided residual stress values of 37 MPa and 288 Mpa, respectively.
The observed variation in microhardness and residual stress values with depth can be attributed to the effects of laser peening, and to understand this in greater detail, we invoke the work of Karthik et al. [26]. Karthik et al. [26] proposed the development of three laser effected regions following shock peening. The first region called the thermally affected region is mainly the surface region of the material. The second and third region are called the severe plastically deformed and minor plastically deformed region, respectively. Karthik et al. [26] from their investigations on AISI 321 steel found that the material develops a tensile residual stress state within the thermally affected region which converts into a compressive residual stress state in the second region. Furthermore, the hardness of the peened material within the thermally affected region is lower than the hardness of the bulk material and also lower than the hardness of the material within the severe plastically deformed region. Karthik et al. [26] suggested that the thermally affected region exists over the first 20 μm from the surface, whereas the severe plastically deformed region extends over depths ranging from 20 to 100 μm from the surface.
Unlike Karthik et al. [26], we observed higher microhardness of the peened material vis-à-vis the unpeened material in the thermally affected region. Furthermore, the microhardness of the material at a depth of 50 μm, i.e., the plastically deformed region was lower than that of the bulk material. This contrasting behavior can be understood by analyzing Figure 4. As Figure 4 suggests, the austenite phase fraction in the surface region was higher in the 7 and 9 GW/cm2 samples. This can be attributed to the thermal effect. Austenite, martensite and the R-phase are the three well-known phases of Nitinol, wherein austenite is the high-temperature phase, the R-phase is the intermediate phase and martensite is the low-temperature phase. It is also known that between austenite and martensite, the former is the stiffer and harder phase [27,28]. We conducted some low-temperature microhardness measurements to determine the hardness of the martensite phase. Initially, the as-received Nitinol was immersed in a liquid nitrogen bath for 5 min and following that, the sample was taken out, and its microhardness was measured within a span of 40 s. The temperature of the sample during indentation was found to be in the range of −50 °C. The hardness of the Nitinol measured immediately after the low temperature experiments was found to be 230 ± 20 VHN. This hardness was lower than the hardness of the as-received material which was predominantly austenite. As the DSC data in Figure 1 shows, the sample would be in a martensitic state at temperatures around −50 °C and lower. Hence, it can be reasonably assumed that the indentation data corresponded to the martensitic phase of Nitinol. This experiment establishes that the martensitic phase of Nitinol was less hard compared to the austenitic phase of Nitinol. Interestingly, the indentation impression size was found to reduce in size with time. The reduction in indentation impression size was due to the formation of austenite at room temperatures. The hardness measured was found to be similar to the hardness of the Nitinol in its as-received state. The change in indentation impression size in Nitinol due to heating is a known phenomenon. Ni et al. [29] conducted microhardness measurements in martensitic Nitinol and found the size of the indentation impression to reduce with heating. This was attributed to the self-healing behavior of Nitinol brought about by martensite to austenite phase transformation. Our indentation results and subsequent observations are in accordance with the observation of Ni et al. [29], and this establishes the higher hardness of austenite vis-à-vis the martensite phase. Hence, the higher surface hardness of the peened samples vis-à-vis the as-received material can be attributed to the lower phase fraction of the softer martensite following peening. Since laser interactions would locally lead to very high temperatures, it is possible that the thermal effect was causing the martensite in the as-received material to convert into austenite, leading to increased austenite phase fraction in the surface region. On account of the increased austenite phase fraction, the shock peened samples had higher surface hardness when compared to that of the as-received material. Additionally, the temperature generated would be higher at higher laser power density and hence the amount of austenite formed in the surface region was higher in the 9 GW/cm2 samples compared to that in the 7 GW/cm2 samples with corresponding higher surface microhardness.
At a depth of 50 μm, the microhardness of the peened material was lower when compared to their respective surface microhardness values. This again is contrary to the observations of Karthik et al. who found relatively higher hardness in the severe plastic deformation region, i.e., region 2. The lowered hardness of the peened Nitinol in region 2 can be correlated to the lowered values of IA(110)/IM(111) at a depth of 50 μm depth. Since the amount of austenite was reduced at 50 μm depth, it was causing a corresponding reduction in the microhardness in the peened material. The important thing to understand then is why the hardness of the peened material was lower than that of the as-received material even though their IA(110)/IM(111)) values were almost similar at 50 μm depth. A possible reason is that the laser heating might be causing some relief of lattice strain present in the as-received material. It is quite possible that at 50 μm depth, the heat generated by the laser may not be sufficient to cause conversion of martensite into austenite but might be just about sufficient to annihilate defects such as dislocations leading to some softening.
In the case of the residual stresses, the tensile residual stresses developed in the peened Nitinol is in line with the observations of Karthik et al. [26] and can be attributed to the thermal effect. The laser-peened surface region due to its faster cooling tendency vis-à-vis sub-surface and core region could develop a tensile residual stress. As shown in Figure 5b, the magnitude of the surface tensile residual stress was higher for the 9 GW/cm2 sample compared to that of the 7 GW/cm2 sample, which aligns well with the hypothesis of a thermal effect of laser. The as-received material on account of cold rolling has a compressive surface residual stress. At a depth of 50 μm too, the residual stress in the peened material was tensile albeit the magnitude was reduced. The thermal effect was expected to be attenuated with distance from surface and hence at 50 μm, tensile residual stresses developed were of weaker magnitude. Again, considering the higher heating capacity of the 9 GW/cm2 samples, the tensile residual stresses were of higher magnitude there vis-à-vis the 7 GW/cm2 samples.
Before we conclude, we would like to substantiate our assertion regarding the cold-worked state of the as-received Nitinol and the observed broadening in the XRD peak. Towards this end, we provide results from our TEM investigations on the as-received sample and the 7 and 9 GW/cm2 peened samples. We provide both selected area diffraction patterns (SADP) and corresponding bright field images from the samples. The SAD pattern of as-received Nitinol in Figure 6a shows continuous diffraction rings, especially the ring in the center was quite continuous. The rings surrounding the center ring were also continuous to some extent. However, there was no distinct halo pattern which is generally associated with amorphous material. In the case of SADP of the 7 GW/cm2 (Figure 7a) and SADP of 9 GW/cm2 (Figure 8a) peened material, the center ring was fragmented. Furthermore, the rings surrounding the center ring were also spotty in appearance. The change in the nature of the ring can be attributed to the change in structure brought about by the peening process.
The continuous rings in the as-received Nitinol were probably a result of the lattice strain introduced within the material during cold rolling. The same was conveyed by the TEM bright field images of the as-received shown in Figure 6b. The bright field image of the as-received sample depicts a lamellar structure. However, the regions between the lamellae were largely indistinguishable, and this was due to the high amount of plastic deformation stored in these regions. The bright field images of the 7 GW/cm2 (Figure 7b) and 9 GW/cm2 (Figure 8b) also depict a lamellar structure, however, these exhibited a higher resolution when compared to those of the as-received micrographs. In fact, the features improved progressively from the as-received to the 9 GW/cm2 samples. This is indicative of a reduction in the cold work of the sample following peening which is on account of the laser-induced heating during the peening process. It is pertinent to compare our observations with those of Ye et al. [16] who reported an amorphous structure in the surface and subsurface region of Nitinol following laser shock peening. As detailed in Table 1, the laser power density chosen by Ye et al. [16] was 4 GW/cm2 with pulse duration of 5 nanoseconds and overlap of 75%. Unlike Ye et al. [16] observations, the peened material herein is by and large crystalline as evident from the XRD plots (Figure 3a,b). The lack of amorphization of Nitinol during peening could be attributed to the heating effect of the laser. It is well-known that amorphization in Nitinol is encouraged by plastic deformation introduced by extensive cold working, and deformation at higher temperatures would preclude the same. It is possible that the combination of laser peening parameters including the type of ablation layer chosen in this work is encouraging laser heating instead of laser-induced plastic deformation. Work by Yella et al. [30] on SS 316 steel reveals a lowering of tendency of the material to develop compressive residual stress during laser peening if the ablation layer chosen is black paint. Since in our work black paint was chosen as an the ablation layer, this in combination with the high laser power densities (7 and 9 GW/cm2), high pulse duration (10 nanoseconds) and high overlap percentage (90) was probably encouraging laser-induced heating in the surface region in contrast to literature reports. This also explains the contrasting influence of laser shock peening on austenite-martensite phase distribution and the mechanical properties such as hardness and residual stress.

4. Conclusions

  • The laser shock peening behavior of a cold-worked Nitinol is reported in this work.
  • Laser peening experiments were conducted at 7 and 9 GW/cm2 laser power densities with a 90% overlap. Black paint was used as the ablation layer, and water was chosen as the confinement layer.
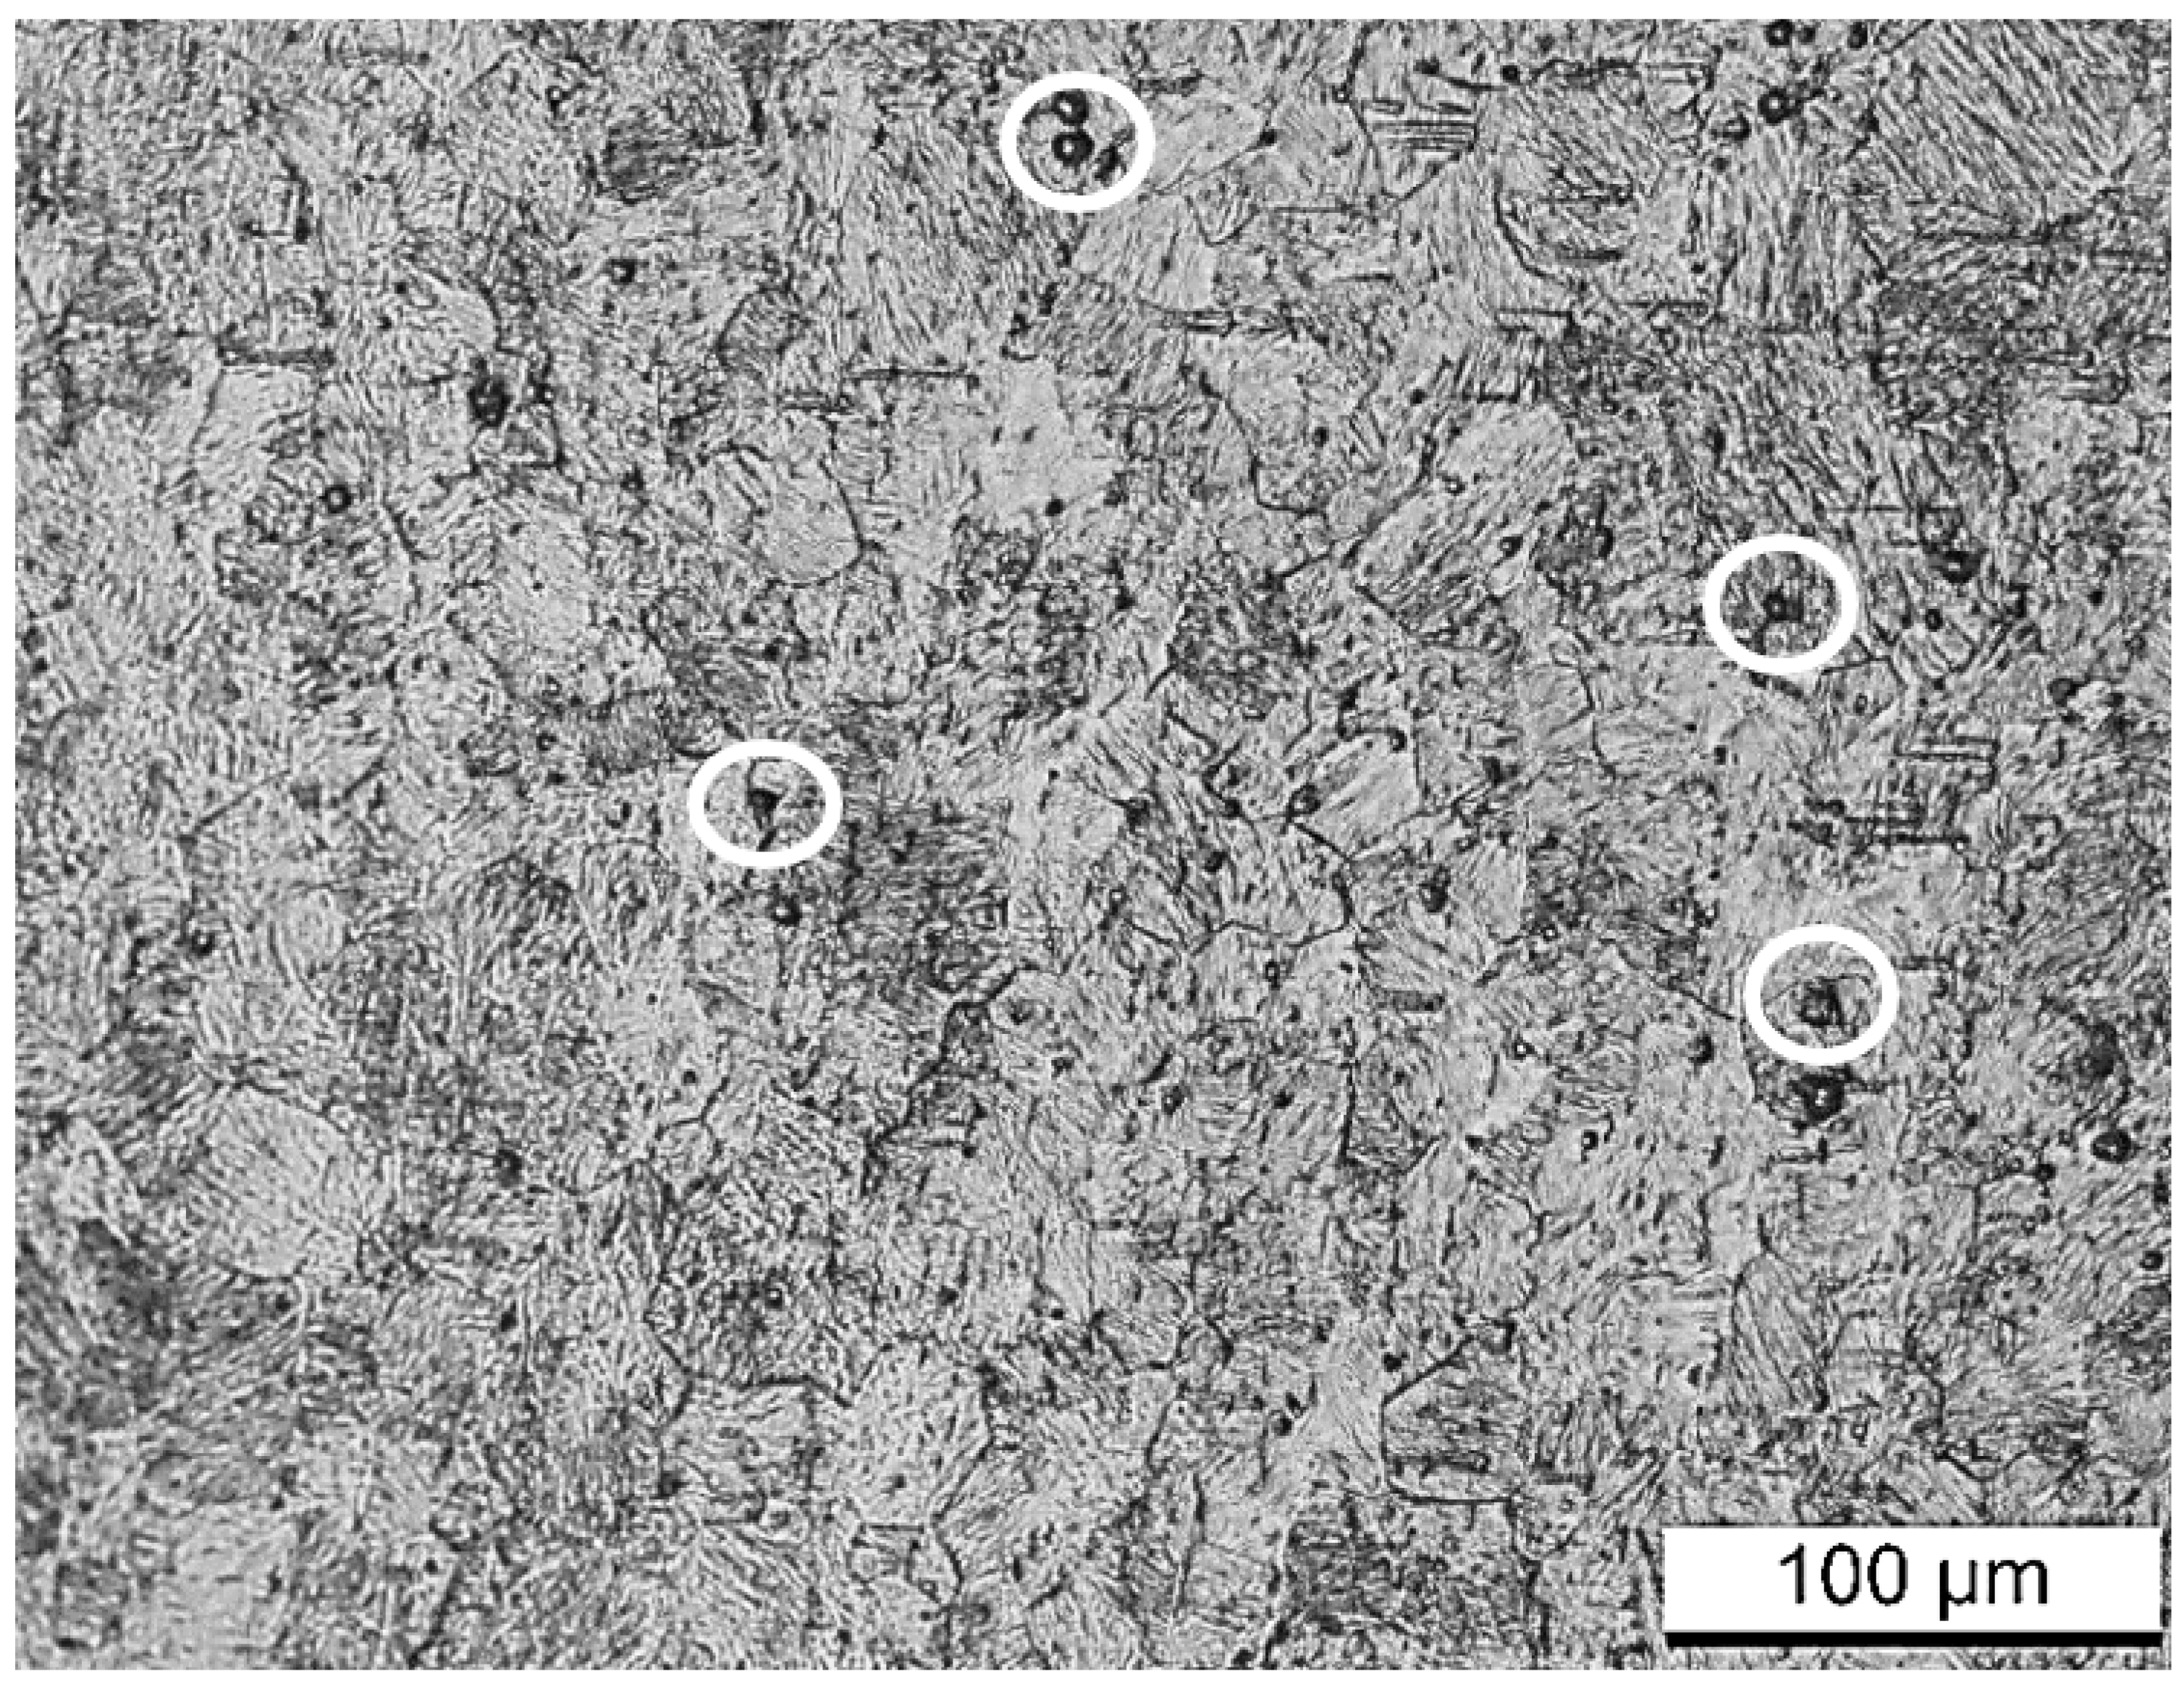
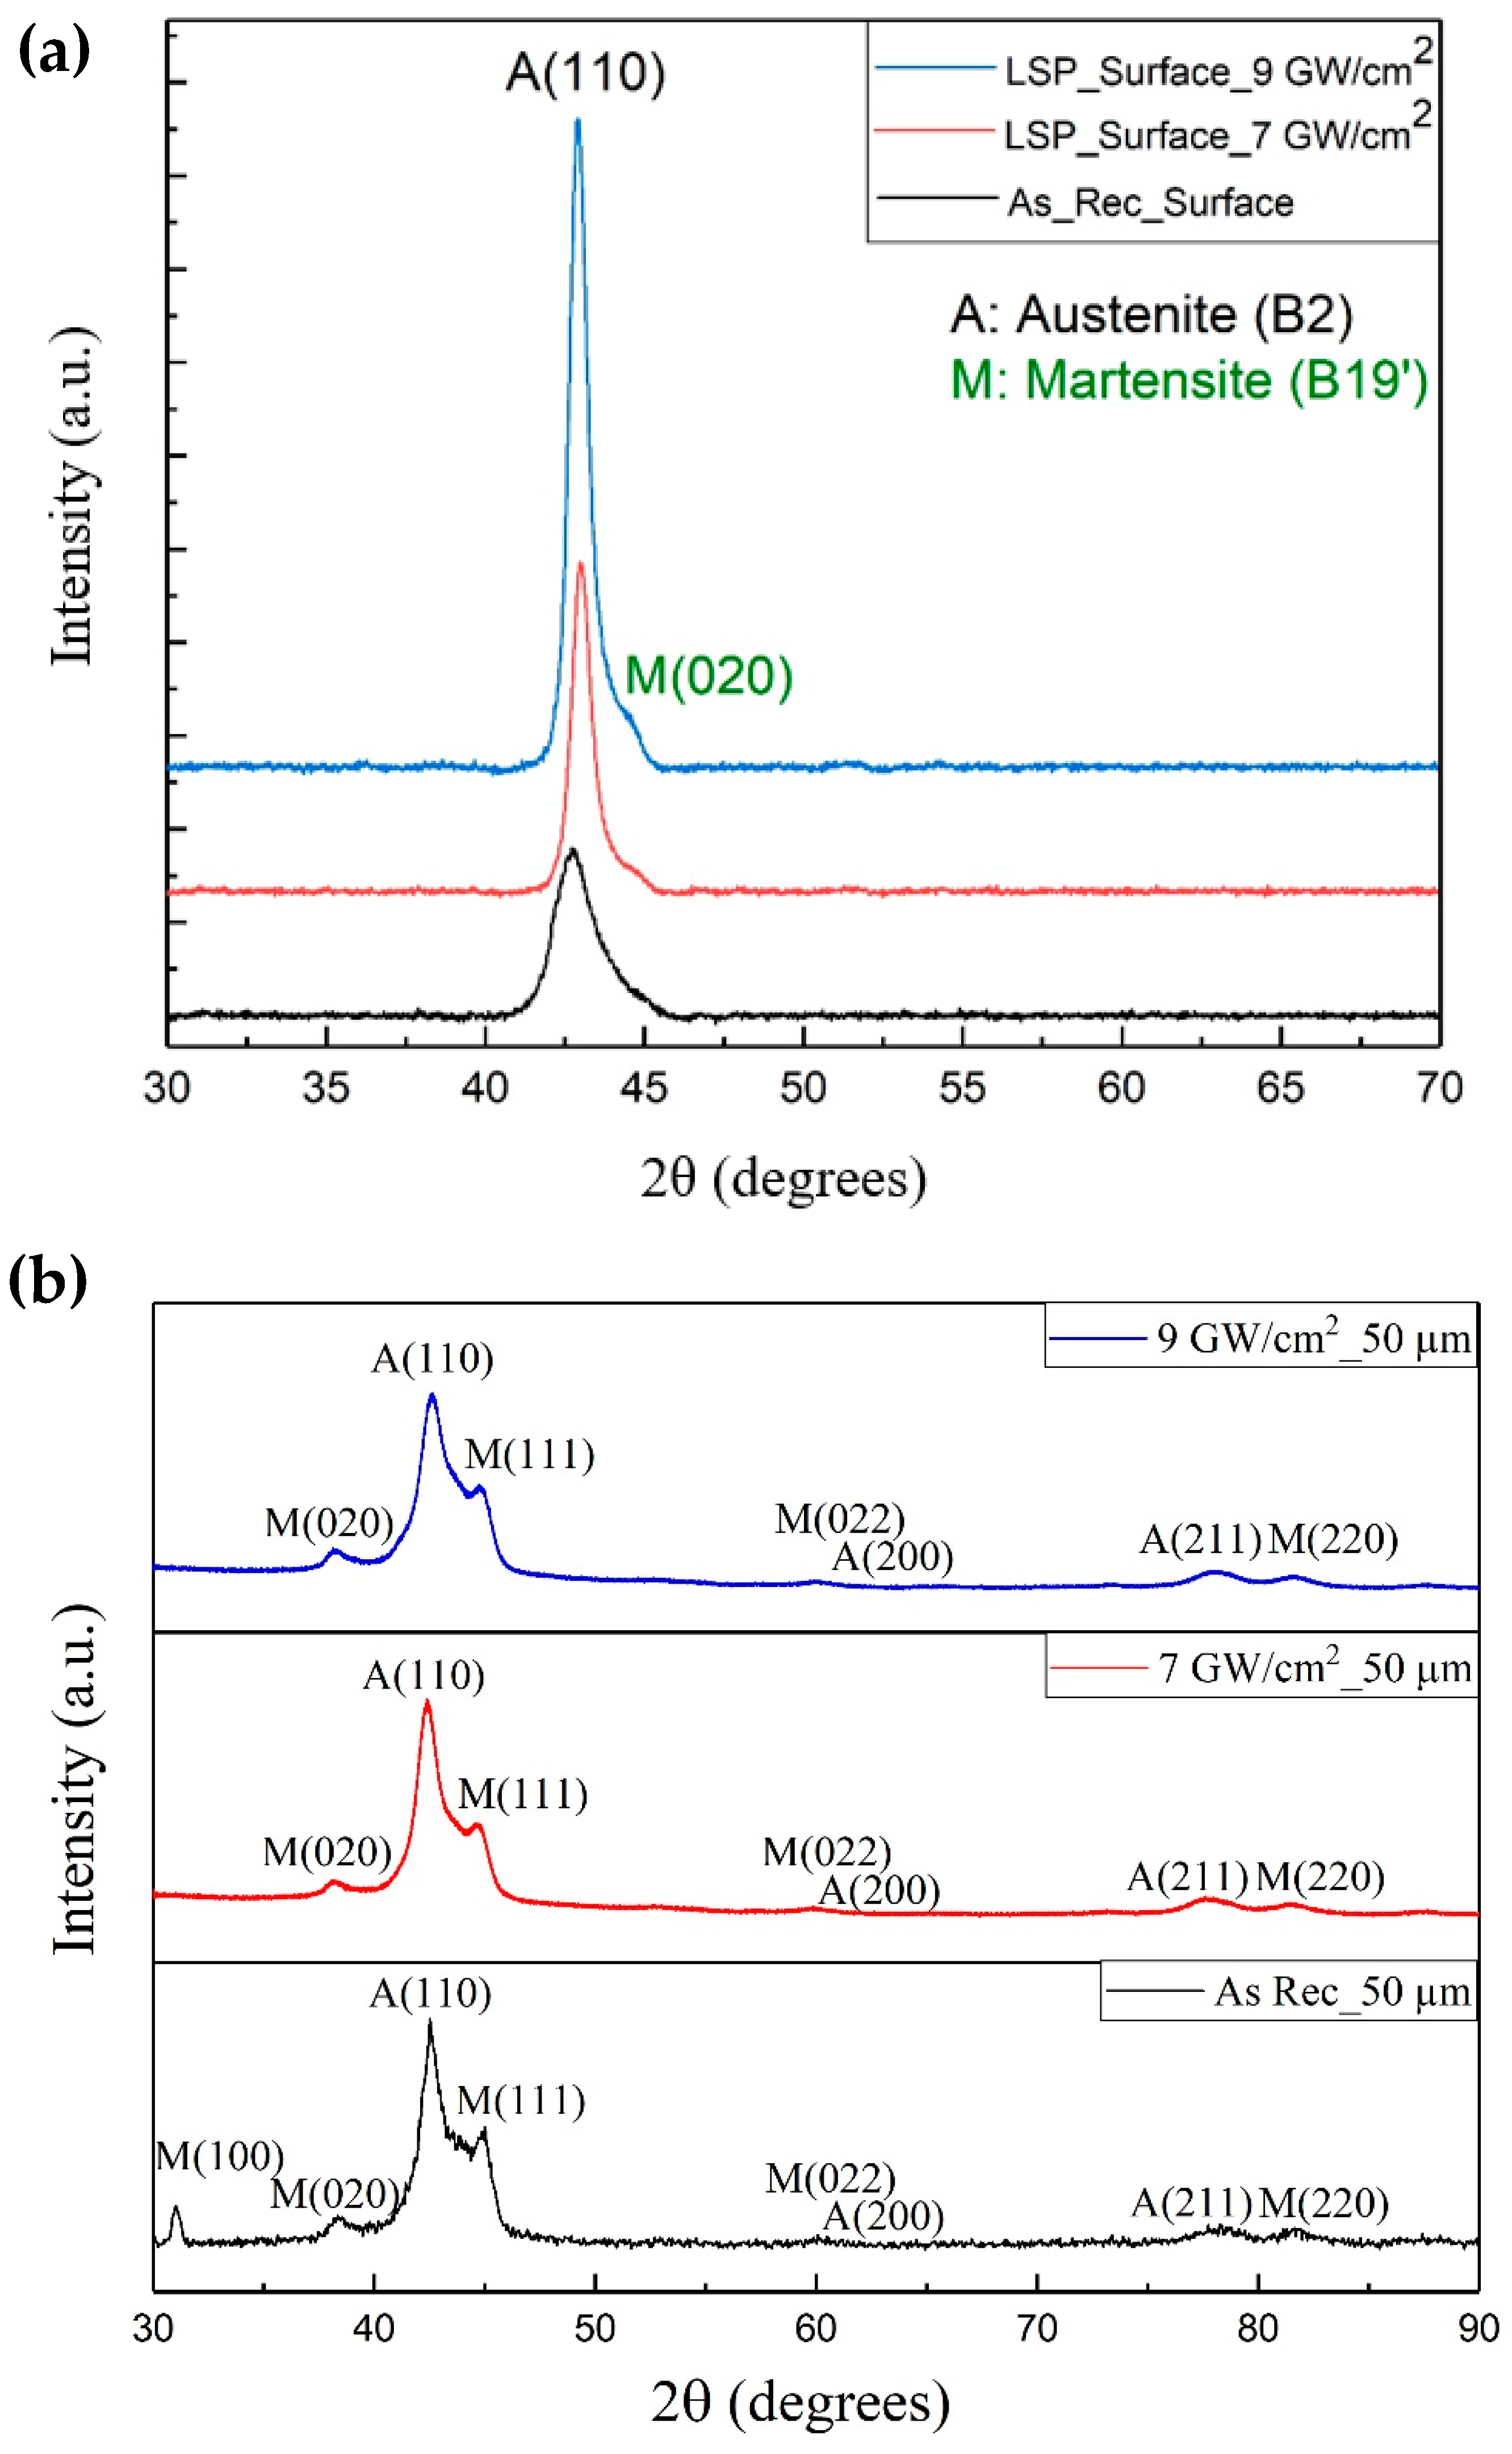
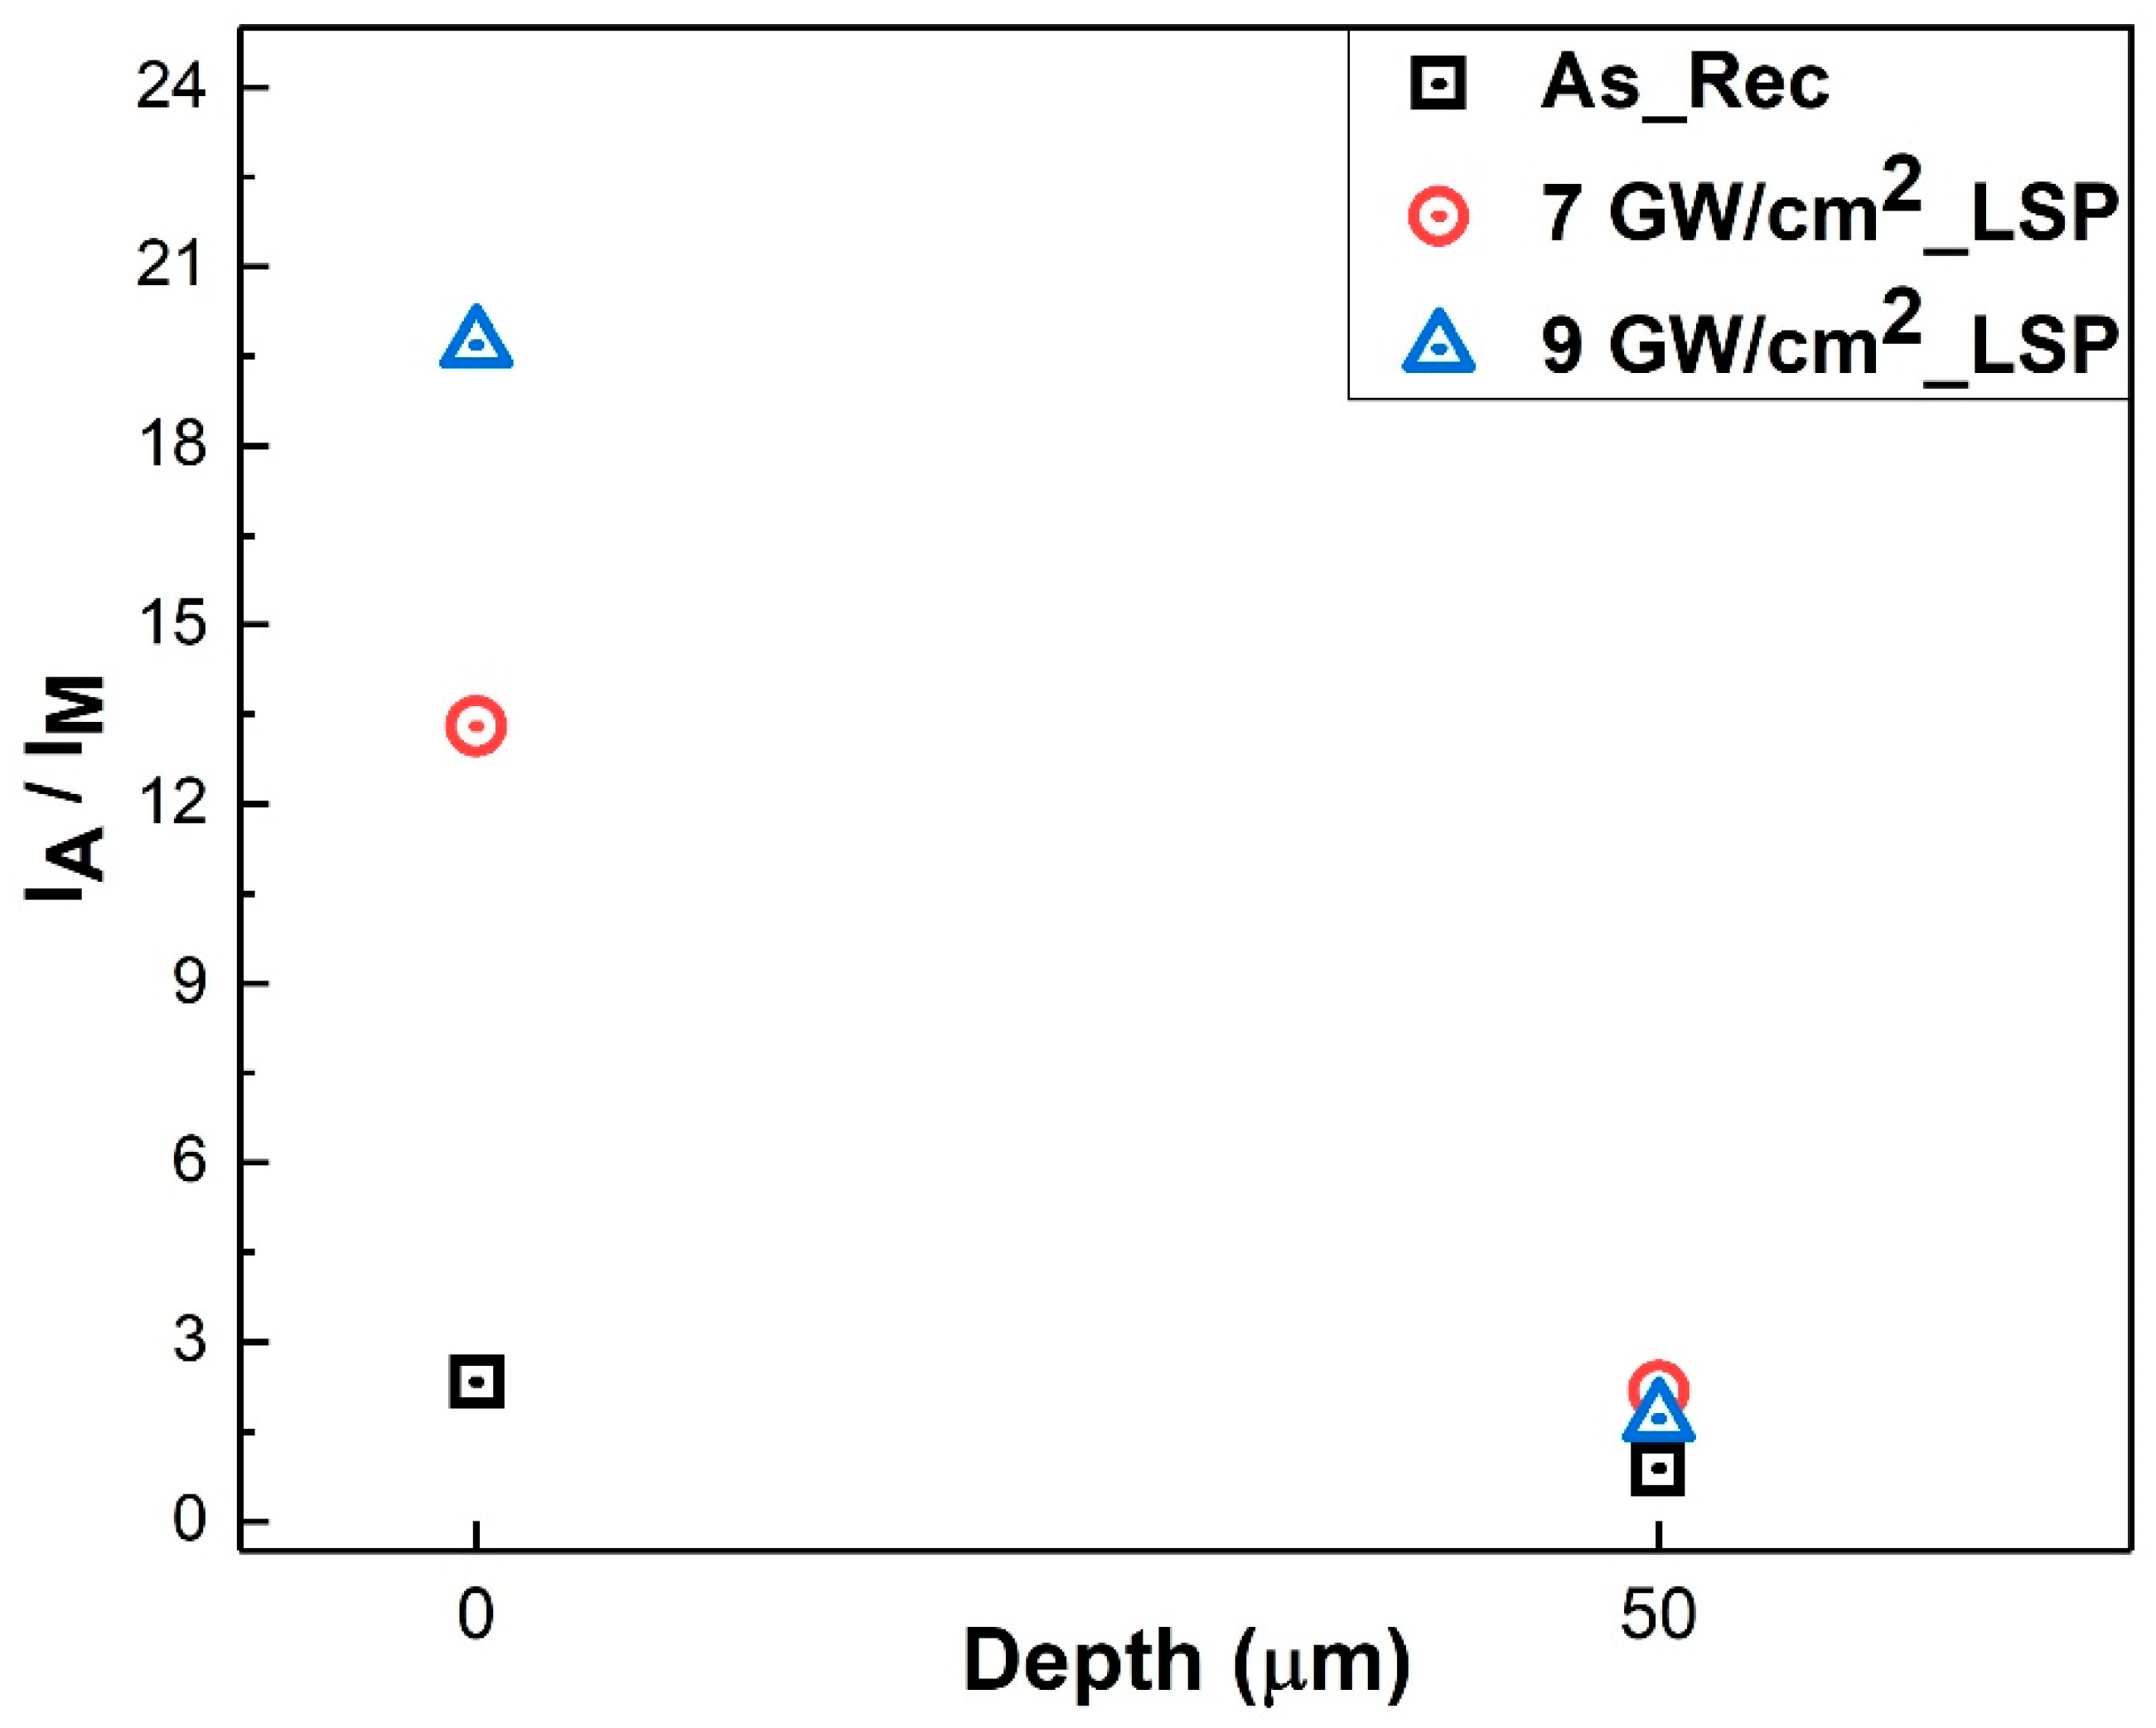
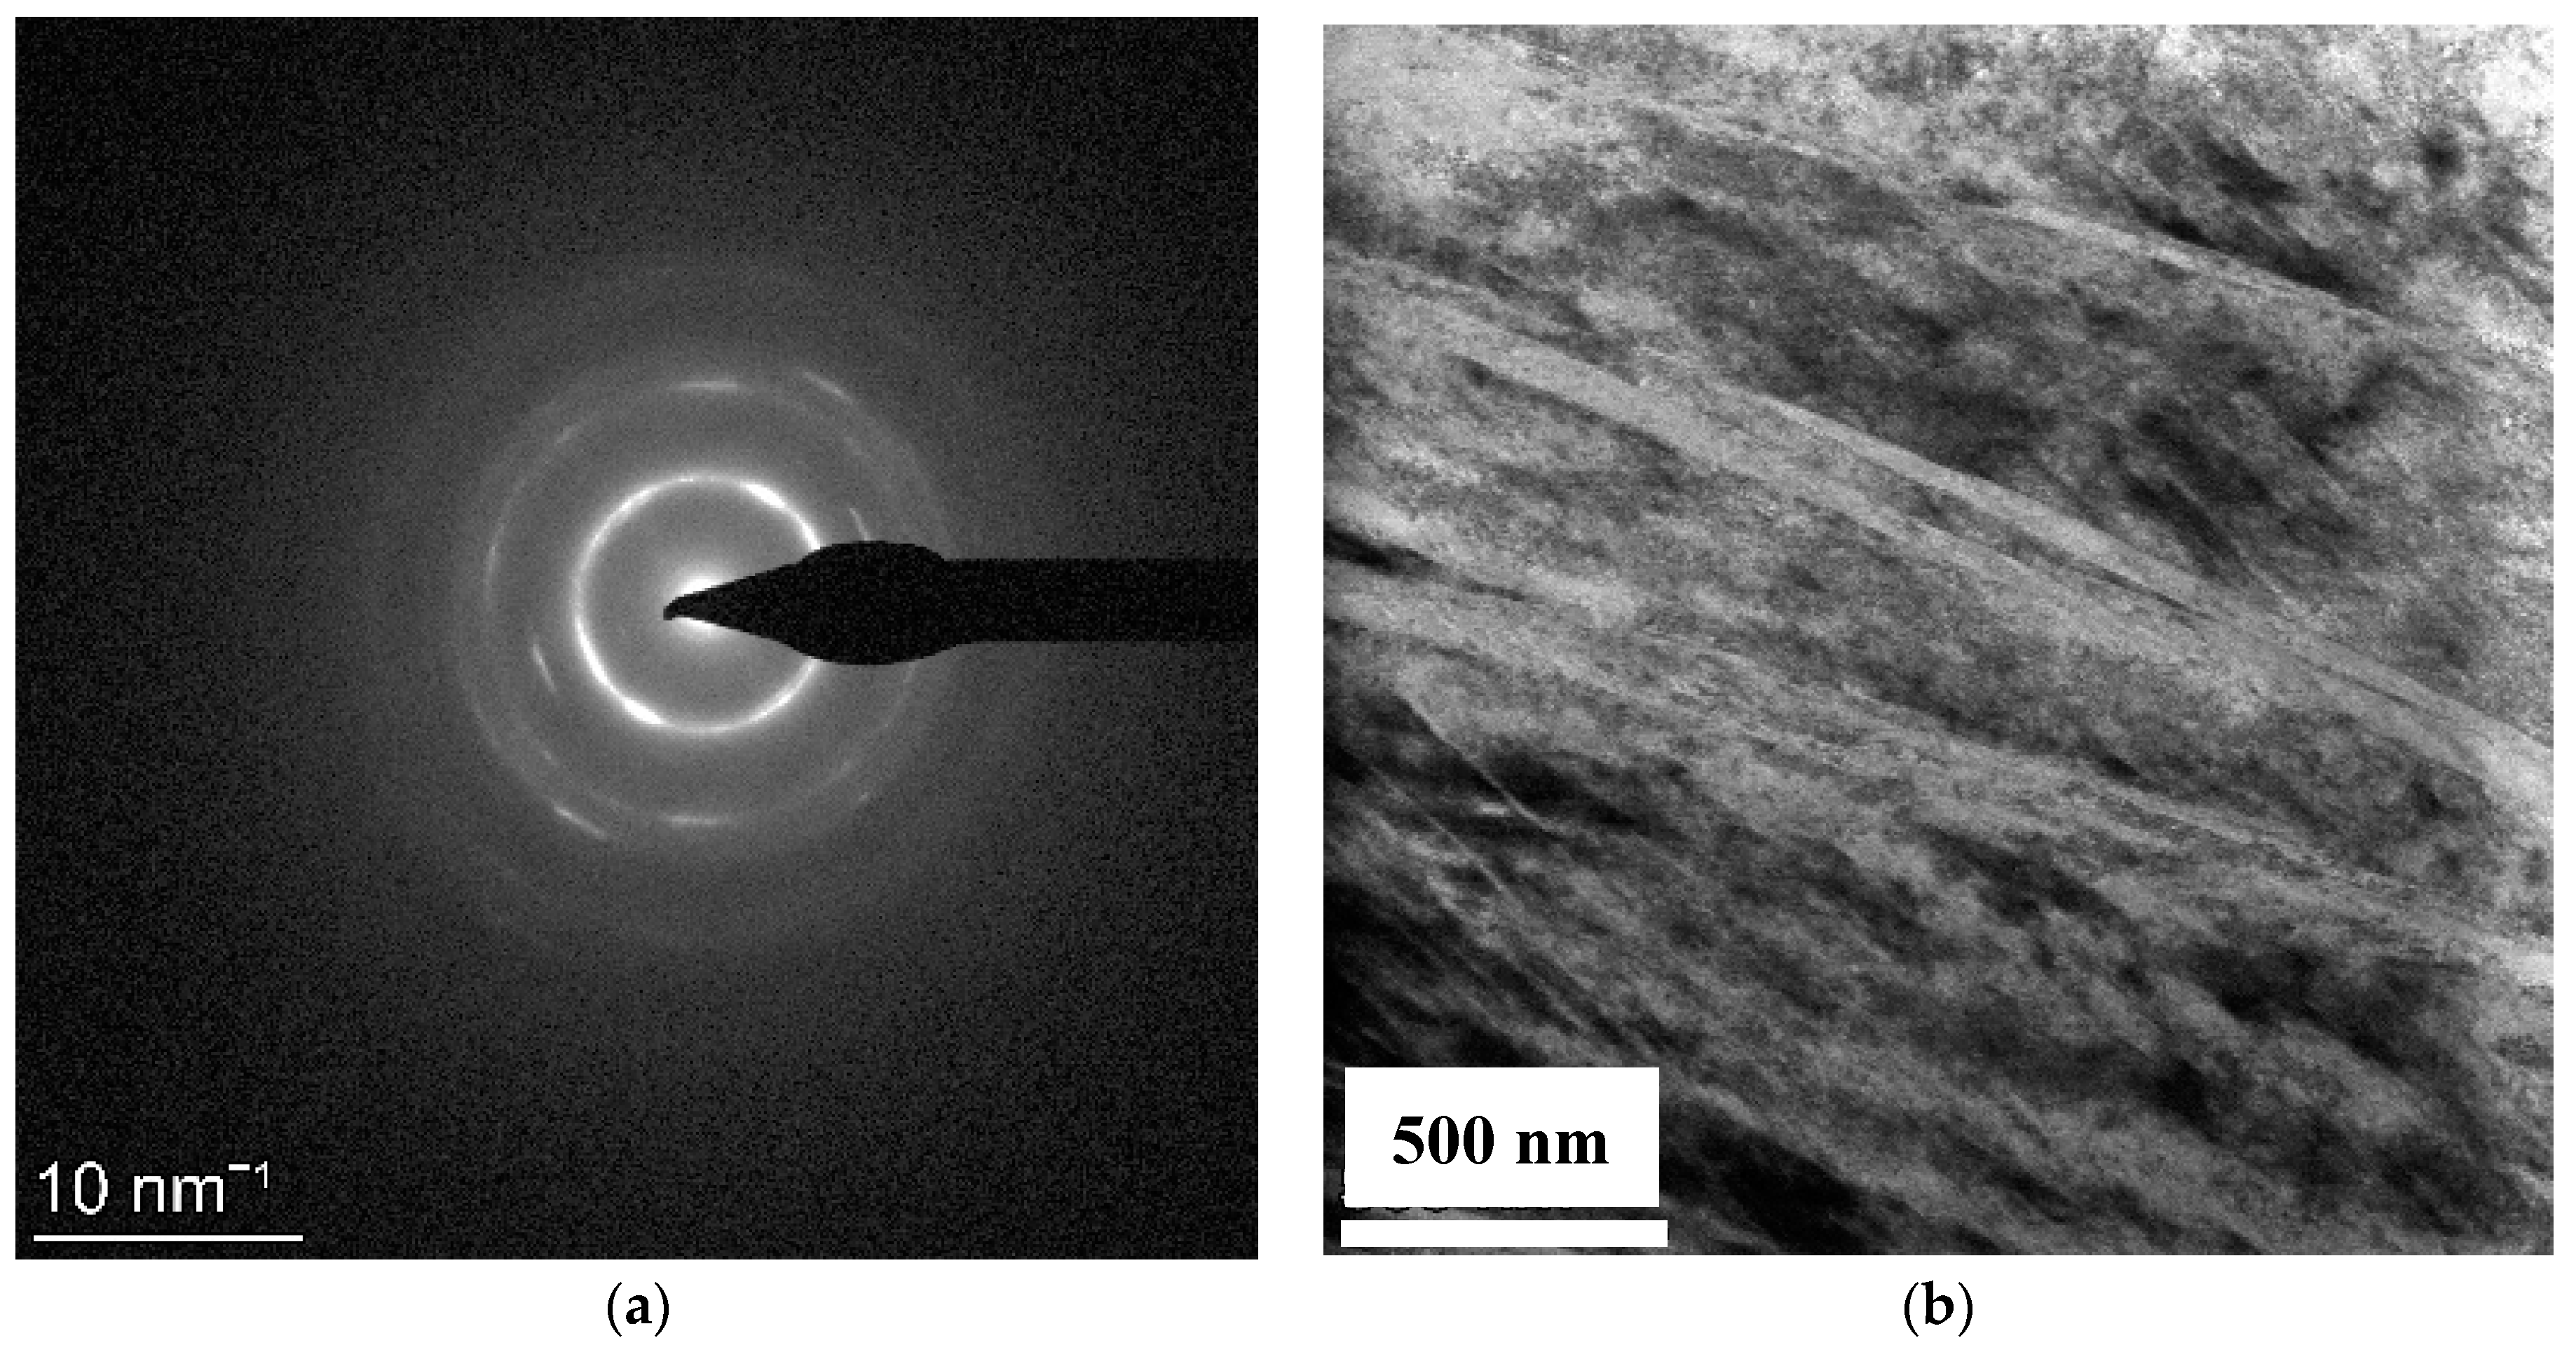
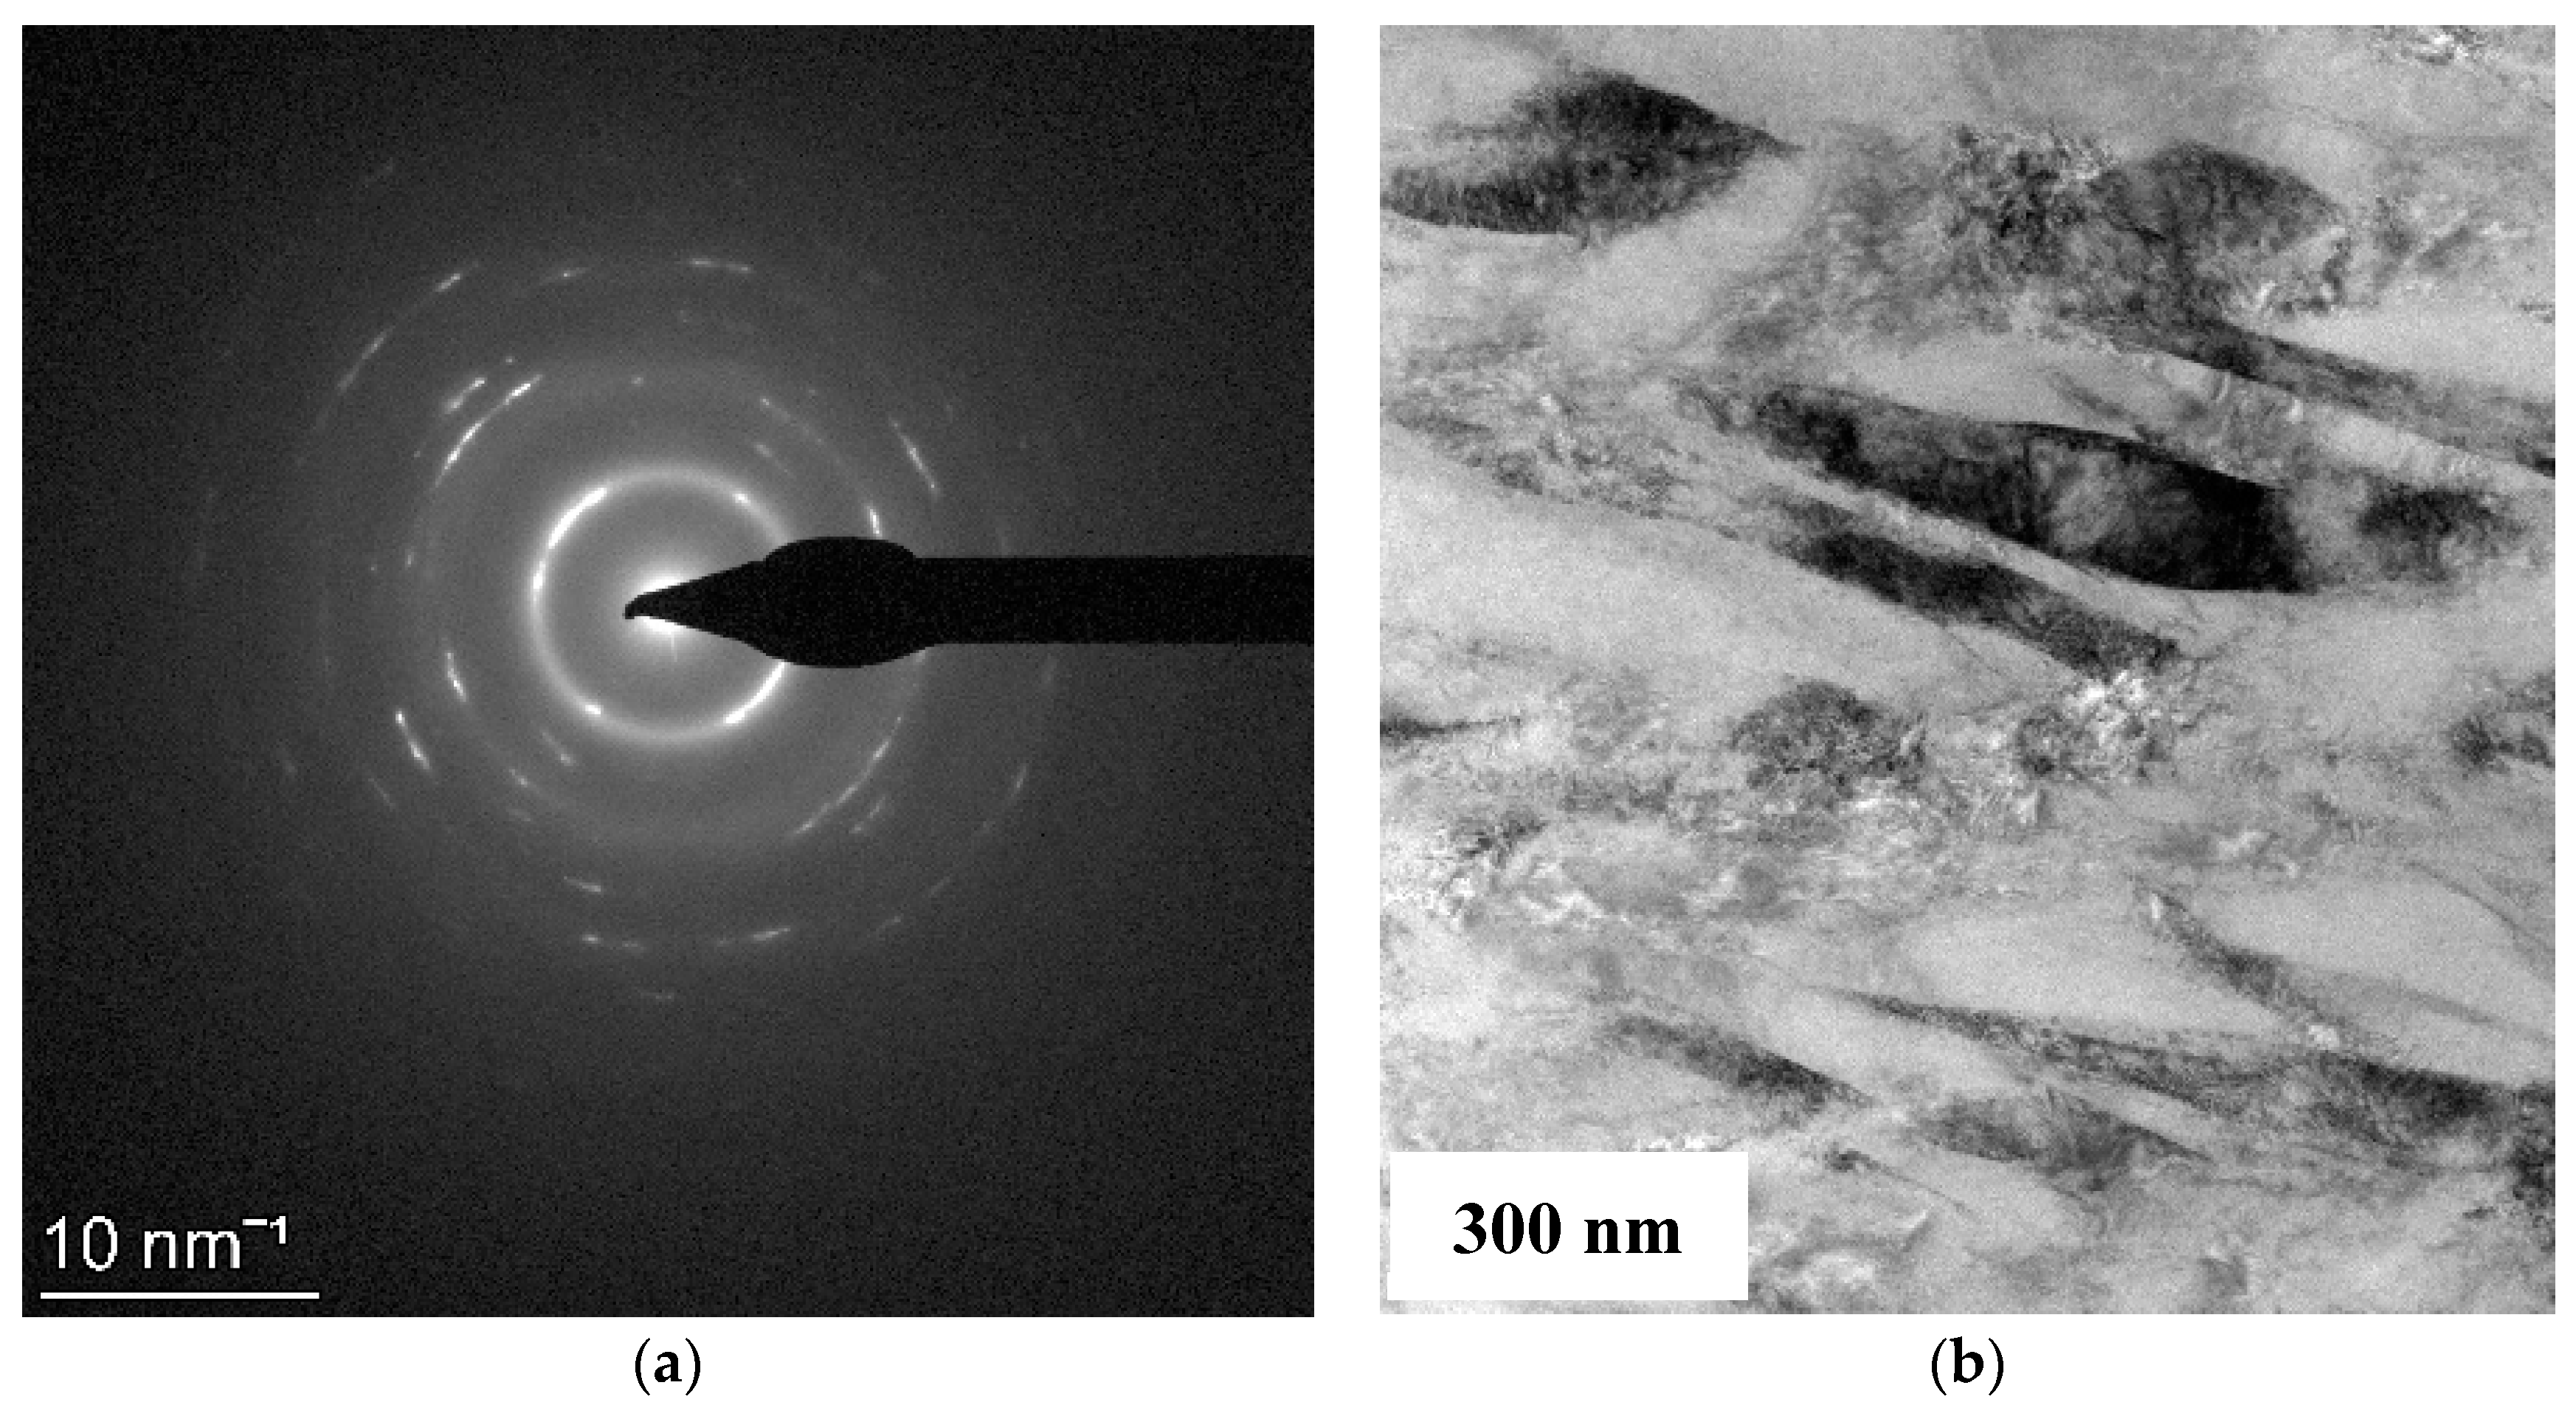
  • X-ray diffraction measurements revealed a primarily austenitic structure with some martensite phase in the as-received Nitinol. The as-received Nitinol was also found to be highly cold worked as suggested by the broadening of the X-ray peak. The peened samples on the other hand demonstrated sharper X-ray peaks indicative of reduction of the cold work during peening process. This reduction was attributed to laser induced heating.
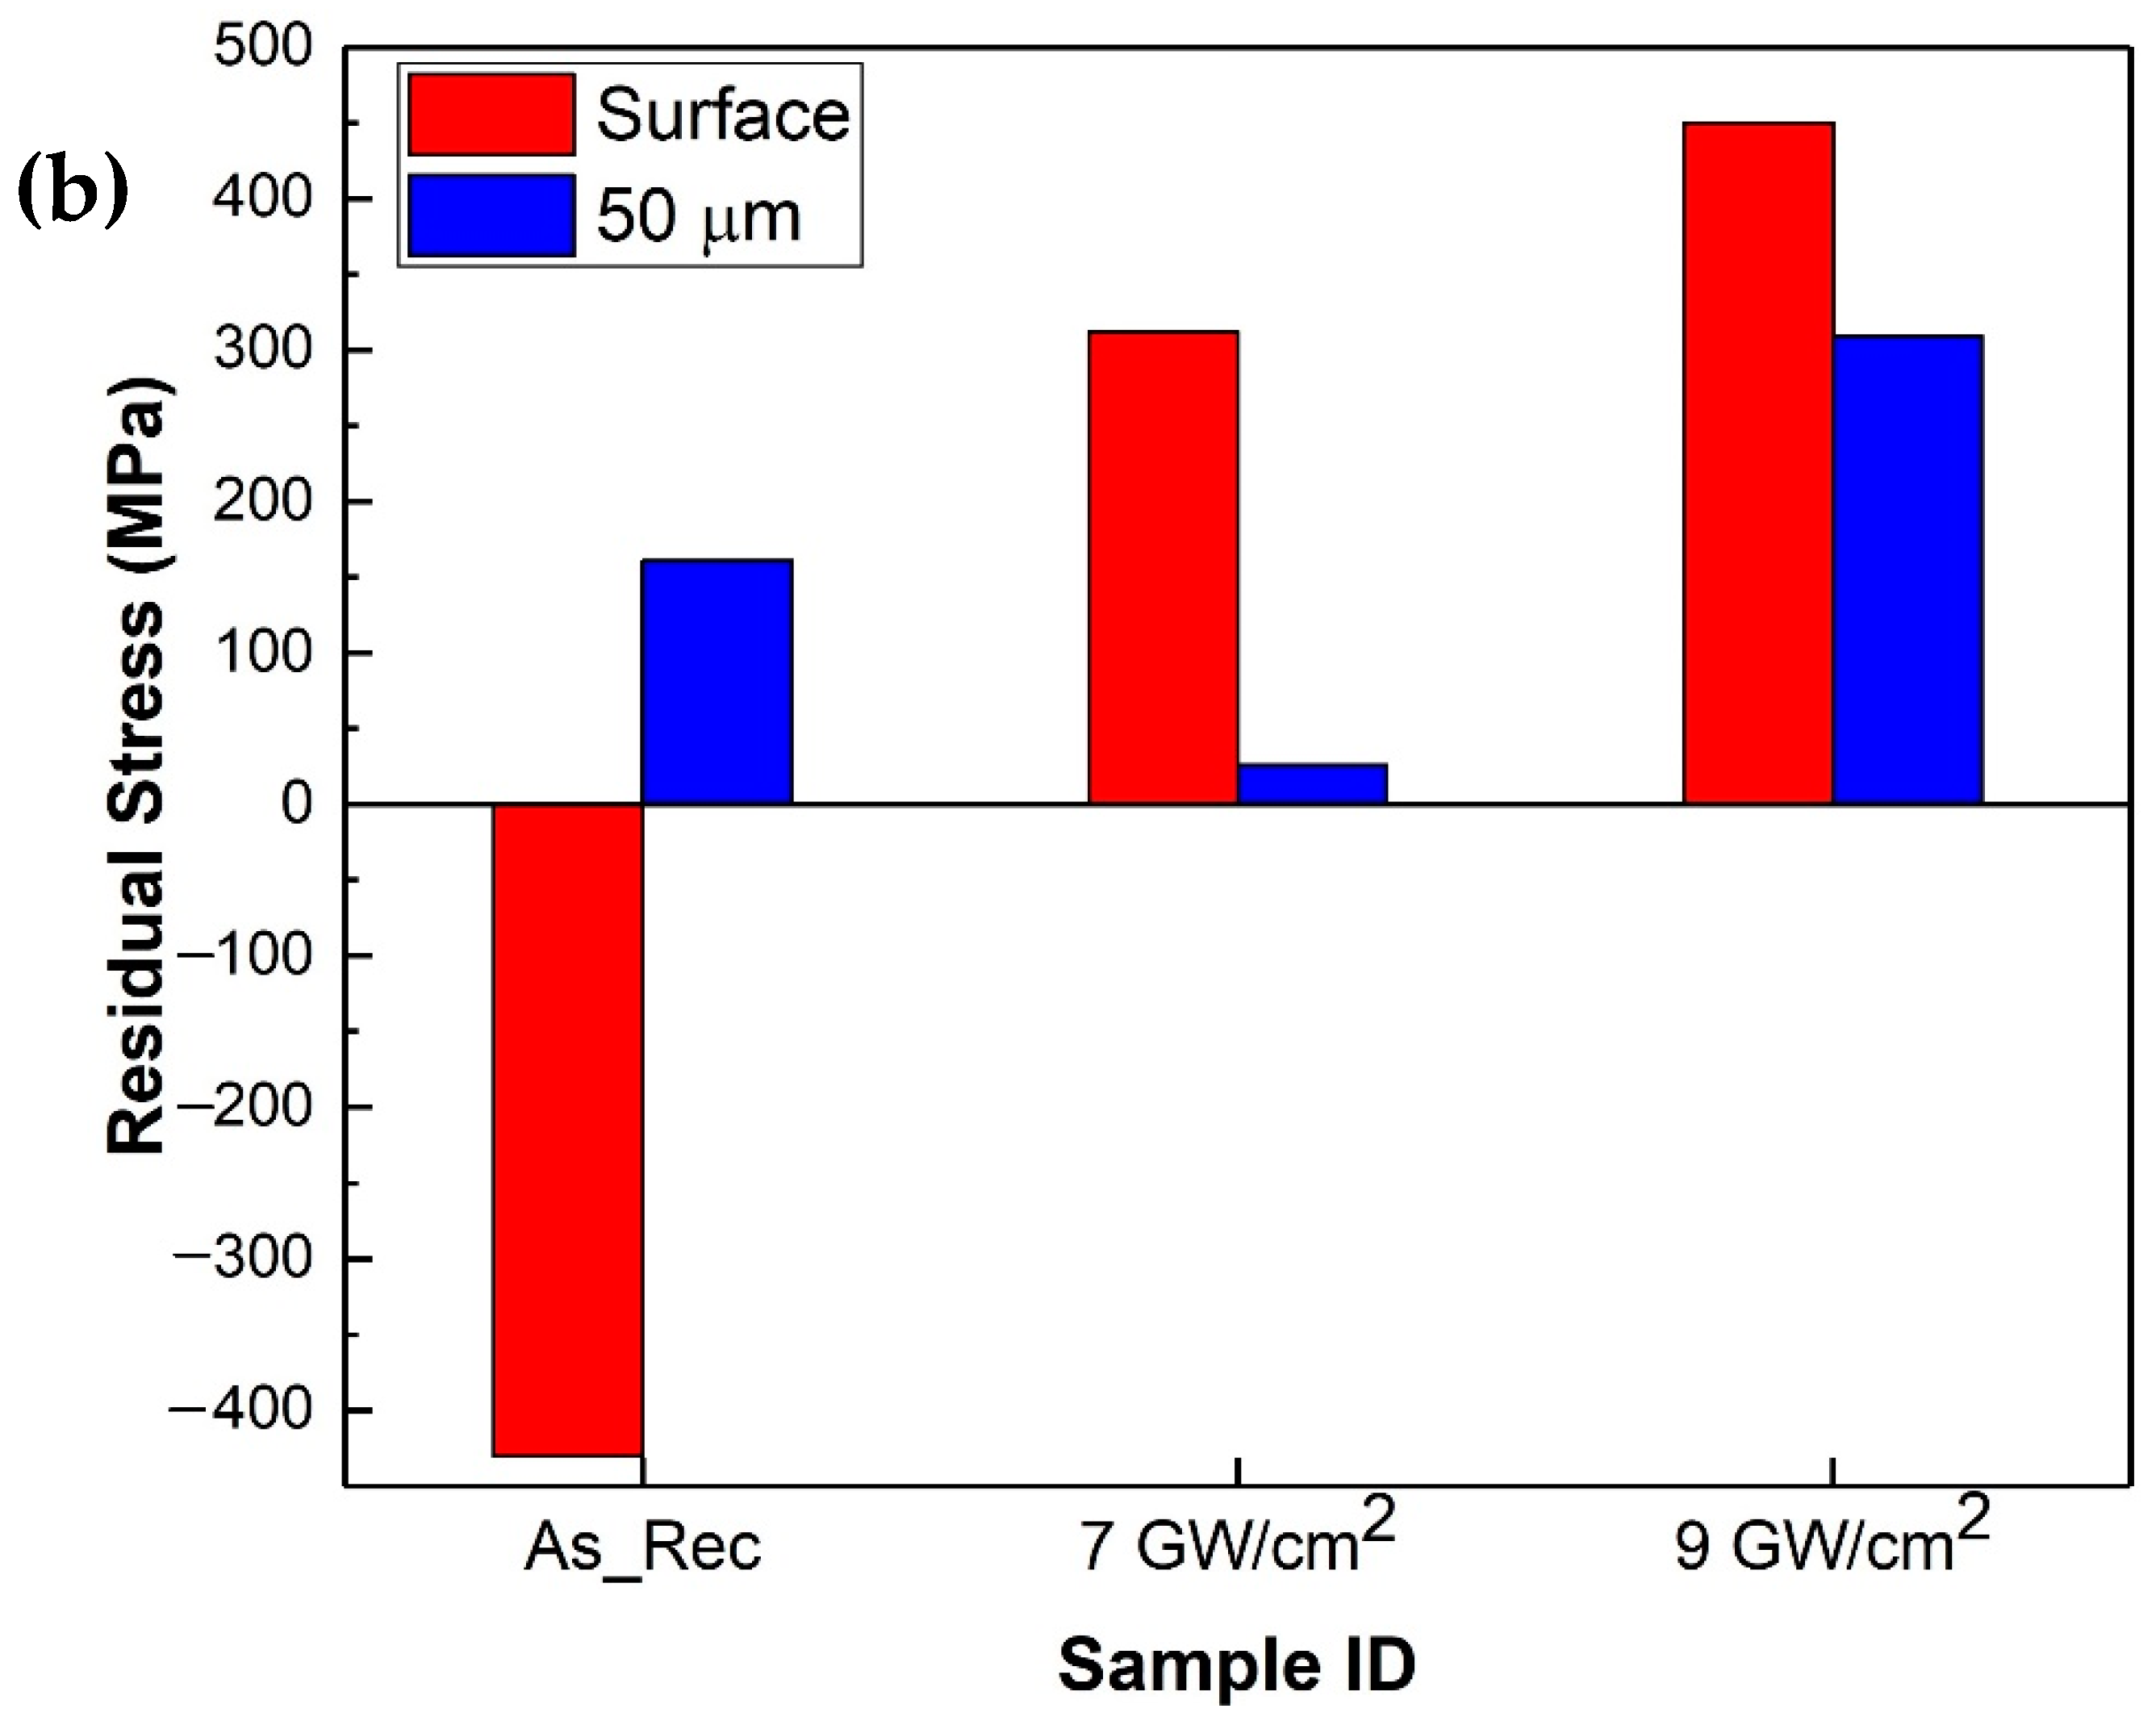
  • Residual stress measurements conducted on the surface revealed a compressive residual stress state (σxx = −419 MPa) within the as-received material, whereas the 7 and 9 GW/cm2 peened samples demonstrated a tensile residual stress state with σxx = 312 Mpa and σxx = 449 Mpa, respectively.
  • Residual stress measurements at a depth of 50 μm from the surface revealed a tensile residual stress profile in the as-received and peened at 7 and 9 GW/cm2 samples. The σxx was found to be 153, 37 and 288 MPa, respectively, for the as-received, 7 GW/cm2 and 9 GW/cm2 peened samples.
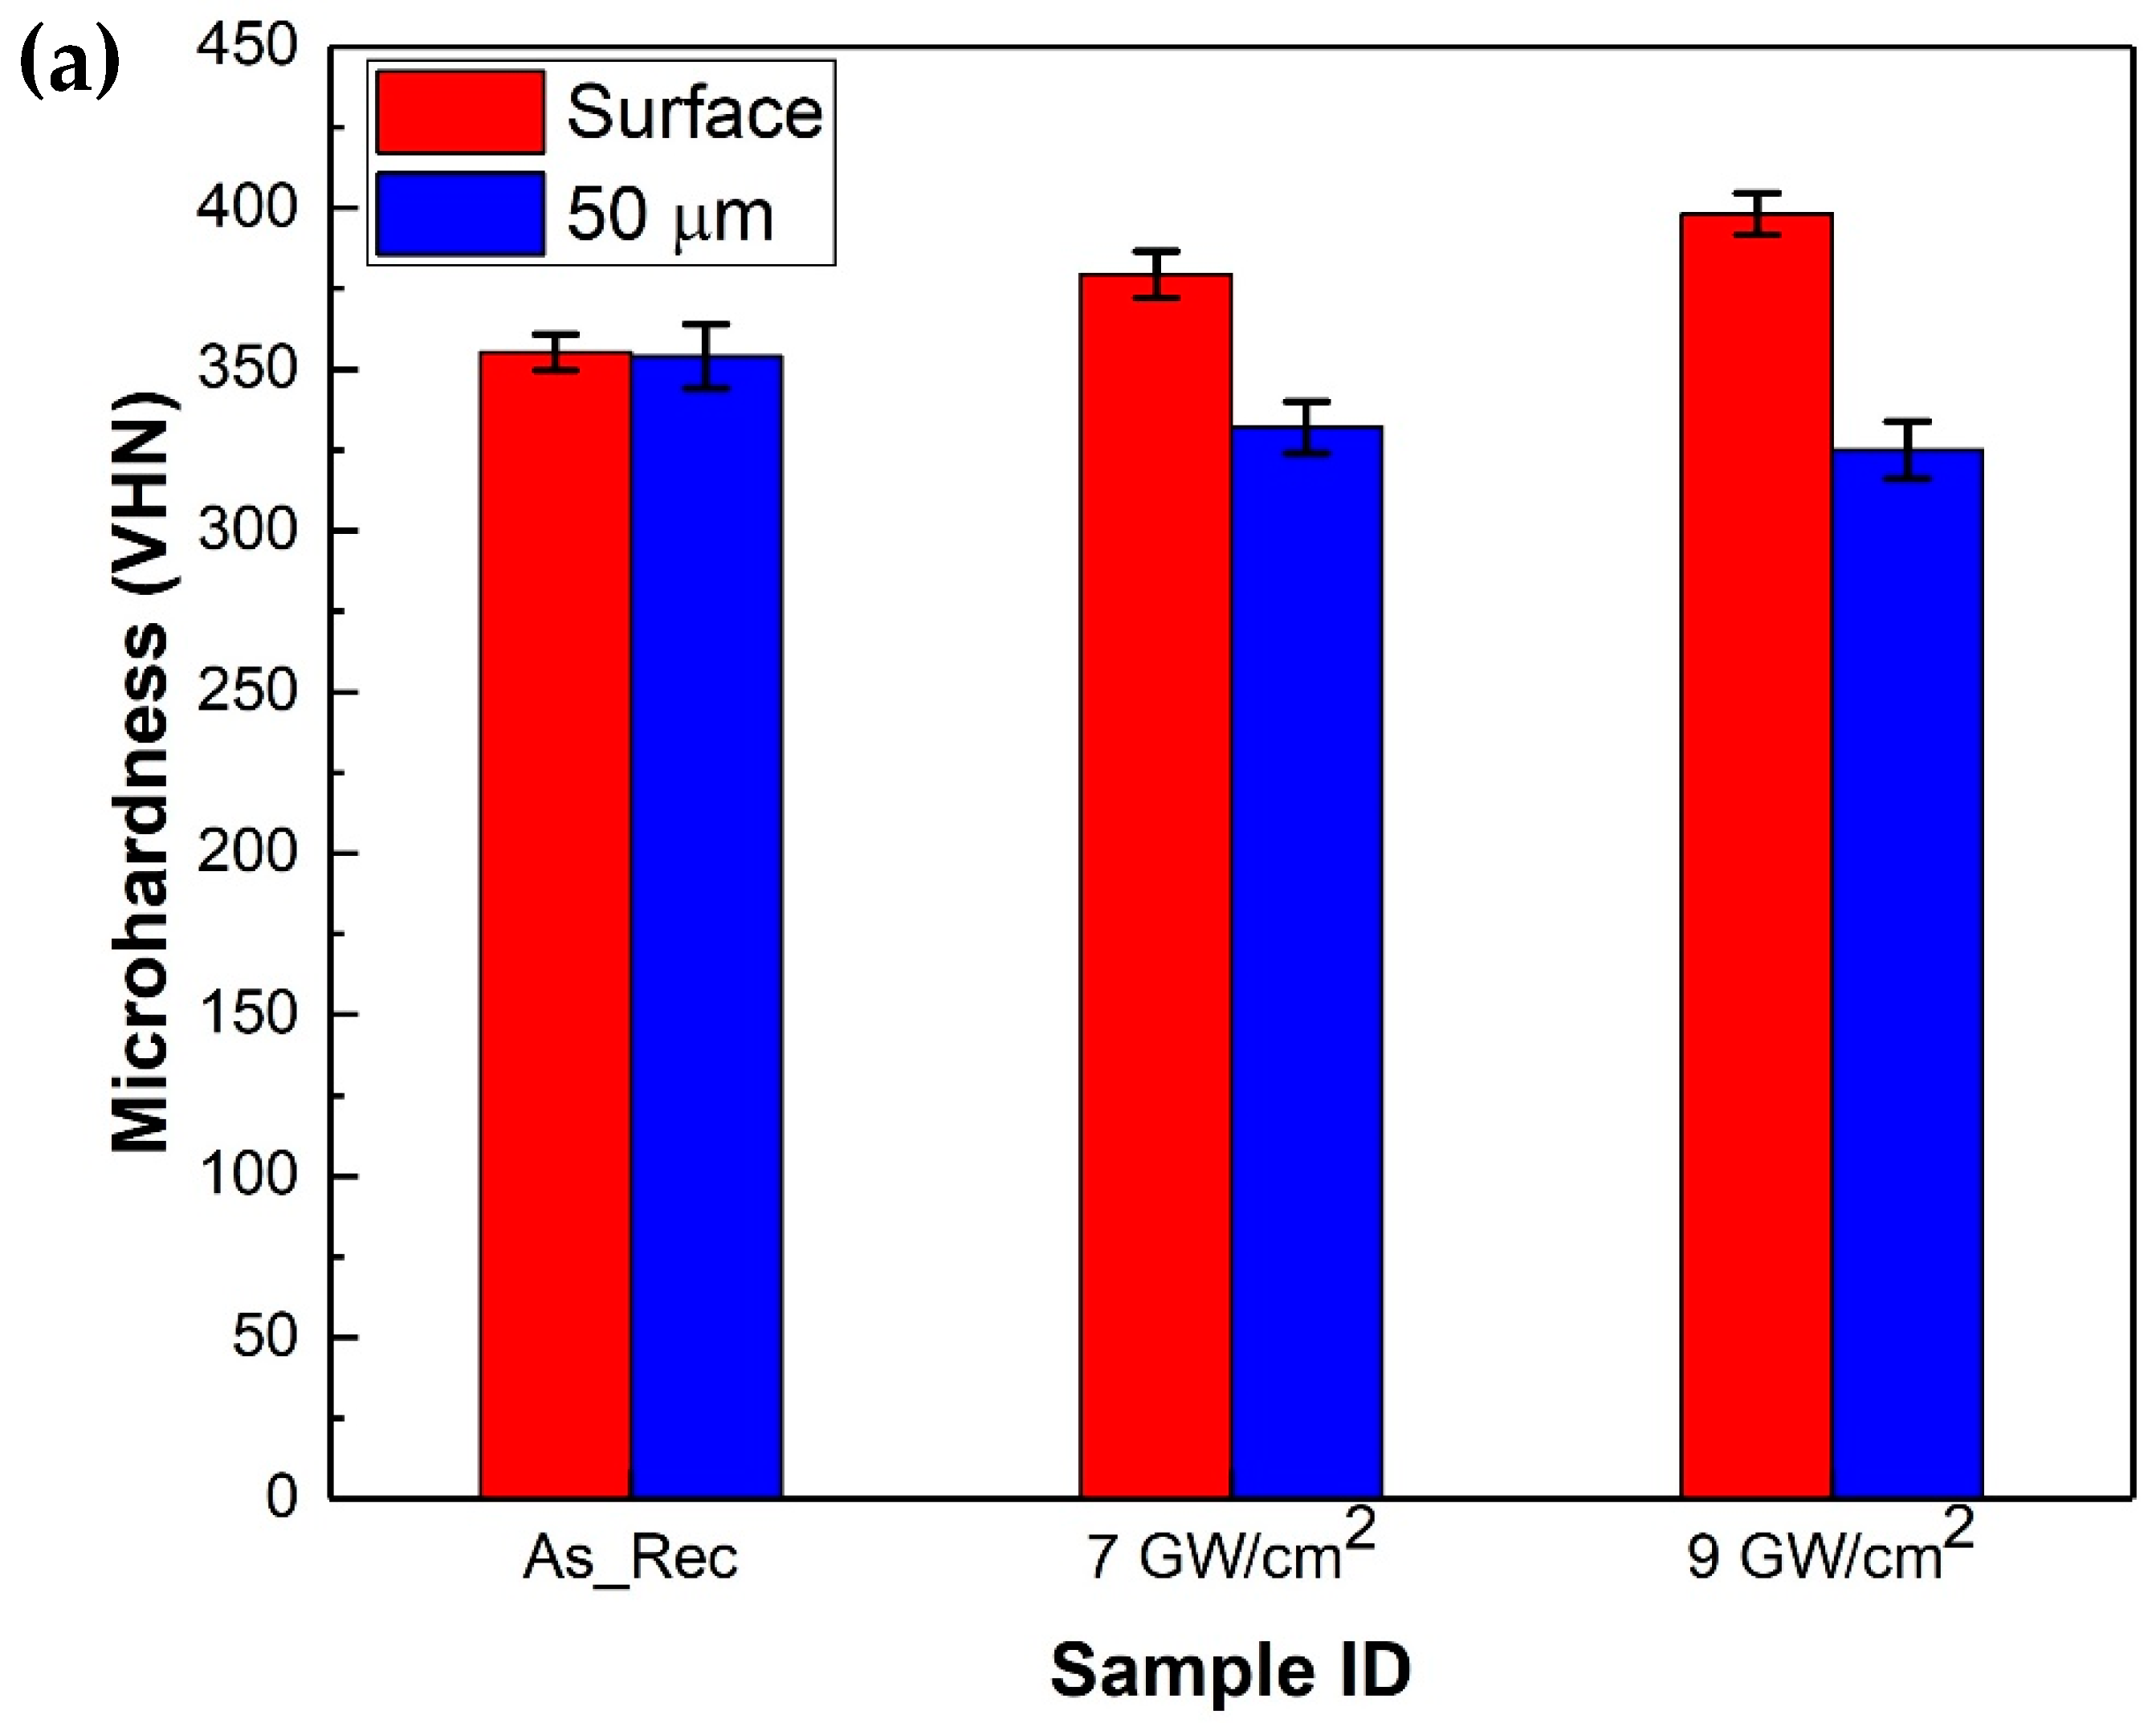
  • Microhardness measurements on the surface of the as-received Nitinol revealed an average hardness of 351 VHN which increased to 375 and 394 VHN, respectively, for the 7 and 9 GW/cm2 peened samples. Microhardness measurements at a depth of 50 μm from the surface revealed a reduction in the hardness of the peened samples vis-à-vis their respective surface counterparts. On the other hand, the microhardness of the as-received material at 50 μm depth was similar to that of its surface counterpart.
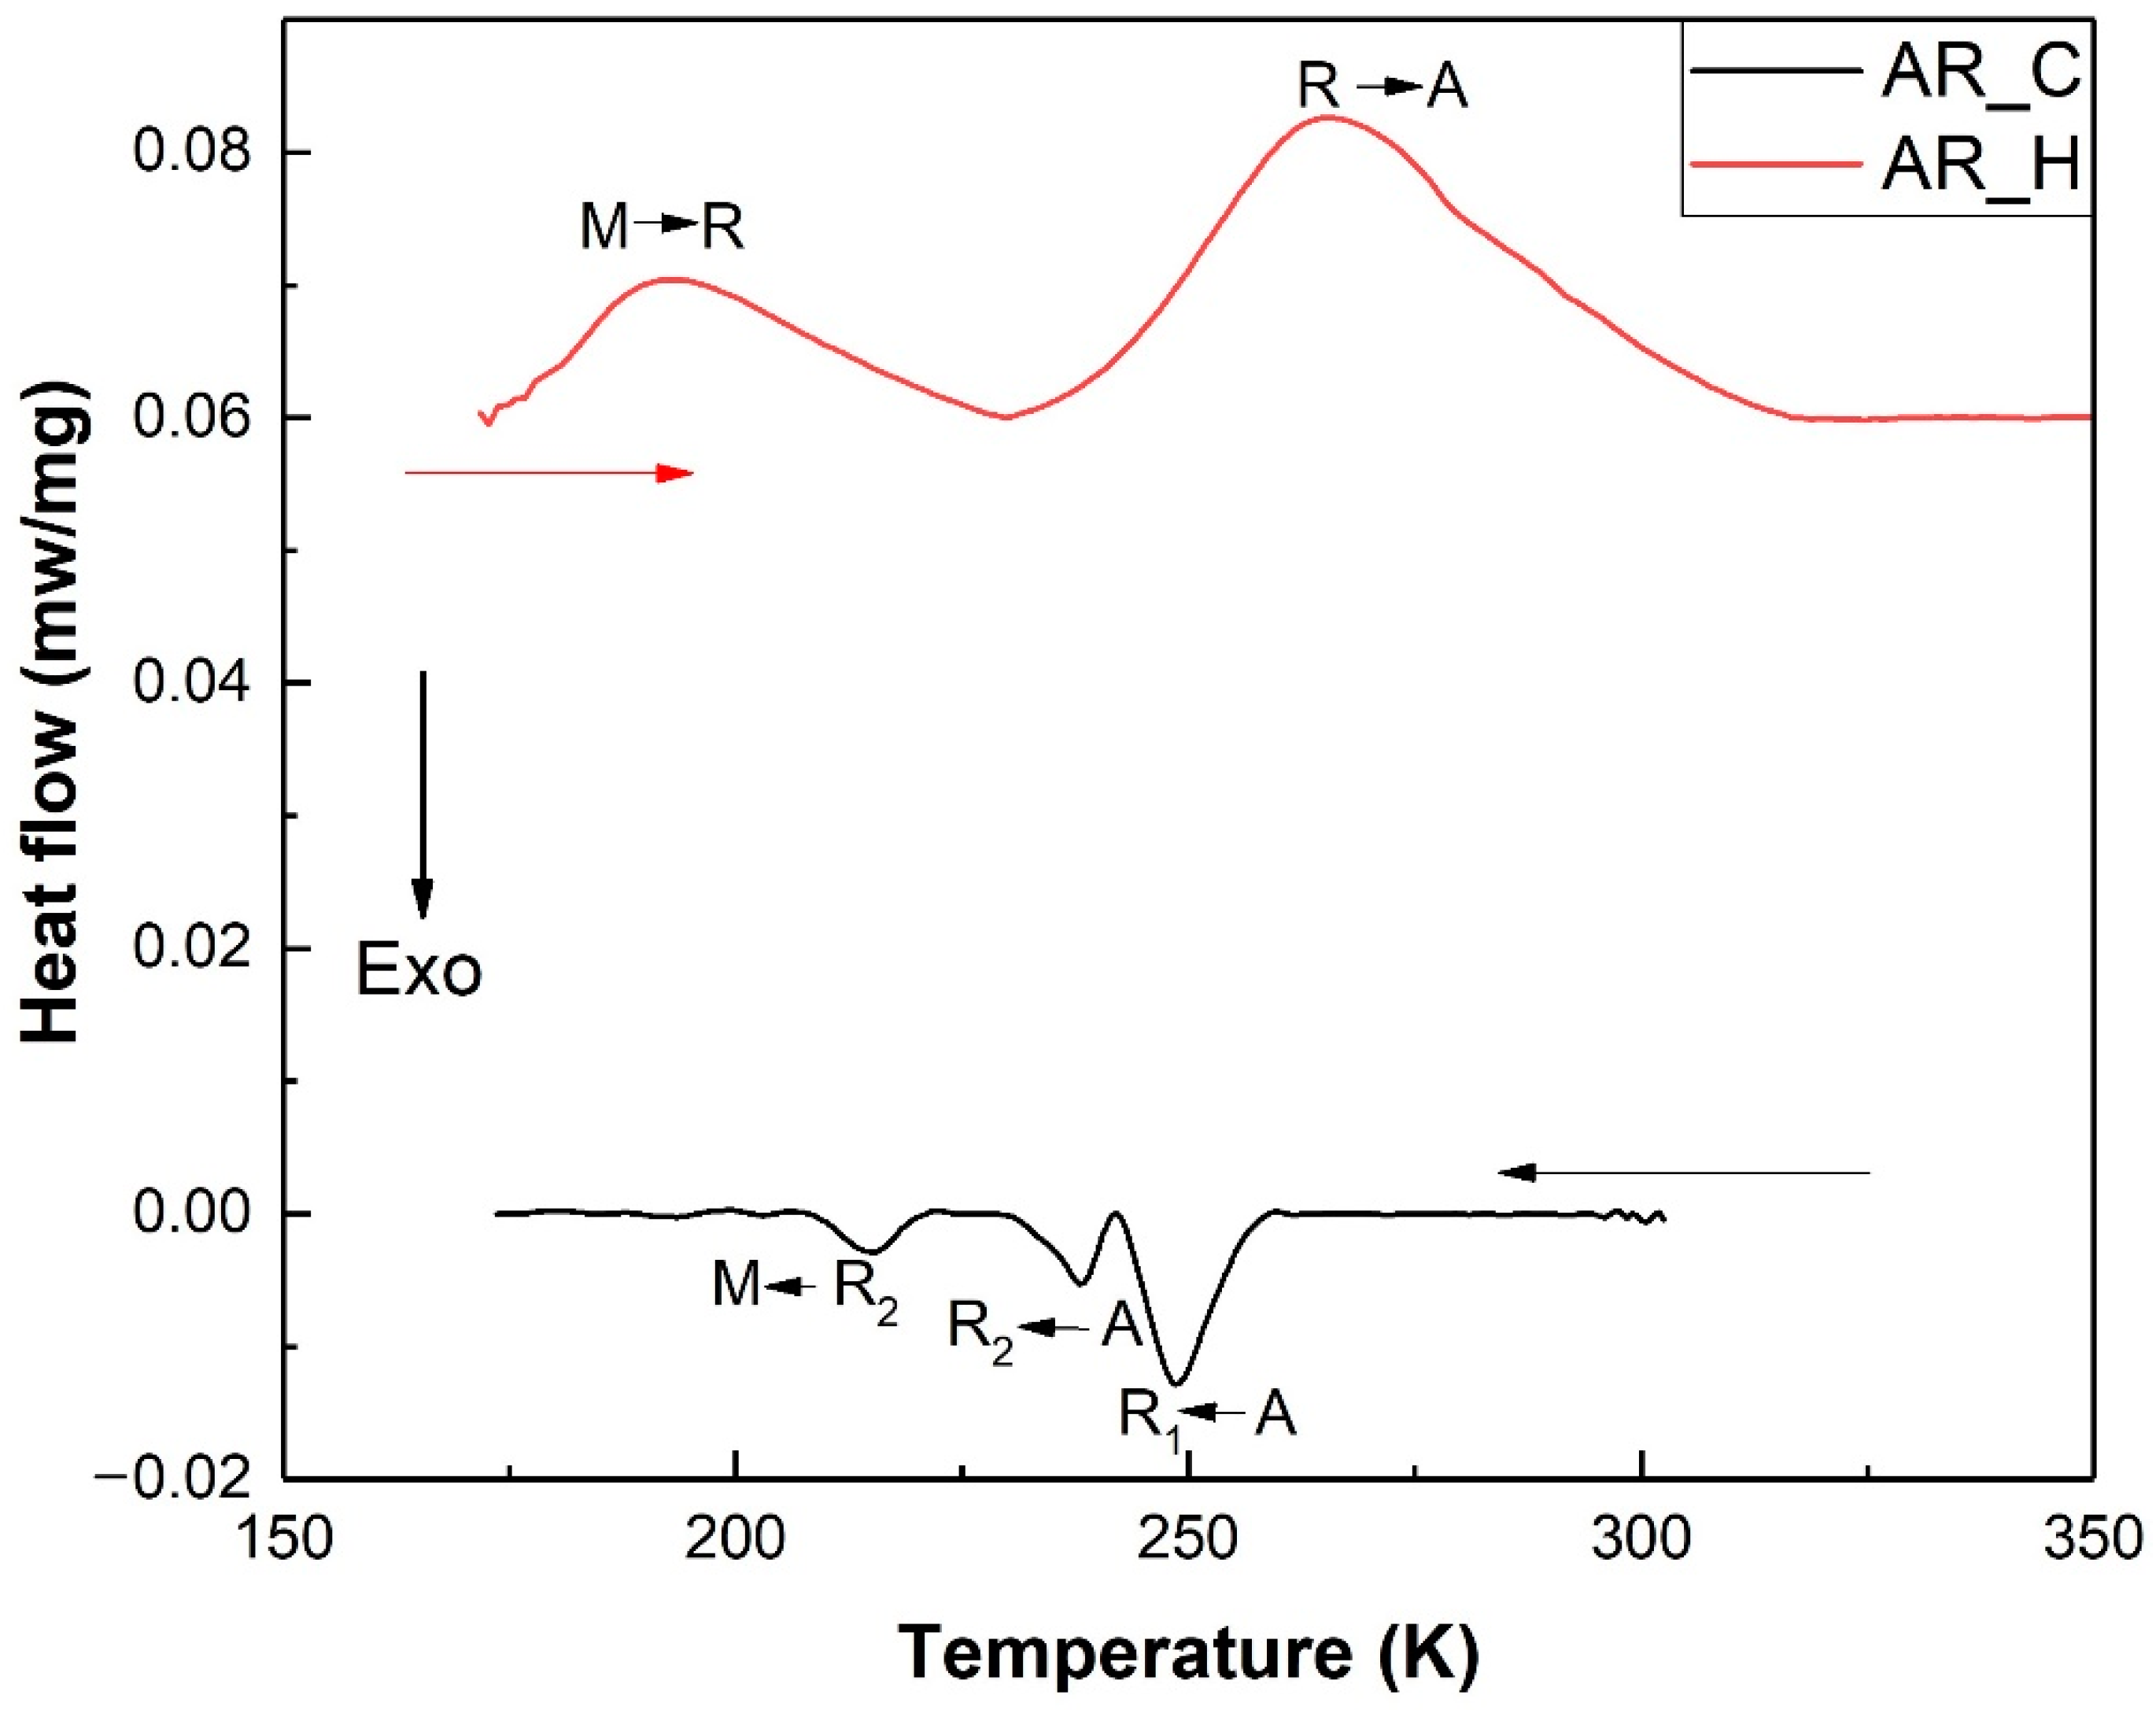
  • The contrasting behaviors of residual stress and hardness was attributed to the laser heating effect which was altering the austenite to martensite phase fraction during peening. The laser heating tendency was attributed to the laser power densities, the high overlap ratio of 90% and the use of black paint as the ablation layer.

Author Contributions

Conceptualization, R.D.T. and S.G.; Formal analysis, R.D.T., P.S., K.S., I.C. and S.G.; Investigation, R.D.T., R.G., P.S. and S.G.; Methodology, S.G. and A.K.S.; Resources, K.S. and S.G.; Supervision, S.G.; Writing—original draft, R.D.T., R.G. and P.S.; Writing—review & editing, K.S., A.K.S., I.C. and S.G. All authors have read and agreed to the published version of the manuscript.

Funding

The research was funded by Science and Engineering Research Board (SERB) through the sponsored project CRG/2018/004614.

Institutional Review Board Statement

Not applicable.

Informed Consent Statement

Not applicable.

Data Availability Statement

The raw/processed data required to reproduce these findings cannot be shared at this time as the data also forms part of an ongoing study.

Acknowledgments

The author SG gratefully acknowledges the financial support of the Science and Engineering Research Board (SERB) through the sponsored project CRG/2018/004614.

Conflicts of Interest

The authors declare no conflict of interest.

References

  1. Buravalla, V.R.; Remillat, C.; Rongong, J.A.; Tomlinson, G.R. Advances in damping materials and technology. Smart. Mater. Bull. 2001, 2001, 10–13. [Google Scholar] [CrossRef]
  2. Ueland, S.; Chen, Y.; Schuh, C.A. Oligocrystalline shape memory alloys. Adv. Mater. 2012, 22, 2094–2099. [Google Scholar] [CrossRef]
  3. Jani, J.M.; Leary, M.; Subic, A.; Gibson, M.A. A review of shape memory alloy research, applications and opportunities. Mater. Des. 2014, 56, 1078–1113. [Google Scholar] [CrossRef]
  4. Paul, P.P.; Paranjape, H.M.; A-Ahmadi, B.; Stebner, A.P.; Dunand, D.C.; Brinson, L.C. Effect of machined feature size relative to the microstructural size on the superelastic performance in polycrystalline NiTi shape memory alloys. Mater. Sci. Eng. A 2017, 706, 227–235. [Google Scholar] [CrossRef]
  5. Roguin, A.; Grenadier, E.; Linn, S.; Markiewicz, W.; Beyar, R. Continued expansion of the nitinol self-expanding coronary stent: Angiographic analysis and 1-year clinical follow-up. Am. Heart J. 1999, 138, 326–333. [Google Scholar] [CrossRef]
  6. Karacay, S.; Akin, E.; Olmez, H.; Gurton, A.U.; Sagdic, D. Forsus nitinol flat spring and Jasper jumper corrections of Class II division 1 malocclusions. Angle Orthod. 2006, 76, 666–672. [Google Scholar] [CrossRef] [PubMed]
  7. Thayer, T.A.; Bagby, M.D.; Moore, R.N.; DeAngelis, R.J. X-ray diffraction of nitinol orthodontic arch wires. Am. J. Orthod. Dentofac. Orthop. 1995, 107, 604–612. [Google Scholar] [CrossRef]
  8. Mahtabi, M.J.; Shamsaei, N.; Mitchell, M.R. Fatigue of Nitinol: The state-of-the-art and ongoing challenges. J. Mech. Behav. Biomed. Mater. 2015, 50, 228–254. [Google Scholar] [CrossRef] [PubMed]
  9. Robertson, S.W.; Pelton, A.R.; Ritchie, R.O. Mechanical fatigue and fracture of Nitinol. Int. Mater. Rev. 2012, 57, 1–37. [Google Scholar] [CrossRef]
  10. Nayan, N.; Roy, D.; Buravalla, V.; Ramamurty, U. Unnotched fatigue behavior of an austenitic Ni-Ti shape memory alloy. Mater. Sci. Eng. A 2008, 497, 333–340. [Google Scholar] [CrossRef]
  11. Suresh, S. Fatigue of Materials, 2nd ed.; Cambridge University Press: Cambridge, UK, 1998. [Google Scholar]
  12. Dimakos, K.; Mariotto, A.; Giakosa, F. Optimization of the fatigue resistance of nitinol stents through shot peening. Procedia Struct. Integr. 2016, 2, 1522–1529. [Google Scholar] [CrossRef]
  13. Kumar, S.A.; Sundar, R.; Raman, S.G.S.; Kumar, H.; Gnanamoorthy, R.; Kaul, R.; Ranganathan, K.; Oak, S.M.; Kukreja, L.M.; Bindra, K.S. Influence of laser peening on microstructure and fatigue lives of Ti-6Al-4V. Trans. Non-Ferr. Met. Soc. China 2014, 24, 3111–3117. [Google Scholar] [CrossRef]
  14. Yedla, P.; Rajulapati, K.V.; Reddy, G.V.P.; Sandhya, R.; Kiran, P.P.; Buddu, R.K.; Rao, K.B.S. Effect of laser shock peening on high cycle fatigue characteristics of 316 LN stainless steel. Int. J. Press. Vessel. Pip. 2019, 176, 103972. [Google Scholar] [CrossRef]
  15. Ding, K.; Ye, L. Laser Shock Peening: Performance and Process Simulation; Woodhead Publishing Limited: Boca Raton, FL, USA, 2006. [Google Scholar]
  16. Ye, C.; Suslov, S.; Fei, X.; Cheng, G.J. Bimodal nanocrystallization of NiTi shape memory alloy by laser shock peening and post-deformation annealing. Acta Mater. 2011, 59, 7219–7227. [Google Scholar] [CrossRef]
  17. Liao, Y.; Ye, C.; Lin, D.; Suslov, S.; Cheng, G.J. Deformation induced martensite in NiTi and its shape memory effects generated by low temperature laser shock peening. J. Appl. Phys. 2012, 112, 033515. [Google Scholar] [CrossRef]
  18. Wang, X.; Xia, W.; Wu, X.; Wei, Y.; Huang, C. Microstructure and mechanical properties of an austenite NiTi shape memory alloy treated with laser induced shock. Mater. Sci. Eng. A 2013, 578, 1–5. [Google Scholar] [CrossRef]
  19. Yan, K.; Wei, P.; Ren, F.; He, W.; Sun, Q. Enhance fatigue resistance of nanocrystalline NiTi by laser shock peening. Shape Mem. Superelasticity 2019, 5, 436–443. [Google Scholar] [CrossRef]
  20. Wang, H.; Kalchev, Y.; Wang, H.; Yan, K.; Gurevich, E.L.; Ostendorf, A. Surface modification of NiTi alloy by ultrashort pulsed laser shock peening. Surf. Coat. Tech. 2020, 394, 125899. [Google Scholar] [CrossRef]
  21. Shiva, S.; Palani, I.A.; Paul, C.P.; Bindra, K.S. Laser Shock Peening of Ni-Ti Bulk Structures Developed by Laser Additive Manufacturing. J. Mater. Eng. Perform. 2021, 30, 5603–5613. [Google Scholar] [CrossRef]
  22. Payne, A.P.; Clemens, B.M. Metastable copper-chromium alloy films. J. Mater. Res. 1992, 7, 1370–1376. [Google Scholar] [CrossRef]
  23. Liu, Y.; Kim, J.; Miyazaki, S. Thermodynamic analysis of ageing induced multiple stage transformation behavior of NiTi. Philos. Mag. 2004, 84, 2083–2102. [Google Scholar] [CrossRef]
  24. Świec, P.; Zubko, M.; Lekston, Z.; Stróż, D. NiTi Shape Memory Marformed Alloy Studied by Electron Beam Precession TEM Orientation Mapping Method. Acta Phys. Pol. A 2017, 131, 1307–1311. [Google Scholar] [CrossRef]
  25. Laplanche, G.; Birk, T.; Schneider, S.; Frenzel, J.; Eggeler, G. Effect of temperature and texture on the reorientation of martensite variants in NiTi shape memory alloys. Acta Mater. 2017, 127, 143–152. [Google Scholar] [CrossRef]
  26. Karthik, D.; Yazar, K.U.; Bisht, A.; Swaroop, S.; Srivastava, C.; Suwas, S. Gradient plastic strain accommodation and nanotwinning in multi-pass laser shock peened 321 steel. Appl. Surf. Sci. 2019, 487, 426–432. [Google Scholar] [CrossRef]
  27. Available online: https://matthey.com/en/products-and-services/medical-components/resource-library/nitinol-technical-properties (accessed on 20 May 2022).
  28. Fu, C.H.; Sealy, M.P.; Guo, Y.B.; Wei, X.T. Austenite-martensite phase transformation of biomedical Nitinol by ball burnishing. J. Mater. Proc. Tech. 2014, 214, 3122–3130. [Google Scholar] [CrossRef]
  29. Ni, W.; Cheng, Y.-T.; Grummon, D.S. Recovery of microindents in a nickel-titanium shape memory alloy: A self-heating effect. Appl. Phys. Lett. 2002, 80, 3310–3312. [Google Scholar] [CrossRef]
  30. Yella, P.; Venkateswarlu, P.; Buddu, R.K.; Vidyasagar, D.V.; Rao, K.B.S.; Kiran, P.P.; Rajulapati, K.V. Laser shock peening studies on SS316LN plate with various sacrificial layers. Appl. Surf. Sci. 2018, 435, 271–280. [Google Scholar] [CrossRef]
Figure 1. Optical micrograph of as-received Nitinol. The twinned nature of the microstructure is evident from the lamellar structure. This indicates the presence of the martensite phase. The average grain size of the material was found to be 38 ± 5 μm. About 100 grains were counted for determining the average grain size. A few dark particles (shown by white circles) were also observed in the microstructure. These were precipitates of Ni-Ti-C as verified through energy dispersive spectroscopy measurements on the scanning electron microscope.
Crystals 12 01319 g001
Figure 2. DSC thermograms of the as-received Nitinol during heating and cooling at 10 K/min. The exothermic transformation was happening in stages indicating the high amount of cold work.
Crystals 12 01319 g002
Figure 3. (a) XRD patterns of the as-received Nitinol and samples laser shock peened at 7 and 9 GW/cm2 taken from the surface region. (b) XRD patterns of the as-received Nitinol and samples laser shock peened at 7 and 9 GW/cm2 taken at a depth of 50 μm.
Crystals 12 01319 g003
Figure 4. Plot of the intensity ratio of the (110) X-ray peak of austenite and (111) X-ray peak of martensite phase for the as-received, 7 and 9 GW/cm2 samples. The intensity ratio was determined for X-ray experiments conducted on the surface and on samples taken 50 μm depth.
Crystals 12 01319 g004
Figure 5. (a) Microhardness of the as-received, 7 GW/cm2 peened and 9 GW/cm2 peened Nitinol samples at the surface and at a depth of 50 μm (b) Magnitude of the residual stress of the as-received, 7 GW/cm2 peened and 9 GW/cm2 peened Nitinol samples at the surface and a depth of 50 μm.
Crystals 12 01319 g005aCrystals 12 01319 g005b
Figure 6. (a) Selected area diffraction pattern of the as-received Nitinol with a continuous center ring. The rings surrounding the center ring were less continuous. (b) Bright field TEM micrograph of the as-received Nitinol showing a lamellar structure with high plastic deformation. The lamellar structure was not very clear on account of the high plastic deformation.
Crystals 12 01319 g006
Figure 7. (a) Selected area diffraction pattern of Nitinol peened at 7 GW/cm2; (b) bright field TEM micrograph of Nitinol peened at 7 GW/cm2 showing a lamellar structure with high resolution. Also evident in these lamellae was the high amount of stored plastic deformation.
Crystals 12 01319 g007
Figure 8. (a) Selected area diffraction pattern of Nitinol peened at 9 GW/cm2 showing fragmented and spotted rings. (b) Bright field TEM micrograph of Nitinol peened at 9 GW/cm2 showing a lamellar structure with primary and secondary lamellae. Also evident in these lamellae was the high amount of stored plastic deformation.
Crystals 12 01319 g008
Table 1. Summary of the laser peening parameters adopted for studying Nitinol. NM in the table stands for “not mentioned”.
S. #ParametersYe et al. [16]Liao et al. [17]Wang et al. [18]Yan et al. [19]Wang et al. [20]Shiva et al. [21]This Study
1Laser power density (GW/cm2)44, 8, 123.4 to 47.9500–900 μJ (eqv. to 14–25 GW/cm2)17, 9
3Pulse duration (ns)5510 ns2035 × 10−6910
4Spot diameter (mm)11.22.6 to 3240 × 10−320.8
5Repetition rate (Hz)NMNMNMNM5000110
6Radiance density (mW cm2Sr−1µm)NMNMNMNMNMNM345.04
7Overlapping (optimized) (%)75NA5056.5602090
8Ablation/Confinement layerNMAl foil/BK7 glassBlack paint/waterNMNone/NoneNone/WaterBlack paint/ Water
9Number of shotsmultipleNMmultiple3NMmultipleSingle
10Type of residual stressNMNMCompressiveCompressiveNMCompressiveTensile
Publisher’s Note: MDPI stays neutral with regard to jurisdictional claims in published maps and institutional affiliations.

