Article

Reaction-Time-Dependent Opto-Electrical Properties of Graphene Oxide

1
School of Electrical and Information Engineering, Tianjin University, 92 Weijin Road, Nankai District, Tianjin 300072, China
2
Department of Chemistry, College of Science, Princess Nourah bint Abdulrahman University, Riyadh 11671, Saudi Arabia
3
Faculty of Engineering, Universiti Malaysia Sarawak (UNIMAS), Kota Samarahan 94300, Sarawak, Malaysia
4
Department of Electrical & Electronic Engineering, Lee Kong Chian Faculty of Engineering & Science, Universiti Tunku Abdul Rahman, Bandar Sungai Long, Kajang 43000, Selangor, Malaysia
5
School of Engineering, Monash University, Bandar Sunway 47500, Malaysia
6
Chemistry Department, College of Science, Jouf University, Skaka P.O. Box 2014, Aljouf, Saudi Arabia
*
Authors to whom correspondence should be addressed.
Crystals 2022, 12(9), 1303; https://doi.org/10.3390/cryst12091303
Submission received: 11 August 2022 / Revised: 5 September 2022 / Accepted: 12 September 2022 / Published: 15 September 2022

Abstract

:
The reaction-time-dependent synthesis of graphene oxide (GO) was carried out using a modified Hummer’s method. The drop-casting method was used to coat GO films on a glass substrate. Various techniques, including scanning electron microscopy, X-ray diffraction, UV–Vis spectroscopy (UV–Vis), Fourier transform infrared spectroscopy, and current–voltage characteristics, were performed to obtain the morphological, structural, optical, and electrical properties of GO. Morphological structural observations revealed that more oxygen functional groups were present as the reaction time increased from 24 to 96 h, which was confirmed by the optical properties of GO thin films. The resistivity of the as-deposited films increased from 9.74 × 10⁶ to 26.85 × 10⁶ Ω·cm as the reaction time increased. The optimized reaction time with a resistivity of 12.13 × 10⁶ Ω·cm was 48 h, as demonstrated by morphological and optical data.

1. Introduction

In the field of biomedicine, various materials, such as ceramics, metal alloys, and polymers, have been used for tissue engineering [1]. Among the polymers, two types (synthetic and natural) are considered for the aforementioned applications [2]. Biomaterials are thought to interact with biosystems. Recently, the use of carbon-based nanomaterials in the bioindustry, electronics manufacturing industry [3], and as energy storage devices has grown owing to their exceptional service properties. Among the carbon-based nanomaterials, graphene-based materials can be used in display screens and other electronic circuits [4,5] owing to their high durability, flexibility, and light weight. These materials also have applications in supercapacitors and solar cells [6].
Graphene-based materials have biocompatible and chemical attributes, which make them a biomaterial [7]. Efforts have been made to find new molecules with superior bioactivity in biosystems, such as scaffolds [8]. Graphene-based materials, including their derivatives, have been widely used in the field of bioscience as effective nanomaterials. These materials exhibit comparable biocompatibility, superior stiffness, high flexibility, and excellent thermal attributes [9]. These materials have various applications in the medical and electronic industries. Graphene has a 2D honeycomb lattice structure with an arrangement of mono-layered sp2-bonded atoms. The use of graphene is considered cell-based tissue engineering owing to its physiochemical attributes and biocompatibility [10].
Among the hydrophilic derivatives, graphene oxide (GO) and reduced GO are prominent owing to their unique attributes. GO has a single monomolecular 2D structure of sp2- and sp3-bonded carbon atoms lined with epoxide, hydroxyl at the basal plane, and carboxyl group at the edges [11]. In various applications, GO is a notable development compared with graphene with oxygen fractions. The oxides and hydroxyls in GO differentiate into stem cells. The integration of GO and silica nanoparticles with human neural stem cells enhances bioactivity (induced pluripotent and embryonal stem cells) [12,13,14]. Despite their wide applicability and the considerable interest they have received, the production of superior-quality graphene materials using economically attractive and environmentally conscious processes remains challenging [15].
There are various methods for synthesizing graphene. CVD [16] is used to synthesize graphene films in the desired layers. However, the only complexity is in achieving hydrocarbon and pure hydrogen gas flows as the precursor and carrier gases, respectively. The process is carried out at 1000 °C, which limits the setup [11]. A mechanical method, which is complicated and limited to small-scale production, is the exfoliation of pristine graphene. Epitaxial growth is another potential method for synthesizing graphene without defects or superior attributes. The challenge lies in the assembly process, where film production is complex. Another well-known chemical process called the Brodie method is suitable for large-scale syntheses [17]. There are other chemical methods that are prominent but are limited because they are hazardous and toxic, including the Staudenmaier method [18] and Hummer’s method [19]. These methods produce C1O2 and NO2 during processing. There have been few improvements in the existing methods to modify outcomes based on their limitations. An improved and environmentally conscious method known as the Tour method synthesizes graphene on a large scale for various applications [20]. In this process, graphite powder is processed with H2SO4 and H3PO4 and requires a large quantity of KMnO4.
In this study, GO was synthesized with an economical and convenient process using KMnO4 with a 9:1 mixture of H2SO4 and H3PO4. This process was used to make the preparation of GO easier to obtain higher yields. Throughout the synthesis, GO was produced by the oxidization of graphite powder, which adds oxygenated functionalities. However, the thin film was produced through spin coating, spray pyrolysis, and/or drop casting on the work piece. The drop-casting method of depositing GO on a substrate is an effective process because of its simplicity and avoidance of wasting solution. There have been recent developments in producing thin-film GO using electron accepting in organic solar cells because of its structure [21], electrical attributes, and use in the drug-delivery field [22]. The properties of GO, such as the synthetic route, reaction time, temperature, and stirring speed, are highly influenced by process conditions [23]. Despite the amount of literature available for the synthesis of GO, synthesizing GO through cost-effective methods with improved electrical properties remains challenging. The aim of this study was to synthesize GO by cost-effective methods with improved electrical properties to enable its in solar cell applications. A comprehensive investigation was conducted on the reaction time parameters under the selected synthesis conditions. The morphological, electrical, and optical attributes of GO were analyzed in this study. The characterization of GO was carried out using scanning electron microscopy (SEM), UV–Vis spectroscopy (UV–Vis), current–voltage (IV) characteristics, and FTIR spectroscopy.

2. Materials and Methods

GO samples were synthesized by the oxidation of raw graphite flakes via an improved Hummer’s method [11,24,25]. First, a mixture of 90 mL of sulfuric acid (H2SO4) and 10 mL of phosphoric acid (H3PO4) was vigorously stirred. Then, graphite powder (0.75 g) was poured into the mixture, and 4.5 g of potassium permanganate (KMnO4) was slowly added. The production of dimanganese heptoxide (Mn2O7) indicated the oxidation of graphite upon the reaction between KMnO4 and H3PO4 [23]. The stirring duration of samples was 12 h (GO1), 24 h (GO2), 48 h (GO3), 72 h (GO4), or 96 h (GO5) under a reaction temperature of 50 °C. After a specific stirring duration, the color of the mixture changed from dark purplish green to light green, indicating the completion of the oxidation process. Once the stirring process was complete, the mixture was maintained at room temperature and poured into ice water (~200 mL). Next, 0.75 mL of hydrogen peroxide (H2O2) was slowly dropped into the solvent, and the color immediately changed to bright yellow, indicating the formation of GO. The washing process was carried out via simple decantation of the supernatant via centrifugation at 6000 rpm for 10 min. The suspension was repeatedly washed with diluted hydrochloric acid (HCl) and deionized (DI) water to form GO. The suspension was then dried at 60 °C for 2 h in an oven.
UV–Vis was used to detect the chemical functional groups and absorption of GO. UV–Vis absorption spectra were obtained in the range of 200–800 nm using a UV-1800 Shimadzu instrument (Kyoto, Japan). Fourier transform infrared (FTIR) spectra were recorded from 400 to 4000 cm−1 (with a resolution of 2 cm−1 and four averaged scans) using a Shimadzu IRAffinity-1 instrument. The Raman spectra of GO were generated using a Renishaw inVia microscope with a HeCd laser source (Wotton-under-Edge, UK). The phases of GO were investigated by X-ray diffraction (XRD) using a D8 Advance X-ray diffractometer (Bruker AXS, Billerica, MA, USA). The morphology and structure of GO were inspected using a tabletop TM3030 Hitachi instrument (Tokyo, Japan) and SEM. Finally, a Keithley source meter 2450 (Cleveland, OH, USA) was employed to analyze the IV electrical characteristics of GO.

3. Results and Discussion

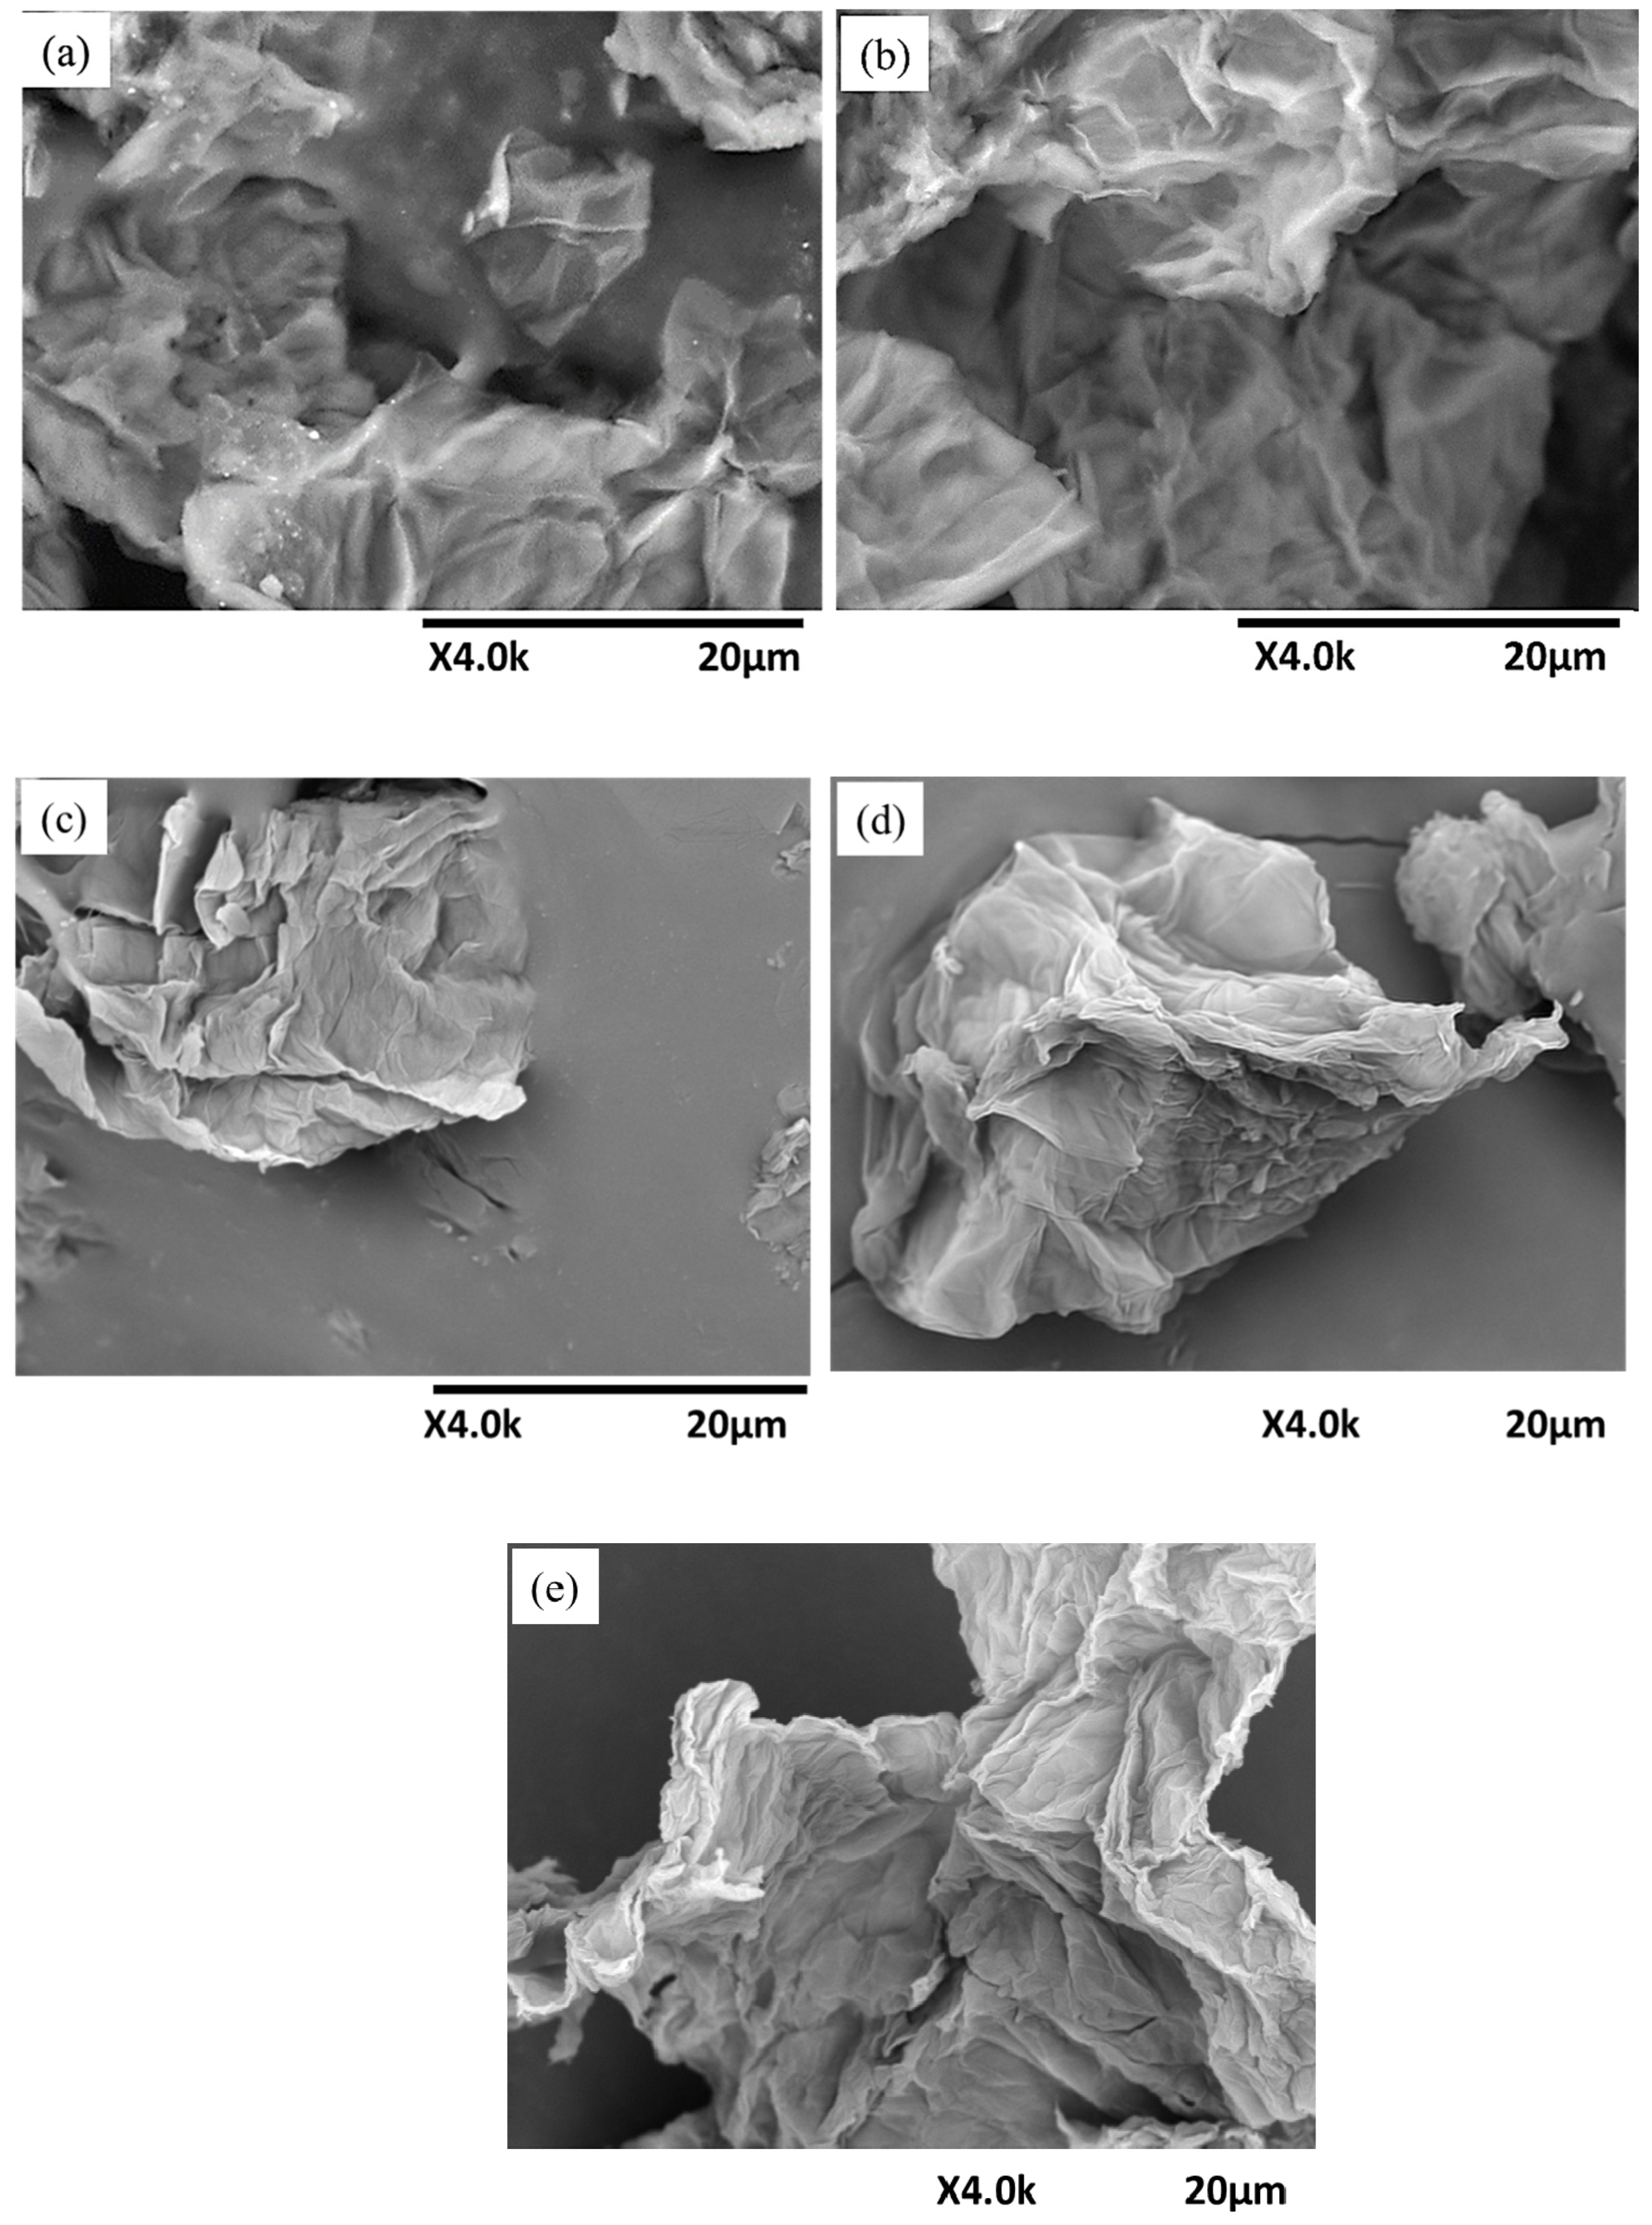
3.1. Morphological Properties

Surface morphology analysis was applied for quantifying the crystallinity and fractures of the synthesized GO for different reaction times. Figure 1 displays the morphology of the GO flakes after various reaction times ranging from 12 to 96 h. The appearance of the crumpled structure of GO1 with slight tissue paper is shown in Figure 1a, indicating that the graphite was not completely oxidized. The desired GO can be produced through the reaction of graphite powder with strong oxidizing agents based on the optimized reaction time [26,27]. Figure 1b shows the structure of GO2 that started to crumple, which indicated the start of graphite exfoliation. Figure 1c shows that GO3 had a fully crumpled structure, which indicated that the graphite was fully exfoliated. This was justified by the crumpled structure being a deformation resulting from the exfoliation and restacking processes [28]. A tissue-looking structural image is shown in Figure 1d,e, indicating that the graphite was fully exfoliated from graphite for GO4 and GO5. Thus, the morphology may be an essential characteristic of GO owing to its reaction time. In addition, comprehensive studies for further investigation of the synthesized GO with different reaction times are discussed in the following section, including the optical, structural, and electrical properties.

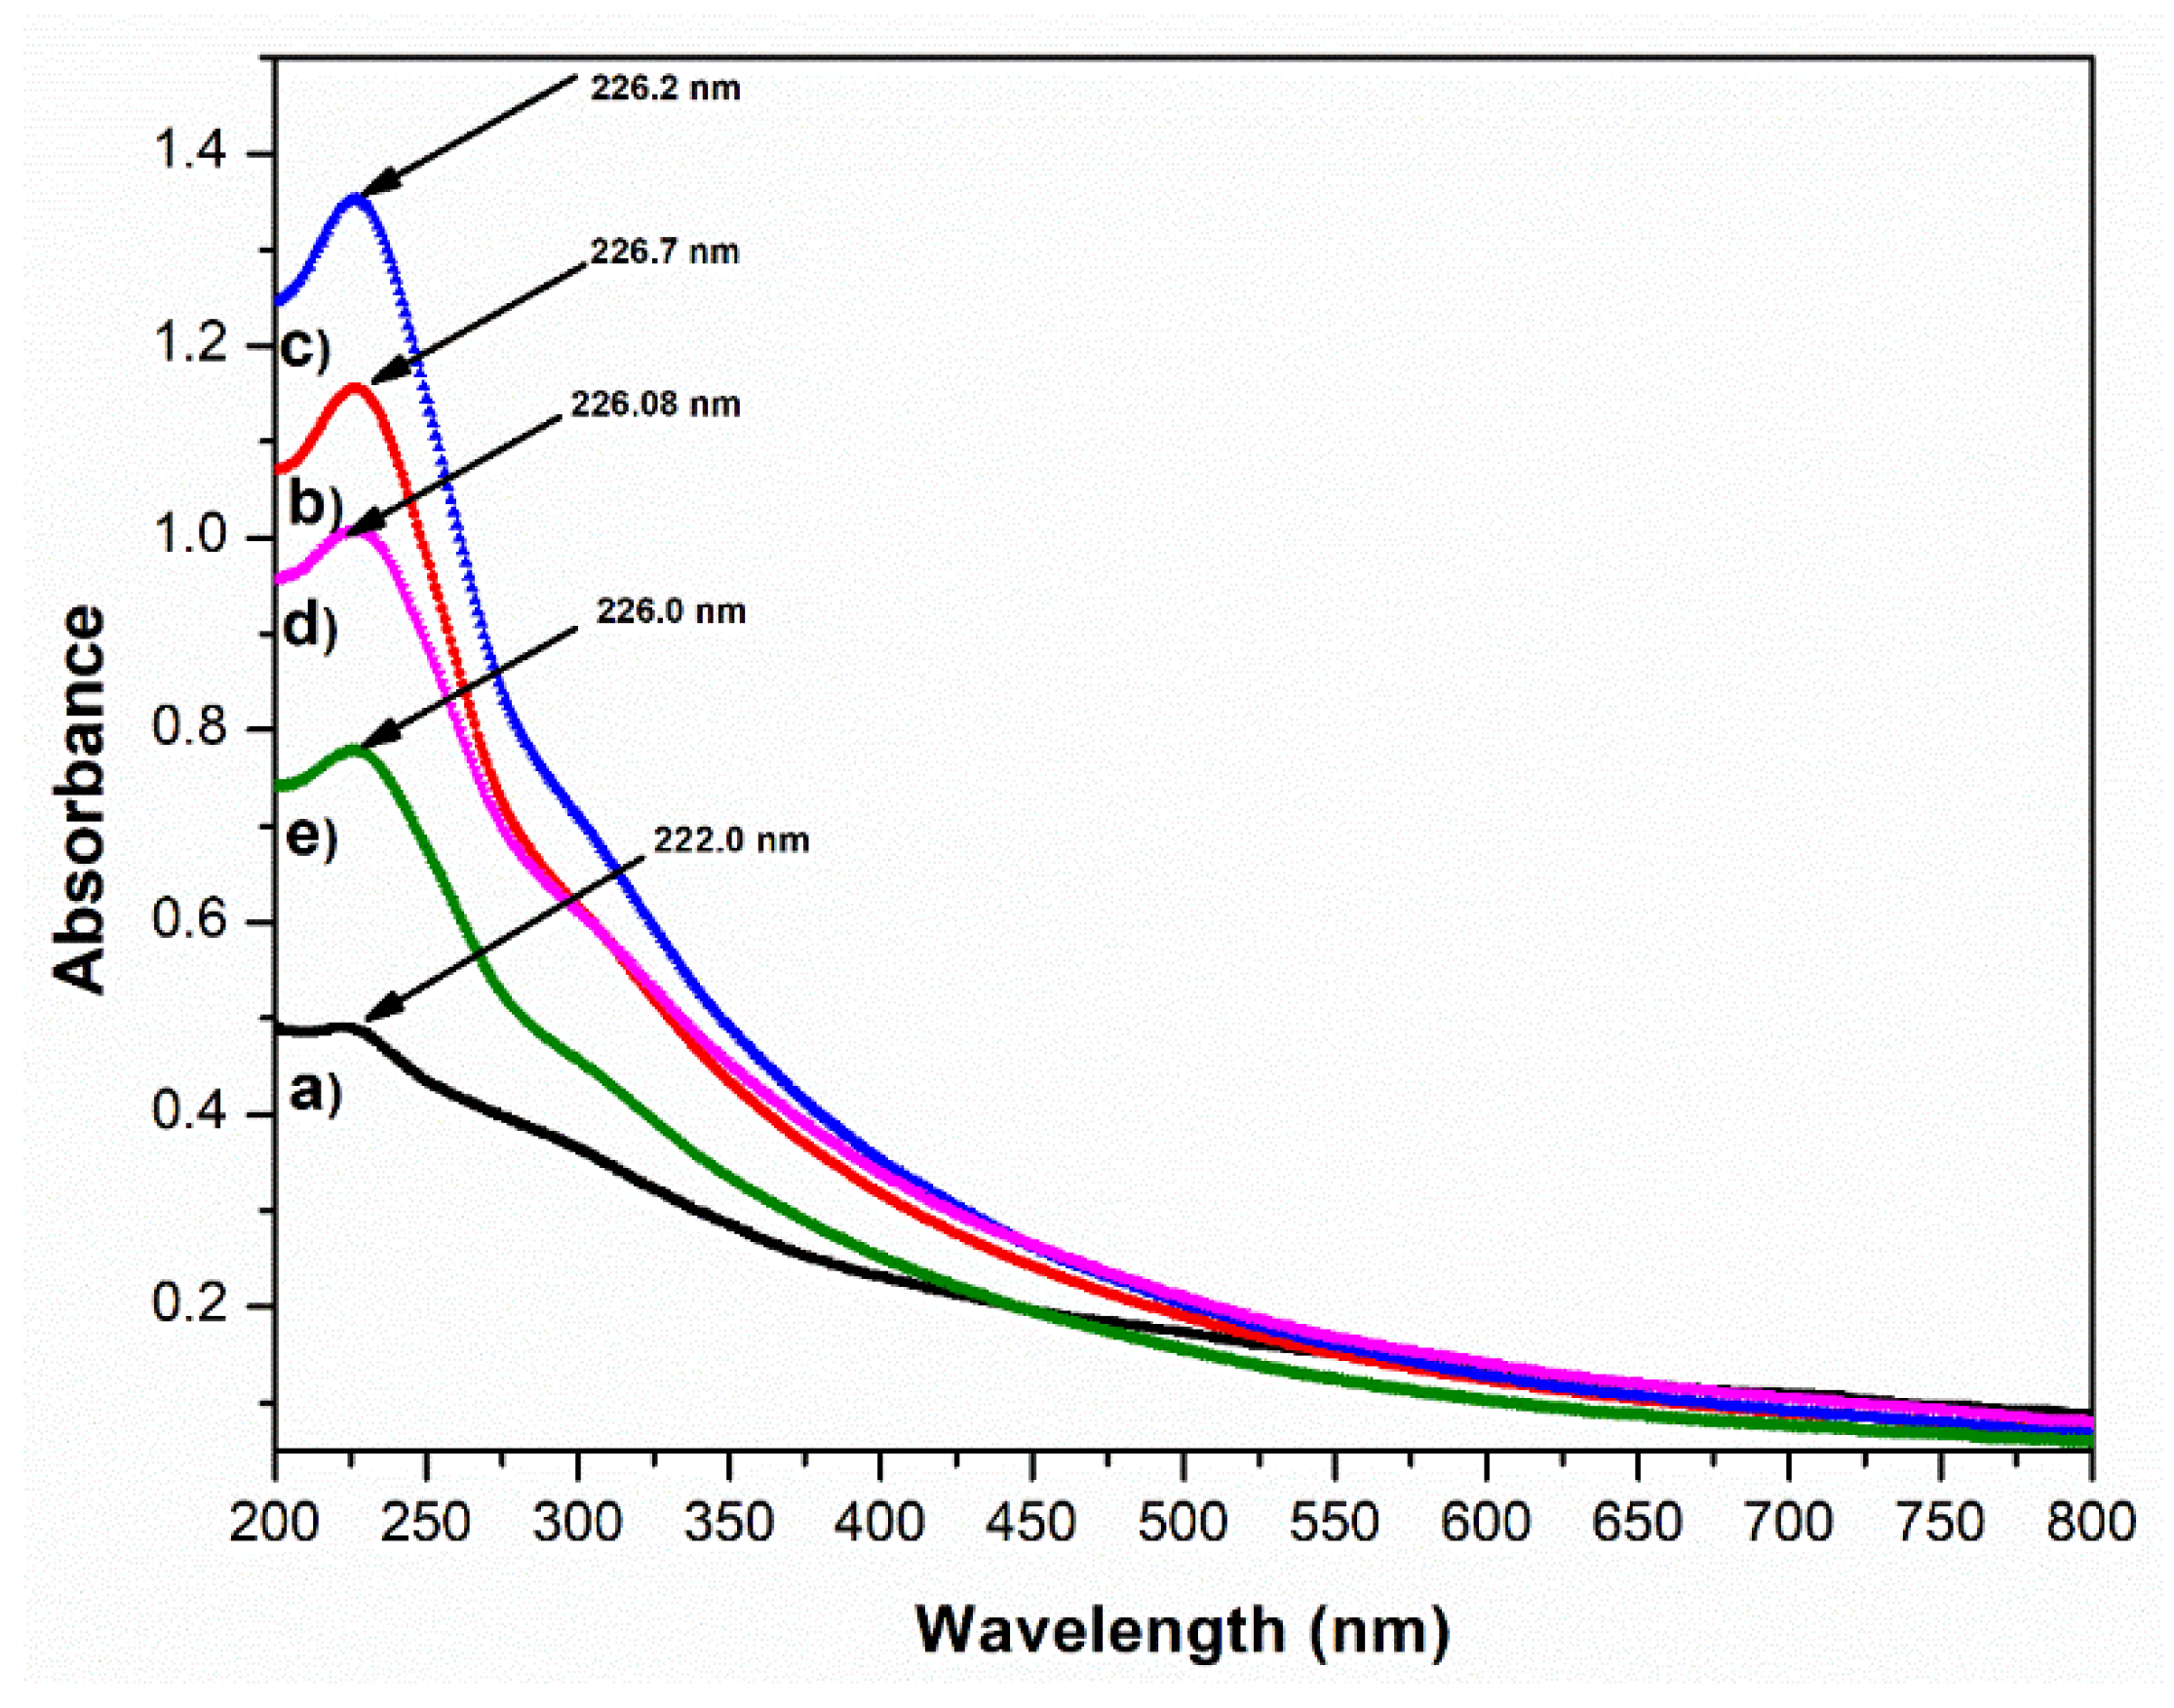
3.2. Optical Properties

The variation in the light absorbance measurement of the synthesized GO was determined, as shown in Figure 2. The figure shows the optical properties of the deposited GO thin films at different reaction times. The absorption peaks were found at 222.0, 226.7, 226.2, 226.08, and 226.0 nm for GO1, GO2, GO3, GO4, and GO5. These peaks correspond to the ππ* transition of the aromatic C=C ring, in agreement with [29].
A similar observation was also found at approximately 300 nm for all five samples, which we attributed to the n–π* transition of the carbonyl groups (C=O) [20]. Furthermore, the peak intensity of GO increased with the reaction time for GO1, GO2, and GO3. This suggested that an ideal time is required for higher oxidation during the synthesis process. However, the absorption peak intensity slightly decreased for the GO4 and GO5 samples. This could be attributed to over-oxidation, which corresponds to the findings of [30].
FTIR was carried out to investigate the presence of functional groups in the synthesized GO. The FTIR spectra of the prepared GO samples with different reaction times are shown in Figure 3. Figure 3a–e reveal a broad peak in the range between 2900 and 3600 cm−1 for GO. This was due to the carboxyl O–H stretching mode, which was superimposed on the –OH stretching of carboxylic acid due to the presence of absorbed water molecules and alcohol groups [31]. The peak located at 1640 cm−1 is shown in Figure 3a–e. It was associated with aromatic C=C bonds, which represent the presence of π bonds, as previously reported [32]. The successful oxidation of GO is confirmed in Figure 3 by the presence of carboxyl, carbonyl, and hydroxyl functional groups [33].
Raman spectroscopy provided facial structural information and quality characterization of the GO thin films, as shown in Figure 4. Figure 4a–e show that the intensity of the G band (~1580 cm−1) was relatively higher than that of the D band owing to the vibration of sp2 bond of carbon atoms [34]. As reported in a previous work [35], the G-band peak (1580 cm−1) refers to the symmetry of carbon atoms, whereas the D-band peak (1350 cm−1) corresponds to the induction disorder of carbon atoms due to lattice motion away from the center of the Brillouin zone. The occurrence of sp2 hybridized carbon was related to the intensities of the D and G bands (ID/IG) in the degree of symmetry or defects. The ID/IG ratios of GO1 to GO5 were 0.87, 0.86, 0.84, 0.85, and 0.85, respectively (Figure 4a–e). In addition, a higher ID/IG ratio indicates more disordered GO, whereas a lower ID/IG ratio indicates fewer defects and subsequently more organized GO [36]. By reviewing the obtained Raman patterns of the prepared samples, as shown in Figure 4, we confirmed that GO3 showed an improvement in the ID/IG ratio. The Raman shift is also shown in Figure 4, where small shifts in the G peak from GO2 to GO5 can be observed. The shifts ranged from 1585 to 1596 cm−1. This could be attributed to the decline in the GO particle layers or exfoliation of the particles [37]. Moreover, shorter reaction times not ideal for exfoliating graphite particles [35].

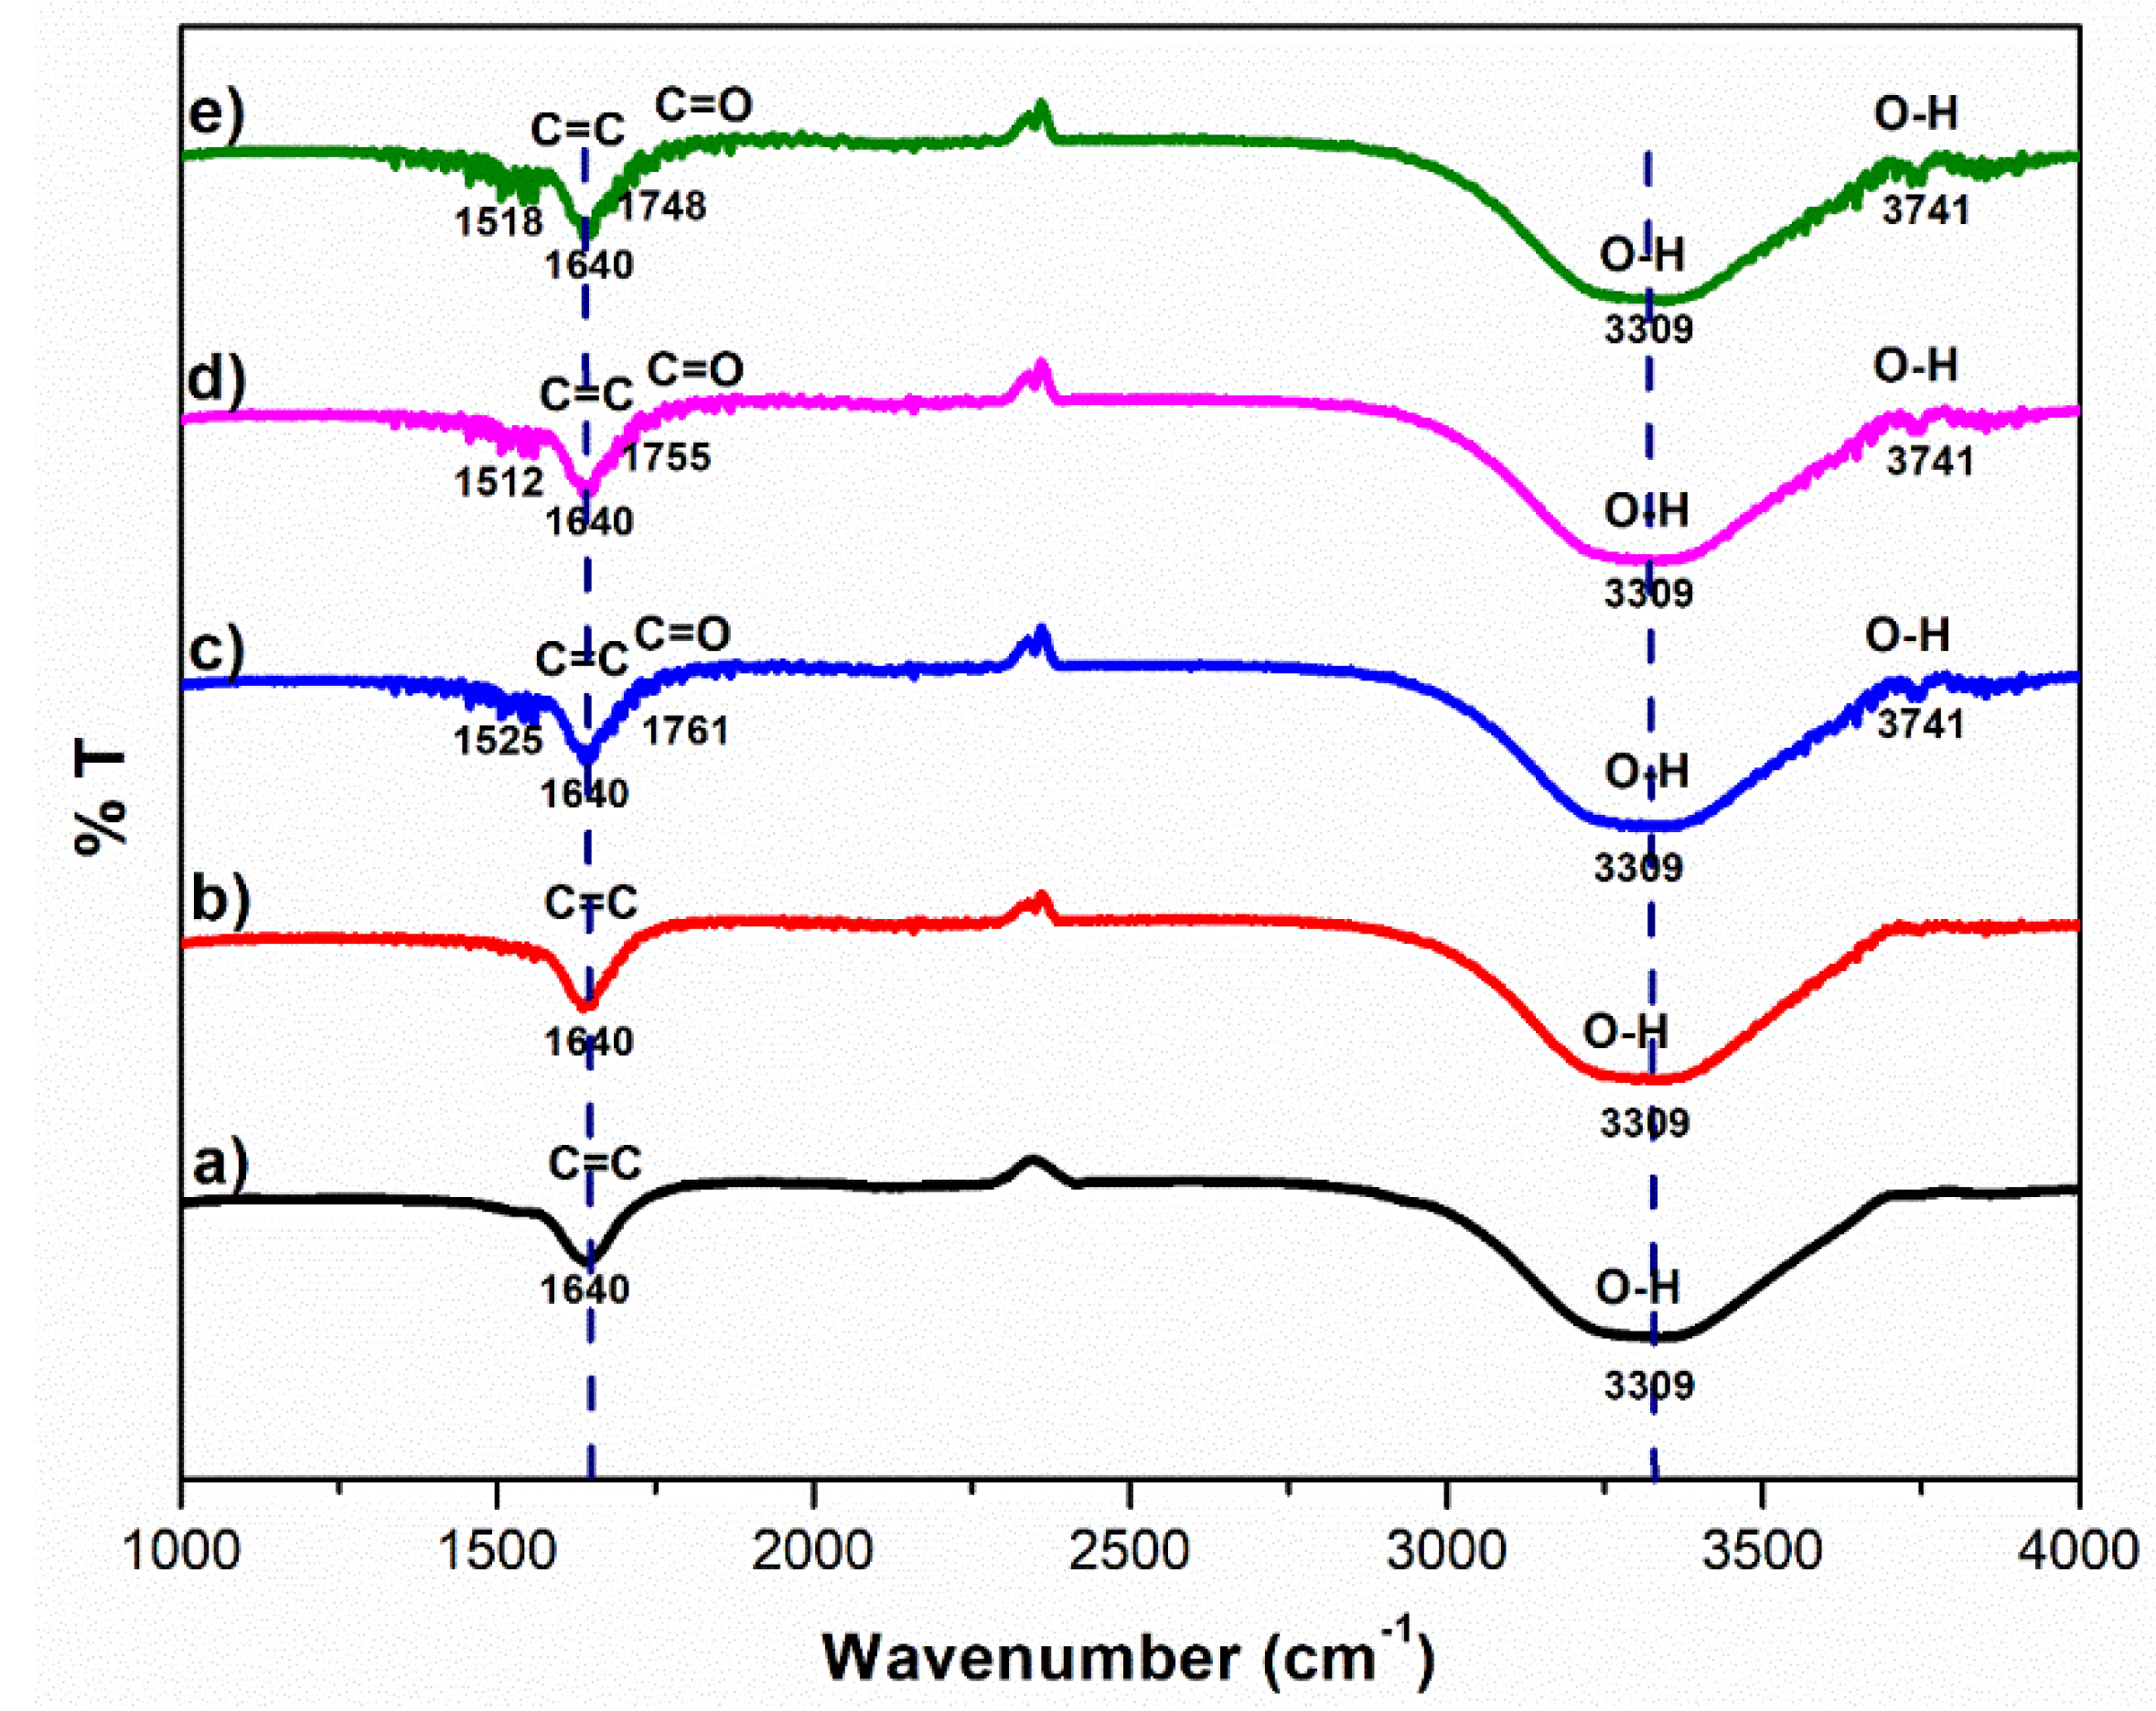
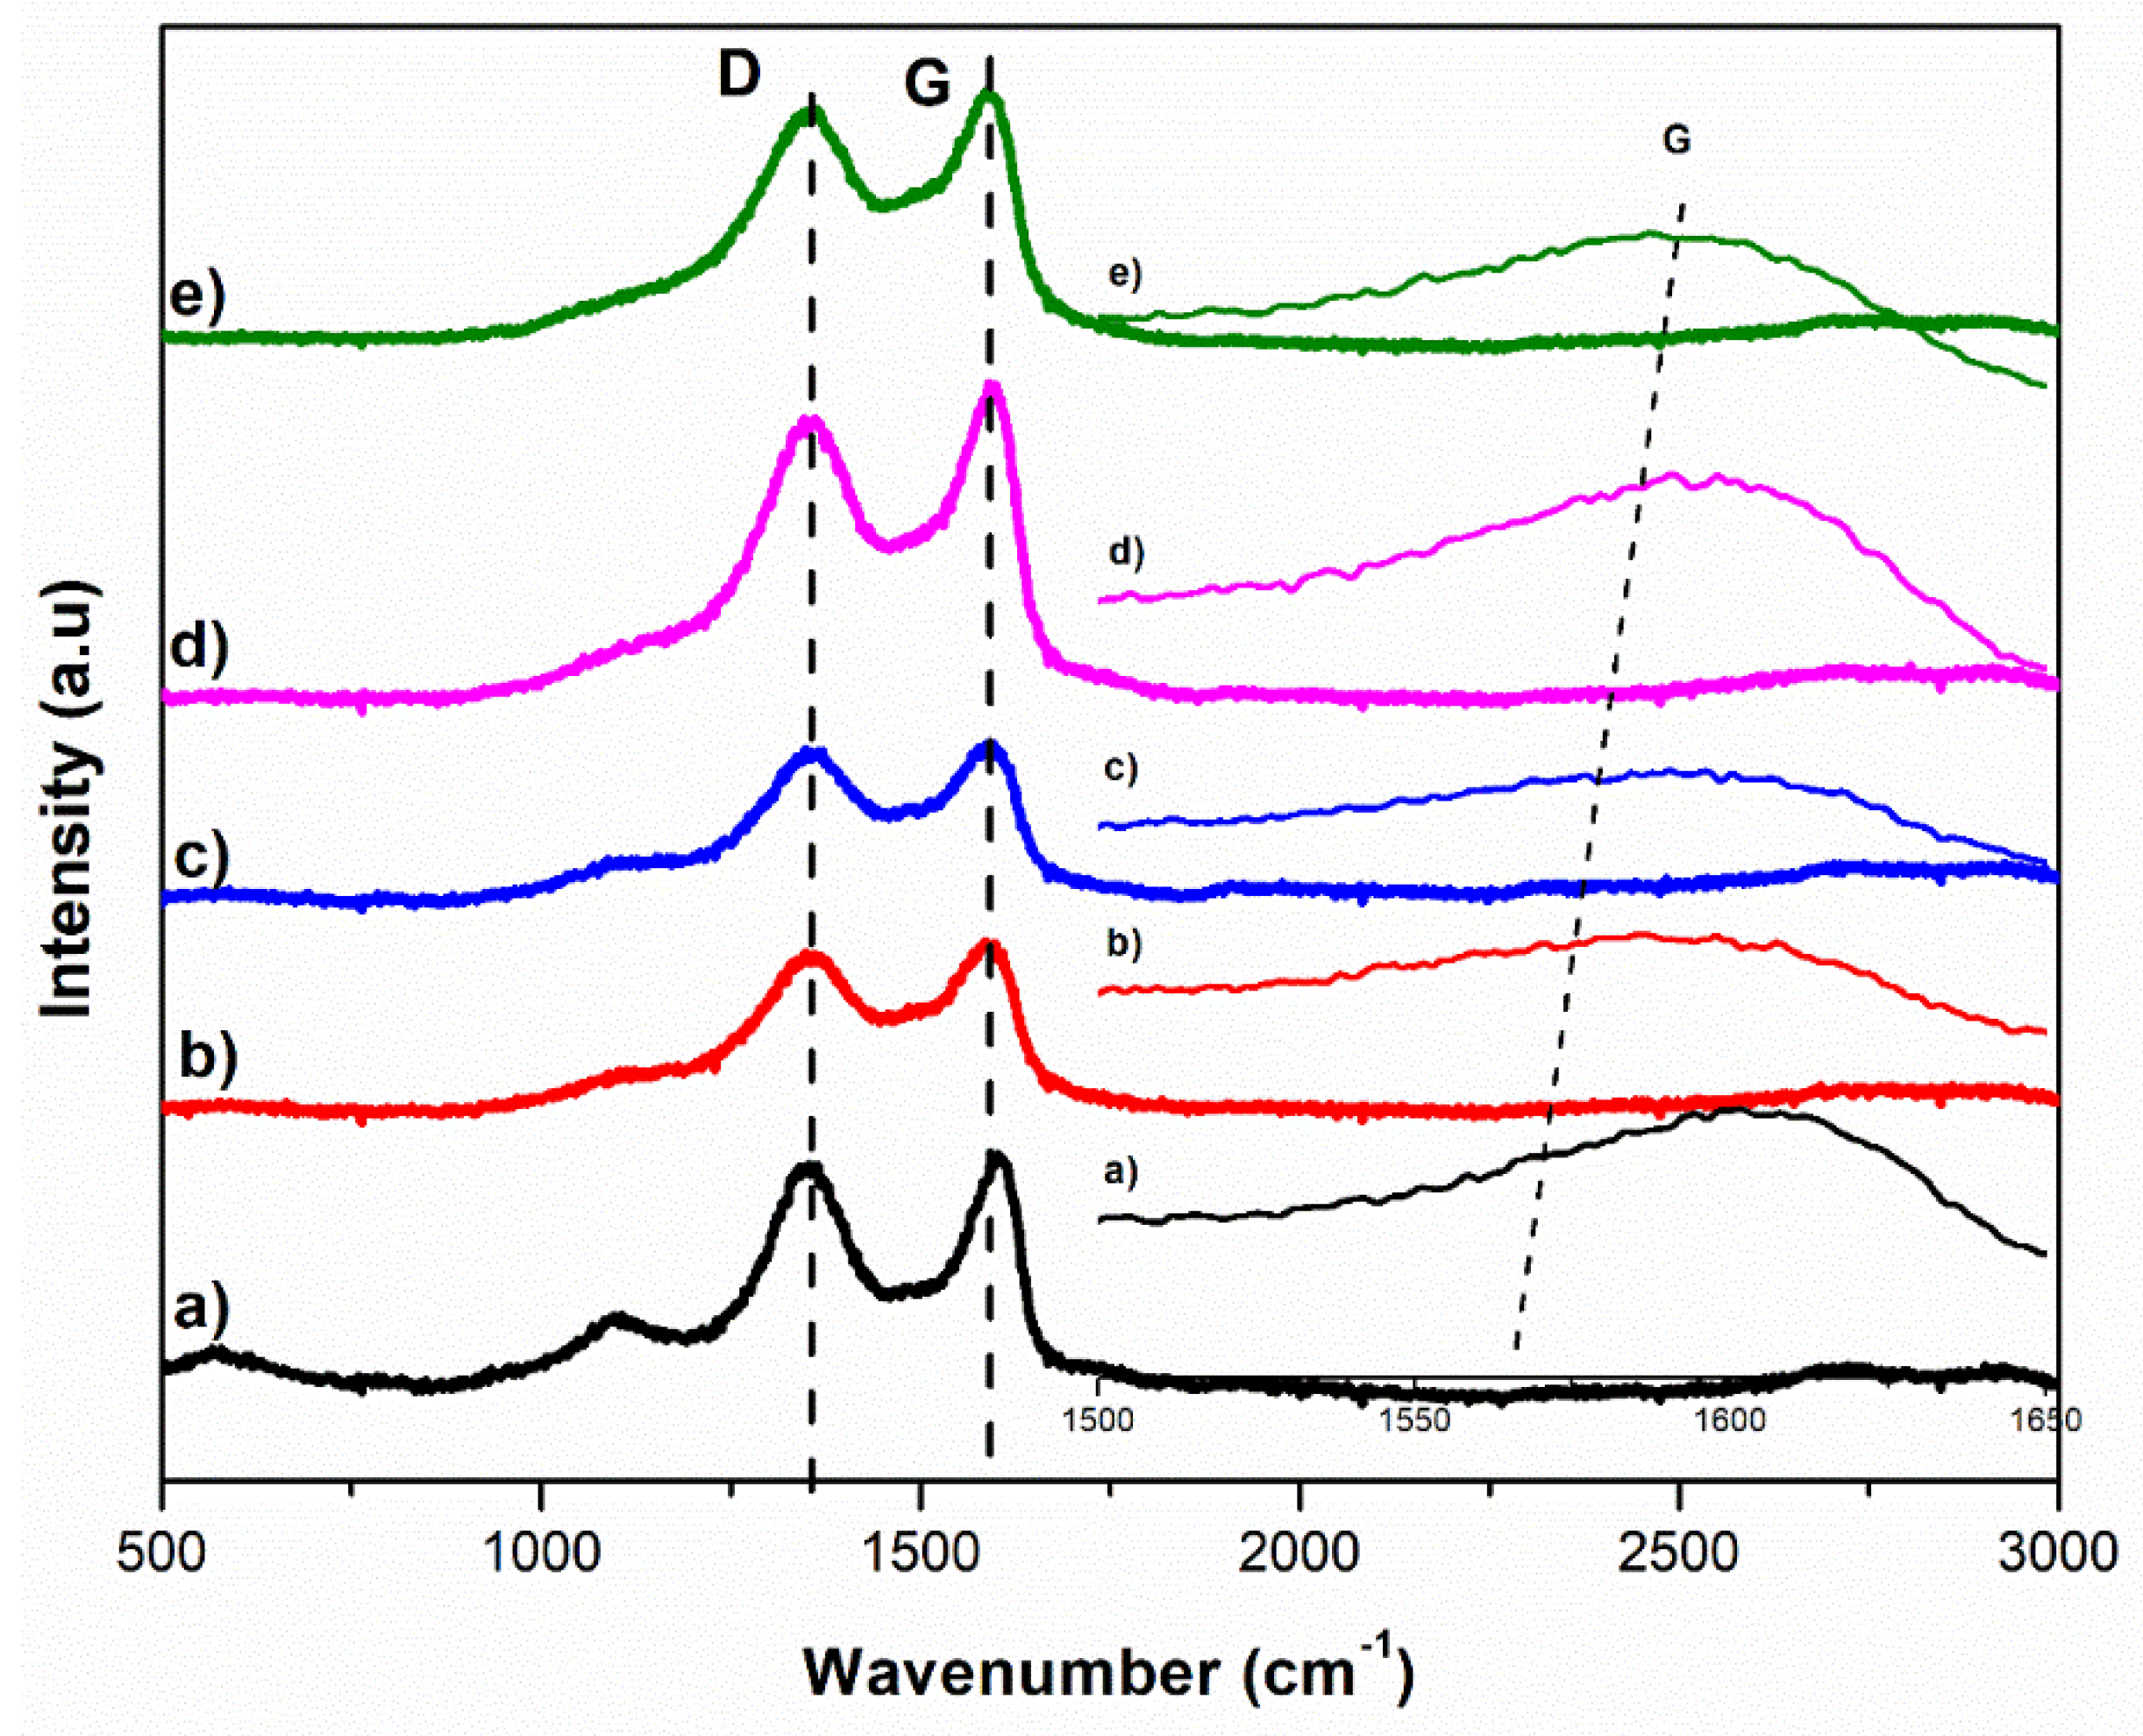
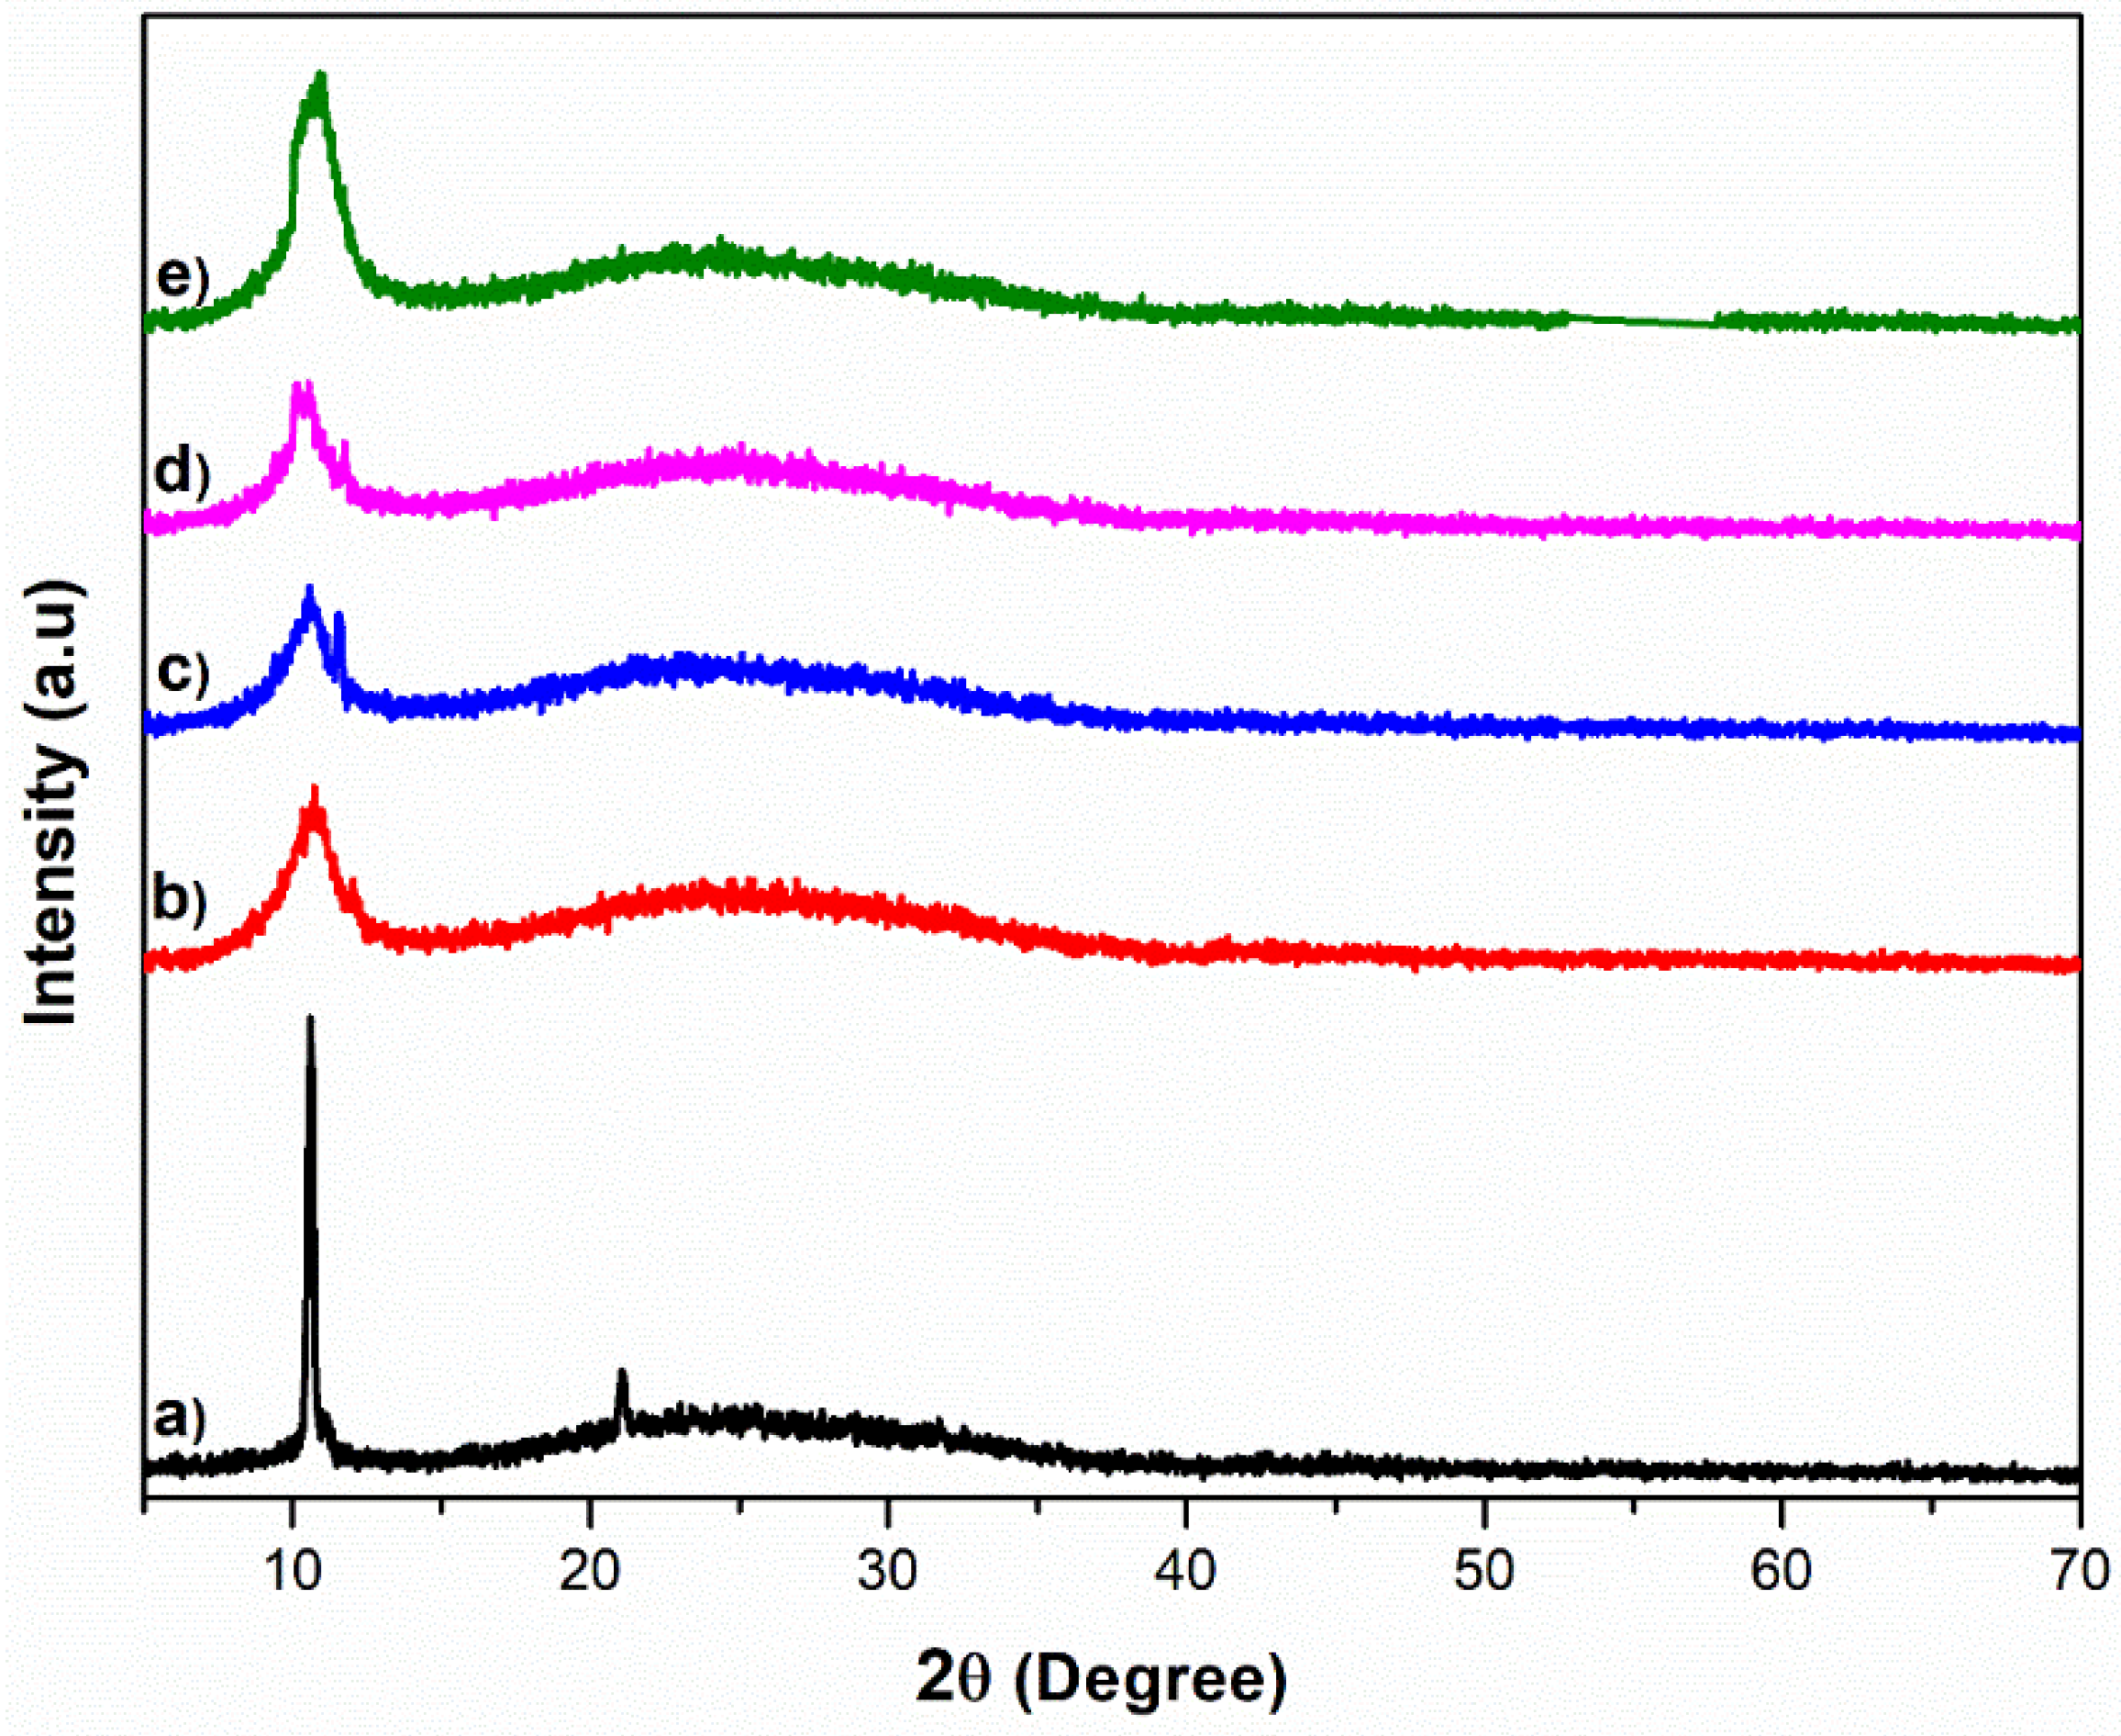
3.3. Structural Properties

XRD was used to quantify the geometry of GO at different reaction times, as shown in Figure 5. The characteristic peak of graphite was located at 2θ = 26.34 ° [35]. However, the diffraction peak of graphite could no longer be detected in GO because of the oxidation process of graphite. This can be seen in Figure 5. The XRD patterns in Figure 5a–e exhibit a strong and sharp peak at 10.56°, which indicates the formation of GO. The peak gradually moved to the left owing to the formation of oxygen-containing functional groups such as hydroxyl, epoxy, and carboxyl groups in the graphite layers, as discussed in the FTIR section [38]. The oxidation of graphite may break the π–π van der Waals bonds between the lamellae, leading to an increased basal space [33].

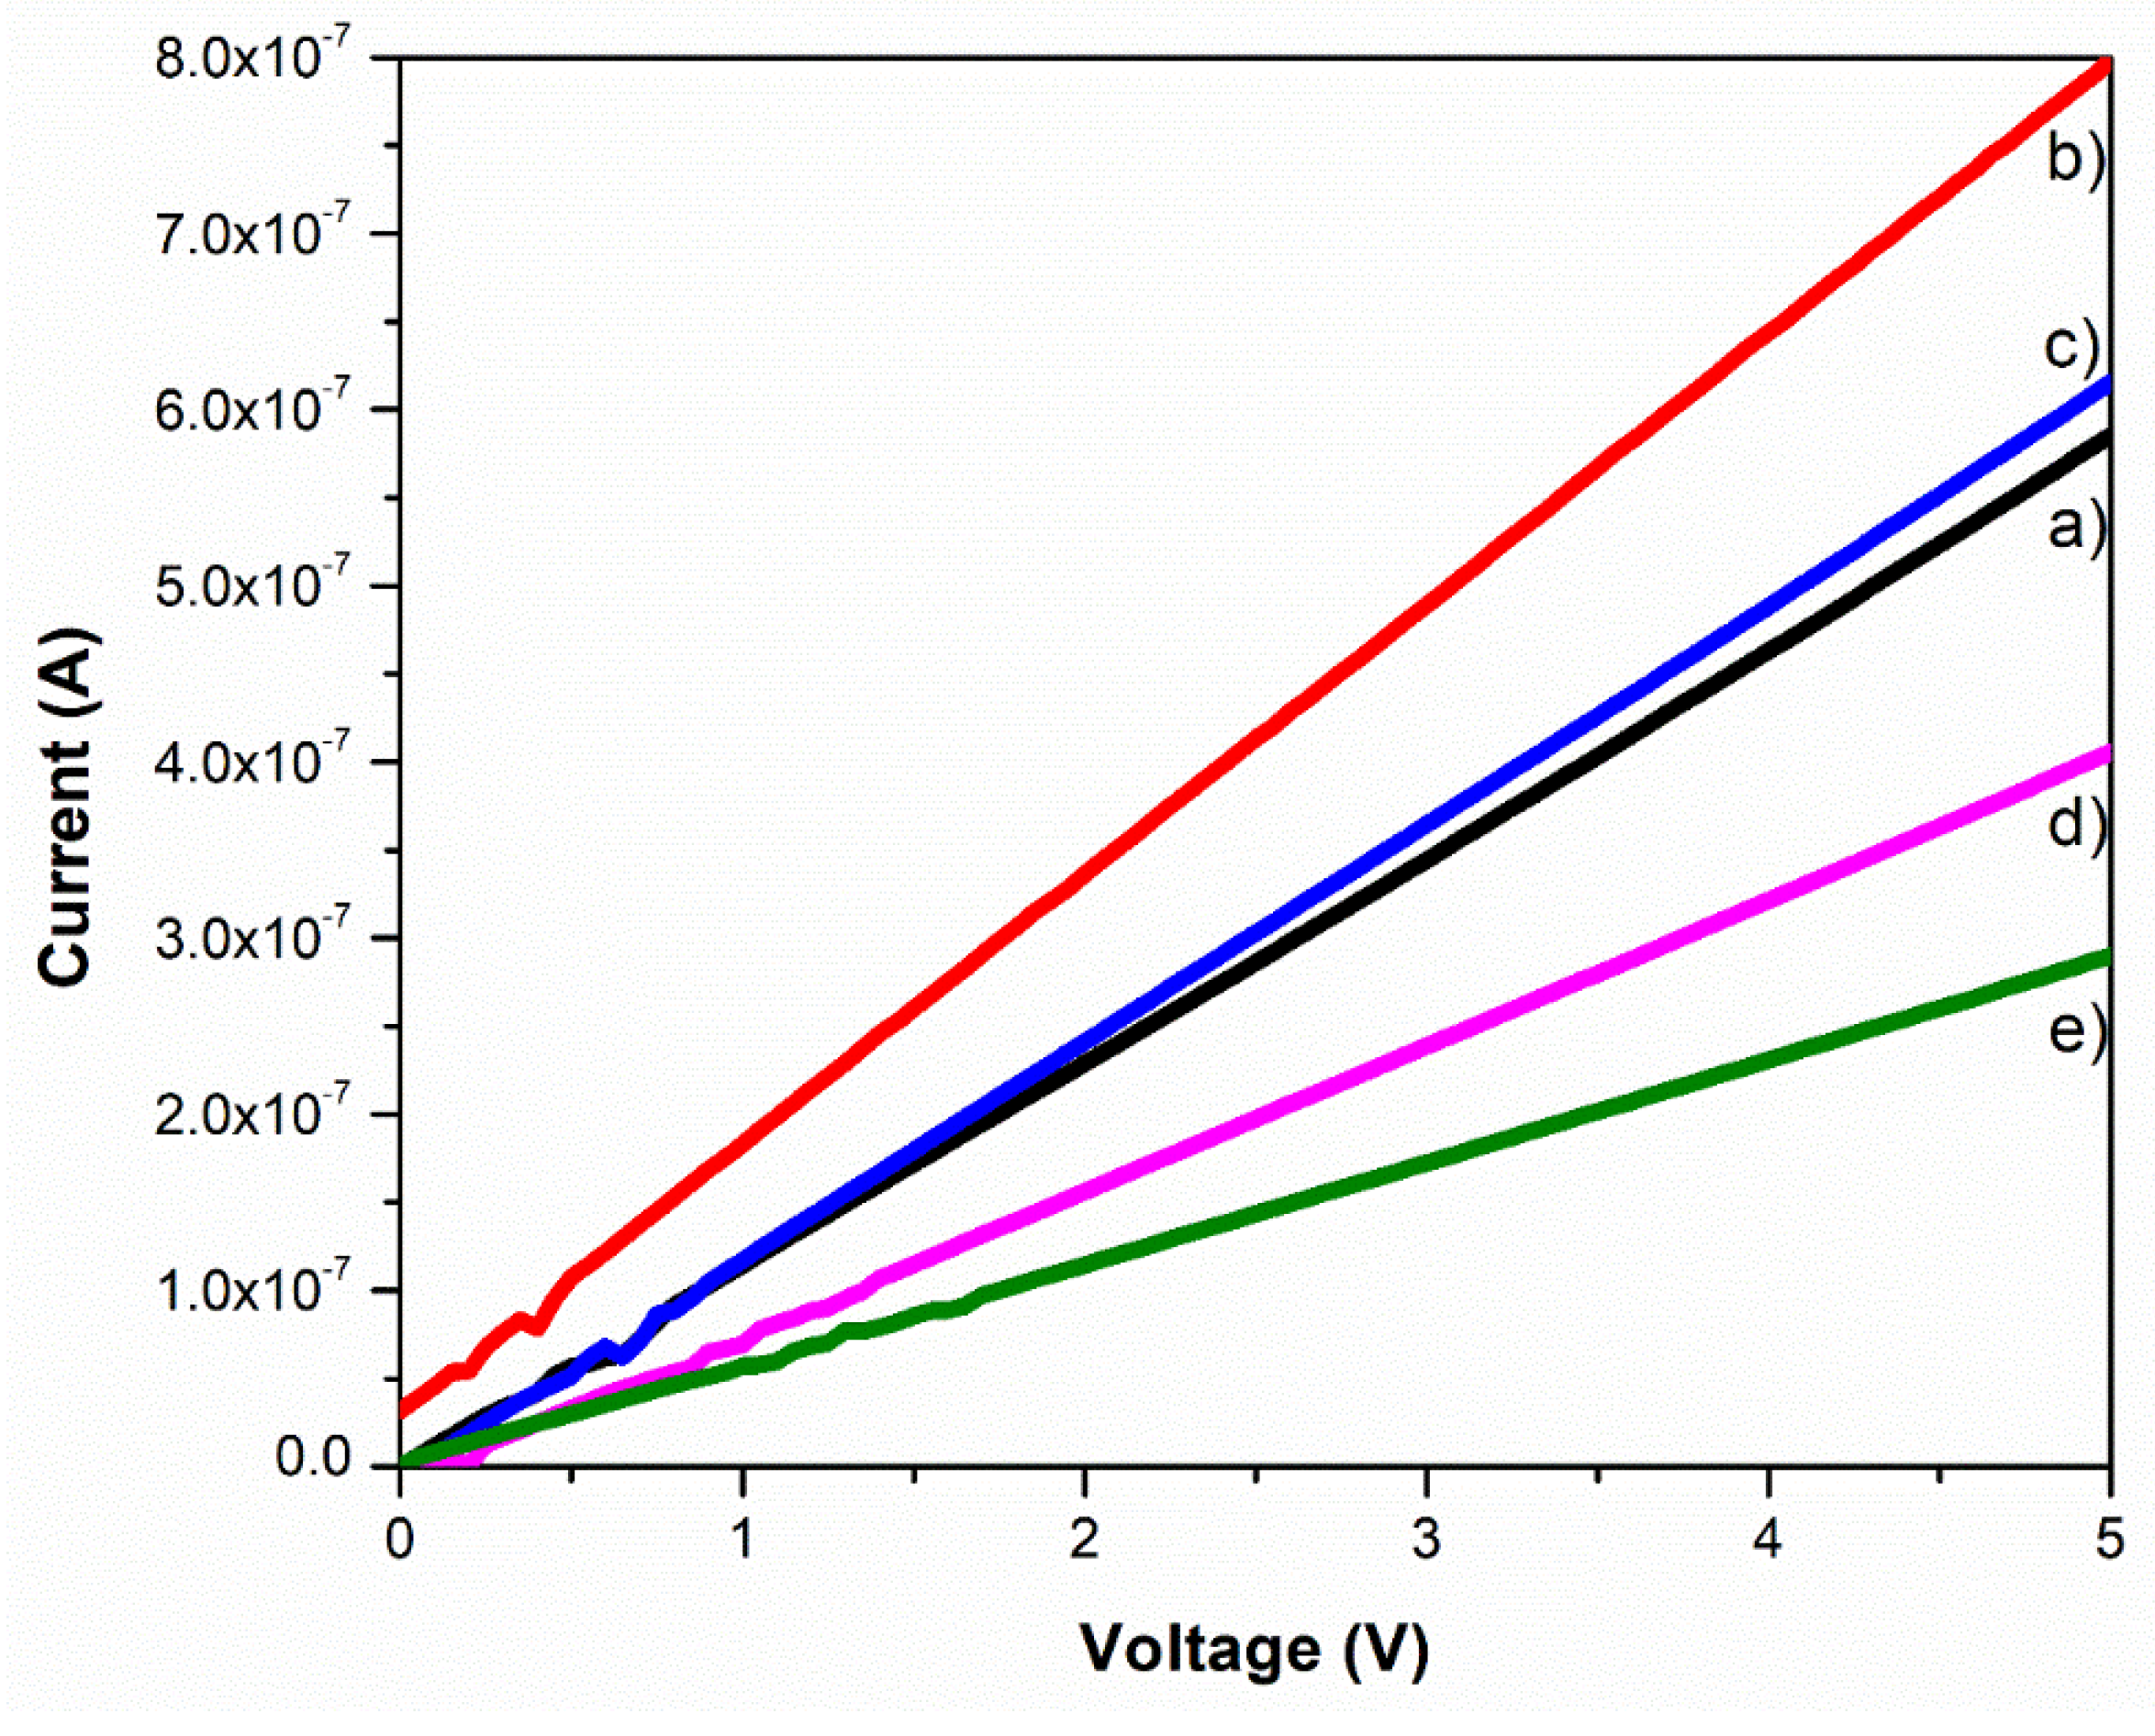
3.4. Electrical Properties

Figure 6 shows the electrical properties of the deposited GO thin films at various reaction times. There was a decrease in the current values for GO2 to GO5, from 7.98 × 10⁻⁷ to 2.90 × 10⁻⁷ A. The current value for GO1 was 5.85 × 10⁻⁷ A. According to the graph shown in Figure 6, the current value of GO1 was lower than that of GO3. This may have contributed to incomplete graphite exfoliation [33].
The decreasing pattern starting from GO2 to GO5 was due to the oxidation level, which depended on the reaction time of GO. The oxidation level of GO was affected by the reaction time, as shown in Figure 1. This reaction showed that over-oxidation was caused by a longer reaction time, in agreement with [15,39]. Table 1 shows that the resistivity of GO increased from GO2 to GO5. This was due to the presence of more oxygenated functional groups, which resulted in longer reaction times [11,40].
Table 1 was generated from Figure 6 using a typical I–V calculation. The overall conductivity increased as the reaction time increased. According to Table 1, the resistivity of GO1 was slightly higher than that of GO3, owing to incomplete oxidation during the synthesis of GO. This incomplete oxidation was caused by the reaction time required to exfoliate graphite to achieve GO. The inadequate time in GO1 led to failure to exfoliate the graphite; thus, its resistivity was also higher than that of GO2 and GO3. This work showed the improvement in electrical properties compared with those reported in the literature, and the value of resistance for GO was >1012 Ω [41].

4. Conclusions

GO thin films were successfully synthesized at different reaction times and deposited on a glass substrate using the drop-casting technique. Increasing the reaction time affected the properties of the GO thin films. The electrical data revealed that the resistivity was lower for longer reaction times. The results were optimized using UV–Vis and SEM, and the reaction time of 48 h resulted in the full oxidation of GO based on the appearance of a crumpled and wrinkled structure. Although the resistivity for the 48 h reaction time was higher than that for the 24 h reaction time, the results of UV–Vis and SEM characterization supported that the 48 h reaction time showed higher absorbance and full oxidation. In addition, GO formation was confirmed by FTIR spectroscopy.

Author Contributions

M.K., supervision, S.K.S, N.S.A. (Norah Salem Alsaiariand) and N.S.A. (Nayef S. Almuaikel), formal analysis and resources, E.J., conceptualization, methodology, curation, writing—original draft preparation, F.W.L., writing—review and editing, C.S.O., formal analysis. All authors have read and agreed to the published version of the manuscript.

Funding

The authors gratefully acknowledge financial support from the Ministry of Education Malaysia under the Fundamental Research Grant Scheme number (FRGS/SG06 (02)/1287/2015(04)), Princess Nourah bint Abdulrahman University Researchers Supporting Project Number (PNURSP2022R19), Princess Nourah bint Abdulrahman University, Riyadh, Saudi Arabia and Universiti Tunku Abdul Rahman, UTAR Research Fund (IPSR/RMC/UTARRF/2022-C1/L12).

Data Availability Statement

Data will be made available upon valid request.

Conflicts of Interest

The authors declare that they have no known competing financial interest or personal relationship that could have influenced the work reported in this paper.

References

  1. Willerth, S.M.; Sakiyama-Elbert, S.E. Combining stem cells and biomaterial scaffolds for constructing tissues and cell delivery. StemJournal 2019, 1, 1–25. [Google Scholar] [CrossRef]
  2. O’brien, F.J. Biomaterials & scaffolds for tissue engineering. Mater. Today 2011, 14, 88–95. [Google Scholar]
  3. Jiang, X.; Setodoi, S.; Fukumoto, S.; Imae, I.; Komaguchi, K.; Yano, J.; Mizota, H.; Harima, Y. An easy one-step electrosynthesis of graphene/polyaniline composites and electrochemical capacitor. Carbon 2014, 67, 662–672. [Google Scholar] [CrossRef]
  4. Zhu, Y.; Murali, S.; Cai, W.; Li, X.; Suk, J.W.; Potts, J.R.; Ruoff, R.S. Graphene and graphene oxide: Synthesis, properties, and applications. Adv. Mater. 2010, 22, 3906–3924. [Google Scholar] [CrossRef]
  5. Das, P.; Ganguly, S.; Banerjee, S.; Das, N.C. Graphene based emergent nanolights: A short review on the synthesis, properties and application. Res. Chem. Intermed. 2019, 45, 3823–3853. [Google Scholar] [CrossRef]
  6. Orsu, P.; Koyyada, A. Recent progresses and challenges in graphene based nano materials for advanced therapeutical applications: A comprehensive review. Mater. Today Commun. 2020, 22, 100823. [Google Scholar] [CrossRef]
  7. Stankovich, S.; Dikin, D.A.; Dommet, G.H.B.; Kohlhaas, K.M.; Zimney, E.J.; Stach, E.A.; Piner, R.D.; Nguyen, S.T.; Ruoff, R.S. Graphene-based composite materials. Nature 2006, 442, 282–286. [Google Scholar] [CrossRef]
  8. Shin, S.R.; Li, Y.-C.; Jang, H.L.; Khoshakhlagh, P.; Akbari, M.; Nasajpour, A.; Zhang, Y.S.; Tamayol, A.; Khademhosseini, A. Graphene-based materials for tissue engineering. Adv. Drug Deliv. Rev. 2016, 105, 255–274. [Google Scholar] [CrossRef]
  9. Menaa, F.; Abdelghani, A.; Menaa, B. Graphene nanomaterials as biocompatible and conductive scaffolds for stem cells: Impact for tissue engineering and regenerative medicine. J. Tissue Eng. Regen. Med. 2015, 9, 1321–1338. [Google Scholar] [CrossRef]
  10. Eluyemi, M.; Eleruja, M.A.; Adedeji, A.V.; Olofinjana, B.; Fasakin, O.; Akinwunmi, O.O.; Ilori, O.O.; Famojuro, A.T.; Ayinde, S.A.; Ajayi, E.O.B. Synthesis and characterization of graphene oxide and reduced graphene oxide thin films deposited by spray pyrolysis method. Graphene 2016, 5, 143–154. [Google Scholar] [CrossRef]
  11. Jaafar, E.; Kashif, M.; Sahari, S.K.; Ngaini, Z. Study of morphological, optical and electrical properties of graphene oxide thin film relative to the reaction time of synthesis. J. Telecommun. Electron. Comput. Eng. 2018, 10, 25–28. [Google Scholar]
  12. Solanki, A.; Cheung, S.-T.D.; Yin, P.T.; Kappera, R.; Chhowalla, M.; Lee, K.-B. Axonal alignment and enhanced neuronal differentiation of neural stem cells on graphene-nanoparticle hybrid structures. Adv. Mater. 2013, 25, 5477–5482. [Google Scholar] [CrossRef] [Green Version]
  13. Lee, W.C.; Loh, K.P.; Lim, C.T. When stem cells meet graphene: Opportunities and challenges in regenerative medicine. Biomaterials 2018, 155, 236–250. [Google Scholar]
  14. Ganguly, S.; Kanovsky, N.; Das, P.; Gedanken, A.; Margel, S. Photopolymerized Thin Coating of Polypyrrole/Graphene Nanofiber/Iron Oxide onto Nonpolar Plastic for Flexible Electromagnetic Radiation Shielding, Strain Sensing, and Non-Contact Heating Applications. Adv. Mater. Interfaces 2021, 8, 2101255. [Google Scholar] [CrossRef]
  15. Emiru, T.F.; Ayele, D.W. Controlled synthesis, characterization and reduction of graphene oxide: A convenient method for large scale production. Egypt. J. Basic Appl. Sci. 2017, 4, 74–79. [Google Scholar] [CrossRef]
  16. Kim, K.S.; Zhao, Y.; Jang, H.; Lee, S.Y.; Kim, J.M.; Kim, K.S.; Ahn, J.-H.; Kim, P.; Choi, J.-Y.; Hong, B.H. Large-scale pattern growth of graphene films for stretchable transparent electrodes. Nature 2009, 457, 706–710. [Google Scholar] [CrossRef] [PubMed]
  17. Brodie, B.C. XIII. On the atomic weight of graphite. Philos. Trans. R. Soc. Lond. 1859, 149, 249–259. [Google Scholar]
  18. Staudenmaier, L. Verfahren zur darstellung der graphitsäure. Ber. Dtsch. Chem. Ges. 1898, 31, 1481–1487. [Google Scholar] [CrossRef]
  19. Hummers, W.S., Jr.; Offeman, R.E. Preparation of graphitic oxide. J. Am. Chem. Soc. 1958, 80, 1339. [Google Scholar] [CrossRef]
  20. Marcano, D.C.; Kosynkin, D.V.; Berlin, J.M.; Sinitskii, A.; Sun, Z.; Slesarev, A.; Alemany, L.B.; Lu, W.; Tour, J.M. Improved synthesis of graphene oxide. ACS Nano 2010, 4, 4806–4814. [Google Scholar] [CrossRef]
  21. Dai, B.; Fu, L.; Liao, L.; Liu, N.; Yan, K.; Chen, Y.; Liu, Z. High-quality single-layer graphene via reparative reduction of graphene oxide. Nano Res. 2011, 4, 434–439. [Google Scholar] [CrossRef]
  22. Sun, X.; Liu, Z.; Welsher, K.; Robinson, J.T.; Goodwin, A.; Zaric, S.; Dai, H. Nano-graphene oxide for cellular imaging and drug delivery. Nano Res. 2008, 1, 203–212. [Google Scholar] [CrossRef] [PubMed]
  23. Shamaila, S.; Sajjad, A.K.L.; Iqbal, A. Modifications in development of graphene oxide synthetic routes. Chem. Eng. J. 2016, 294, 458–477. [Google Scholar] [CrossRef]
  24. Low, F.W.; Lai, C.W.; Hamid, S.B.A. Easy preparation of ultrathin reduced graphene oxide sheets at a high stirring speed. Ceram. Int. 2015, 41, 5798–5806. [Google Scholar] [CrossRef]
  25. Low, F.W.; Lai, C.W.; Hamid, S.B.A. One-step hydrothermal synthesis of titanium dioxide decorated on reduced graphene oxide for dye-sensitised solar cells application. Int. J. Nanotechnol. 2018, 15, 78–92. [Google Scholar] [CrossRef]
  26. Compton, O.C.; Cranford, S.W.; Putz, K.W.; An, Z.; Brinson, C.; Buehler, M.J.; Nguyen, S.T. Tuning the Mechanical Properties of Graphene Oxide Paper and Its Associated Polymer Nanocomposites by Controlling Cooperative Intersheet Hydrogen Bonding. ACS Nano 2012, 6, 2008–2019. [Google Scholar] [CrossRef]
  27. Jaafar, E.; Kashif, M.; Sahari, S.K.; Ngaini, Z. Effects of reduction temperatures on morphological, optical, and electrical properties of reduced graphene oxide (rGO) thin films. Mater. Today Proc. 2019, 16, 1702–1707. [Google Scholar] [CrossRef]
  28. Alazmi, A.; Rasul, S.; Patole, S.P.; Costa, P.M.F.J. Comparative study of synthesis and reduction methods for graphene oxide. Polyhedron 2016, 116, 153–161. [Google Scholar] [CrossRef]
  29. Mei, Q.; Zhang, K.; Guan, G.; Liu, B.; Wang, S.; Zhang, Z. Highly efficient photoluminescent graphene oxide with tunable surface properties. Chem. Commun. 2010, 46, 7319–7321. [Google Scholar] [CrossRef]
  30. Peng, S.; Fan, X.; Li, S.; Zhang, J. Green synthesis and characterization of graphite oxide by orthogonal experiment. J. Chil. Chem. Soc. 2013, 58, 2213–2217. [Google Scholar] [CrossRef]
  31. Shahriary, L.; Athawale, A.A. Graphene oxide synthesized by using modified hummers approach. Int. J. Renew. Energy Environ. Eng. 2014, 2, 58–63. [Google Scholar]
  32. Ali, A.; Jamil, M.; Khan, Z.S.; Ahmed, S.; Habib, A.; Ahmad, N. A study of inter-step stirring effects on the thickness and yield of graphene oxide prepared through an improved Hummers method. In Proceedings of the 2015 Power Generation System and Renewable Energy Technologies (PGSRET), Islamabad, Pakistan, 10–11 June 2015. [Google Scholar]
  33. Krishnamoorthy, K.; Veerapandian, M.; Yun, K.; Kim, S.-J. The chemical and structural analysis of graphene oxide with different degrees of oxidation. Carbon 2013, 53, 38–49. [Google Scholar] [CrossRef]
  34. Lin, Y.-C.; Cao, Y.; Jang, J.-H.; Shu, C.-M.; Webb, C.; Pan, W.-P. The synthesis and characterization of graphene oxides based on a modified approach. J. Therm. Anal. Calorim. 2014, 116, 1249–1255. [Google Scholar] [CrossRef]
  35. Hu, Y.; Song, S.; Lopez-Valdivieso, A. Effects of oxidation on the defect of reduced graphene oxides in graphene preparation. J. Colloid Interface Sci. 2015, 450, 68–73. [Google Scholar]
  36. Paredes, J.I.; Villar-Rodil, S.; Martínez-Alonso, A.; Tascón, J.M.D. Graphene Oxide Dispersions in Organic Solvents. Langmuir 2008, 24, 10560–10564. [Google Scholar] [CrossRef] [PubMed]
  37. Saito, R.; Hoffman, M.; Dresselhaus, G.; Jorio, A.; Dresselhaus, M.S. Raman spectroscopy of graphene and carbon nanotubes. Adv. Phys. 2011, 60, 413–550. [Google Scholar] [CrossRef]
  38. Tong, X.; Wang, H.; Wang, G.; Wan, L.; Ren, Z.; Bai, J.; Bai, J. Controllable synthesis of graphene sheets with different numbers of layers and effect of the number of graphene layers on the specific capacity of anode material in lithium-ion batteries. J. Solid State Chem. 2011, 184, 982–989. [Google Scholar] [CrossRef]
  39. Jung, I.; Dikin, D.; Park, S.; Cai, W.; Mielke, S.L.; Ruoff, R.S. Effect of water vapor on electrical properties of individual reduced graphene oxide sheets. J. Phys. Chem. C 2008, 112, 20264–20268. [Google Scholar] [CrossRef]
  40. Domingues, S.H.; Kholmanov, I.N.; Kim, T.; Kim, J.; Tan, C.; Chou, H.; Alieva, Z.A.; Piner, R.; Zarbin, A.J.G.; Ruoff, R.S. Reduction of graphene oxide films on Al foil for hybrid transparent conductive film applications. Carbon 2013, 63, 454–459. [Google Scholar] [CrossRef]
  41. Zhang, L.; Cole, J.M.; Waddell, P.G.; Low, K.S.; Liu, X. Relating Electron Donor and Carboxylic Acid Anchoring Substitution Effects in Azo Dyes to Dye-Sensitized Solar Cell Performance. ACS Sustain. Chem. Eng. 2013, 1, 1440–1452. [Google Scholar]
Figure 1. SEM images of synthesized GO at different reaction times: (a) GO1, (b) GO2, (c) GO3, (d) GO4, and (e) GO5.
Crystals 12 01303 g001
Figure 2. UV–Vis of GO at different reaction times: (a) GO1, (b) GO2, (c) GO3, (d) GO4, and (e) GO5.
Crystals 12 01303 g002
Figure 3. FTIR of GO at different reaction times: (a) GO1, (b) GO2, (c) GO3, (d) GO4, and (e) GO5.
Crystals 12 01303 g003
Figure 4. Raman spectra and Raman shift of GO at different reaction times: (a) GO1, (b) GO2, (c) GO3, (d) GO4, and (e) GO5.
Crystals 12 01303 g004
Figure 5. XRD pattern of GO at different reaction times: (a) GO1, (b) GO2, (c) GO3, (d) GO4, and (e) GO5.
Crystals 12 01303 g005
Figure 6. IV characteristics of GO at different reaction times: (a) GO1, (b) GO2, (c) GO3, (d) GO4, and (e) GO5.
Crystals 12 01303 g006
Table 1. Effect of reaction time on the electrical properties of GO.
LabelResistance
(Ω)
Resistivity
(Ω·cm)
Conductivity
(S/cm)
GO18.55 × 10612.81 × 1067.80 × 10−8
GO26.49 × 1069.74 × 1061.027 × 10−7
GO38.097 × 10612.13 × 1068.23 × 10−8
GO412.048 × 10618.06 × 1065.536 × 10−8
GO517.24 × 10626.85 × 1063.868 × 10−8
Publisher’s Note: MDPI stays neutral with regard to jurisdictional claims in published maps and institutional affiliations.

