1. Introduction
Plastic strain-induced damage is one of the main failure modes in engineering components. Generally, the assessment of plastic damage in components is of great significance for the safety and reliability of engineering structures. The more accurate the diagnosis of component damage, the better the chances that treatment will work [
1]. Nevertheless, accurately knowing the degree of material damage is not often that simple. Most of the time, the assessment methods based on hardness analysis, elongation surveying, or cavity quantification, are not precise, and seem increasingly inadequate for the higher demands of engineering protection.
The misorientation parameters measuring method based on the Electron backscatter diffraction (EBSD) technique has seen rapid development in recent years [
2,
3]. Since EBSD has excellent spatial resolution levels (~50 nm) and comes complete with sophisticated post-processing algorithms, it has become possible to make unprecedented measurements of the local lattice orientation at a sub-micron level. To date, some researchers have suggested that there is a close correlation between the lattice misorientation parameters and the plastic strain of a material. For instance, Kamaya et al. [
4] showed that after a 14.4% plastic deformation, the local change in the crystal orientation was significant inside the grains of 304 austenitic steel; Wang et al. [
5] indicated that with the increase in plastic strain, the Kernel average misorientation (KAM) obviously increased in mild ferrite/pearlite steel; Allain-Bonasso et al. [
6] illustrated that, in a ferritic single-phase interstitial-free (IF) steel, the misorientation parameters such as Grain Orientation Spread (GOS) and KAM strongly increased after tensile deformation tests. However, the above research results were based on ex situ EBSD measurements (i.e., EBSD mapping was not made on the same sample). Therefore, they failed to investigate the misorientation parameter variation in grains for the same piece of material during plastic deformation.
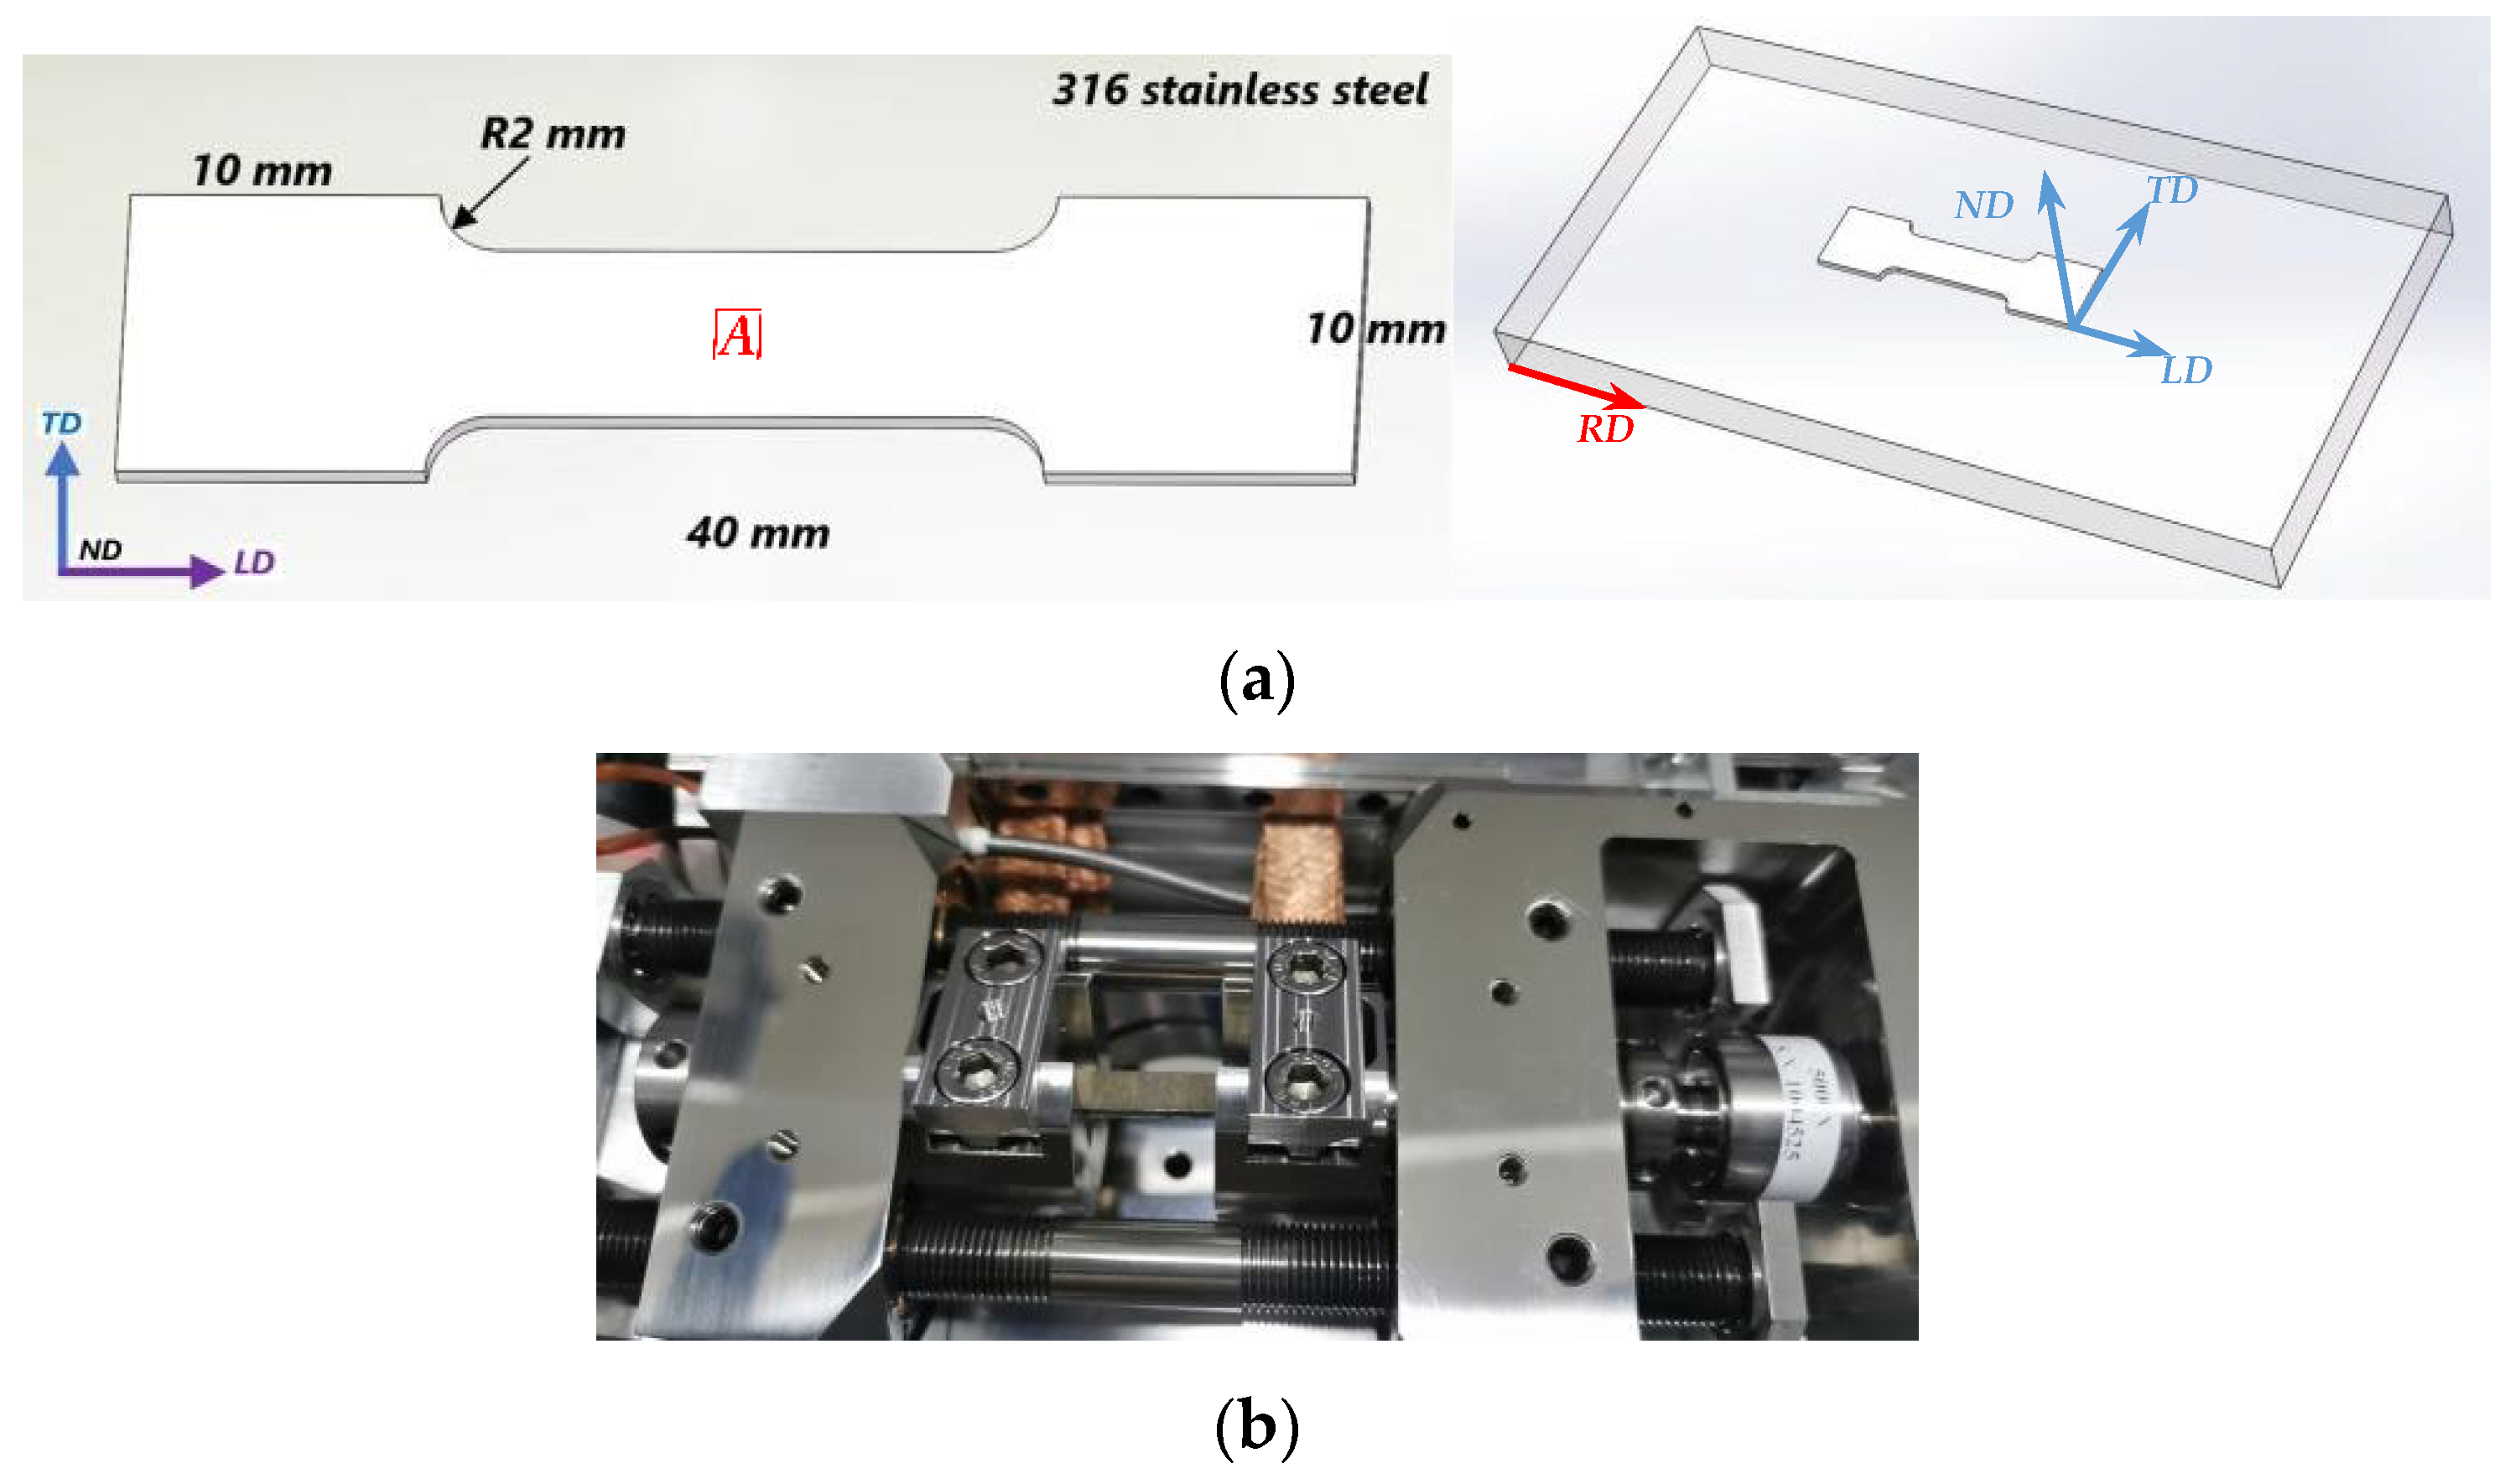
In this research, the in situ EBSD technique was utilized to overcome the limitations mentioned above. A miniature tensile stage was inserted into the specimen chamber of the SEM, so that the observation area of the sample was locked down, and the significant information could be extracted from the same area. Furthermore, a widely used austenitic steel, i.e., 316 stainless steel, was used here as the research object. It is hoped that the study can provide valuable insights into plastic damage assessment through the use of the misorientation parameters method.
3. Results and Discussion
The EBSD results of 316 steel at different plastic stages are shown in
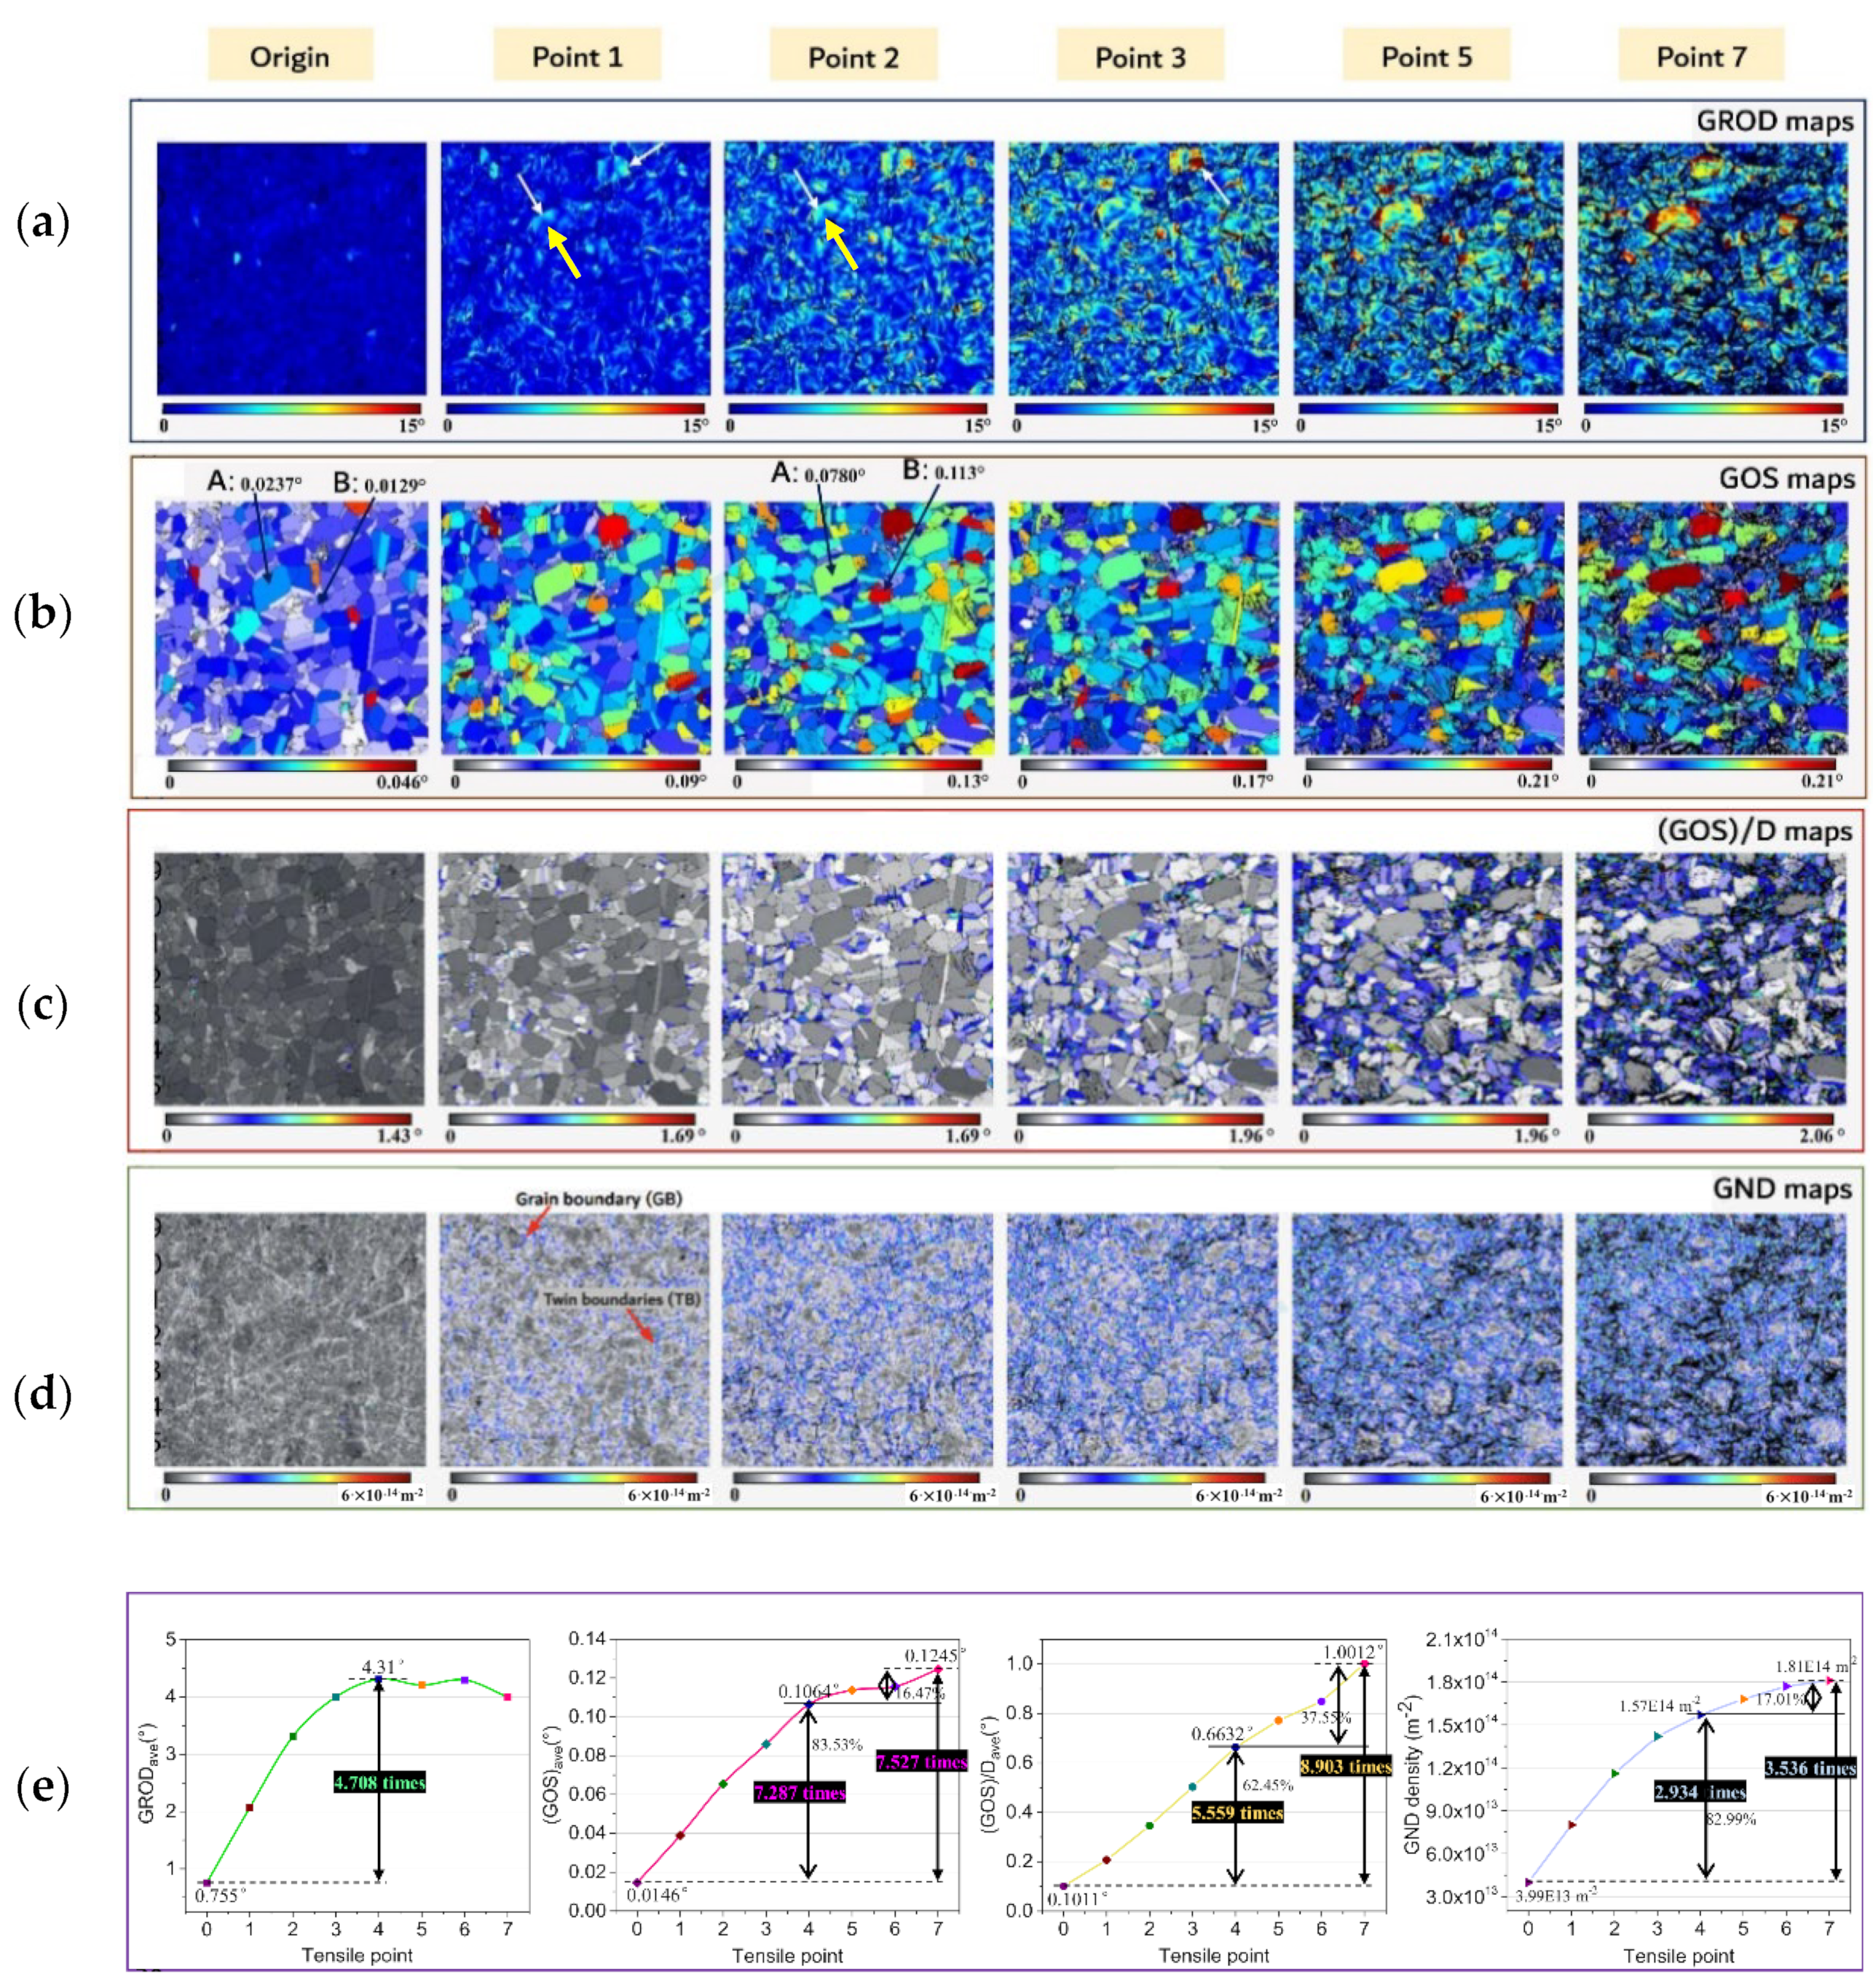
Figure 2. The measurement covered more than four hundred grains. The grain statistical analyses were conducted using an ATEX built-in procedure. The grain reference orientation deviation (GROD) maps were used first to characterize the plastic damage of the 316 steel specimen (see
Figure 2a). The GROD is the misorientation between the orientation of each pixel of the grain and the average orientation of the grain, which can be expressed as: GROD
i = |o
i − o
j|, where o
i is the orientation of a pixel point
i, and o
j is the orientation of its neighbor point,
j. From
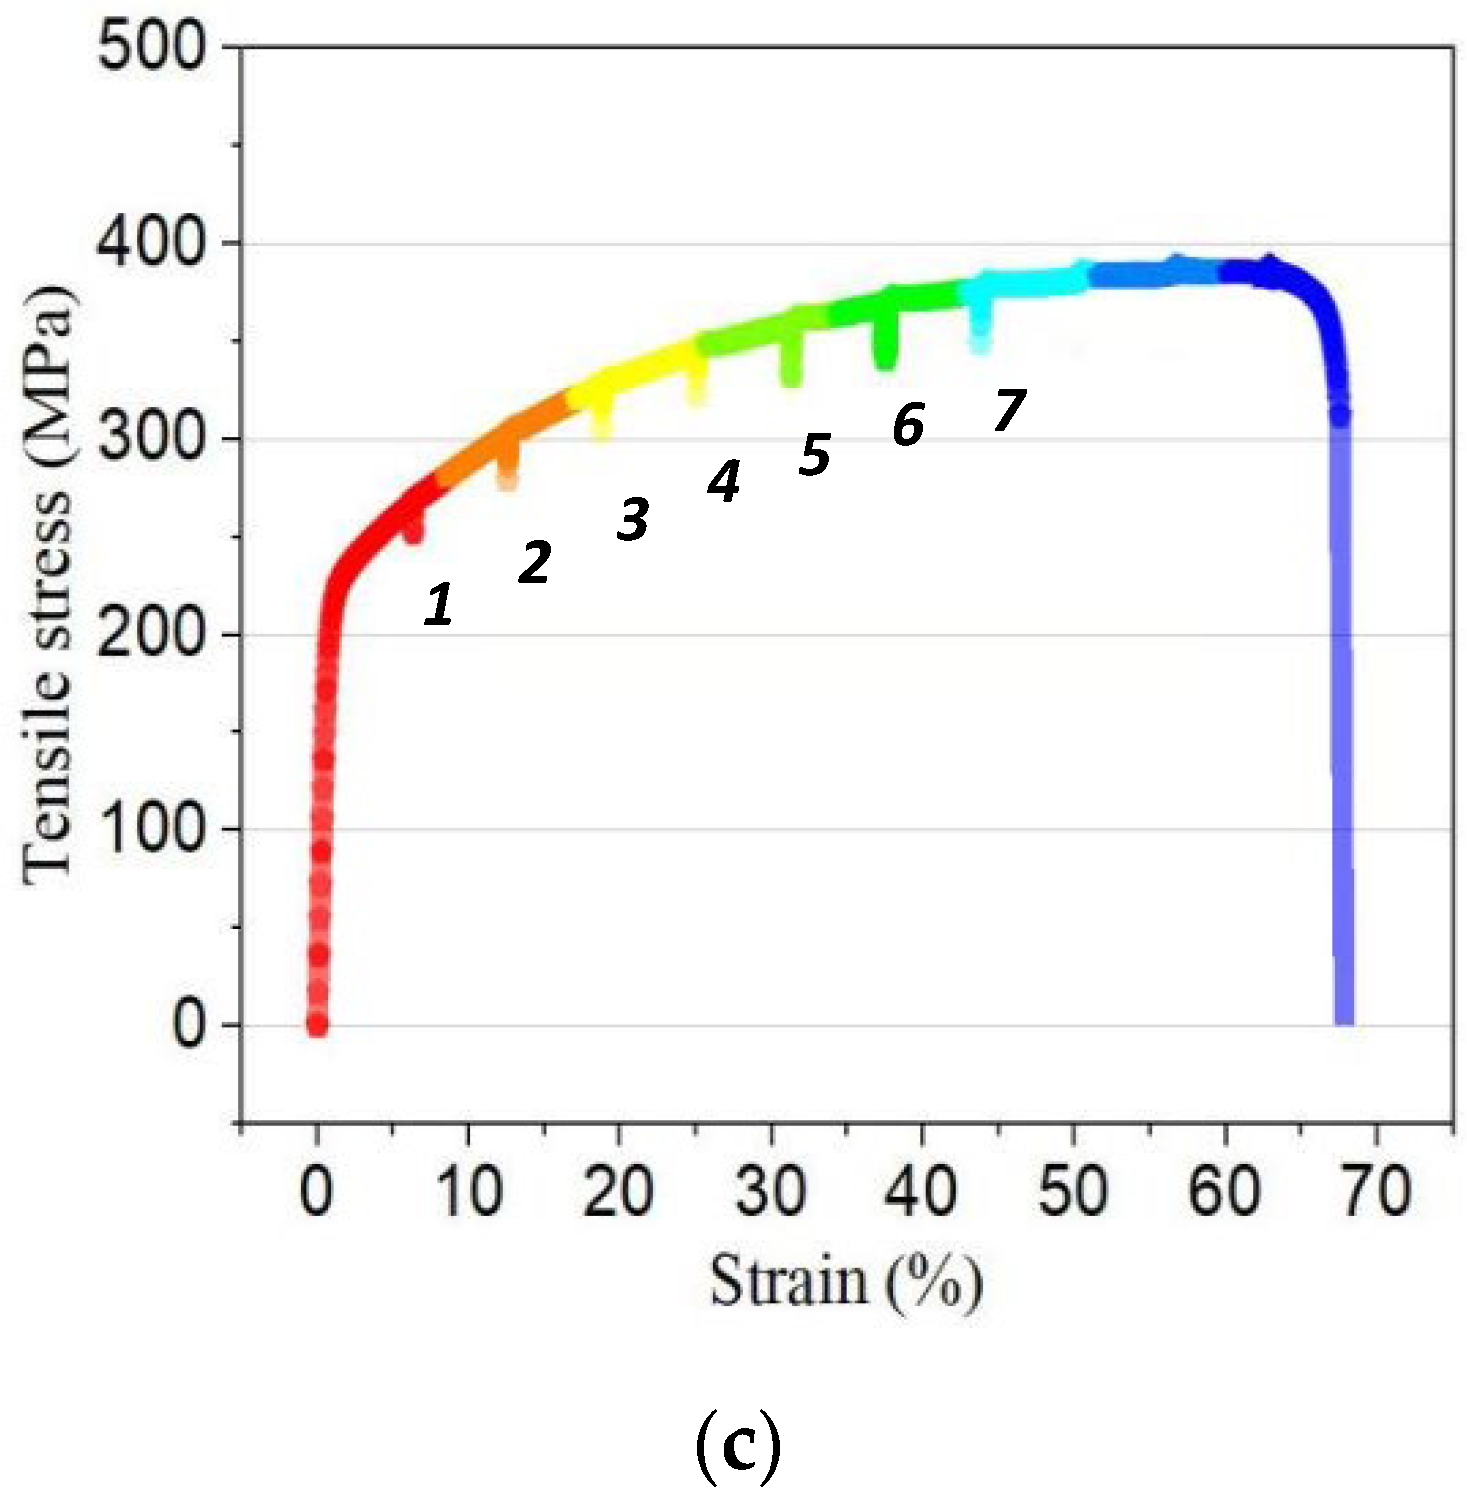
Figure 2a, it can be observed that the GROD value is low in the original specimen (inside the grains), but significantly increased as the specimen was stretched to the plastic stage (i.e., Point 1, stretched stress: 264.92 Mpa, strain: 6.27%). Furthermore, it can also be recognized from GROD maps that the GROD values are higher close to the grain boundaries (see white arrow), while they are relatively low in the center of the grain (see black arrow). The result indicates that in 316 steel, the largest deformation and distortion in grain preferentially occurs at the region near the grain boundaries, especially with grains of a larger dimension.
The Grain Orientation Spread (GOS) maps are shown in
Figure 2b. The GOS was the average misorientation between the orientations of each pixel and the average orientation of grain, per grain. From
Figure 2b, it can be observed that the GOS value in 316 steel progressively increased with the increase in plastic strain, while the image quality decreased during this process, manifested by the increasing number of pixel points that could not be indexed. Previously, Saeidi et al. [
8] investigated the GOS distribution in a deformed, dual-phase (Ferrite-Martensite) steel, and suggested that the GOS value was higher in the larger grains compared to the smaller grains, and that the GOS could be used as an indication of strain distribution. However, the results here do not completely agree with those findings. For instance, two grains of ‘A’ (size: 4.20 um, GOS: 0.0237°) and ‘B’ (size: 2.15 um, GOS: 0.0129°) were chosen in the original specimen, and it can be observed that after the plastic deformation (i.e., Point 2, Stretched stress: 302.13 Mpa, Strain: 12.58%), it is the smaller grain ‘B’ that has a higher GOS value. This result indicates that the grain size was not the only essential factor that affects the GOS level; apart from the GOS parameter, Allain-Bonasso et al. [
6] revealed that the (GOS)/D parameter was also sensitive to the plastic deformation of grain populations in an IF steel. The (GOS)/D was the Grain Orientation Spread over the grain Diameter (D), which can be utilized here to study the deformation degree of 316 steel. For this research, the gradual increase in (GOS)/D values in 316 steel can be directly observed in the (GOS)/D maps, as shown in
Figure 2c. The subpopulation of the smallest grains showed the highest GOS/D values, which is consistent with the results in [
6].
In addition to the misorientation parameters shown above, the geometrically necessary dislocation (GND) density parameter was also used to investigate plastic damage in 316 steel. The GND density can be calculated from the misorientation data between the neighbor points [
9], which represents the distortion of the crystal lattice introduced by the plastic deformation.
Figure 2d shows the variation in GND density in 316 steel in the plastic tensile stage. The continuous increase in the GND density of 316 steel can be seen as the plastic deformation increases. Meanwhile, it should be noted that, inside the grains, the distribution of GND density is inhomogeneous, and tended to centralize in the vicinity of the grain boundaries and the twin boundaries. Furthermore, it should be also pointed out that no evidence of correlation can be found between the level of GND value and grain size in 316 steel.
From
Figure 2a–d, it can be recognized that, with the increase in plastic strain, the misorientation parameters, such as the GROD, GOS, (GOS)/D, and GND density, all presented a growing trend, which means that these parameters can be used as indicators for the quantitative assessment of plastic damage. Therefore, it is necessary to understand how assessable these parameters are. Since the data value of each pixel can be extracted from the misorientation parameter maps, the average processing was also performed here to calculate the average value of each map, as shown in
Figure 2a–d.
Figure 2e shows the variation in the above parameters in 316 steel during the tensile stage. The tensile point 0 is the specimen in the original state. The GROD
ave presented a clear upward trend in the early-to-mid-plastic stage, i.e., from Point 0 to Point 4 (Stretched stress: 341.87 Mpa, Strain: 25.71%), which increased more than 4.7 times. However, after this, the GROD
ave did not show regularity with the increase in plastic strain; the GROD
ave fluctuated within the range from Point 4 to Point 7 (Stretched stress: 302.13~378.47 Mpa, Strain: 25.71~45.86%), and then decreased in the last stage. Furthermore, it can be found that the rapid rise in GROD
ave occurs just in the range of Point 0 to Point 2 (Stretched stress: 0~302.13 Mpa, Strain: 0~12.58%), since its growth slowed down as the specimen was stretched to Point 3 (Strain: 19.43%). Hence, it can be inferred that the GROD
ave may only be suitable for the early assessment of the degree of degradation in 316 steel.
Different from GROD
ave, the GOS
ave and (GOS)/D
ave monotonously increased with the increase in plastic strain. Nevertheless, there is also a visible difference in the variation rules of both parameters. From
Figure 2e, it can be observed that the GOS
ave sharply increased in the early-to-mid-plastic stage, and from Point 0 to Point 4, the increase in GOS
ave rose 7.2 times, which accounted for more than 83.5 percent of the total amount. However, in the subsequent tensile steps, the growth rate of GOS
ave dropped significantly, especially in the range from Point 5 to Point 6. Thus, the GOS
ave parameter may not be very well-suited to the assessment of plastic damage in 316 stainless steel in the later stage; unlike GOS
ave, it seems that the (GOS)/D
ave exhibited a near-linear increase with the increase in tensile strain. Although the extent of the (GOS)/D
ave increase in the early-to-mid-plastic stage (i.e., From Point 0 to Point 4) was less than the GOS
ave (i.e., 5.559 < 7.287), the extent of the increase in the former in the subsequent plastic stages was still evident, which accounted for a higher proportion of the total when compared with the GOS
ave (37.55% > 16.47%). Furthermore, from Point 0 to Point 7, the (GOS)/D
ave rose 8.9 times, which was already much larger than the GOS
ave increase (i.e., 7.527 times). Thus, compared with the GOS
ave, the (GOS)/D
ave parameter may be a better option for the assessment of plastic damage in 316 steel.
Apart from the above parameters, a progressive increase in GNDave was also observed in 316 steel during the plastic tensile stage. However, the increasing amplitudes of GNDave in the range of Point 0–4 and Point 0–7 were just 2.934 times and 3.536 times, respectively, which were much less than the GOSave and (GOS)/Dave. Furthermore, the extent of the increase in GNDave in the later plastic stage (i.e., From Point 4 to Point 7), which just accounted for 17.01% of the total increment, was also not evident. Therefore, the GNDave parameter may be not the optimal choice here.
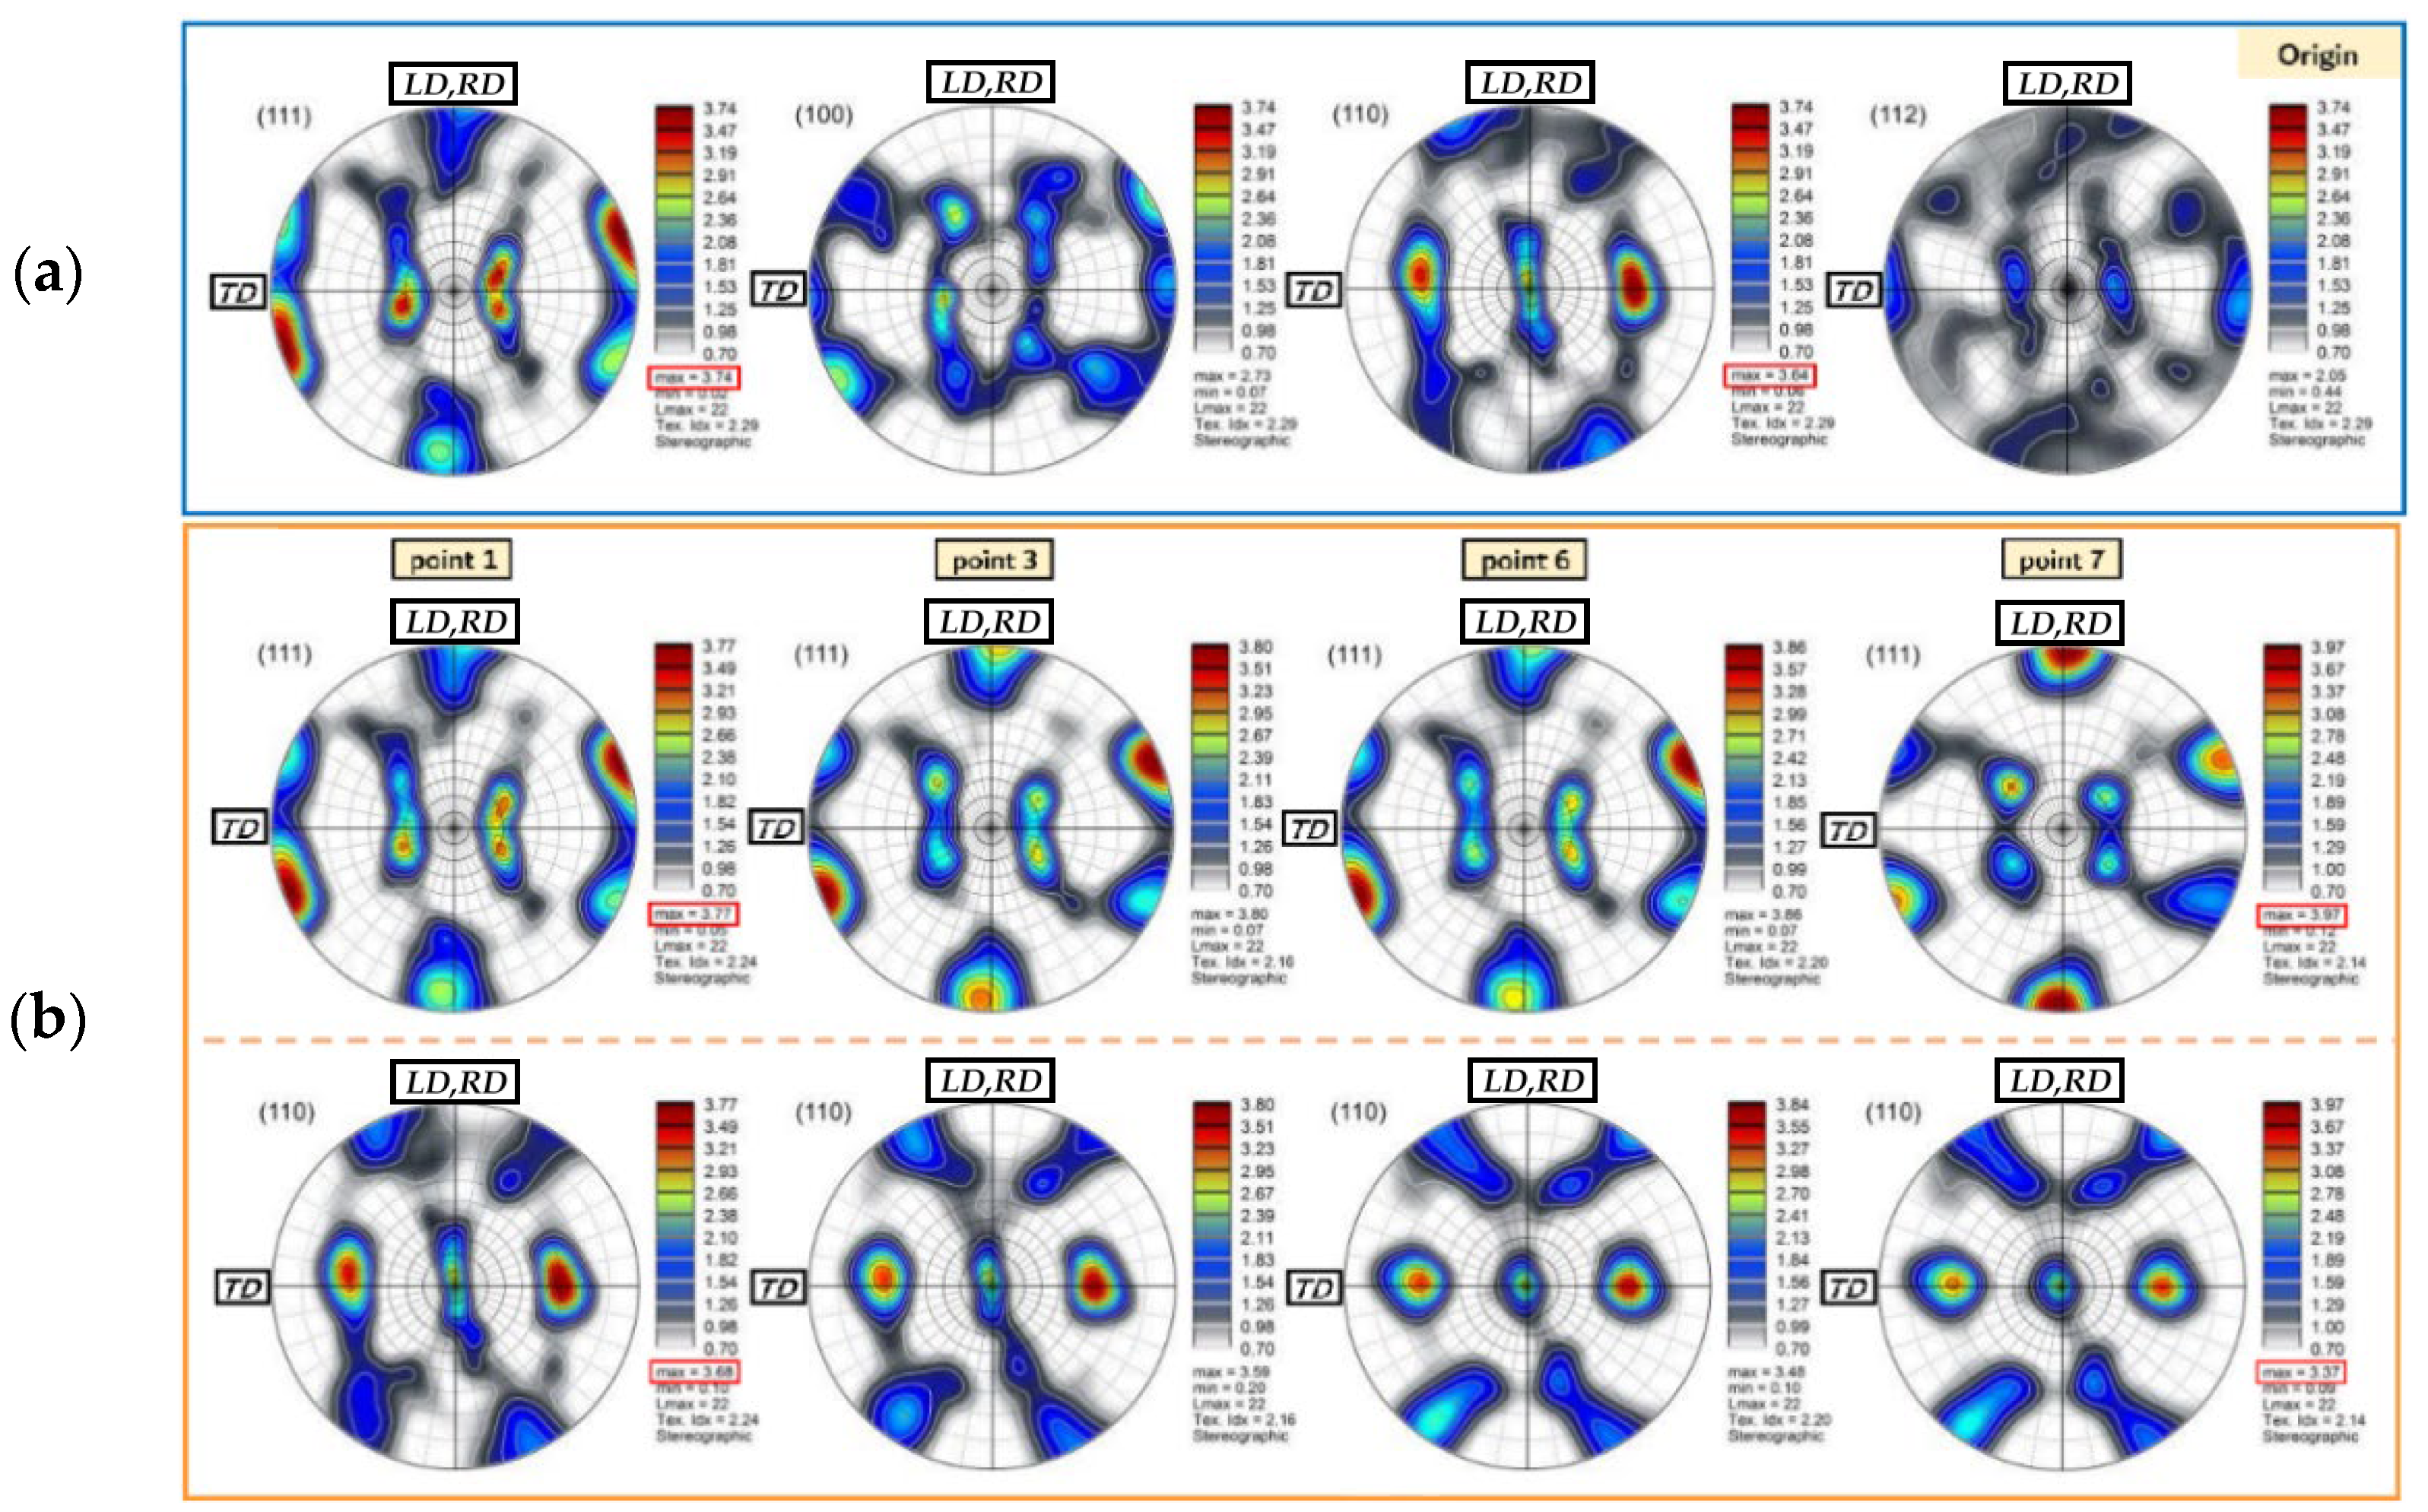
The orientation variation in 316 steel during the plastic tensile stage can also be recognized in terms of the macroscopic viewpoint in the development of crystallographic texture. Pole figure (PF) can be used to provide a classical representation of orientation. The PF is a two-dimensional graphical representation of orientation which displayed the orientation of the selected normal plane (i.e., a pole) with respect to the sample reference frame.
Figure 3a shows the PFs of the original 316 steel specimen. When comparing textural intensities, it can be recognized that the (111) and (110) textures have relatively strong basal textures, with a maximum intensity of 3.74 mud and 3.64 mud, respectively. This indicates that more lattice planes are aligned in these two directions than in a sample with random texture;
Figure 3b show the (111) and (110) textures of 316 steel grains at the different plastic stages. It can be seen that, after the plastic tensile stage, the intensity of both textures changed noticeably. The maximum intensity in the (111) texture of the Point 1-stretched specimen was 3.77 mud, while it increased to 3.97 mud as the specimen was stretched to Point 7. Conversely, a strong texture with an intensity of 3.68 mud was observed in the (110) texture of the Point-1-stretched specimen, but it decreased to 3.37 mud at Point 7. From the above results, the grain rotation of 316 steel during the tensile process can be clearly recognized. The grain deformation led to the variation in misorientation parameters, and thus the plastic damage can be quantitatively assessed using the misorientation parameters method.


