Article

Comparison Analysis of the Calculation Methods for Particle Diameter

1
School of Resources and Environmental Engineering, Wuhan University of Technology, Wuhan 430070, China
2
School of Materials Science and Engineering, Anhui University of Science and Technology, Huainan 232001, China
*
Authors to whom correspondence should be addressed.
Crystals 2022, 12(8), 1107; https://doi.org/10.3390/cryst12081107
Submission received: 7 July 2022 / Revised: 27 July 2022 / Accepted: 5 August 2022 / Published: 6 August 2022
(This article belongs to the Section Mineralogical Crystallography and Biomineralization)

Abstract

:
Accurately obtaining the particle diameter is a chief prerequisite to calculating the growth dynamics of metallic iron during the deep reduction of Fe-bearing minerals. In this work, spherical copper powder with a volume moment mean of 70.43 μm was used as a benchmark for measuring the authenticity of the data of the main calculation methods, including the Feret, diameter, equivalent diameter, and equivalent diameter plus correction factor methods. The results show that the measured particle count was less than the theoretical particle count. The particle diameters obtained through the Feret, diameter and equivalent diameter methods were all less than the benchmark, with deviations of 11.15 μm, 14.09 μm, and 12.71 μm, respectively. By contrast, the particle diameter obtained through the equivalent diameter plus correction factor method was slightly higher than the benchmark, with a deviation of 3.09 μm. Therefore, the equivalent diameter plus correction factor method is the most suitable for accurately obtaining the particle diameter, because most profiles do not pass through the particles’ centroid during sample preparation.

1. Introduction

Iron extraction from Fe-bearing solid wastes (e.g., red mud, copper slag, and electric arc furnace dust) has drawn much attention in recent decades with the constantly rising requirements of environmental protection and decreasing quality iron ore resources [1,2,3]. The Fe-bearing minerals in these solid wastes have a fine particle size, a complex phase component, and Fe-O-Si/Zn compounds, making iron recovery difficult through traditional methods, such as gravity separation, magnetic separation, and flotation. The magnetism of Fe-bearing minerals can be increased by magnetic roasting due to the formation of magnetite, but the particle size of magnetite is difficult to increase because of the solid-state reactions during roasting [4,5]. Therefore, magnetic roasting−magnetic separation is unsuitable for treating solid wastes with fine Fe-bearing minerals. In addition, deep reduction−magnetic separation is believed to be a potential method for extracting the iron from Fe-bearing solid wastes [6,7]. During deep reduction at ≥1100 °C, the Fe-bearing minerals in the solid wastes can be reduced to ferromagnetic metallic iron; however, most of the metallic iron particles increase to a diameter of 20–100 μm because of the liquid phase aggregation, which is beneficial for the subsequent iron recovery through magnetic separation [8,9].
Accurately obtaining the particle diameter is the key to calculating the growth dynamics of metallic iron, which is of great importance for regulating the roasting conditions during deep reduction. At present, the particle diameter of metallic iron is often obtained through the following four steps: (1) polishing the reduced specimens, (2) observing the images, (3) processing the images, and (4) calculating the particle diameter. Among the four steps, the calculation methods for particle diameter have a significant effect on the particle diameter of metallic iron. Zhang et al. [10] studied the growth behavior of iron grains during the deep reduction of copper slag and calculated the particle diameter of metallic iron in reduced specimens using the Feret method. Zinoveev et al. [11] studied the influence of Na2CO3 and K2CO3 addition on iron grain growth during the carbothermic reduction of red mud, and used the Feret method to calculate the particle diameter of metallic iron. Wang et al. [12] studied the effect of metallic iron addition on the solid-state carbothermal reduction of fayalite, and calculated the particle diameter distribution of metallic iron in the reduced specimens using the diameter method. In addition, the diameter method was also used to calculate the particle diameter of metallic iron when the reduction of copper slag was studied in the presence of a composite additive [13]. Zhu et al. [14] studied the growth behavior of metal iron grains during the direct reduction of low-grade hematite and used the equivalent diameter method to calculate the particle diameter of metallic iron. Zhao et al. [15] used the equivalent diameter method to analyze the particle diameter distribution of metallic iron in reduced refractory titanomagnetite. Sun et al. [16] studied the formation and characterization of metallic iron grains in the coal-based reduction of oolitic iron ore and obtained the particle diameter of metallic iron through the equivalent diameter plus correction factor method. Zhang et al. [17] also adopted the equivalent diameter plus correction factor method in calculating the particle diameter of metallic iron in reduced specimens of boron-bearing magnetite concentrate. Therefore, the main calculation methods for particle diameter are the Feret, diameter, equivalent diameter, and equivalent diameter plus correction factor methods. However, the authenticity of the data from these calculation methods, which have different statistical principles, remains unclear. Furthermore, the image magnification was randomly selected in the existing studies, ignoring the effect of image magnification on particle count, which is an important parameter in calculating the particle diameter.
Spherical copper powder with a volume moment mean of 70.43 μm was used as a benchmark in this work, and the effect of image magnification on the particle count was first studied. Furthermore, the data were obtained through the Feret, diameter, equivalent diameter, and equivalent diameter plus correction factor methods, then compared with the benchmark to measure their authenticity.

2. Experimental Procedures

2.1. Materials

Compared with metallic iron, non-magnetic copper powder is easier for preparing spherical particles in industry and for dispersing in a mixture of epoxy resin and triethanolamine during sample preparation. Therefore, spherical copper powder, which was pure and purchased from Nangong Xindun Alloy Welding Material Spraying Co., Ltd., Xingtai, China, was used as a benchmark in this work. The particle size distribution (PSD) of the copper powder is shown in Figure 1. The PSD of the copper powder was in the range of 13–210 μm, and its median (d(0.5)) was 62.09 μm. The surface area mean (D(3,2)) and volume moment mean (D(4,3)) were 51.81 μm and 70.43 μm, respectively. D(3,2) should be near D(4,3) for perfect spherical particles; those of the copper powder used in this work had a distinct difference because of the presence of irregular particles. Clearly, coarse particles made up the bulk of this copper powder; therefore, a D(4,3) of 70.43 μm was the most appropriate to use as a benchmark [18].

2.2. Procedures

Three typical parts of copper powder were prepared and then separately mixed with a liquid mixture of epoxy resin and triethanolamine. Next, the three samples were placed in a drying oven (DZF-6055, Shanghai Yiheng Scientific Instruments Co., Ltd., Shanghai, China) at a temperature of 70 °C for 5 h. Afterward, the samples were polished in an MP-2B metallographic polishing machine (Shanghai Metallurgical Equipment Co., Ltd., Shanghai, China). To increase the electrical conductivity, C was coated on the surface of the polished samples before the scanning electron microscopy (SEM, JXA-8230, JEOL, Akishima, Japan) analysis. In each sample, four different acquisition positions were selected, of which four images were taken, to guarantee the accuracy of the data during calculation, as shown in Figure 2. Therefore, 12 sets of data could be obtained for every calculation method.

2.3. Analyses

The particle size distribution of copper powder was analyzed by using a particle size analyzer (Mastersizer 2000, Malvern, UK). Before calculation, the images were processed with the Image Pro Plus software, and the main steps were as follows (see Figure 3): (1) the SEM image was opened with Image Pro Plus software; (2) the scale label was set by clicking the Measure-Calibration-Set System, the straw button was selected by clicking the Count/Size-Manual-Select Colors to pitch on all the copper particles, and then a new image with a white color was created; (3) the particle count, diameter, and area parameters were obtained by clicking the Count option. Ultimately, the average diameter of the particles could be calculated by the main calculation methods on the basis of the obtained parameters. The processing of the SEM images to determine the particle size distribution is shown in Figure 3.

3. Results and Discussion

3.1. Determination of Image Magnification

The analysis of the particle counts in the images with Image Pro Plus software revealed that the measured particle count increased with a decrease in the magnification but was significantly less than the theoretical particle count. Therefore, an appropriate image magnification should be selected when obtaining the particle count.
The SEM images at ×50, ×70, ×90, and ×110 magnification are presented in Figure 4. The particles in the copper powder were mainly in spherical and quasi-spherical form, and few particles had an irregular shape. This finding could explain the difference between D(3,2) and D(4,3), as shown in Figure 1. In addition, the small particles in the images became more obvious with an increase in the magnification from ×50 to ×110.
When the measured particle count in the ×110 image was used as the standard, the theoretical particle count in the ×90, ×70, and ×50 images could be calculated using Equation (1), and the results are shown in Figure 5.
N = S i S 0 × N 0
where N is the theoretical particle count, S i is the image area of the corresponding magnification (μm2), S 0 is the image area of the ×110 magnification (μm2), and N 0 is the measured particle count in the ×110 image.
The measured particle counts were significantly less that the theoretical particle counts in the ×90, ×70, and ×50 images, with deviations of 47, 57 and 191, respectively. The minimum size, below which the particles could not be recognized by Image Pro Plus software, decreased with an increase in the image magnification. Therefore, some small particles which were recognized in the ×110 image were ignored in the ×50 image during image processing. Therefore, the appropriate image magnification was ×70, which had a measured particle count of 331 and a low deviation of 57. The ×70 images were used in subsequent calculations of the particle diameter.

3.2. Calculation of Particle Diameter

The particle diameter at different positions was calculated by the main methods, including the Feret, diameter, equivalent diameter, and equivalent diameter plus correction factor methods; the results are presented in Figure 6.
The Feret method uses the Feret diameter, which is the distance between two parallel tangents to the contour of the particle in a certain direction, to characterize the particle diameter, as shown in Figure S1 in the Supplementary Materials. When the SEM images were analyzed with software of Image-Pro Plus 6.0 (Media Cybernetics, Rockville, MD, USA), the average Feret diameter was obtained directly by clicking the Measurements–Feret (mean) option. The Feret diameters at 12 positions are presented in Figure 6a. The Feret diameters at the different positions exhibited slight fluctuation in the range of 53–64 μm. The mean of the 12 Feret diameters was 59.28 μm.
The diameter method uses the diameter, which is the average length of the diameters passing through the centroid of the particle, to characterize the particle diameter, as shown in Figure S2 in the Supplementary Materials. When the SEM images were analyzed with Image Pro Plus software, the average diameter was directly obtained by clicking the Measurements–Diameter (mean) tool. The diameters at the 12 positions are presented in Figure 6b. The diameters were in the range of 51–61 μm, and the mean was 56.34 μm.
During the deep reduction of Fe-bearing minerals, the metallic iron particles formed are usually in a spherical form, which is consistent in three-dimensional space. Therefore, the cross-sectional area of every particle could be obtained by analyzing the images with Image Pro Plus software, and then the corresponding equivalent diameter was calculated using Equation (2) [17]. Furthermore, the mean diameter was calculated using Equation (3) on basis of the particle count [16]. This method is called the equivalent diameter method, and its schematic is shown in Figure S3 in the Supplementary Materials. The equivalent diameters at the 12 positions were in the range of 52–62 μm, and the mean was 57.72 μm (see Figure 6c).
L i = 2 × S i π
L = i N L i N
where L i is the equivalent diameter of each measured particle (μm), S i is the cross-sectional area of the corresponding particle (μm2), π is a constant (3.14), N is the total count of the particles, and L is the mean diameter (μm).
The diameter of a random cross-sectional area is normally inconsistent with the actual diameter because the profile has a small change when crossing the centroid of a particle. Therefore, the measured diameter of the cross-sectional area is less than the actual particle size. For spherical particles, the relationship between the measured diameter and the actual diameter was established by the statistics shown in Equation (4) [17,19]. After the calculation, the equivalent diameters with the correction factor were in the range of 67–78 μm, and the mean was 73.52 μm (see Figure 6d).
D = 4 L π
where D is the actual diameter (μm), π is a constant (3.14), and L is the mean diameter (μm).

3.3. Discussion of the Calculation Methods

The D(4,3) of copper powder is presented in Figure 7 together with the mean particle diameter calculated by the Feret, diameter, equivalent diameter, and equivalent diameter plus correction factor methods. The particle diameters obtained through the Feret, diameter and equivalent diameter methods were all less than the benchmark of 70.43 μm, with deviations of 11.15 μm, 14.09 μm, and 12.71 μm, respectively. In contrast, the diameter obtained through the equivalent diameter plus correction factor method was slightly higher than the benchmark, with a deviation of 3.09 μm. Therefore, the particle diameter obtained via the equivalent diameter plus correction factor method was nearest to the benchmark among the four methods.
When a sample was polished, the cutting surface of the particles in the sample varied according to the different positions, as shown in Figure 8. The diameter of the second cutting surface (d, 2) was obviously larger than that of the first cutting surface (d, 1), but they were both smaller than the diameter of the third cutting surface (d, 3), which went through the centroid of the particle [20,21]. In addition, the first and second cutting surfaces were more likely to appear during polishing according to statistics. Thus, the measured diameter should be modified with Equation (4) to approximate the true diameter.

4. Conclusions

The calculation methods, namely the Feret, diameter, equivalent diameter, and equivalent diameter plus correction factor methods, were investigated by comparing the calculated particle diameters with the benchmark of 70.43 μm. The main findings were as follows:
(1)
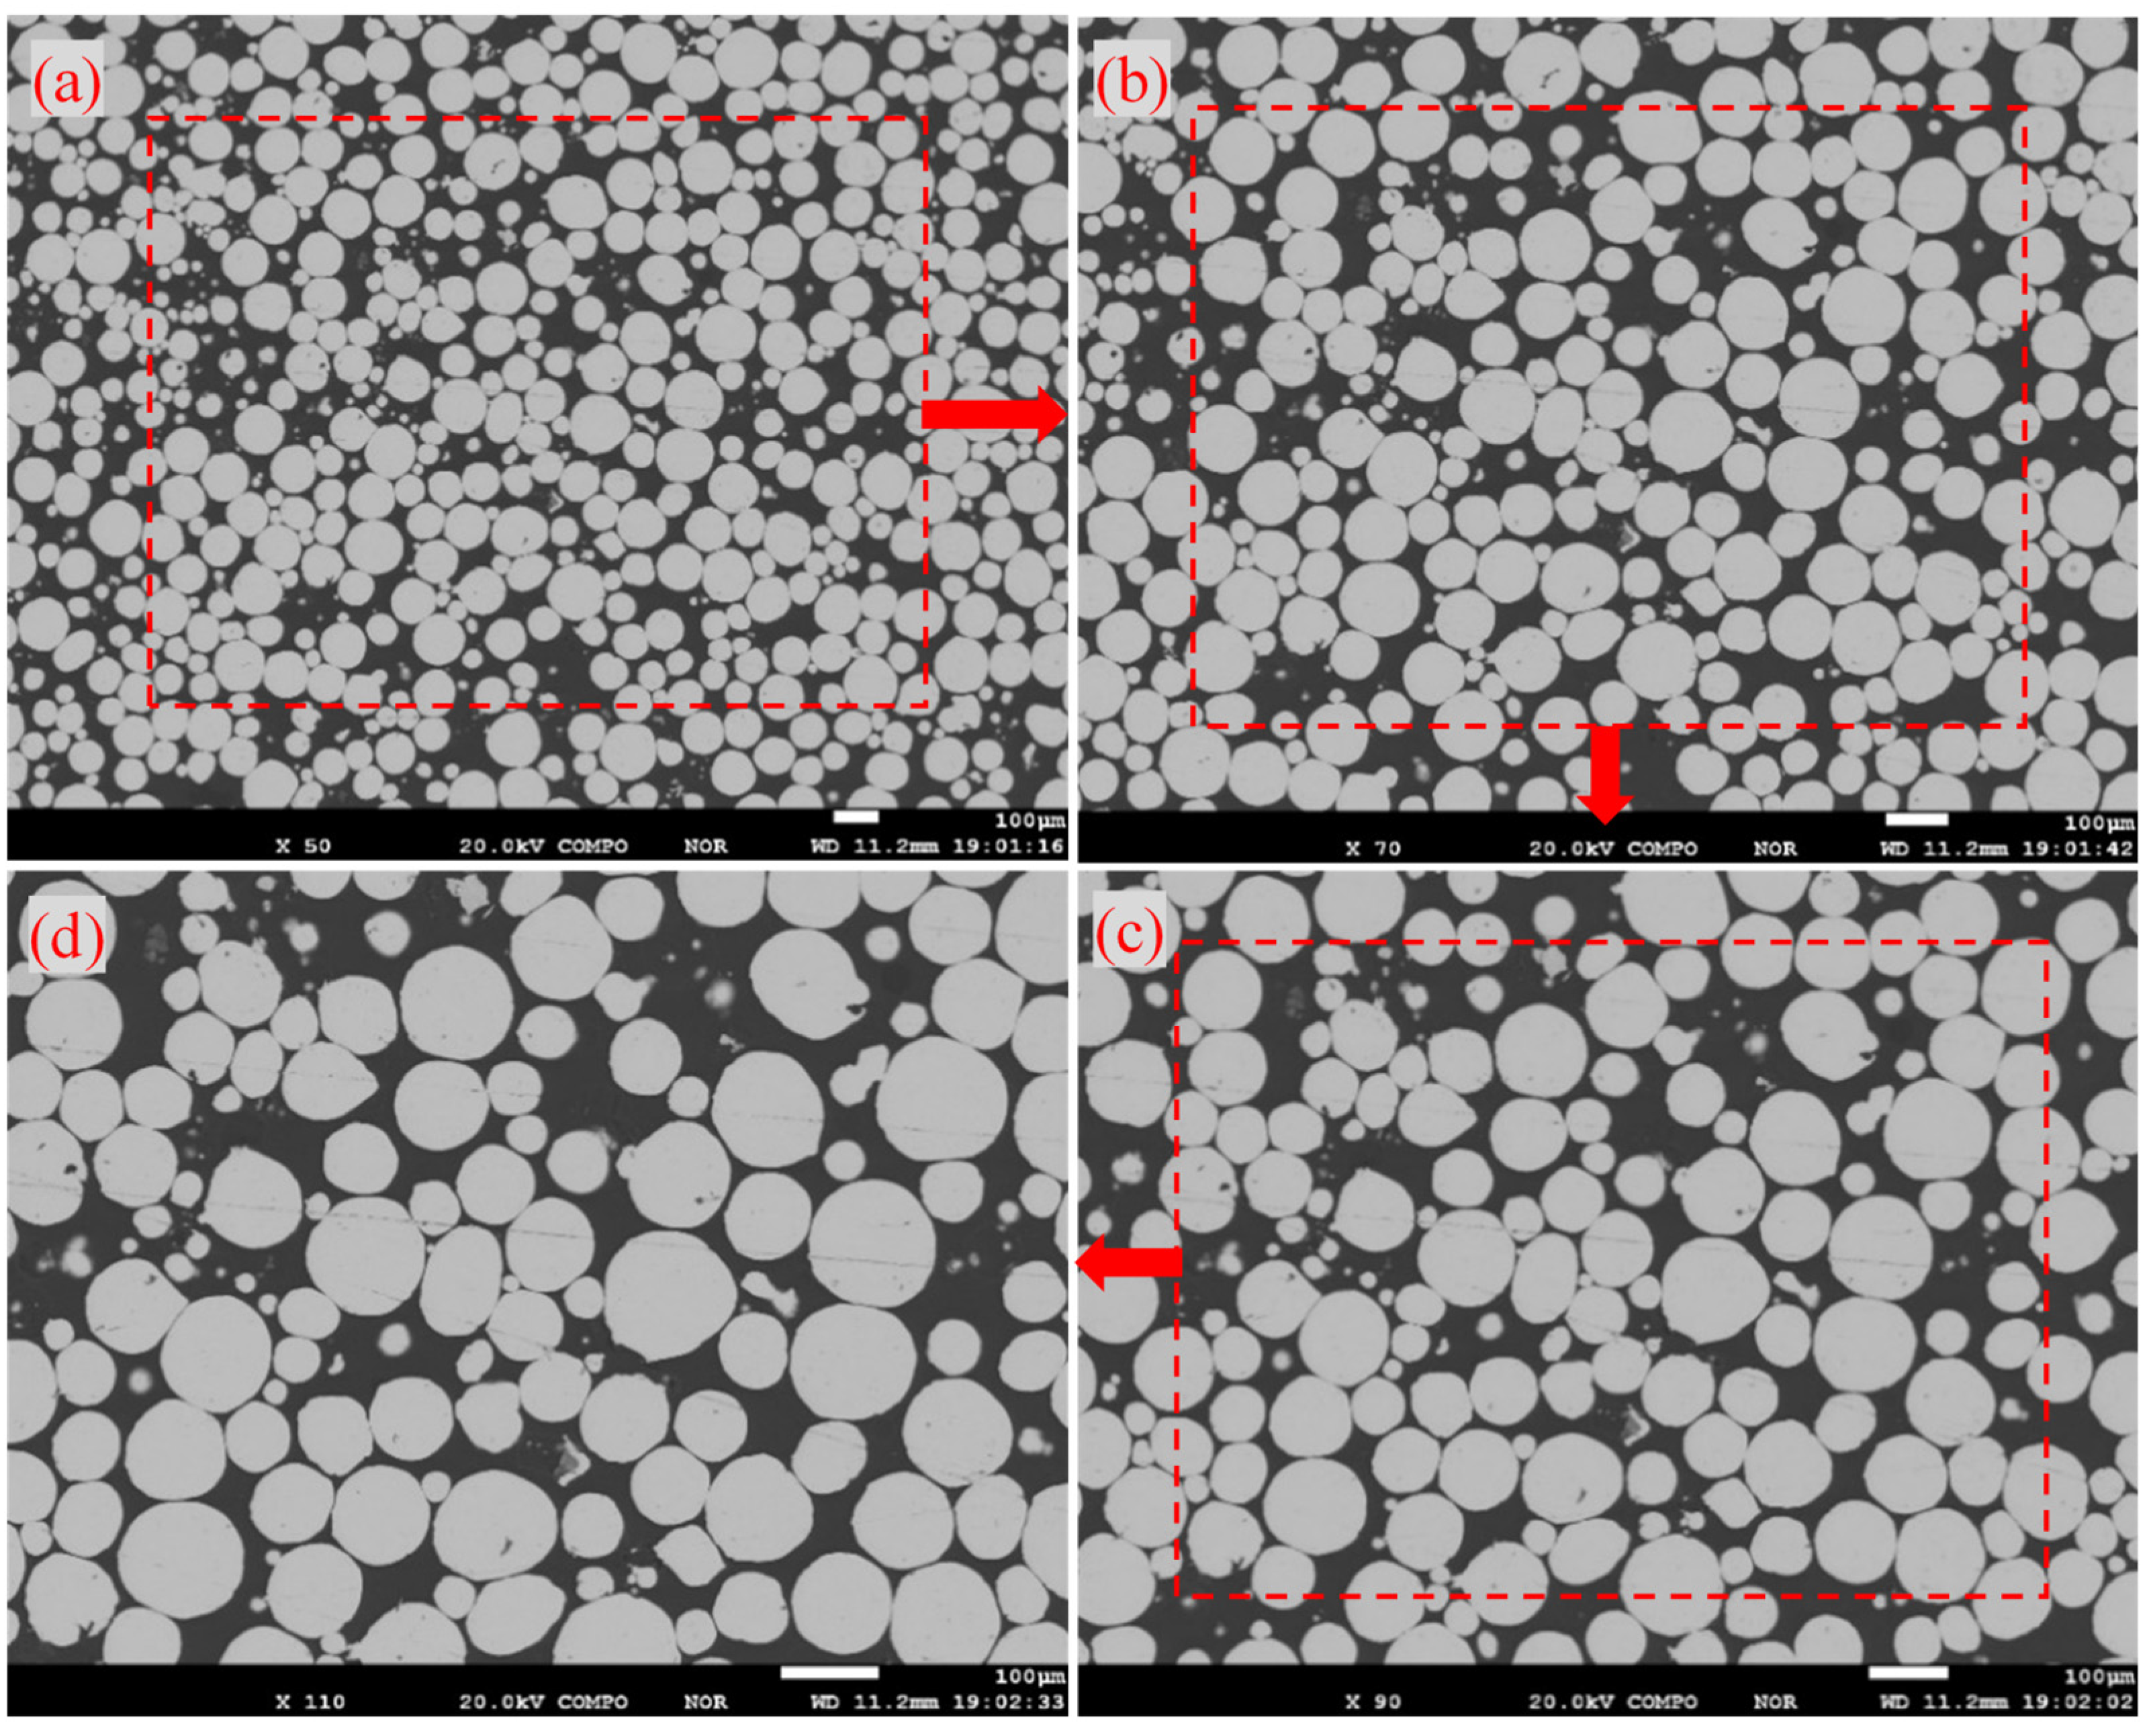
Image magnification had significant effect on the particle count. The measured particle count increased with a decrease in the image magnification, but was significantly less than the theoretical particle count. The appropriate magnification should display approximately 300 particles in the image.
(2)
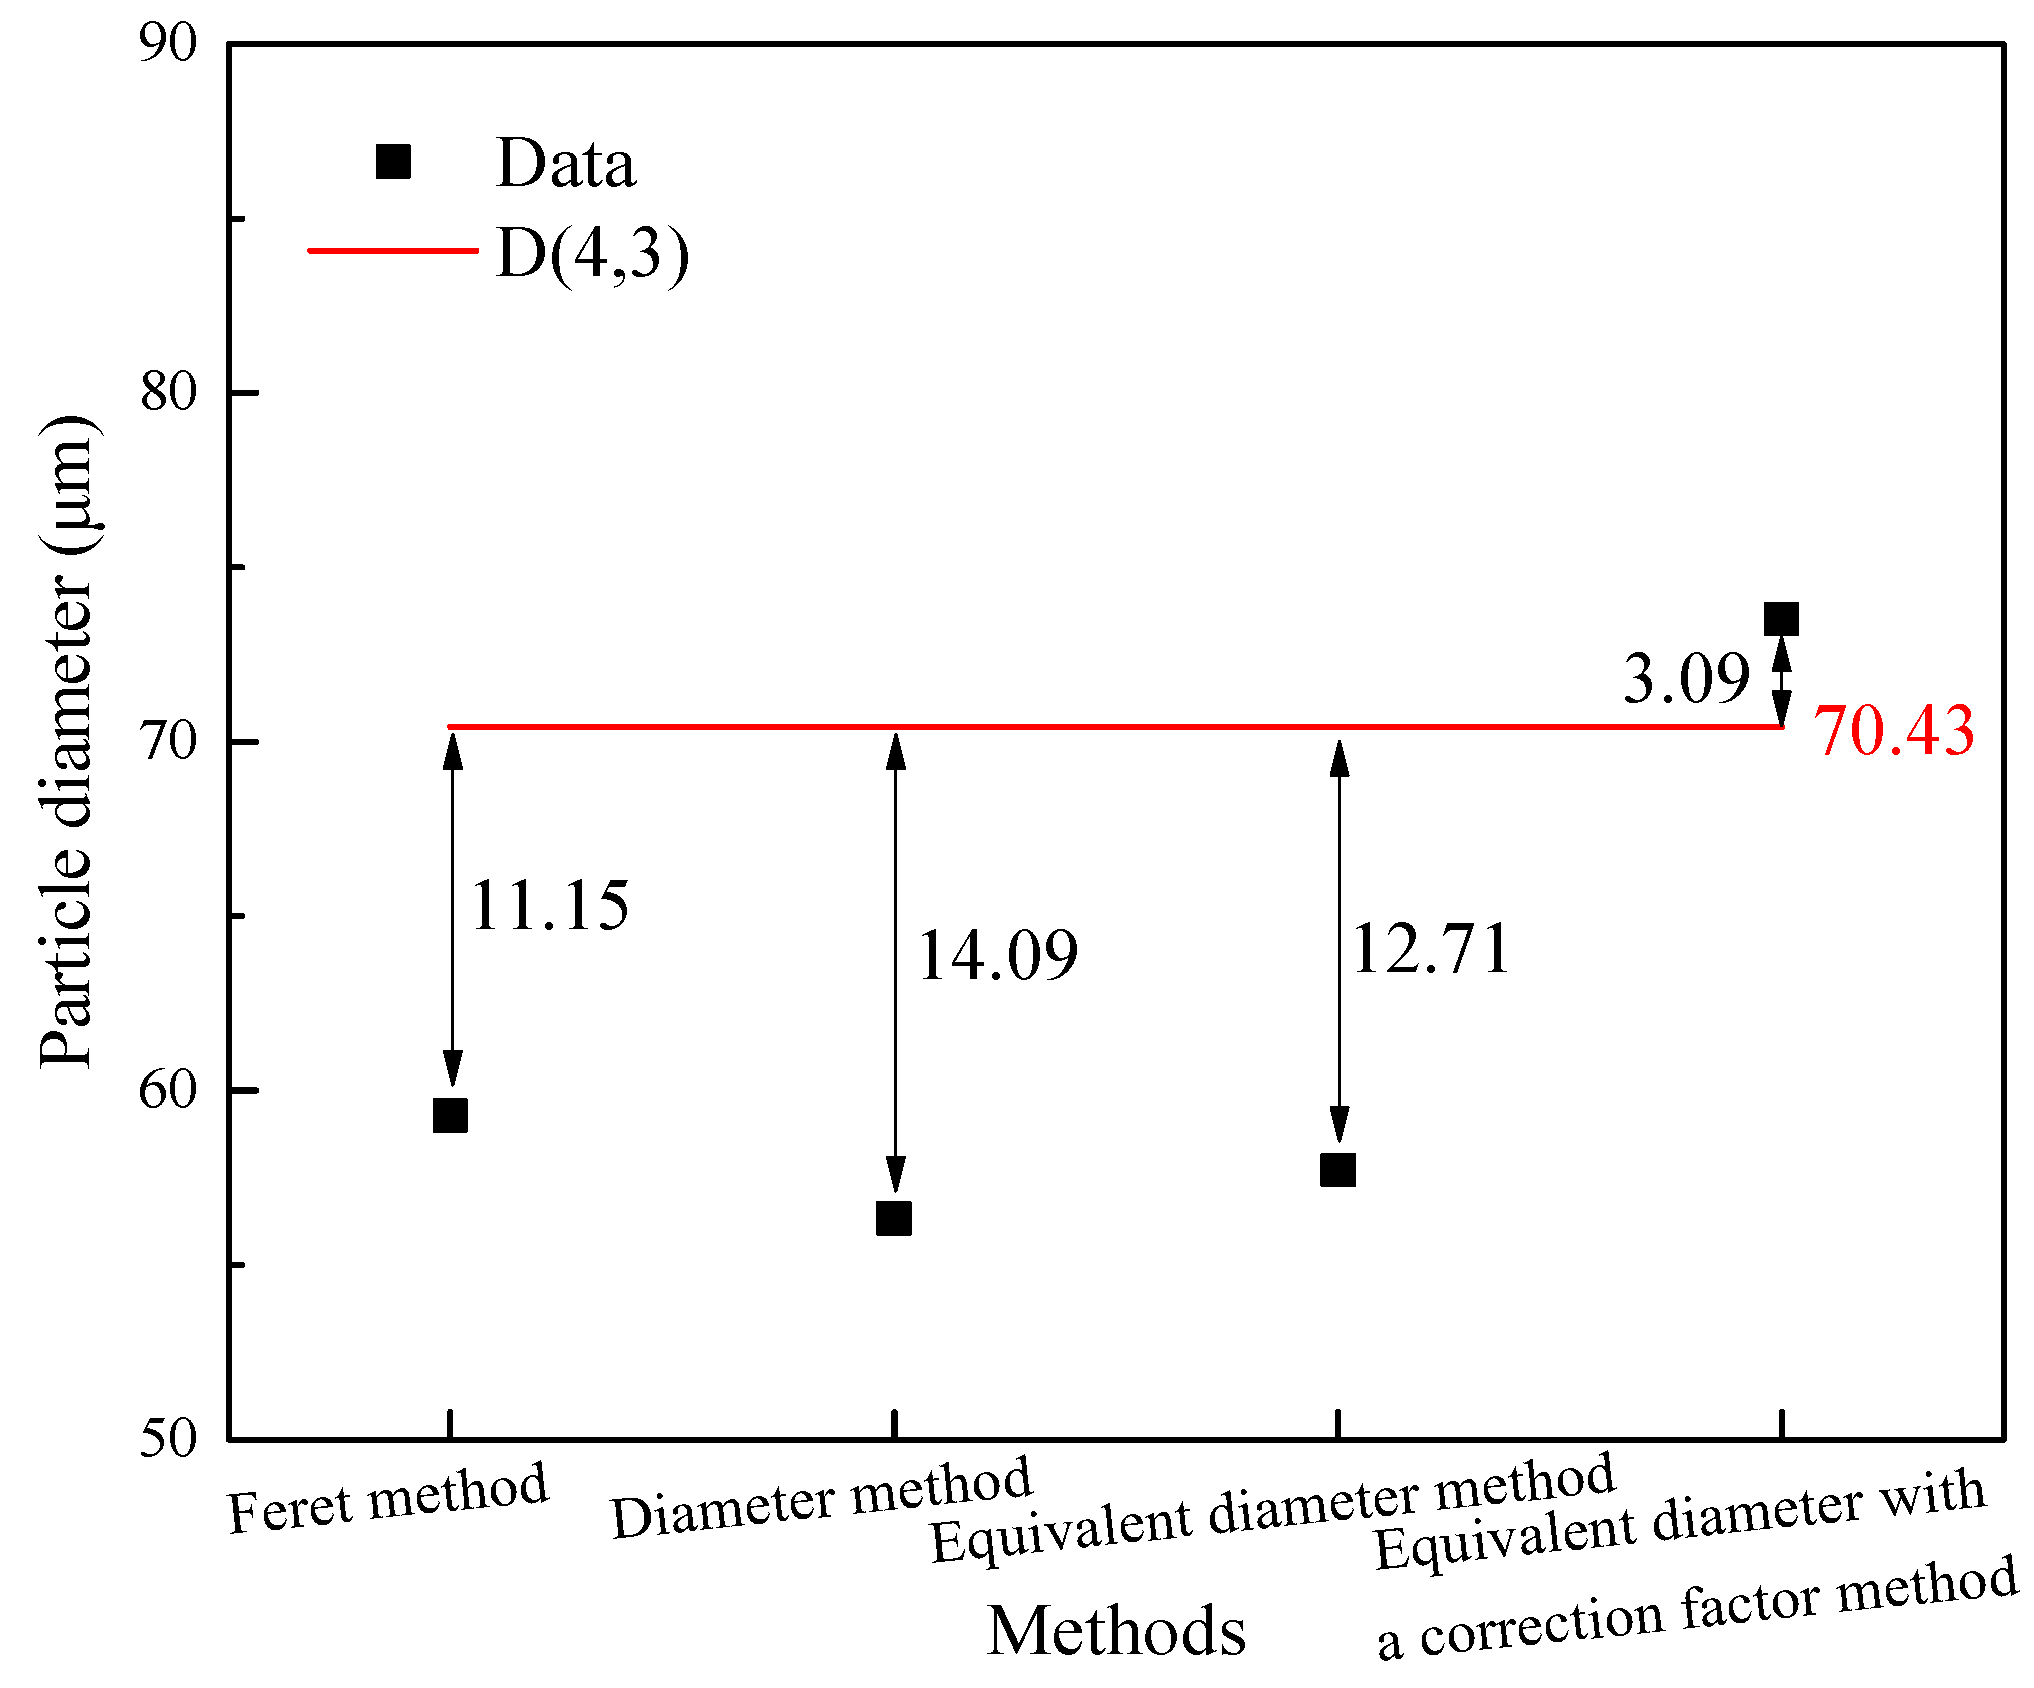
The equivalent diameter plus correction factor method was the most suitable for accurately obtaining the particle diameter because it achieved the lowest deviation of 3.09 μm from the benchmark, whereas the particle diameters obtained through the Feret, diameter, and equivalent diameter methods were all less than the benchmark, with a deviation of >10 μm, possibly because the cutting surface did not go through the centroid of the particle.

Supplementary Materials

The following supporting information can be downloaded at: https://www.mdpi.com/article/10.3390/cryst12081107/s1, Figure S1: The schematic of Feret diameter; Figure S2: The schematic of diameter; Figure S3: The schematic of Equivalent diameter.

Author Contributions

Conceptualization, H.W. and L.L.; methodology, H.W. and L.L.; software, X.Z.; validation, X.Z.; formal analysis, X.Z. and H.W.; investigation, X.Z. and H.W.; resources, L.L.; data curation, X.Z. and H.W.; writing—original draft preparation, X.Z.; Writing—review and editing, X.Z. and H.W.; visualization, X.Z.; supervision, H.W. and L.L.; project administration, H.W.; funding acquisition, H.W. and L.L. All authors have read and agreed to the published version of the manuscript.

Funding

This research was funded by the National Natural Science Foundation of China (Grant Numbers 52004194 and 51874219) and the China Postdoctoral Science Foundation (Grant Number 2019M662733).

Data Availability Statement

Not applicable.

Acknowledgments

The authors appreciate the support from the National Natural Science Foundation of China (Grant Nos. 52004194 and 51874219) and the China Postdoctoral Science Foundation (Grant No. 2019M662733).

Conflicts of Interest

The authors declare no conflict of interest.

References

  1. Liu, X.; Han, Y.X.; He, F.Y.; Gao, P.; Yuan, S. Characteristic, hazard and iron recovery technology of red mud—A critical review. J. Hazard. Mater. 2021, 420, 126542. [Google Scholar] [CrossRef]
  2. Lin, X.L.; Peng, Z.W.; Yan, J.X.; Li, Z.Z.; Hwang, J.Y.; Zhang, Y.B.; Li, G.H.; Jiang, T. Pyrometallurgical recycling of electric arc furnace dust. J. Clean. Prod. 2017, 149, 1079. [Google Scholar] [CrossRef]
  3. Wang, H.Y.; Song, S.X. Separation of silicon and iron in copper slag by carbothermic reduction-alkaline leaching process. J. Cent. South Univ. 2020, 27, 2249–2258. [Google Scholar] [CrossRef]
  4. Luo, L.Q.; Zhang, X.X.; Wang, H.Y.; Zheng, B.T.; Wei, C.X. Comparing strategies for iron enrichment from Zn- and Pb-bearing refractory iron ore using reduction roasting-magnetic separation. Powder Technol. 2021, 393, 333–341. [Google Scholar] [CrossRef]
  5. Cardenia, C.; Balomenos, E.; Panias, D. Iron recovery from bauxite residue through reductive roasting and wet magnetic separation. J. Sustain. Metall. 2019, 5, 9–19. [Google Scholar] [CrossRef] [Green Version]
  6. Habibi, H.; Piruzian, D.; Shakibania, S.; Pourkarimi, Z.; Mokmeli, M. The effect of carbothermal reduction on the physical and chemical separation of the red mud components. Miner. Eng. 2021, 173, 107216. [Google Scholar] [CrossRef]
  7. Li, X.M.; Wen, Z.Y.; Li, Y.; Yang, H.B.; Xing, X.D. Improvement of carbothermic reduction of nickel slag by addition of CaCO3. Trans. Nonferrous Met. Soc. China 2019, 29, 2658–2666. [Google Scholar] [CrossRef]
  8. Heo, J.H.; Kim, B.S.; Park, J.H. Effect of CaO addition on iron recovery from copper smelting slags by solid carbon. Metall. Mater. Trans. B. 2013, 44, 1352–1363. [Google Scholar] [CrossRef]
  9. Sarfo, P.; Wyss, G.; Ma, G.J.; Das, A.; Young, C. Carbothermal reduction of copper smelter slag for recycling into pig iron and glass. Miner. Eng. 2017, 107, 8–19. [Google Scholar] [CrossRef]
  10. Zhang, L.; Chen, H.H.; Deng, R.D.; Zuo, W.R.; Guo, B.; Ku, J.G. Growth behavior of iron grains during deep reduction of copper slag. Powder Technol. 2020, 367, 157–162. [Google Scholar] [CrossRef]
  11. Zinoveev, D.; Grudinsky, P.; Zakunov, A.; Semenov, A.; Petelin, A. Influence of Na2CO3 and K2CO3 addition on iron grain growth during carbothermic reduction of red mud. Metals 2019, 9, 1313. [Google Scholar] [CrossRef] [Green Version]
  12. Wang, H.Y.; Shen, L.T.; Bao, H.J.; Zhang, W.T.; Zhang, X.; Luo, L.Q.; Song, S.X. Investigation of solid-state carbothermal reduction of fayalite with and without added metallic iron. JOM 2021, 73, 703–711. [Google Scholar] [CrossRef]
  13. Guo, Z.Q.; Pan, J.; Zhu, D.Q.; Yang, C.C. Mechanism of composite additive in promoting reduction of copper slag to produce direct reduction iron for weathering resistant steel. Powder Technol. 2018, 329, 55–64. [Google Scholar] [CrossRef]
  14. Zhu, D.Q.; Xiao, Y.Z.; Chun, T.J.; Pan, J. Growth behavior of metal iron grain during direct reduction of low grade hematite. Chin. J. Nonferrous Met. 2013, 23, 3242–3247. (In Chinese) [Google Scholar]
  15. Zhao, Y.Q.; Sun, T.C.; Li, Z.Y.; Wang, Z. Measurement and characterisation of metallic iron particles on coal-based reduction and magnetic separation of refractory titanomagnetite. Min. Metall. Explor. 2021, 38, 141–150. [Google Scholar] [CrossRef]
  16. Sun, Y.S.; Han, Y.X.; Li, Y.F.; Li, Y.J. Formation and characterization of metallic iron grains in coal-based reduction of oolitic iron ore. Int. J. Min. Metall. Mater. 2017, 24, 123–129. [Google Scholar] [CrossRef]
  17. Zhang, X.; Li, G.H.; Rao, M.J.; Mi, H.P.; Liang, B.J.; You, J.X.; Peng, Z.W.; Jiang, T. Growth of metallic iron particles during reductive roasting of boron-bearing magnetite concentrate. J. Cent. South Univ. 2020, 27, 1484–1494. [Google Scholar] [CrossRef]
  18. Malvern Instruments. A Basic Guide to Particle Characterization; Malvern Instruments Ltd.: Malvern, UK, 2012. [Google Scholar]
  19. Chayes, F. On the bias of grain-size measurements made in thin section. J. Geol. 1950, 58, 156–160. [Google Scholar] [CrossRef]
  20. Krumbein, W.C. Thin-section mechanical analysis of indurated sediments. J. Geol. 1935, 43, 484–496. [Google Scholar] [CrossRef]
  21. Weibel, E.R. Stereological Methods, Volume 1: Practical Methods for Biological Morphometry; Academic Press: Cambridge, MA, USA, 1979. [Google Scholar]
Figure 1. PSD of copper powder.
Crystals 12 01107 g001
Figure 2. The schematic of image acquisition in the samples.
Crystals 12 01107 g002
Figure 3. Processing of a SEM image to determine the particle size distribution: (a) SEM image, (b) white image, and (c) color image.
Crystals 12 01107 g003
Figure 4. SEM images of copper powder at different magnifications: (a) ×50; (b) ×70; (c) ×90; (d) ×110.
Crystals 12 01107 g004
Figure 5. The relationship between particle count and magnification.
Crystals 12 01107 g005
Figure 6. The particle diameter at different positions calculated by different methods: (a) Feret method, (b) diameter method, (c) equivalent diameter method, and (d) equivalent diameter plus correction factor method.
Crystals 12 01107 g006
Figure 7. Comparison of the calculated results with the benchmark.
Crystals 12 01107 g007
Figure 8. Schematic of random particle cutting.
Crystals 12 01107 g008
Publisher’s Note: MDPI stays neutral with regard to jurisdictional claims in published maps and institutional affiliations.

