Article

Effect of 5-Amino-1H-Tetrazole on Combustion Pyrolysis Characteristics and Kinetics of a Combustion Tear Gas Mixture

Equipment Management and Guarantee Institute, Engineering University of Armed Police Force of China, Xi’an 710086, China
*
Author to whom correspondence should be addressed.
Crystals 2022, 12(7), 948; https://doi.org/10.3390/cryst12070948
Submission received: 10 June 2022 / Revised: 30 June 2022 / Accepted: 3 July 2022 / Published: 6 July 2022
(This article belongs to the Special Issue Advanced Energetic Materials: Testing and Modeling)

Abstract

:
Taking the combustion tear gas mixture as the research object, the system formula was optimized by adding a different mass fraction of 5-amino-1H-tetrazole(5AT). TG-DSC, a thermocouple, and a laser smoke test system were used to characterize the characteristic combustion parameters such as combustion temperature and velocity, as well as the end-point effects such as smoke concentration and particle size. Starink’s method, the Flynn–Wall–Ozawa method, and the Coats–Redfern method were used to evaluate the pyrolysis kinetic parameters of the samples. The results show that when the mass fraction of 5-amino-1H-tetrazole in the system is 10%, the maximum combustion temperature of the sample decreases by nearly 70 °C and the smoke concentration increases by 12.81%. The kinetic study also found that with a different mass fraction of 5-amino-1H-tetrazole in the system, the main reaction model of the mixed agent in the first, third, and fourth stages of pyrolysis changed significantly, but for the second stage of sample pyrolysis, the main reaction model (the A4 model) showed a high degree of consistency, which can be considered as the thermal diffusion stage of the tear agent capsicum oleoresin (OC) (the temperature range is 220~350 °C), which is highly consistent with the results of the TG-DSC analysis. It was also confirmed that OC’s thermal diffusion is mainly concentrated in this stage. The results of this study show that adding an appropriate amount of the combustible agent 5-amino-1H-tetrazole to the combustion tear gas mixture can improve its combustion performance and smoking performance, which provides an important, new idea for the development of a new generation of safe, efficient, and environmentally friendly tear gas mixtures.

1. Introduction

As the main charge of combustion tear gas, the combustion tear gas mixture plays an important role in dealing with sudden mass incidents and preventing and dealing with terrorist activities [1,2]. At present, potassium chlorate (KClO3) is used as an oxidant, sucrose (C12H22O11) is used as the combustible agent, and capsicum oleoresin (OC) is used as the tear agent in the formulation of this kind of mixed agent. The redox reaction of the oxidant and the combustible agent provides energy for the sublimation of the tear agent. However, due to the relatively poor thermal stability of OC, in order to maximize the functional efficiency of the tear agent in the mixed agent and improve its effective utilization rate, the energy released during the combustion of the mixed agent must be controlled. If the energy is too great, the combustion temperature will be too high, which will lead to the thermal decomposition of the tear agent in the process of heat release. On the other hand, if the energy is too small, it will delay the heat release efficiency of the tear agents in the system and even cause the release velocity to be too slow, making it difficult to reach the combat concentration in a short time, which will greatly reduce the technical and combat effectiveness of this kind of ammunition [3,4,5,6,7]. At the same time, the products formed by incomplete thermal diffusion will also aggravate the burden on the environment. Therefore, it is very important to study the combustion characteristics of its formula in order to improve the effective utilization of the lacrimal agent OC in the system and improve the action efficiency of this kind of mixed agent [8].
Through a literature review [9,10,11], it was found that 5-amino-1h-tetrazole (5AT), as an environmentally friendly combustible agent, has been greatly developed as a solid propellant and in other fields. Its greatest advantage is that, compared with other nitrogen-containing compounds, its nitrogen mass fraction is as high as 82.3%, and the combustion product is harmless N2, with high gas production, which is more conducive to the diffusion of the functional elements in the mixture. 5AT is considered to be an ideal fuel in gas generators with a low combustion temperature. The latest research results have shown that adding an appropriate amount of 5AT instead of a sugar compound as the combustible agent in the formula of colored smoke pyrotechnic agents can significantly improve the smoke’s performance in action efficiency and durability [12,13,14,15].
However, no attempt has been made to improve the formula of combustion-type tear gas mixtures. Based on the similar principle of action between combustion-type colored smoke agents and combustion-type tear gas mixtures [16], on the basis of an unchanged oxygen mass fraction coefficient (OB), this study attempted to introduce 5AT in different proportions such as 0%, 5%, 10%, 15%, and 20% into the system as the second combustible agent to obtain five groups of different formulas. TG-DSC, a thermocouple, and a laser smoke test system were used to characterize the characteristic parameters of combustion, such as the combustion temperature and velocity, as well as the end-point effects such as smoke concentration and particle size. The apparent activation energy, pre-exponential factor, and other thermodynamic parameters in the pyrolysis process were obtained by Starink’s method and the Flynn–Wall–Ozawa method. At the same time, in order to further explore the pyrolysis mechanism of combustion, the possible reaction models in the pyrolysis process of the different formulations were deduced by the Coats–Redfern model-fitting method. The study provides valuable guidance for improving the performance and combustion mechanism of this kind of mixture.

2. Experiment and Method

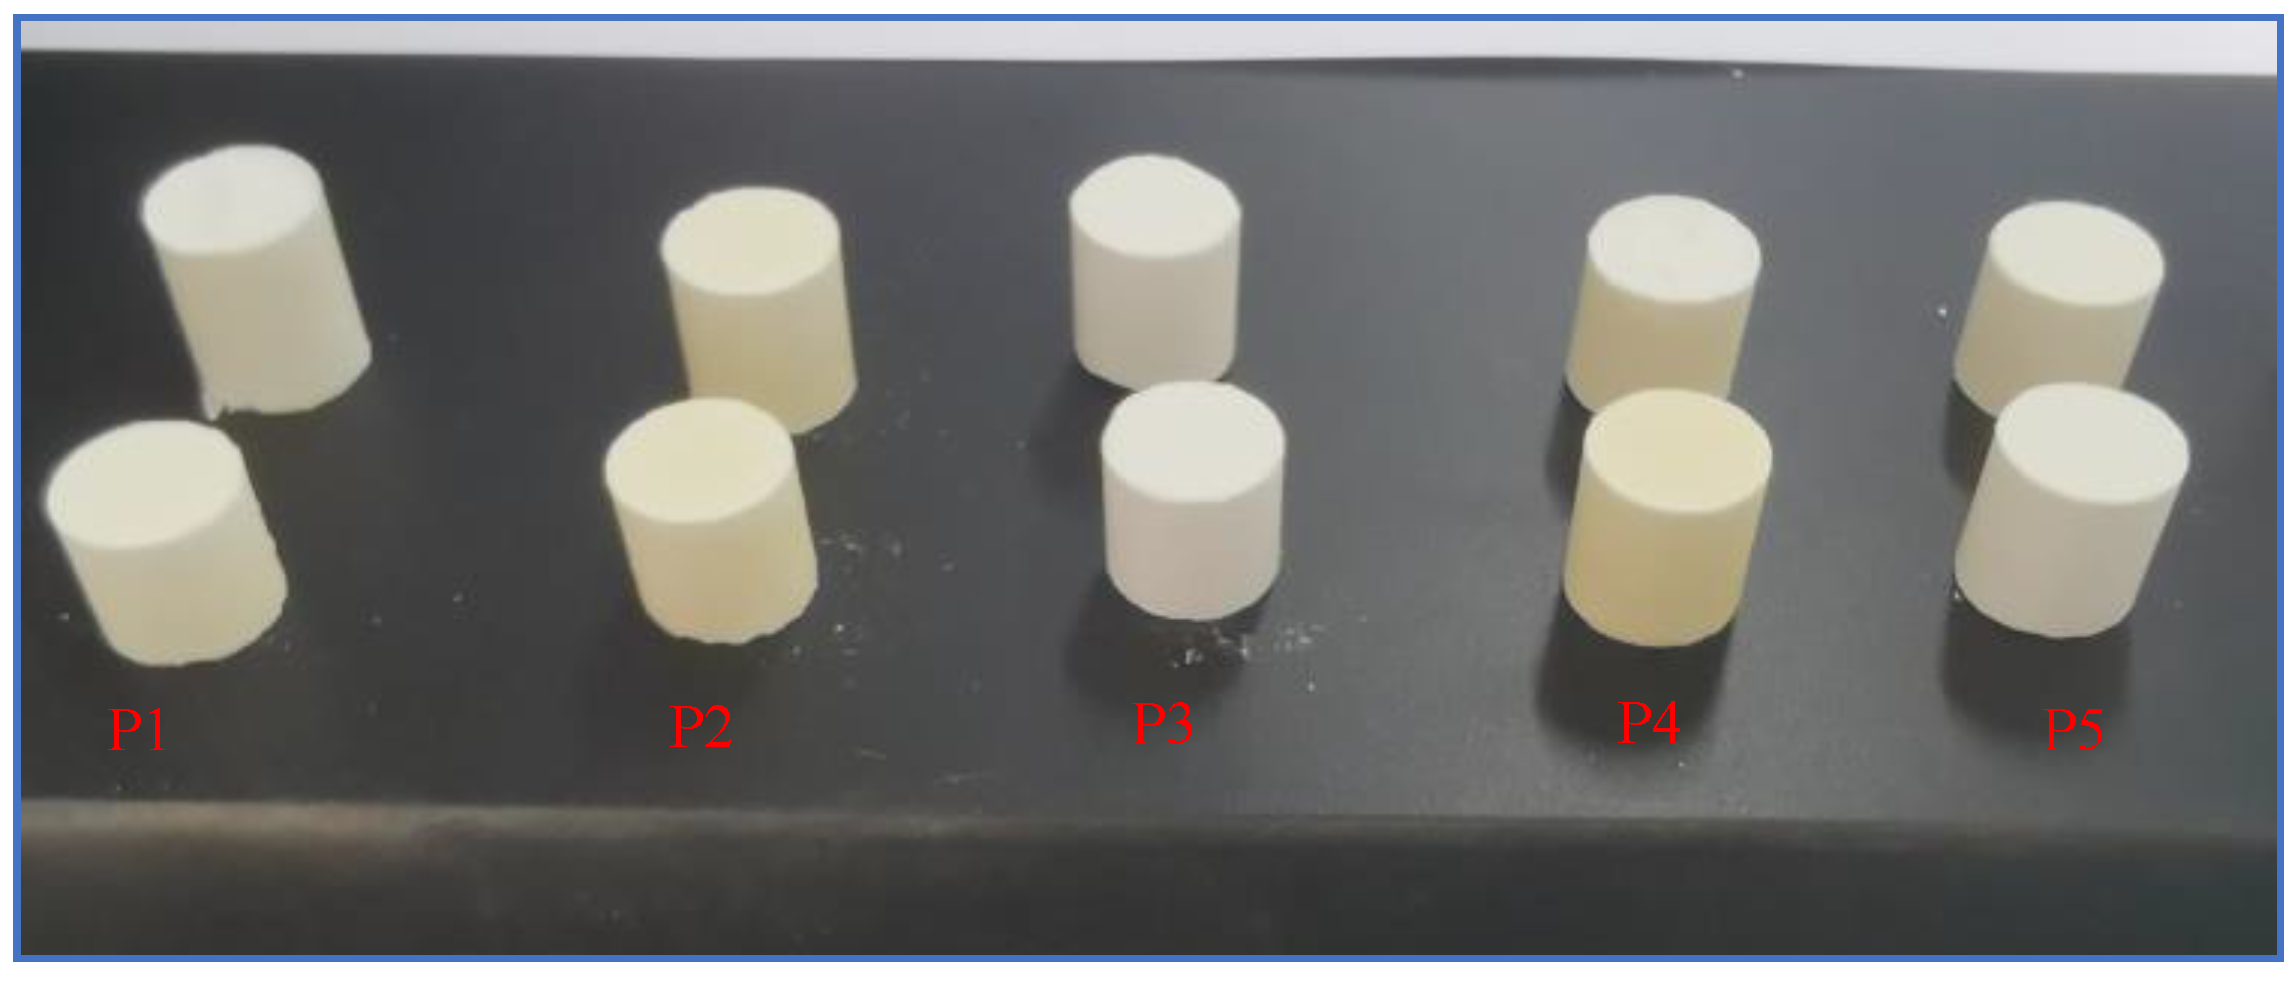
2.1. Materials and Main Experimental Equipment

The main raw materials were chemically pure capsicum oleoresin, OC for short (C18H27NO3) from Aldrich, St. Louis, MO, USA, and potassium chlorate (KClO3), lactose (C12H22O11), 5-amino-1h-tetrazole (CH3N5), phenolic resin ((C8H6O2)n) and basic magnesium carbonate ((MgCO3)4·Mg(OH)2·5H2O), all of which were analytically pure and purchased from Aladdin Biochemical Technology Co., Ltd., Shanghai, China.
The main test equipment was an HS-STA-002 synchronous thermal analyzer (sensitivity: 0.01 mg) produced by Hesheng Instrument Technology Co., Ltd., Shanghai, China, with a resolution of 0.06 mV, a test temperature range of room temperature to ~1000 °C, a temperature test accuracy of ±0.05 °C, and a calorimetric sensitivity of ±0.5%.
Other equipment included an analytical balance (BSA224S-CW) produced by Saidoris Instrument System Co., Ltd., Gottingen, Germany; a K-type thermocouple (FLUKE53-2B) produced by Fluke company, Everett, America; an intelligent digital display vacuum drying oven (DHG-9140) produced by Donglu Instrument and Equipment Company, Shanghai, China; a high-speed camera (X8PRO) produced by Mingce Electronic Technology Company, Shanghai, China; and a smoke concentration test system (JCY-80e) produced by Chuangyi Environmental Testing Equipment Co., Ltd., Qingdao, China.
The samples were prepared according to different formulations designed by a uniform design method, as shown in Table 1. Figure 1 shows the sample preparation flowchart, and Figure 2 shows five different prepared samples.

2.2. Test of Combustion Characteristics

2.2.1. Combustion Temperature Test

In order to reduce the influence of the oxygen concentration in the external environment on the combustion environment of the sample, the test ignited each sample in an N2 environment, measured the temperature with a K-type thermocouple, and recorded the whole process with a high-speed camera. Three groups of tests were conducted for each group of samples, and the average value of the three groups of data was taken as the measurement result [17].

2.2.2. Burning Rate Test

The burning rate is also one of the important indexes used to measure the combat effectiveness of combustion tear gas mixtures. The burning rate can have a direct impact on the smoke effect of the agent. Linear velocity or mass velocity is usually used for pyrotechnic agents. In general, the burning rate generally refers to the linear burning rate, which refers to the displacement of the combustion wave in front of the mixed grain along its normal direction in units of time [18], and it is expressed as:
v = d l d t ( mm / s )
where v is the linear burning rate of the mixed grain, and dl is the displacement of the combustion wave of mixed grain along its normal direction in time dt (unit: mm/s). During the test, an electric igniter was used to ignite the grain, and the test was carried out in the smoke box in an N2 environment.

2.3. Test of Combustion Smoke Characteristics

In order to characterize the combustion smoke concentration and particle size distribution of the sample, a laser smoke concentration tester was used for testing, and the data were collected and analyzed with software. Its principle is shown in Figure 3. The samples’ specifications are cylinders with a diameter of 15 mm and a height of 20 mm. The specifications of the smoke collection box are 50 cm × 50 cm × 50 cm.

2.4. Thermal Behavior Analysis

In order to study the thermal behavior of the sample, an synchronous thermal analyzer was used. Before the test, we first calibrated the differential thermal analysis baseline and temperature of the synchronous thermal analyzer and then placed about 8–10 mg of the different samples into the ceramic crucible and heated the samples from 30 °C to 600 °C at a heating rate of 5, 10, 15, and 20 °C·min−1. In order to avoid environmental impact, the whole test process was carried out in an N2 atmosphere, and the ventilation rate was 40 mL·min−1.

2.5. Pyrolysis Kinetics

In order to further explore the reaction mechanism of each stage in the combustion process of the combustion tear gas mixture, Starink’s method and the Flynn–Wall–Ozawa method with high accuracy were selected to calculate the corresponding thermal decomposition kinetic parameters [19,20,21,22] and the Coats–Redfern equation was used to predict the pyrolysis reaction model of each stage of the sample and to thus determine the reaction type of each stage so as to provide a certain theoretical basis for an in-depth study and improvement of its combustion environment.
The equation of Starink’s method [23] is:
ln β T 1.8 = 1.008 E a R T + C
The equation of the Flynn–Wall–Ozawa method [24,25] is:
ln β + 0.4567 E a R T = C
The Coats–Redfern method equation [26] is:
ln g ( α ) T 2 = ln [ A R β E a ( 1 2 R T E a ) ] E a R T
where β is the heating rate, T is the characteristic temperature, is the activation energy of the reaction, R is the molar gas constant, and A is the pre-exponential factor of the reaction.
By combining 17 common g(α) substitutes into Equation (4), we can solve the linear correlation coefficient between ln[g(α)/T2] and 1/T. When the calculated linear correlation coefficient reaches the maximum, the corresponding reaction model of the selected g(α) is the reaction model of the sample at this stage. The 17 commonly used reaction models are shown in Table 2 [27].

3. Results and Discussion

3.1. Analysis of the Combustion Characteristics

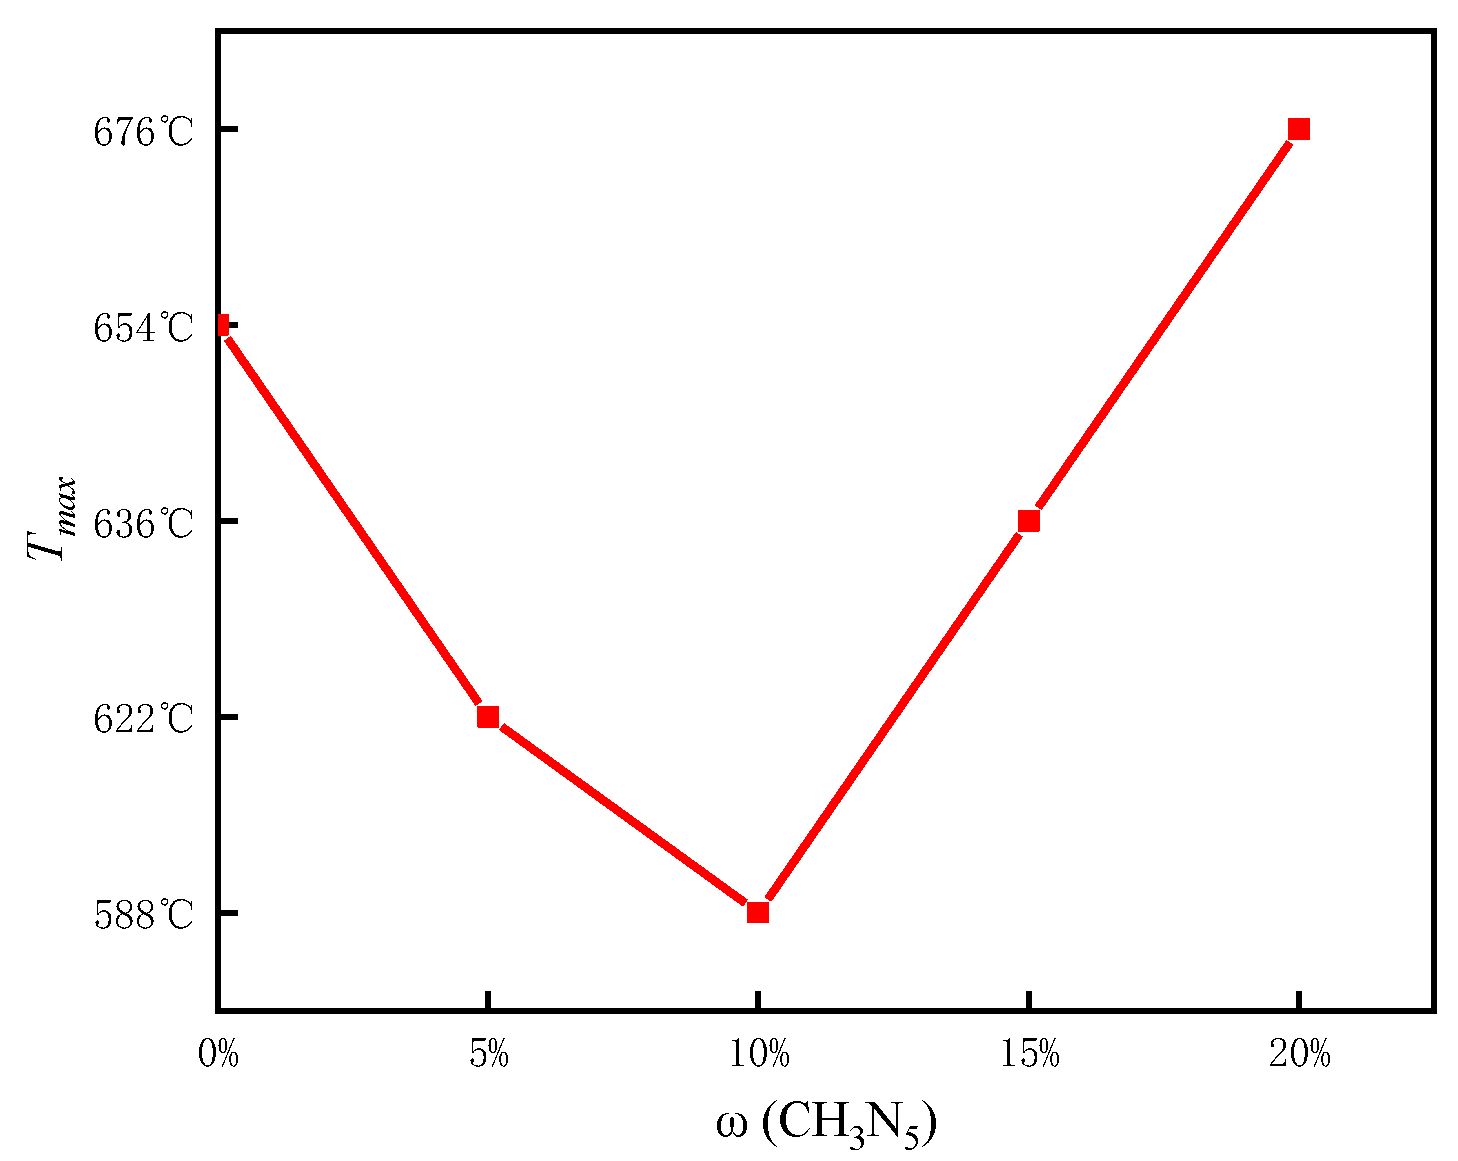
3.1.1. Combustion Temperature Analysis

Figure 4 shows the combustion temperature-time distribution of Samples P1–P5 measured by the thermocouple method. It can be seen that the order of the maximum combustion temperature (Tmax) of the samples is Tmax (P5) > Tmax (P1) > Tmax (P4) > Tmax (P2) > Tmax (P3). At the same time, it is not difficult to see that when the mass fraction of 5AT is 10%, the combustion temperature of the sample is the lowest (588 °C), but when the mass fraction of 5AT is 20%, the combustion temperature of the sample is the highest (676 °C); the difference between them is nearly 90 °C. This shows that 5AT has a great influence on the combustion temperature of the system.
Figure 5 shows the variation trend of the maximum combustion temperature of samples with different 5AT mass fractions in the system. It was found that with an increase in the 5AT mass fraction, the maximum combustion temperature first decreases and then increases. When the mass fraction of 5AT is less than 10%, the combustion temperature of the system decreases with an increase in the 5AT mass fraction, but when the mass fraction of 5AT is more than 10%, the combustion temperature of the system increases with an increase in the 5AT mass fraction. This is mainly related to the redox reaction of 5AT with the oxidant KClO3 and its own pyrolysis reaction. Among these, the former is an exothermic reaction and the latter is an endothermic reaction. When the mass fraction of 5AT in the system is less than 10%, the heat released by 5AT participating in the redox reaction in the system is less than the heat absorption required for its own pyrolysis, so the overall combustion temperature of the system decreases. When the mass fraction of 5AT in the system is higher than 10%, the heat release of 5AT participating in the reaction is greater than the heat absorption required for its own pyrolysis, so the overall combustion temperature of the system will rise.

3.1.2. Analysis of Burning Rate

Table 3 shows the burning rate of Samples P1–P5 in the same nitrogen atmosphere, with an air pressure of 0.1 MPa, room temperature T = 20 °C, and relative humidity RH = 30%. The results show that under the same atmospheric conditions, the burning rates of samples with different formulas show little difference. The maximum is 1.08 mm·s−1, the minimum is 1.03 mm·s−1, and the difference is only 0.05 mm·s−1, which is basically the same level of burning rate. This shows that when all the other conditions are the same, the addition of 5AT to the system does not affect the overall combustion rate of this kind of mixture.

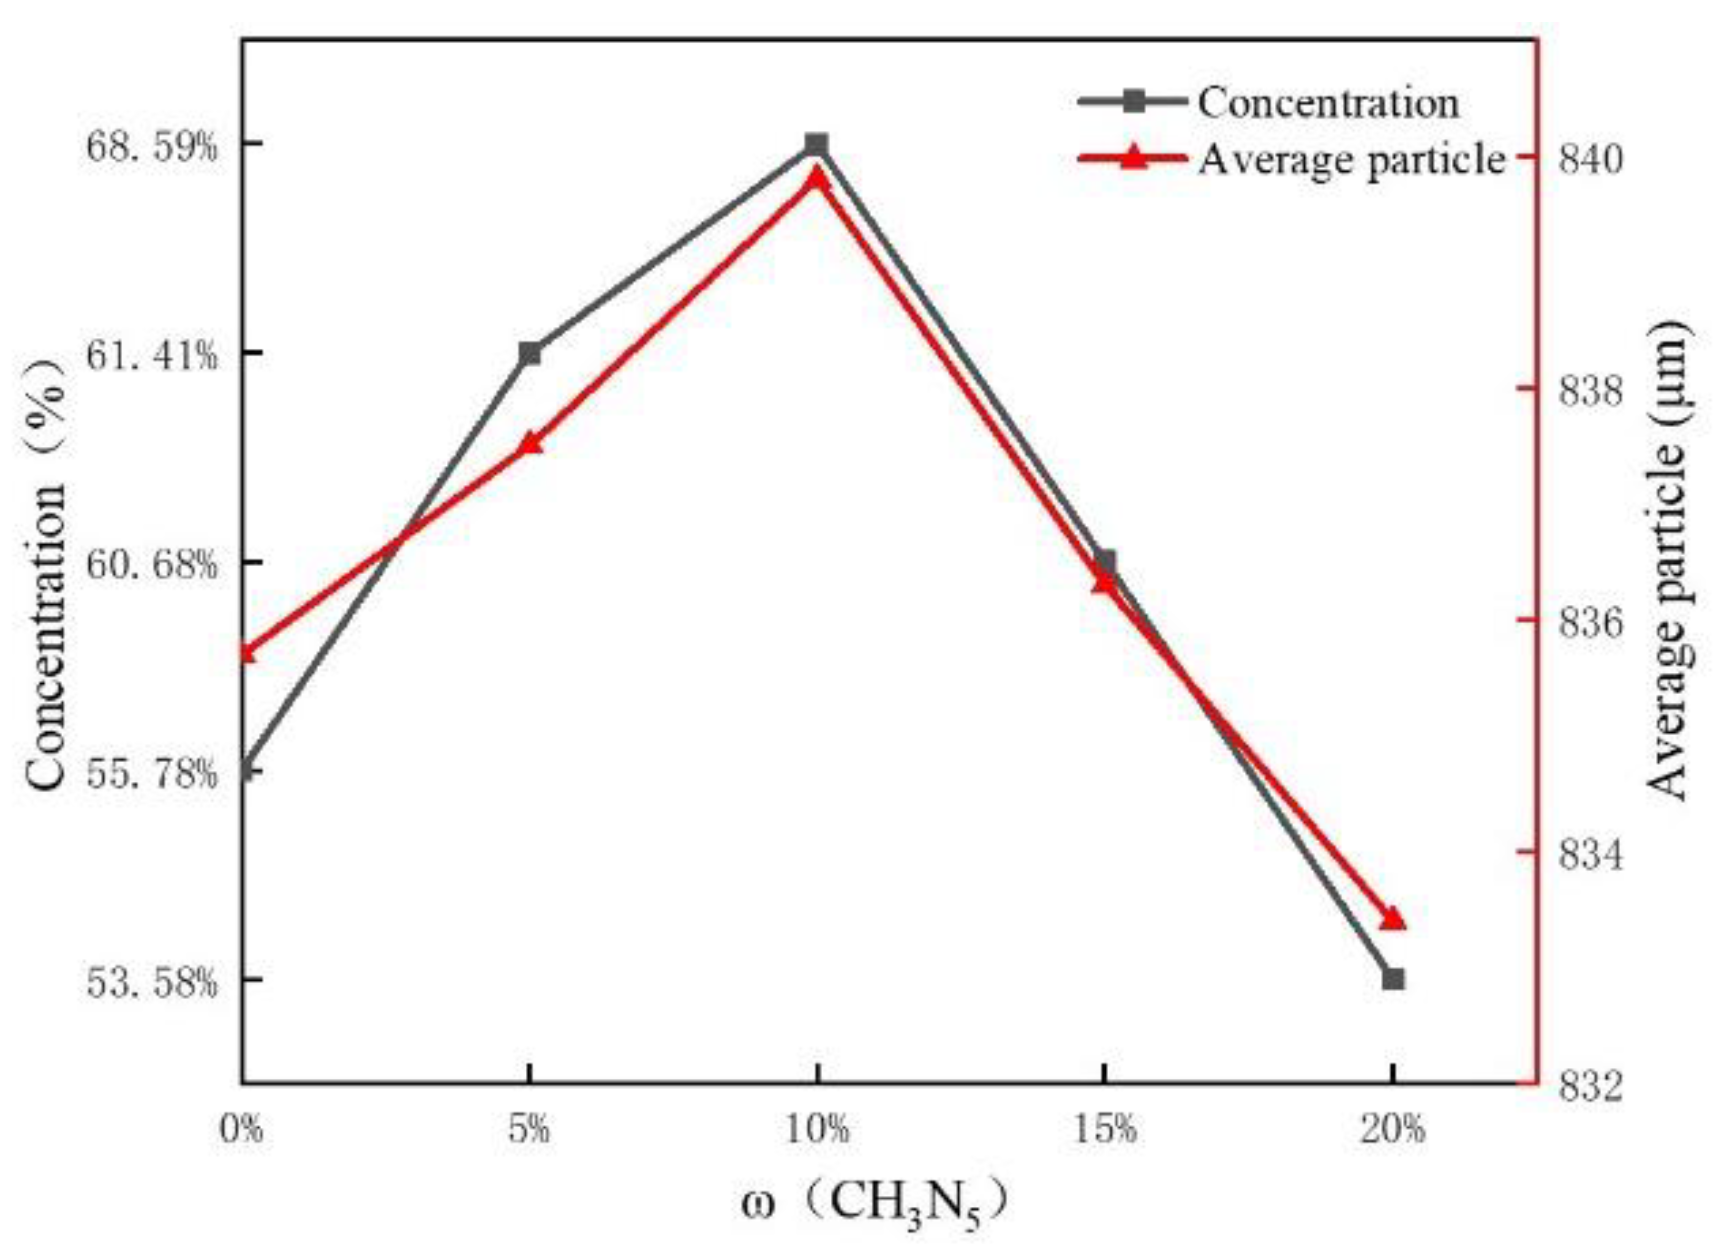
3.2. Smoke Characteristic Analysis

In order to evaluate the effect of 5AT on the thermal diffusion effect of the tear agent in combustion tear gas mixtures, the smoke concentration and particle size distribution of the samples were characterized; the results are shown in Figure 6 and Figure 7. Figure 6 shows the particle size distribution of the combustion smoke of Samples P1–P5. It can be seen from the figure that the average particle size of the combustion smoke of Samples P1–P5 is mainly distributed between 833.4–839.8 µm. The relationship between the smoke concentration and average particle size of different samples and the mass fraction of 5AT in the system is shown in Figure 7. It is not difficult to see that when the mass fraction of 5AT in the system is less than 10%, the smoke concentration (C) and average particle size (AP) show an increasing trend. When the amount of 5AT in the system is 10%, the C and AP values of smoke reach the maximum, which are 68.59% and 839.8 μm, respectively. When the mass fraction of 5AT in the system is greater than 10%, the C and AP values of the sample smoke show a decreasing trend. When the mass fraction of 5AT in the system is 20%, the C and AP values of the smoke are the smallest: 53.58% and 833.4 µm, respectively.
Compared with the ranking of the maximum combustion temperature (Tmax) of the different formulations measured above, the rankings for smoke concentration and the average particle size of different samples were just the opposite; that is, the higher the Tmax, the smaller the corresponding C and AP values. On the contrary, the lower Tmax, the greater the corresponding C and AP values. This may be related to the thermal decomposition of the tear agent OC during the combustion process of the system; that is, when the combustion temperature is higher, the amount of OC will increase, and the corresponding C value will decrease. With the thermal decomposition of the tear agent OC, the corresponding smoke AP value will decrease.

3.3. Pyrolysis Behavior Analysis and Related Kinetic Analysis

3.3.1. Thermal Behavior Analysis of Individual Components

Figure 8 shows the distribution of each individual component in the mixed reagent system as the TG-DSC-DTG curve at β = 10 °C·min−1. According to the TG curve, compared with other components in the system, the temperature at which the oxidant KClO3 begins thermal decomposition is higher. Near 400 °C, the decomposition process is mainly one stage, and the weight loss ratio is about 30%.
The temperature of the thermal decomposition of 5AT is the lowest, which starts near 200 °C. There is an obvious endothermic peak in the weight loss process of thermal decomposition, indicating that its thermal decomposition is mainly an endothermic process [28]. According to the weight loss trend of the TG curve, the weight loss process is mainly divided into three stages, for which the weight loss ratio is about 40%, 10%, and 30%.
Compared with sucrose, which is also a combustible agent, the temperature when sucrose starts thermal decomposition is slightly higher than that of 5AT; the weight loss begins near 210 °C, and there is an exothermic peak in the thermal decomposition process [29], indicating that the thermal decomposition of sucrose is mainly an exothermic process. According to the weight loss trend of the TG curve, the weight loss process is mainly divided into two stages: the weight loss ratio of the first stage is about 70%, and the weight loss ratio of the second stage is about 30%.
According to the TG-DSC-DTG curve of the lacrimal agent OC and previous research [8,30], the endothermic peak near 58 °C corresponds to its melting point. The weight loss phenomenon begins at around 230 °C, and the weak exothermic phenomenon does not appear until near 340 °C. In this temperature range, the DTG curve corresponds to an obvious pyrolysis weight loss peak, which is mainly considered to be the thermal diffusion process of OC. The second exothermic peak near 500 °C corresponds to the thermal decomposition of OC, and the weight loss ratio in this stage is about 10%.
According to the TG-DSC-DTG curve of the basic coolant magnesium carbonate and previous studies [31], the pyrolysis process is mainly divided into two stages. The temperature range of the first stage is 220–360 °C, and the weight loss ratio is about 16%. This is considered to mainly be the loss process of crystal water. The temperature range of the second stage is 360–500 °C, and the weight loss ratio is about 55%, which is basically consistent with the theory of complete pyrolysis to produce carbon dioxide, magnesium oxide, and water.

3.3.2. Thermal Behavior Analysis of the Samples

DSC Analysis of the Samples

Figure 9 shows the TG-DSC curve of Samples P1–P5 at a heating rate of β = 10 °C·min−1. According to the DSC curve, in the temperature range of 30–600 °C, the formulae of Samples P1–P4 mainly correspond to four thermal behaviors, which are the primary endothermic phenomenon and the tertiary exothermic phenomenon successively (the corresponding peak temperatures are T1, T2, T3, and T4).
However, P5 corresponds to five thermal behaviors, namely the primary endothermic phenomenon and four exothermic phenomena (the corresponding peak temperatures are T5-1, T5-2, T5-3, T5-4, and T5-5), as shown in Table 4.
It can be seen from the characteristic peak temperatures in Table 4 that the thermal behavior of the formulae of Samples P1–P4 is basically the same. From P1 to P4, with the increase in 5AT mass fraction in the formula, the first exothermic peak T2 gradually decreases and the third exothermic peak T4 gradually increases, while the endothermic peak T1 and the second exothermic peak T3 have no obvious change. In combination with the TG-DSC-DTG curve of individual components in the previous section, it can be seen that the endothermic peak T1 and the second exothermic peak T3 of P1–P4 correspond to the melting point of OC in the system and the temperature at which pyrolysis begins. The first exothermic peak, T2, is mainly caused by the exothermic oxidation–reduction reaction of the oxidant KClO3, combustible C12H22O11, and 5AT. With an increase in 5AT, the initial temperature of the reaction at this stage moves to the left, and the peak’s shape gradually becomes gentle, which indicates that the addition of 5AT can slow down the intensity of the reaction, which may be related to the need to absorb some heat for the decomposition of 5AT [32,33]. Compared with P1–P4, P5 also has a weak exothermic peak in the temperature range of 200–300 °C. In combination with the changes in the components in the formula and the pyrolysis curve of each individual component, it is considered that the exothermic phenomenon is related to the fact that the heat released by 5AT participating in the reaction in the system begins to be greater than the heat absorbed by its own pyrolysis.
The exothermic peak of Samples P1–P5 near 330 °C mainly corresponds to the initial thermal decomposition of OC in the system. The exothermic enthalpy corresponding to each exothermic peak is shown in Table 5. It can be seen that with an increase in the 5AT mass fraction in the system, the exothermic enthalpy at the corresponding position first decreases and then increases. The corresponding exothermic enthalpy of P3 is the smallest, which indicates that the amount of thermal decomposition of OC in P3 is the smallest, which is the same as the smoke concentration of P3 measured above. The results are basically consistent with those of the largest average particle size.

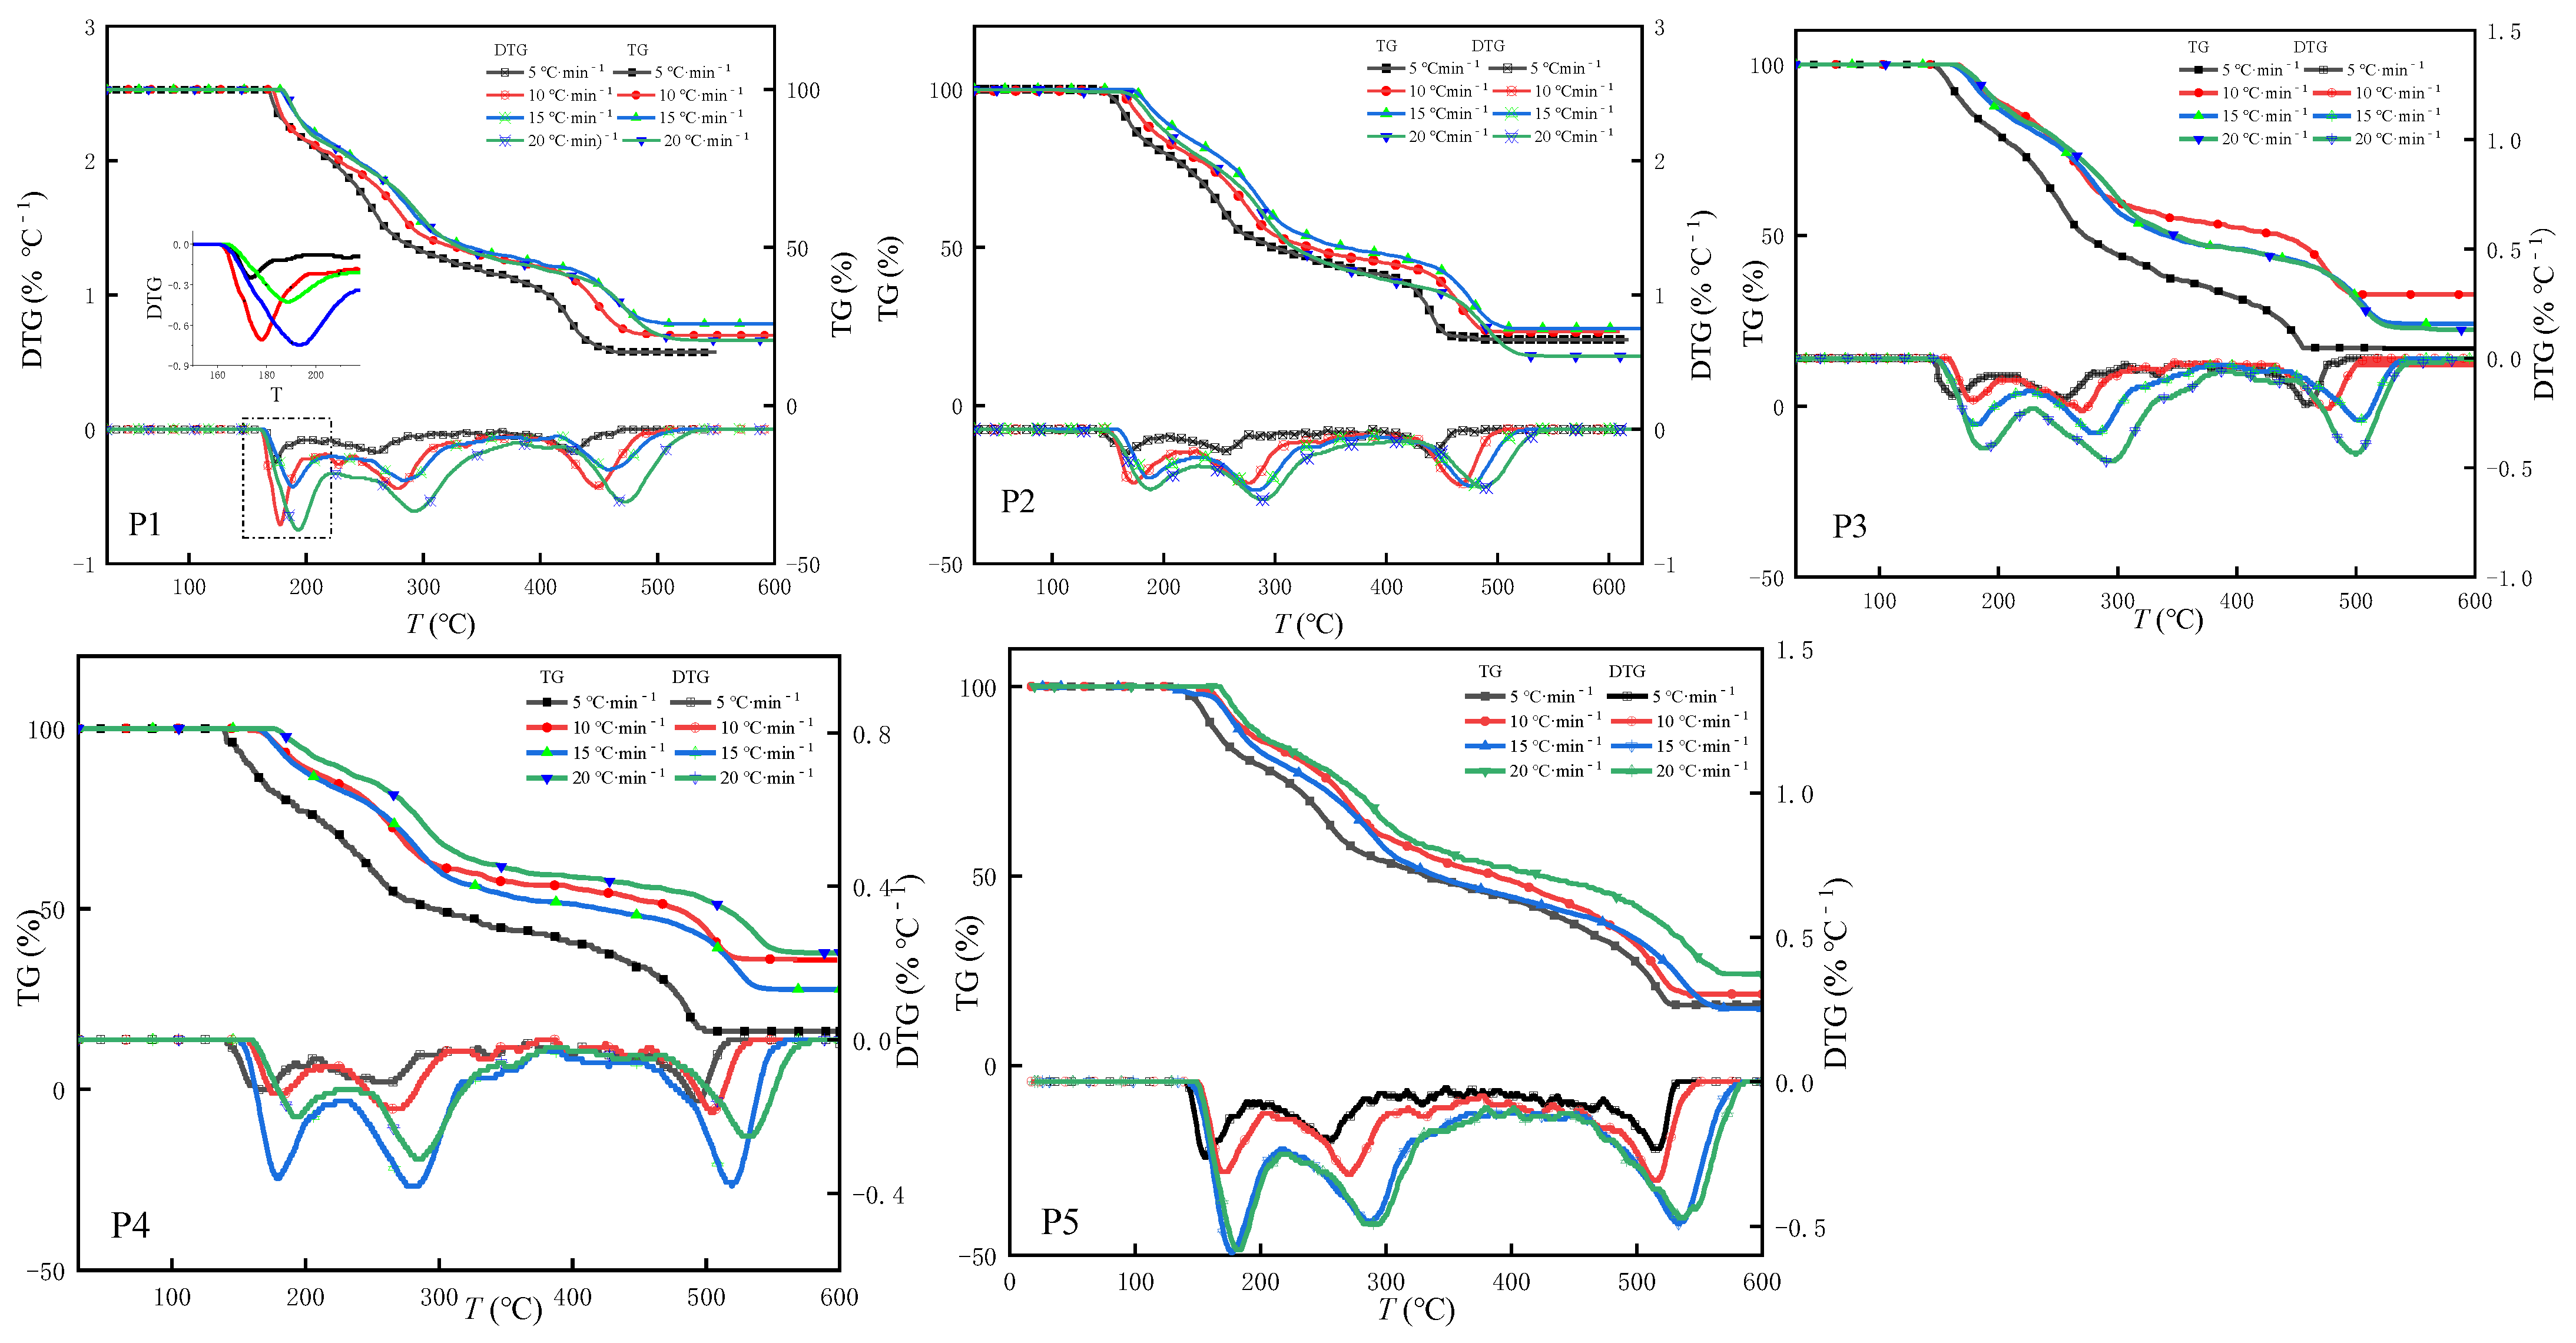
TG-DTG Analysis of the Samples

Figure 10 shows the TG-DTG curve of Samples P1–P5 at β = 10 °C·min1. In the DTG curve of the samples, the thermogravimetric process of the samples can be divided into several different stages according to the peak value corresponding to the mass loss rate of the samples.
Table 6 shows the characteristic values such as the initial temperature, the temperature corresponding to the DTG peak value, and the thermal weight loss ratio at each stage. From the TG-DTG curve, it can be seen that the pyrolysis weight loss process of P1–P5 is mainly divided into four stages in the temperature range of 30–600 °C. Combined with the curve in Figure 10, the first weight-loss stage is 150–220 °C, and an obvious DTG peak can be observed at this stage, in which the peak shape of P1 is the sharpest, indicating that the reaction is violent, and the peak value of the corresponding curve is 0.71% °C−1. With an increase in the 5AT mass fraction in the system, the exothermic peak tends to be gentle. The peak values of the corresponding curves of P2–P5 are 0.4% °C−1, 0.14% °C−1, 0.19% °C−1, and 0.31% °C−1, respectively. Compared with P1, the DTG peak in the corresponding stages decreases significantly. According to Table 6, the thermal weight loss ratio ML1 corresponding to P1 at this stage is the largest. In combination with the previous research results of this kind of mixed agent [34], it can be considered that the redox reaction between the combustible agent and the oxidant has occurred in this stage. The peak value of P1′s curve is the largest, and the thermal weight loss ratio is the largest, which is caused by the violent reaction between the combustible C12H22O11 and the oxidant KClO3 at this stage.
The temperature range of the second stage is 190–320 °C. At this stage, except for P5, which corresponds to a weak exothermic peak, the other formulae have no obvious heat absorption and exothermic phenomena. The DTG curve of this stage corresponds to an obvious peak, indicating that the thermal weight loss at this stage is obvious. In combination with the properties of each component in the mixed agent and relevant research results, it can be determined that this mainly corresponds to the thermal diffusion process of OC in the mixed agent; that is, the greater the weight loss ratio at this stage, the greater the amount of OC for effective thermal diffusion. When the heating rate of Samples P1–P5 is 10 °C min−1, the thermal weight loss ratio of this stage is 26.7%, 27.5%, 28.9%, 27.1%, and 24.8%, respectively. It can be seen that the weight loss ratio of P3 is the largest, while the weight loss ratio of P5 is the smallest. The corresponding order is consistent with the concentration of each sample measured above. Therefore, appropriately increasing the mass fraction of 5AT in the system can improve the effective utilization rate of the lacrimal agent OC in the system.
The temperature range of the third stage is 270–440 °C. A weak exothermic peak can be observed at this stage, and the temperature of this exothermic peak is consistent with the corresponding exothermic peak in the TG-DTG curve of the individual component OC. Therefore, it can be determined that this exothermic peak is related to the exothermic pyrolysis of OC.

3.3.3. Analysis of the Pyrolysis Kinetics of the Samples

In order to further explore the thermal decomposition mechanism of Samples P1–P5 and to calculate the kinetic parameters of each stage of the reaction, Starink’s method and the Flynn–Wall–Ozawa method were used [35,36,37]. The TG-DTG curve of Samples P1–P5 at different heating rates is shown in Figure 11. The corresponding characteristic peak temperature of each stage at different heating rates for each sample is shown in Table 6.

Starink’s Method

Based on the measured TG-DTG curves of P1–P5 at different heating rates, combined with the characteristic peak temperatures of the four stages in Table 6, the value of ln(β/TP1.8) and 1/TP can be obtained for the sample across the four pyrolysis stages [23]. Taking 1/TP as the independent variable and ln(β/TP1.8) as the dependent variable, we then carried out linear fitting to obtain the slope of the fitting line and substituted it into Equation (2) to obtain the activation energy Ea at this stage.
The linear fitting results of ln(β/TP1.8) and 1/TP are shown in Figure 12, and the results of calculating the activation energy Ea for each stage are shown in Table 7. The correlation coefficient R2 represents the accuracy of the fitting results, and the closer it is to 1, the higher the reliability.
It can be seen from the results that with the same OB, with the addition of 5AT to the mass fraction, the activation energy of the first and second stages of P2–P5 shows a decreasing trend compared with P1, which confirms that the starting temperature of the component reaction after the addition of 5AT mentioned in the pyrolysis behavior analysis is significantly lower, which plays a certain role in promoting the reaction at this stage. In addition, if we compare the activation energies of the first and second stages of each formula, it can also be seen that only the activation energy of P3 in the second stage is significantly lower than that of the first stage, indicating that P3 can spontaneously carry out the second stage reaction after the first-stage reaction, which again confirms the reason why the weight loss ratio of P3 in the second stage is significantly higher than that of other samples. The activation energy of the third stage of P2–P5 increases significantly compared with that of P1, which may be related to a large amount of heat absorbed by the pyrolysis of 5AT. With a continual increase in the mass fraction of 5AT, the activation energy corresponding to this stage also increases accordingly.
Based on the measured TG-DTG curve data (Table 6), the corresponding temperature value 1/T at the same value of conversion α is an independent variable and lnβ is a dependent variable. The obtained data points were linearly fitted, then the slope of the straight line was obtained. By substitution in Formula (3), the activation energy Eα corresponding to the reaction conversion α can be obtained at this stage [24,25]. Figure 13 shows the activation energy curve of Samples P1–P5 at each stage obtained via the Flynn–Wall–Ozawa method.
The activation energy of each stage for P1–P5 obtained by the Flynn–Wall–Ozawa method (Figure 13) is basically consistent with the activation energy of each stage obtained by Starink’s method (Table 7), which further verifies the reliability of the kinetic parameters obtained by this method.
In addition, according to the activation energy curve of each stage of the mixed reagent obtained by the Flynn–Wall–Ozawa method, the reaction activation energy at the first, third, and fourth stages of thermal decomposition of Samples P1–P5 varies with α. This shows that the three-stage reaction process is a multi-step reaction, which is basically consistent with the results of the pyrolysis analysis. In the second stage of thermal decomposition, when α > 0.3, there is an independent linear relationship between the corresponding reaction activation energy and the conversion α. This shows that the thermal decomposition process of the sample at this stage is mainly a one-step reaction, which confirms that this stage is mainly the thermal diffusion process of the tear agent OC in the analysis of the pyrolytic behavior.

Prediction of the Reaction Model of Samples P1–P5

In order to further explore the reaction mechanism of the thermal decomposition process of the main charge mixture, the Coats–Redfern method [26,38] was used to predict the most likely reaction model at each stage. According to 17 common reaction mechanism functions (Table 3), the linear fitting results of ln[g(α)/T2] and 1/T corresponding to the pyrolysis reaction at different stages are shown in Figure 14 (the maximum correlation coefficient has been marked in red in the figure). Table 8 shows the reaction models of four stages in the pyrolysis process of Samples P1–P5. In Figure 14 and Table 8, we can see the correlation coefficient obtained by fitting the data based on each reaction mechanism function and the most likely model of each stage of Samples P1–P5.
From these results, it can be seen that the reaction models of the first, third, and fourth stages of the sample change significantly when different amounts of 5AT are added to the sample, which shows that the reaction models of each stage can be effectively changed by adding 5AT. At the same time, it also further explains the relevant mechanism of Samples P1–P5 corresponding to their different combustion characteristics. In addition, for the second stage, which is most suitable for OC’s thermal diffusion temperature range, the reaction model maintains a high degree of consistency, which further verifies the correctness of the physical thermal diffusion weight loss theory of OC in the second stage of pyrolysis weight loss. The discovery of this theory is of great significance for studying and improving the smoke characteristics of combustion tear gas mixtures.

4. Conclusions

The conclusions regarding the combustion pyrolysis characteristics and kinetic analysis of a combustion-type tear gas mixture based on 5AT are as follows:
  • Through a comparison of the maximum combustion temperature and the linear combustion rate of Samples P1–P5 with different amounts of 5AT, it was found that when the amount of 5AT is 10%, the maximum combustion temperature of the sample can be reduced by nearly 70 °C under the condition that the linear combustion rate is basically unchanged, thus improving the combustion environment of the mixture.
  • If we compare the Tmax of Samples P1–P5, and the C and AP of smoke, it can be seen that the C and AP of smoke are inversely proportional to the Tmax of the sample. The higher the Tmax of the mixture, the smaller the C and AP values of the corresponding tear gas. As the combustion temperature of the mixed agent is higher, the amount of the pyrolytic tear agent OC in the agent will be greater, and the concentration and particle size of the smoke will be reduced. Combined with the exothermic enthalpy near 340 °C of the DSC curve and the weight loss ratio at the second stage of pyrolysis of Samples P1–P5, this observation is again confirmed. Therefore, adding an appropriate amount of 5AT is of great significance for improving the smoke characteristics of combustion tear gas mixtures.
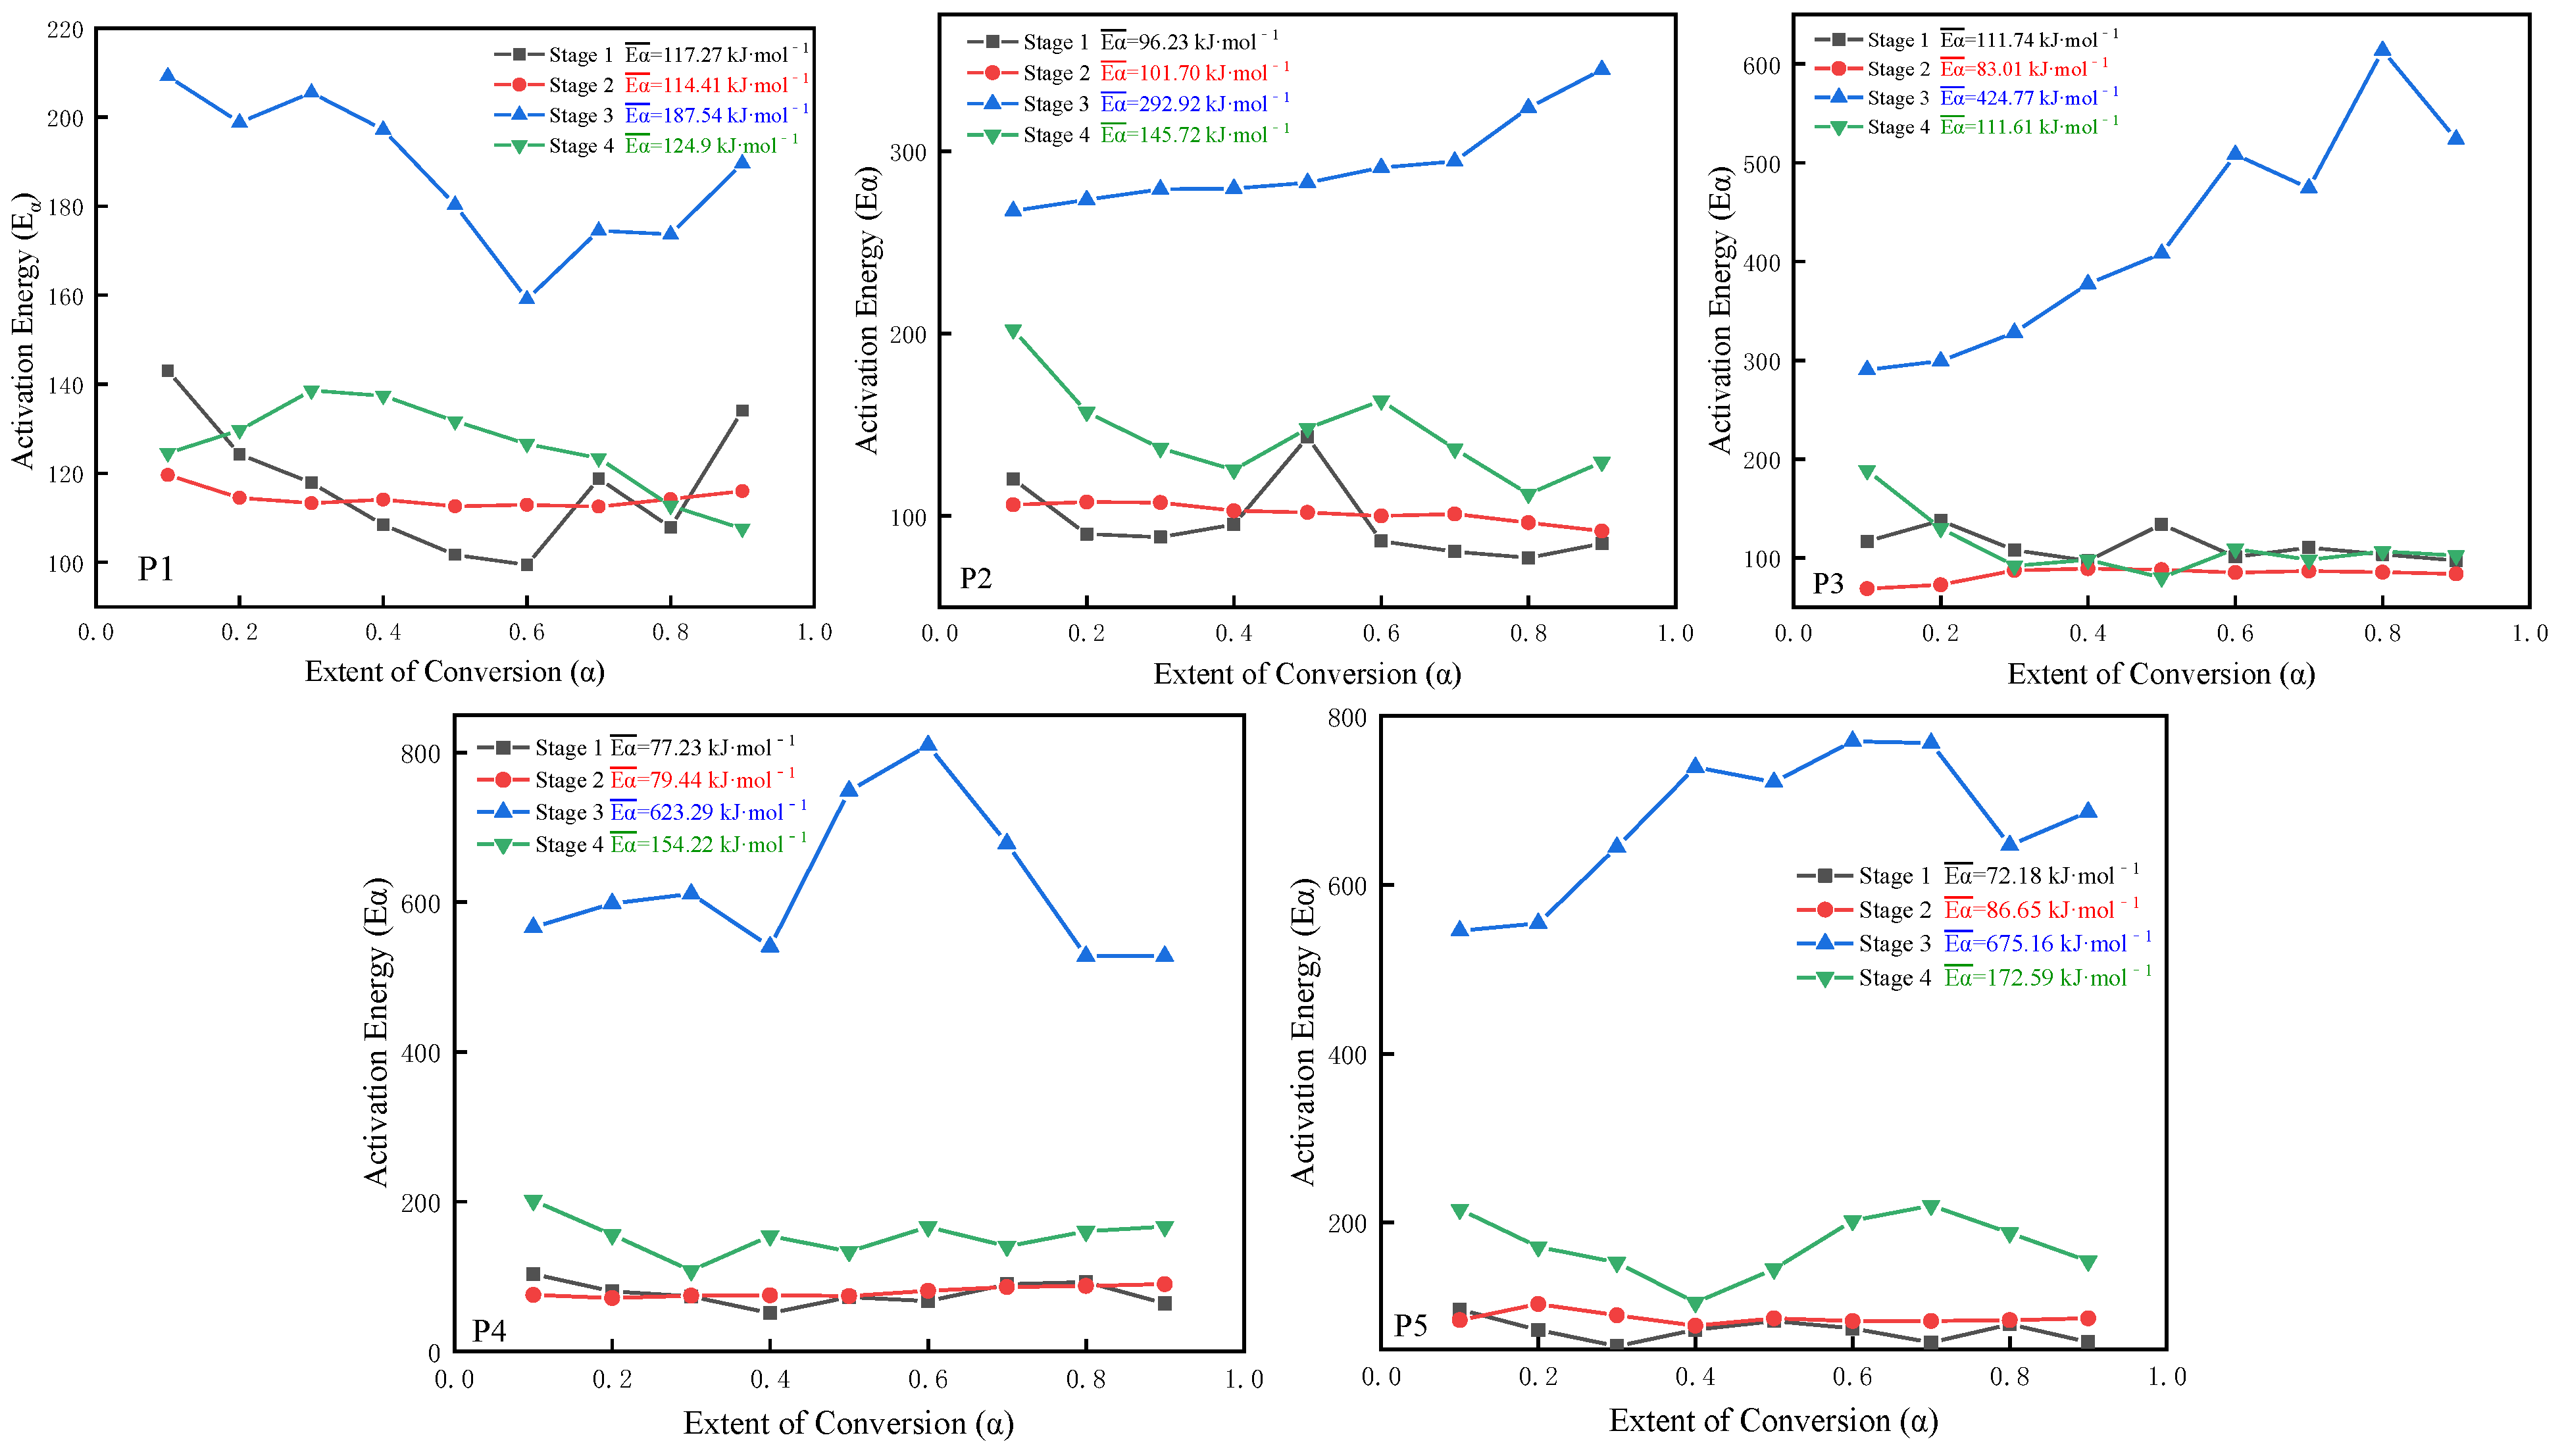
  • The results of calculating the activation energy of Samples P1–P5 at each stage via Starink’s method and the Flynn–Wall–Ozawa method are basically the same, which further verifies that the kinetic parameters obtained by these methods have high reliability. When the OB value in the formula’s design is fixed, with the addition of the 5AT mass fraction, the activation energy of the first and second stages of Samples P2–P5 shows a decreasing trend compared with P1, which confirms that the reaction’s starting temperature of the components after the addition of 5AT, as mentioned in the pyrolysis behavior analysis, is significantly lower, which plays a role in promoting the reaction at this stage.
  • According to the Coats–Redfern method, the most likely reaction models of the different formulations at each stage were predicted. It can be concluded that with different amounts of 5AT in the formulation, the reaction models of mixed agents in the first, third, and fourth stages changed significantly, indicating that the addition of 5AT can affect the reaction mechanism at some stages. In addition, for Samples P1–P5, the reaction model at the second stage of pyrolysis is the nucleation model A4, which maintains a high degree of consistency and further verifies the correctness of the physical thermal diffusion weight loss theory of the sample at the second stage of pyrolysis weight loss, which mainly corresponds to OC.

Author Contributions

H.Z. and X.C. contributed to the conception of the study; H.Z. and Y.G. performed the experiments; H.Z. and X.C. contributed significantly to analysis and manuscript preparation; H.Z. performed the data analysis and wrote the manuscript; X.C. helped perform the analysis with constructive discussions. All authors have read and agreed to the published version of the manuscript.

Funding

This work was financially supported by the equipment comprehensive research project (WJ2021 1A030013), (WJ20182A020036); basic research of university technology (WJY202146); basic frontier innovation research (WJY202236) and research on military theory (JLY2022089).

Institutional Review Board Statement

Not applicable.

Informed Consent Statement

Not applicable.

Data Availability Statement

Data are available on request from authors.

Acknowledgments

The authors gratefully acknowledge the research infrastructure provided by the equipment management and support of the College of Engineering University of the Chinese People’s Armed Police Force.

Conflicts of Interest

The authors declare no conflict of interest.

References

  1. Wang, H.Y.; Mu, Y.L.; Su, S.C.; Hao, H.M.; Li, G.B.; He, J. Study on the properties of a stimulating smoking agent. J. Initiat. Pyrotech. 2013, 1, 36–38. (In Chinese) [Google Scholar]
  2. Shaw, A.P.; Chen, G.D. Advanced boron carbide-based visual obscurants for military smoke grenades. In Proceedings of the 40th International Pyrotechnics Seminar, Colorado Springs, CO, USA, 13–18 July 2014; pp. 170–191. [Google Scholar]
  3. Haar, R.J.; Iacopino, V.; Ranadive, N.; Weiser, S.D.; Dandu, M. Health impacts of chemical irritants used for crowd control: A systematic review of the injuries and deaths caused by tear gas and pepper spray. BMC Public Health 2017, 17, 831. [Google Scholar] [CrossRef] [PubMed]
  4. Hoz, S.S.; Aljuboori, Z.S.; Dolachee, A.A.; Al-Sharshahi, Z.F.; Alrawi, M.A.; Al-Smaysim, A.M. Fatal Penetrating head injuries caused by projectile tear gas canisters. World Neurosurg. 2020, 138, e119–e123. [Google Scholar] [CrossRef] [PubMed]
  5. Stopyra, J.P.; Winslow, J.E., III; Johnson, J.C., III; Hill, K.D.; Bozeman, W.P. Baby Shampoo to relieve the discomfort of tear gas and pepper spray exposure: A randomized controlled trial. West. J. Emerg. Med. 2018, 19, 294. [Google Scholar] [CrossRef] [Green Version]
  6. Rothenberg, C.; Achanta, S.; Svendsen, E.R.; Jordt, S. Tear gas: An epidemiological and mechanistic reassessment. Ann. N. Y. Acad. Sci. 2016, 1378, 96–107. [Google Scholar] [CrossRef] [PubMed] [Green Version]
  7. Corbacɩoğlu, Ş.K.; Güler, S.; Er, E.; Seviner, M.; Aslan, Ş.; Aksel, G. Rare and severe maxillofacial injury due to tear gas capsules: Report of three cases. J. Forensic Sci. 2016, 61, 551–554. [Google Scholar]
  8. Zhai, H.L.; Cui, X.P. Thermal behavior test and characterization of a capsicum oleoresin (OC) composite material used for burning tear bomb. J. Phys. Conf. Series. IOP Publ. 2021, 1965, 012058. [Google Scholar]
  9. Talawar, M.B.; Sivabalan, R.; Mukundan, T.; Muthurajan, H.; Sikder, A.K.; Gandhe, B.R.; Rao, A.S. Environmentally compatible next generation green energetic materials (GEMs). J. Hazard. Mater. 2009, 161, 589–607. [Google Scholar] [CrossRef]
  10. Zhang, D.; Jiang, L.; Lu, S.; Cao, C.-Y.; Zhan, H.-P. Particle size effects on thermal kinetics and pyrolysis mechanisms of energetic 5-amino-1H-tetrazole. Fuel 2018, 217, 553–560. [Google Scholar] [CrossRef]
  11. Zhang, D.; Lu, S.; Cao, C.Y.; Liu, C.C.; Gong, L.L.; Zhang, H.P. Impacts on combustion behavior of adding nanosized metal oxide to CH3N5-Sr(NO3)2 propellant. Fuel 2017, 191, 371–382. [Google Scholar] [CrossRef]
  12. Küblböck, T. New Trends in Sustainable Light-and Smoke-Generating Pyrotechnics; Ludwig Maximilian University of Munich: München, Germany, 2020. [Google Scholar]
  13. Glück, J.; Klapötke, T.M.; Küblböck, T. 5-Amino-1H-tetrazole-based multi-coloured smoke signals applying the concept of fuel mixes. New J. Chem. 2018, 42, 10670–10675. [Google Scholar] [CrossRef]
  14. Glück, J.; Klapötke, T.M.; Rusan, M.; Shaw, A.P. Improved Efficiency by Adding 5-Aminotetrazole to Anthraquinone-Free New Blue and Green Colored Pyrotechnical Smoke Formulations. Propellants Explos. Pyrotech. 2017, 42, 131–141. [Google Scholar] [CrossRef]
  15. Zeman, O.; Pelikan, V.; Pachman, J. Diketopyrrolopyrrole—A Greener Alternative for Pyrotechnic Smoke Compositions; ACS Sustainable Chemistry & Engineering: Washington, DC, USA, 2022. [Google Scholar]
  16. Hemmilä, M.; Hihkiö, M.; Linnainmaa, K. Evaluation of the acute toxicity and genotoxicity of orange, red, violet and yellow pyrotechnic smokes in vitro. Propellants Explos. Pyrotech. Int. J. Deal. Sci. Technol. Asp. Energetic Mater. 2007, 32, 415–422. [Google Scholar] [CrossRef]
  17. Zarko, V.; Kiskin, A.; Cheremisin, A. Contemporary methods to measure regression rate of energetic materials: A review. Prog. Energy Combust. Sci. 2022, 91, 100980. [Google Scholar] [CrossRef]
  18. Ambekar, A.; Kim, M.; Lee, W.-H.; Yoh, J.J. Characterization of display pyrotechnic propellants: Burning rate. Appl. Therm. Eng. 2017, 121, 761–767. [Google Scholar] [CrossRef]
  19. Yi, J.H.; Zhao, F.Q.; Wang, B.Z.; Liu, Q.; Zhou, C.; Hu, R.Z.; Ren, Y.H.; Xu, S.Y.; Xu, K.Z.; Ren, X.N. Thermal behaviors, nonisothermal decomposition reaction kinetics, thermal safety and burning rates of BTATz-CMDB propellant. J. Hazard. Mater. 2010, 181, 432–439. [Google Scholar] [CrossRef]
  20. Aboulkas, A.; El, B.A. Thermal degradation behaviors of polyethylene and polypropylene. Part I: Pyrolysis kinetics and mechanisms. Energy Convers Manag. 2010, 51, 1363–1369. [Google Scholar] [CrossRef]
  21. Vyazovkin, S. Isoconversional Kinetics of Thermally Stimulated Processes; Springer: Berlin/Heidelberg, Germany, 2015. [Google Scholar]
  22. Muravyev, N.V.; Monogarov, K.A.; Asachenko, A.F.; Nechaev, M.S.; Ananyev, I.V.; Fomenkov, I.V.; Kiselev, V.G.; Pivkina, A.N. Pursuing reliable thermal analysis techniques for energetic materials: Decomposition kinetics and thermal stability of dihydroxylammonium 5,5′-bistetrazole-1,1′-diolate (TKX-50). Phys. Chem. Chem. Phys. 2017, 19, 436–449. [Google Scholar] [CrossRef]
  23. Starink, M.J. The determination of activation energy from linear heating rate experiments: A comparison of the accuracy of isoconversion methods. Thermochim. Acta 2003, 404, 163–176. [Google Scholar] [CrossRef] [Green Version]
  24. Ozawa, T. A new method of analyzing thermogravimetric data. Bull. Chem. Soc. Jpn. 1965, 38, 1881–1886. [Google Scholar] [CrossRef] [Green Version]
  25. Flynn, J.H.; Wall, L.A. General treatment of the thermogravimetry of polymers. J. Res. Natl. Bur. Standards. Sect. A Phys. Chem. 1966, 70, 487. [Google Scholar] [CrossRef] [PubMed]
  26. Coats, A.W.; Redfern, J.P. Kinetic parameters from thermogravimetric data. Nature 1964, 201, 68–69. [Google Scholar] [CrossRef]
  27. Vyazovkin, S.; Burnham, A.K.; Criado, J.M.; Pérez-Maqueda, L.A.; Popescu, C.; Sbirrazzuoli, N. ICTAC Kinetics Committee recommendations for performing kinetic computations on thermal analysis data. Thermochim. Acta 2011, 520, 1–19. [Google Scholar] [CrossRef]
  28. Zhang, D.; Cao, C.-Y.; Lu, S.; Cheng, Y.; Zhang, H.-P. Experimental insight into catalytic mechanism of transition metal oxide nanoparticles on combustion of 5-Amino-1H-Tetrazole energetic propellant by multi kinetics methods and TG-FTIR-MS analysis. Fuel 2019, 245, 78–88. [Google Scholar] [CrossRef]
  29. Eslami, A.; Hosseini, S.G. Improving safety performance of lactose-fueled binary pyrotechnic systems of smoke dyes. J. Therm. Anal. Calorim. 2011, 104, 671–678. [Google Scholar] [CrossRef]
  30. Wang, H.; Cao, L.; Chen, Y.K.; Hao, H.M.; Zhang, Z.L. Study on thermal cracking of vanillin nonanoate by pyrolysis gas chromatography-mass spectrometry. J. Anal. Test. 2018, 37, 858–861. (In Chinese) [Google Scholar] [CrossRef]
  31. Wang, C.Y.; Du, Z.M.; Cong, X.M.; Tian, X.L. Study on thermal decomposition of basic magnesium carbonate. Appl. Chem. Ind. 2008, 37, 657–660. (In Chinese) [Google Scholar] [CrossRef]
  32. Cao, C.Y.; Zhang, D.; Liu, C.C.; Song, L. Experimental investigation on combustion behaviors and reaction mechanisms for 5-aminotetrazole solid propellant with nanosized metal oxide additives under elevated pressure conditions. Appl. Therm. Eng. 2019, 162, 114207. [Google Scholar] [CrossRef]
  33. Miyata, Y.; Date, S.; Hasue, K. Combustion mechanism of consolidated mixtures of 5-amino-1H-tetrazole with potassium nitrate or sodium nitrate. Propellants Explos. Pyrotech. Int. J. Deal. Sci. Technol. Asp. Energetic Mater. 2004, 29, 247–252. [Google Scholar] [CrossRef]
  34. Tabacof, A.; Calado, V.M.A. Thermogravimetric analysis and differential scanning calorimetry for investigating the stability of yellow smoke powders. J. Therm. Anal. Calorim. 2017, 128, 387–398. [Google Scholar] [CrossRef]
  35. Muravyev, N.V.; Pivkina, A.N.; Koga, N. Critical appraisal of kinetic calculation methods applied to overlapping multistep reactions. Molecules 2019, 24, 2298. [Google Scholar] [CrossRef] [PubMed] [Green Version]
  36. Luciano, G.; Svoboda, R. Activation energy determination in case of independent complex kinetic processes. Processes 2019, 7, 738. [Google Scholar] [CrossRef] [Green Version]
  37. Ambekar, A.; Yoh, J.J. Chemical kinetics of multi-component pyrotechnics and mechanistic deconvolution of variable activation energy. Proc. Combust. Inst. 2019, 37, 3193–3201. [Google Scholar] [CrossRef]
  38. Ebrahimi-Kahrizsangi, R.; Abbasi, M.H. Evaluation of reliability of Coats-Redfern method for kinetic analysis of non-isothermal TGA. Trans. Nonferrous Met. Soc. China 2008, 18, 217–221. [Google Scholar] [CrossRef]
Figure 1. Sample preparation process.
Crystals 12 00948 g001
Figure 2. Tested samples with different formulations.
Crystals 12 00948 g002
Figure 3. Schematic diagram of the laser smoke concentration tester.
Crystals 12 00948 g003
Figure 4. Combustion temperature-time distribution of Samples P1–P5 measured by a thermocouple.
Crystals 12 00948 g004
Figure 5. Variation trend of the maximum combustion temperature of samples with different 5AT mass fractions in the system.
Crystals 12 00948 g005
Figure 6. Particle size distribution of the combustion smoke of Samples P1–P5.
Crystals 12 00948 g006
Figure 7. Variation trend of the smoke concentration and average particle size of samples with different 5AT mass fractions in the system.
Crystals 12 00948 g007
Figure 8. TG-DSC-DTG curve of each individual component in mixed reagent sample at β = 10 °C·min−1.
Crystals 12 00948 g008
Figure 9. The TG-DSC curve of Samples P1–P5 at β = 10 °C·min−1.
Crystals 12 00948 g009
Figure 10. The TG-DTG curve of Samples P1–P5 at β = 10 °C·min−1.
Crystals 12 00948 g010
Figure 11. TG-DTG curve of Samples P1–P5 at different heating rates.
Crystals 12 00948 g011
Figure 12. Activation energy curve of Samples P1–P5 at each stage of pyrolysis calculated via Starink’s method.
Crystals 12 00948 g012
Figure 13. Activation energy curve of Samples P1–P5 at each stage obtained via the Flynn–Wall–Ozawa method.
Crystals 12 00948 g013
Figure 14. Fitting curve of the most likely reaction mechanism model of Samples P1–P5 formula obtained via the Coats–Redfern method. (a) Fitting curve of P1′s reaction mechanism model. (b) Fitting curve of P2′s reaction mechanism model. (c) Fitting curve of P3′s reaction mechanism model. (d) Fitting curve of P4′s reaction mechanism model. (e) Fitting curve of P5′s reaction mechanism model.
Crystals 12 00948 g014
Table 1. Formula of the mixed agents at OB = −0.18 based on a uniform design method.
Component
Formula
OxidantCombustible AgentCoolantAdhesiveTear Agent
KClO3
(wt%)
C12H22O11 (wt%)CH3N5 (wt%)(MgCO3)4·Mg(OH)2
·5H2O (wt%)
(C8H6O2)n (wt%)OC
(wt%)
P132.027.207.16.327.4
P230.423.85.07.16.327.4
P328.920.310.07.16.327.4
P427.316.915.07.16.327.4
P525.813.420.07.16.327.4
Table 2. Thermal decomposition reaction models of 17 common solid substances.
Reaction Modelg(α)f(α)Abbreviation
Power lawα1P1
Power lawα1/21/2P2
Power lawα1/32/3P3
Power lawα1/43/4P4
Power lawα3/22/3α1/2P2/3
Avrami–Erofeev[−ln(1−α)]1/22(1−α) (−ln(1−α))1/2A2
Avrami–Erofeev[−ln(1−α)]1/33(1−α) (−ln(1−α))2/3A3
Avrami–Erofeev[−ln(1−α)]1/44(1−α) (−ln(1−α))3/4A4
One-dimensionalα21/2αD1
Two-dimensional(1−α)ln(1−α) + α[−ln(1−α)]−1D2
Three-dimensional[1−(1−α)1/3]23/2(1−α)2/3[1−(1−α)1/3]D3
Ginstling-Brounshtein1−(2α/3)−(1−α)2/33/2[(1−α)−1/3-1]−1G-B
First-order−ln(1−α)1−αF1
Second-order(1-α)−1-1(1−α)2F2
Third-order[(1−α)−2−1]/2(1−α)3F3
Contracting area1−(1−α)1/22(1−α)1/2C2
Contracting volume1−(1−α)1/33(1−α)2/3C3
Table 3. Test results of the burning rate of samples.
SampleBurning Rate Ι
(mm·s−1)
Burning Rate ΙΙ
(mm·s−1)
Burning Rate ΙΙΙ
(mm·s−1)
Average Burning Rate (mm·s1)Standard Deviation
(σ)
P11.051.081.081.070.0173
P21.071.091.081.080.01
P31.031.061.091.060.03
P41.031.051.071.050.02
P51.011.031.051.030.02
Table 4. Characteristic peak temperatures of samples P1–P5 corresponding to the DSC curve at β = 10 °C·min−1.
Peak Temperature FormulaT1 (°C)T2 (°C)T3 (°C)T4 (°C)T5 (°C)
P160.61171.72330.81443.92--
P259.32160.81332.03462.94--
P358.61158.33332.21473.61--
P458.22157.63330.04506.73--
P562.02162.22276.05327.34516.82
Table 5. Exothermic enthalpy corresponding to the exothermic peak of Samples P1–P5 near 340 °C.
FormulaP1P2P3P4P5
Exothermic enthalpy (ΔH)4.61 J/g4.48 J/g3.54 J/g4.51 J/g4.79 J/g
Table 6. Starting and ending temperatures and corresponding characteristic values of Samples P1–P5 at each stage, based on the DTG curve.
(a) Eigenvalues corresponding to the first stage.
Formula
β
P1P2P3P4P5
ToTpTfMLToTpTfMLToTpTfMLToTpTfMLToTpTfML
5160.81170.04191.0219.2%136.51164.51191.9318.5%139.21159.42179.2215.2%134.22162.41178.8115%138.52154.82190.4316.5%
10152.92176.33194.7115.7%148.13168.23198.9115.6%144.03172.83194.1310.1%142.63171.62190.0210%147.03165.81203.4214%
15161.83184.42200.6213.2%150.42181.54201.1411.7%142.04173.31199.2414%147.02174.11205.0314.3%140.54172.43214.6218.9%
20158.93189.33209.8317.4%151.02183.52208.0216.4%144.91178.94214.0317%150.04189.02211.039.7%148.04182.22219.1316.1%
(b) Eigenvalues corresponding to the second stage.
Formula
β
P1P2P3P4P5
ToTpTfMLToTpTfMLToTpTfMLToTpTfMLToTpTfML
5191.02258.82270.0228.4%191.92251.62274.8127.8%179.22250.52273.1235.7%178.81245.63271.2127.5%190.42253.62278.0224.2%
10194.71275.63291.4126.7%198.93273.04294.2227.5%194.13268.13285.6328.9%190.02264.42284.4227.1%203.43267.72296.4224.8%
15200.62279.22303.3227.5%201.12276.33309.7331.9%199.22276.54307.4232.6%205.04276.31302.7330.6%214.61283.53307.2325.4%
20209.81286.33312.0426.4%208.03283.14311.0229.9%214.03289.72317.4433.6%211.05280.82314.0128.71%219.12288.81313.8223%
(c) Eigenvalues corresponding to the third stage.
Formula
β
P1P2P3P4P5
ToTpTfMLToTpTfMLToTpTfMLToTpTfMLToTpTfML
5270.02334.32374.0314.5%274.82329.72391.0411.8%273.13331.91382.1315.8%271.21329.62389.2311.2%278.03328.52392.6311.5%
10291.43336.43397.3110.9%294.22339.23410.0510.4%285.62334.82390.629.1%284.42332.93398.327%296.42329.83410.8213.2%
15303.32349.03423.5210.9%309.71340.11414.619.2%307.44340.04407.038.4%302.71334.72413.237.6%307.23330.14413.1310.5%
20312.01350.92426.0411.5%311.03343.04419.0411.2%317.45341.03414.828.3%314.02336.02440.726.9%313.81332.51422.0510.6%
(d) Eigenvalues corresponding to the fourth stage.
Formula
β
P1P2P3P4P5
ToTpTfMLToTpTfMLToTpTfMLToTpTfMLToTpTfML
5374.03421.62465.0523.5%391.03438.53482.0320.7%382.12456.32486.6226.2%389.23486.04499.9226.3%392.61512.32532.2128.5%
10397.32444.93499.0321.6%410.01462.52501.7220.6%390.63472.43502.1319.5%398.32496.92512.7319.1%410.82513.21540.3228.3%
15423.52453.71512.0317.3%414.62469.51513.7121.6%407.04499.04531.0321.3%413.23514.83544.6422.7%413.11529.43573.0228%
20426.04465.74523.0220.1%419.03480.24530.0422.2%414.82500.82554.0222.1%440.73526.91562.0319%422.03536.44581.0425.7%
Note: To is the initial temperature; TP is the peak temperature; Tf is the cut-off temperature; ML refers to the mass ratio of thermal weight loss in this stage; To, TP, Tf unit: °C; ML unit: %.
Table 7. Reaction kinetic parameters of Samples P1–P5 at each stage of pyrolysis calculated via Starink’s method.
StageStage 1Stage 2Stage 3Stage 4
FormulaEa (kJ/mol)R2Ea (kJ/mol)R2Ea (kJ/mol)R2Ea (kJ/mol)R2
P1110 ± 70.98223116 ± 70.98417193 ± 90.91128124 ± 60.99518
P291 ± 80.9314395 ± 70.97126299 ± 90.96533137 ± 70.99147
P3106 ± 80.9643280 ± 50.99133406 ± 80.97029115 ± 80.96539
P478 ± 50.9684782 ± 70.99545646 ± 70.99846148 ± 60.96738
P576 ± 60.9863883 ± 50.98949659 ± 80.91439164 ± 80.90127
Flynn–Wall–Ozawa method.
Table 8. Reaction model of four stages during the pyrolysis of Samples P1–P5.
StageStage 1Stage 2Stage 3Stage 4
Formula
P1A3A4F3F1
P2F2A4F3F1
P3D3A4F3D2
P4D3A4F2P2/3
P5F3A4F2D2
Publisher’s Note: MDPI stays neutral with regard to jurisdictional claims in published maps and institutional affiliations.

