1. Introduction
Bitumen derived from crude oil serves as the desired material for road and roofing applications due to its superior viscoelastic and waterproofing performance compared to other alternatives [
1]. With respect to its composition, bitumen consists of a cocktail of organic molecules which are commonly classified based on solubility-driven fractions, widely known as SARA as indicated by the names of the four fractions (Saturates, Aromatics, Resins and Asphaltenes) [
2,
3,
4].
Apart from a solubility-based classification, bitumen may also be differentiated by the presence of paraffinic or microcrystalline waxes [
5,
6]. These waxes may be present in the heavy crudes used to process bitumen or they may be generated during certain refinery procedures, i.e., visbreaking or hydrocracking. Typically, paraffinic waxes consist of linear n-alkanes with at most a few branches, while microcrystalline wax is made up of aliphatic hydrocarbons with a considerable amount of iso- and cycloparaffins [
7]. The paraffinic waxes crystallise upon cooling in large, thin, flat plates while the microcrystalline waxes form small micrometre-sized crystals. Differences between the two wax types are observed in the molecular weight and the boiling temperatures; microcrystalline waxes have a higher molecular weight and boiling range [
8].
Although hypotheses about the mechanisms concerning the oxidation process in bitumen have been supported experimentally in recent works [
9,
10,
11], the mechanisms governing the formation of certain microstructural patterns are yet to completely be understood. Different theories have been proposed concerning the internal microstructure of bitumen, varying from colloidal to dispersed polar fluid models. The most recent one, proposed originally for the asphaltene structures of crude oils, is the Yen–Mullins model, which is based on the formation of near-spherical nanoaggregates, consisting of six to ten molecules stacked together, followed by clustering of the nanoaggregates in higher concentrations [
12,
13]. It has been confirmed experimentally with small-angle neutron and small-angle X-ray scattering (SANS and SAXS) [
14] that such nano-sized structures can be present in bitumen. On bitumen surfaces, on the other hand, micro-scale, wave-like patterns have been observed [
15,
16]. These have been referred to as bee structures and recent studies have attributed these bee structures to a crystallisation of the waxy components in bitumen [
17,
18,
19,
20,
21].
From a practical point of view, in crude oils, the presence of wax may relate to undesirable effects such as precipitation and pipe plugging or deposition problems, depending on the applied temperature and pressure [
22]. In bitumen, the presence of waxes affects, among other properties, the stiffness at low service temperatures which can induce slow hardening, increasing the risk for low-temperature cracking at the corresponding asphalt mixtures. On the other extreme, at high service temperatures, waxes in bitumen may result in binder’s softening, which increases the risk for permanent deformation [
23,
24,
25,
26]. These indicate the importance of wax crystallinity and gaining knowledge about the melting and crystallisation temperatures in bitumen.
To that end, previous scholars have utilised various calorimetric tools to determine the presence and properties of crystalline waxes. The most common tool to evaluate thermal transitions in bitumen is the Differential Scanning Calorimetry (DSC), allowing glass transitions, exo- and endothermic phenomena to be determined [
19,
27]. However, for bitumen, these DSC signals are typically very broad, they can be combined with exothermic transitions upon reheating and the thermal history of the samples before testing may significantly affect the DSC signals. Because of this, in the literature, these thermal transitions have been interpreted in different ways and have been attributed also to other phenomena not related to crystallisation or melting [
28]. Alternative tools that are able to complementarily provide deeper insights into the wax crystallinity exist, but are rather uncommon for bitumen [
29]. For example, Wide-Angle X-ray Diffraction (WAXD) has hardly been used to characterise the presence and chemical composition of crystallinity in bitumen [
30]. In parallel,
13C Nuclear Magnetic Resonance and Gas Chromatography combined with Mass spectrometry have been used for the chemical characterisation of isolated waxes in bitumen [
31].
2. Objectives
The aim of this study is first to compare the thermal transitions observed in DSC, associated with the melting and crystallisation behaviour of natural waxes in bitumen, to the crystallographic findings via WAXD, during cooling and heating in the same temperature range. To that end, two bituminous binders, one waxy and one wax-free, were used in this study. Secondly, as wax crystallinity has been related to the formation of various morphological structures on a bitumen surface, the surface microstructure of both binders was investigated. For the waxy bitumen, it was followed in a Confocal Laser Scanning Microscope (CLSM) during cooling and heating. The effect of an annealing at room temperature was also investigated in DSC and CLSM for the waxy bitumen.
3. Materials and Methods
3.1. Materials
For this study, based on a preliminary wax determination with DSC, a waxy bitumen A and a wax-free bitumen B were selected with the potential to observe differences in crystallinity and surface morphology. Their empirical properties are summarised in
Table 1. In this case, the selected bitumen A was the residue of a visbreaking conversion process, during which additional wax may have been formed, while bitumen B is a harder straight-run bitumen, originating from a different crude, containing no wax.
3.2. Thermoanalytical Techniques
3.2.1. Differential Scanning Calorimetry (DSC)
A TA Instrument, model 2920 DSC (New Castle, DE, USA) was used in the current study. For each test, samples of approximately 15 mg of the bituminous binders were hermetically sealed into a sample pan, then heated to 110 °C and kept at this temperature for 15 min. The data were first recorded during cooling to −110 °C and heating to 110 °C, both at a rate of 10 °C/min. To examine the effects of annealing temperature on the waxy bitumen, DSC thermograms were also acquired in the same cooling and heating cycles, after 24 h at 25 °C and the data of the heating ramp were recorded. The measured thermal characteristics of the waxy bitumen before and after the annealing period of 24 h include onset, end and peak temperatures as well as enthalpies for the wax crystallisation and melting. For the quantification of the enthalpies, integration of the area enclosed between the experimental DSC curve and a linear extrapolation from the melt data were performed. Additionally, the glass transition temperatures were reported both for the waxy and the wax-free bitumen.
3.2.2. Wide Angle X-ray Diffraction (WAXD)
To collect the WAXD patterns, a X33 double-focusing camera of the EMBL in HASYLAB was used on the storage ring DORIS of the Deutsches Elektronen Synchrotron (DESY), Hamburg, Germany, at a wavelength of 1.5 Å [
32]. The samples in their liquid state at high temperature were inserted in small sample holders and sealed with aluminium foil [
33]. After cooling to room temperature, the samples were stored for 3 days at room temperature prior to collecting a WAXD pattern at 25 °C. In addition, for bitumen A, WAXD patterns were collected during a cooling/heating scan at 10 °C/min from 100 °C down to −40 °C and again up to 250 °C after 2 min at −40 °C. For this time-resolved measurement, patterns were collected in consecutive frames of 6 s, which corresponded to a temperature resolution of one pattern per °C. The temperature was controlled by a Mettler FP-82HT hot stage, flushed with cooled nitrogen to achieve the required cooling rate. After a background correction, the WAXD patterns were normalised to their integral to ensure a constant scattering mass. A crystallinity index was extracted from the normalised patterns by integrating the intensity of the 110 and 200 orthorhombic reflections, separated from the liquid scattering using linear sectors.
For the calibration of the scattering angles, the 110 and 200 reflections of a quenched linear polyethylene were used. The obtained data are represented as a function of the scattering angle but converted to the scattering angle expected in the case CuKα radiation would have been used (λ = 1.542 Å) instead of λ = 1.5 Å. Such a representation facilitates comparison with literature data, which most often make use of CuKα radiation.
3.3. Microscopic Techniques
Confocal Laser Scanning Microscopy (CLSM)
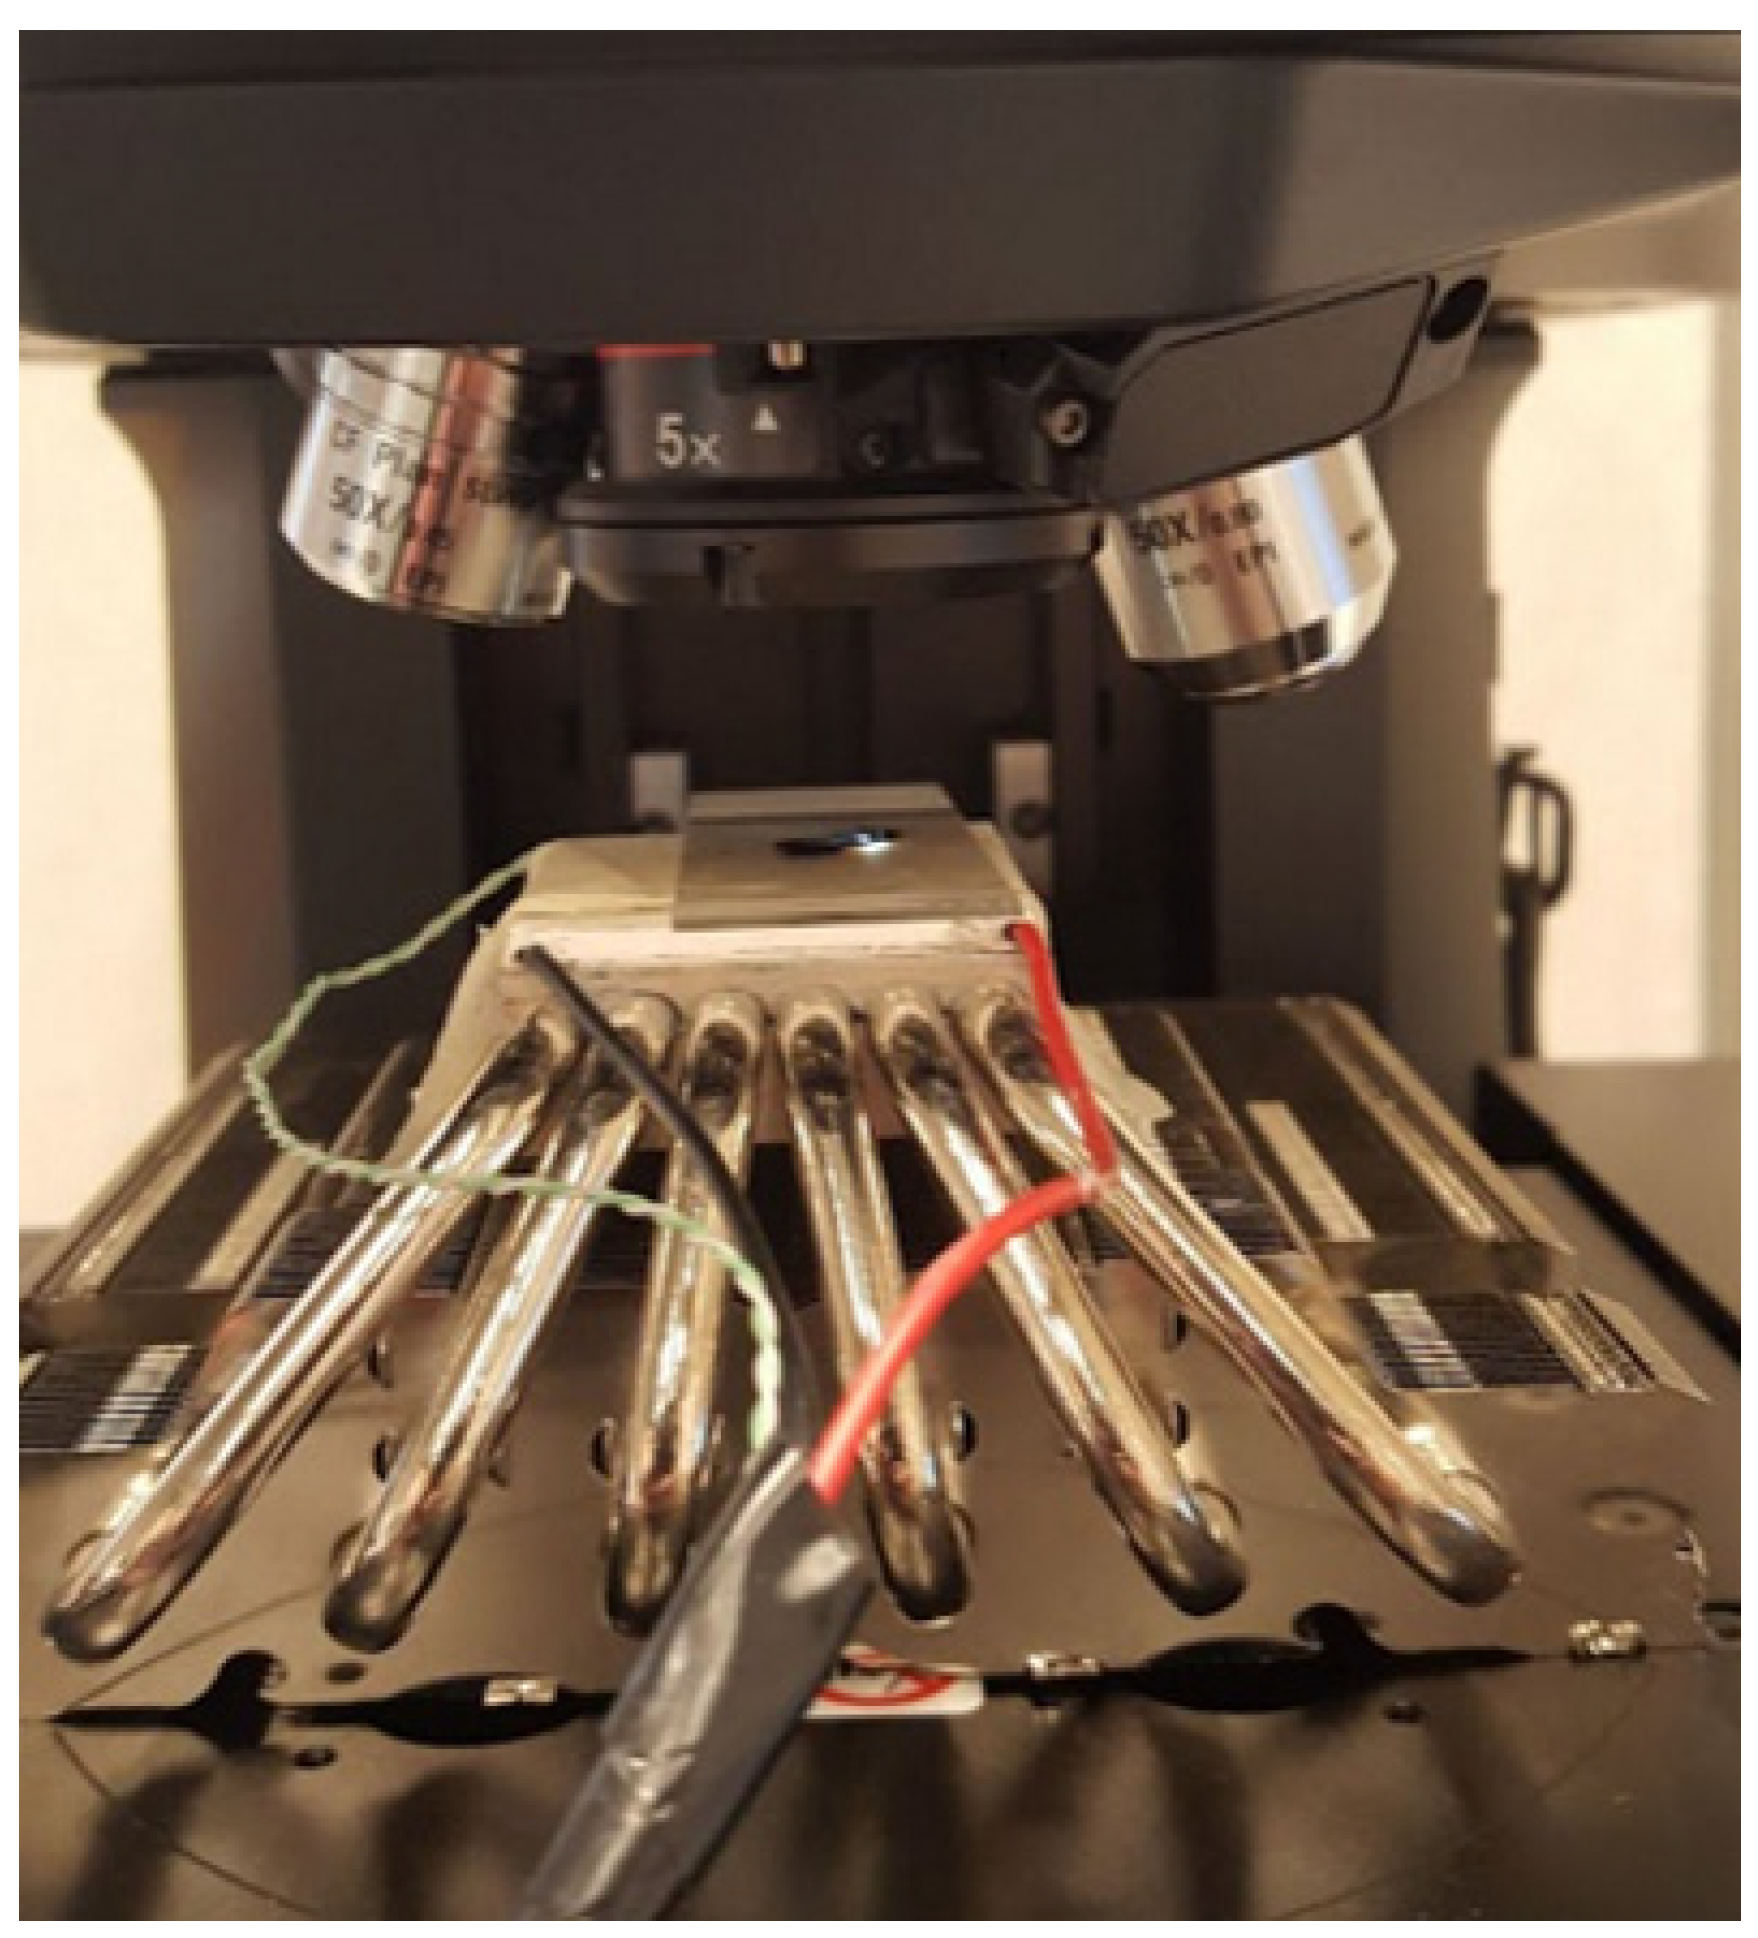
A Keyence VK-X1000 CLSM (Itasca, IL, USA), mounted with a VK-D1 motorised XY-stage was utilised for the recording of differential interference contrast (DIC) CLSM images with a laser and white light source on the surface of the bituminous samples. A DIC CLSM image has the advantage of introducing moderated contrast to optical images, producing a pseudo-3D effect. The Nikon Lens Plan Apo EPI with 150 times magnification, 5 nm lateral resolution and 10 nm axial resolution was chosen for this study. An in-house thermal fixture was also assembled (
Figure 1), consisting of electrical variable resistors that were fixed accordingly to obtain the required temperature on top of a metallic plate. The temperature of this small heating element was adjusted based on calibrated thermocouples inserted in the bituminous sample on the glass plate. Investigations on the waxy bitumen’s microstructure were conducted in cooling and heating cycles, in a range of temperatures between 10 to 80 °C at a cooling/heating cycle of 1.25 °C/min and a lower cooling/heating cycle using 0.5 °C/min rate. Preliminary investigations showed featureless surfaces for temperatures above 65 °C in both cycles as well as for the wax-free bitumen B which was not investigated further. Additionally, the effect of annealing at room temperature was also investigated for the waxy bitumen after 24 h in a heating scan.
For the sample preparation, the procedure as proposed in [
16] was adopted and a binder drop was spread out on a glass slide. This glass slide was placed on the heating element while being scanned with the CLSM. Image processing was performed with the software package VK MultiFileAnalyzer (version 2.2.0.93, Itasca, IL, USA), in order to obtain information about the bee structures’ area percentage by imposing height thresholds as described in [
17].
4. Results and Discussion
4.1. DSC
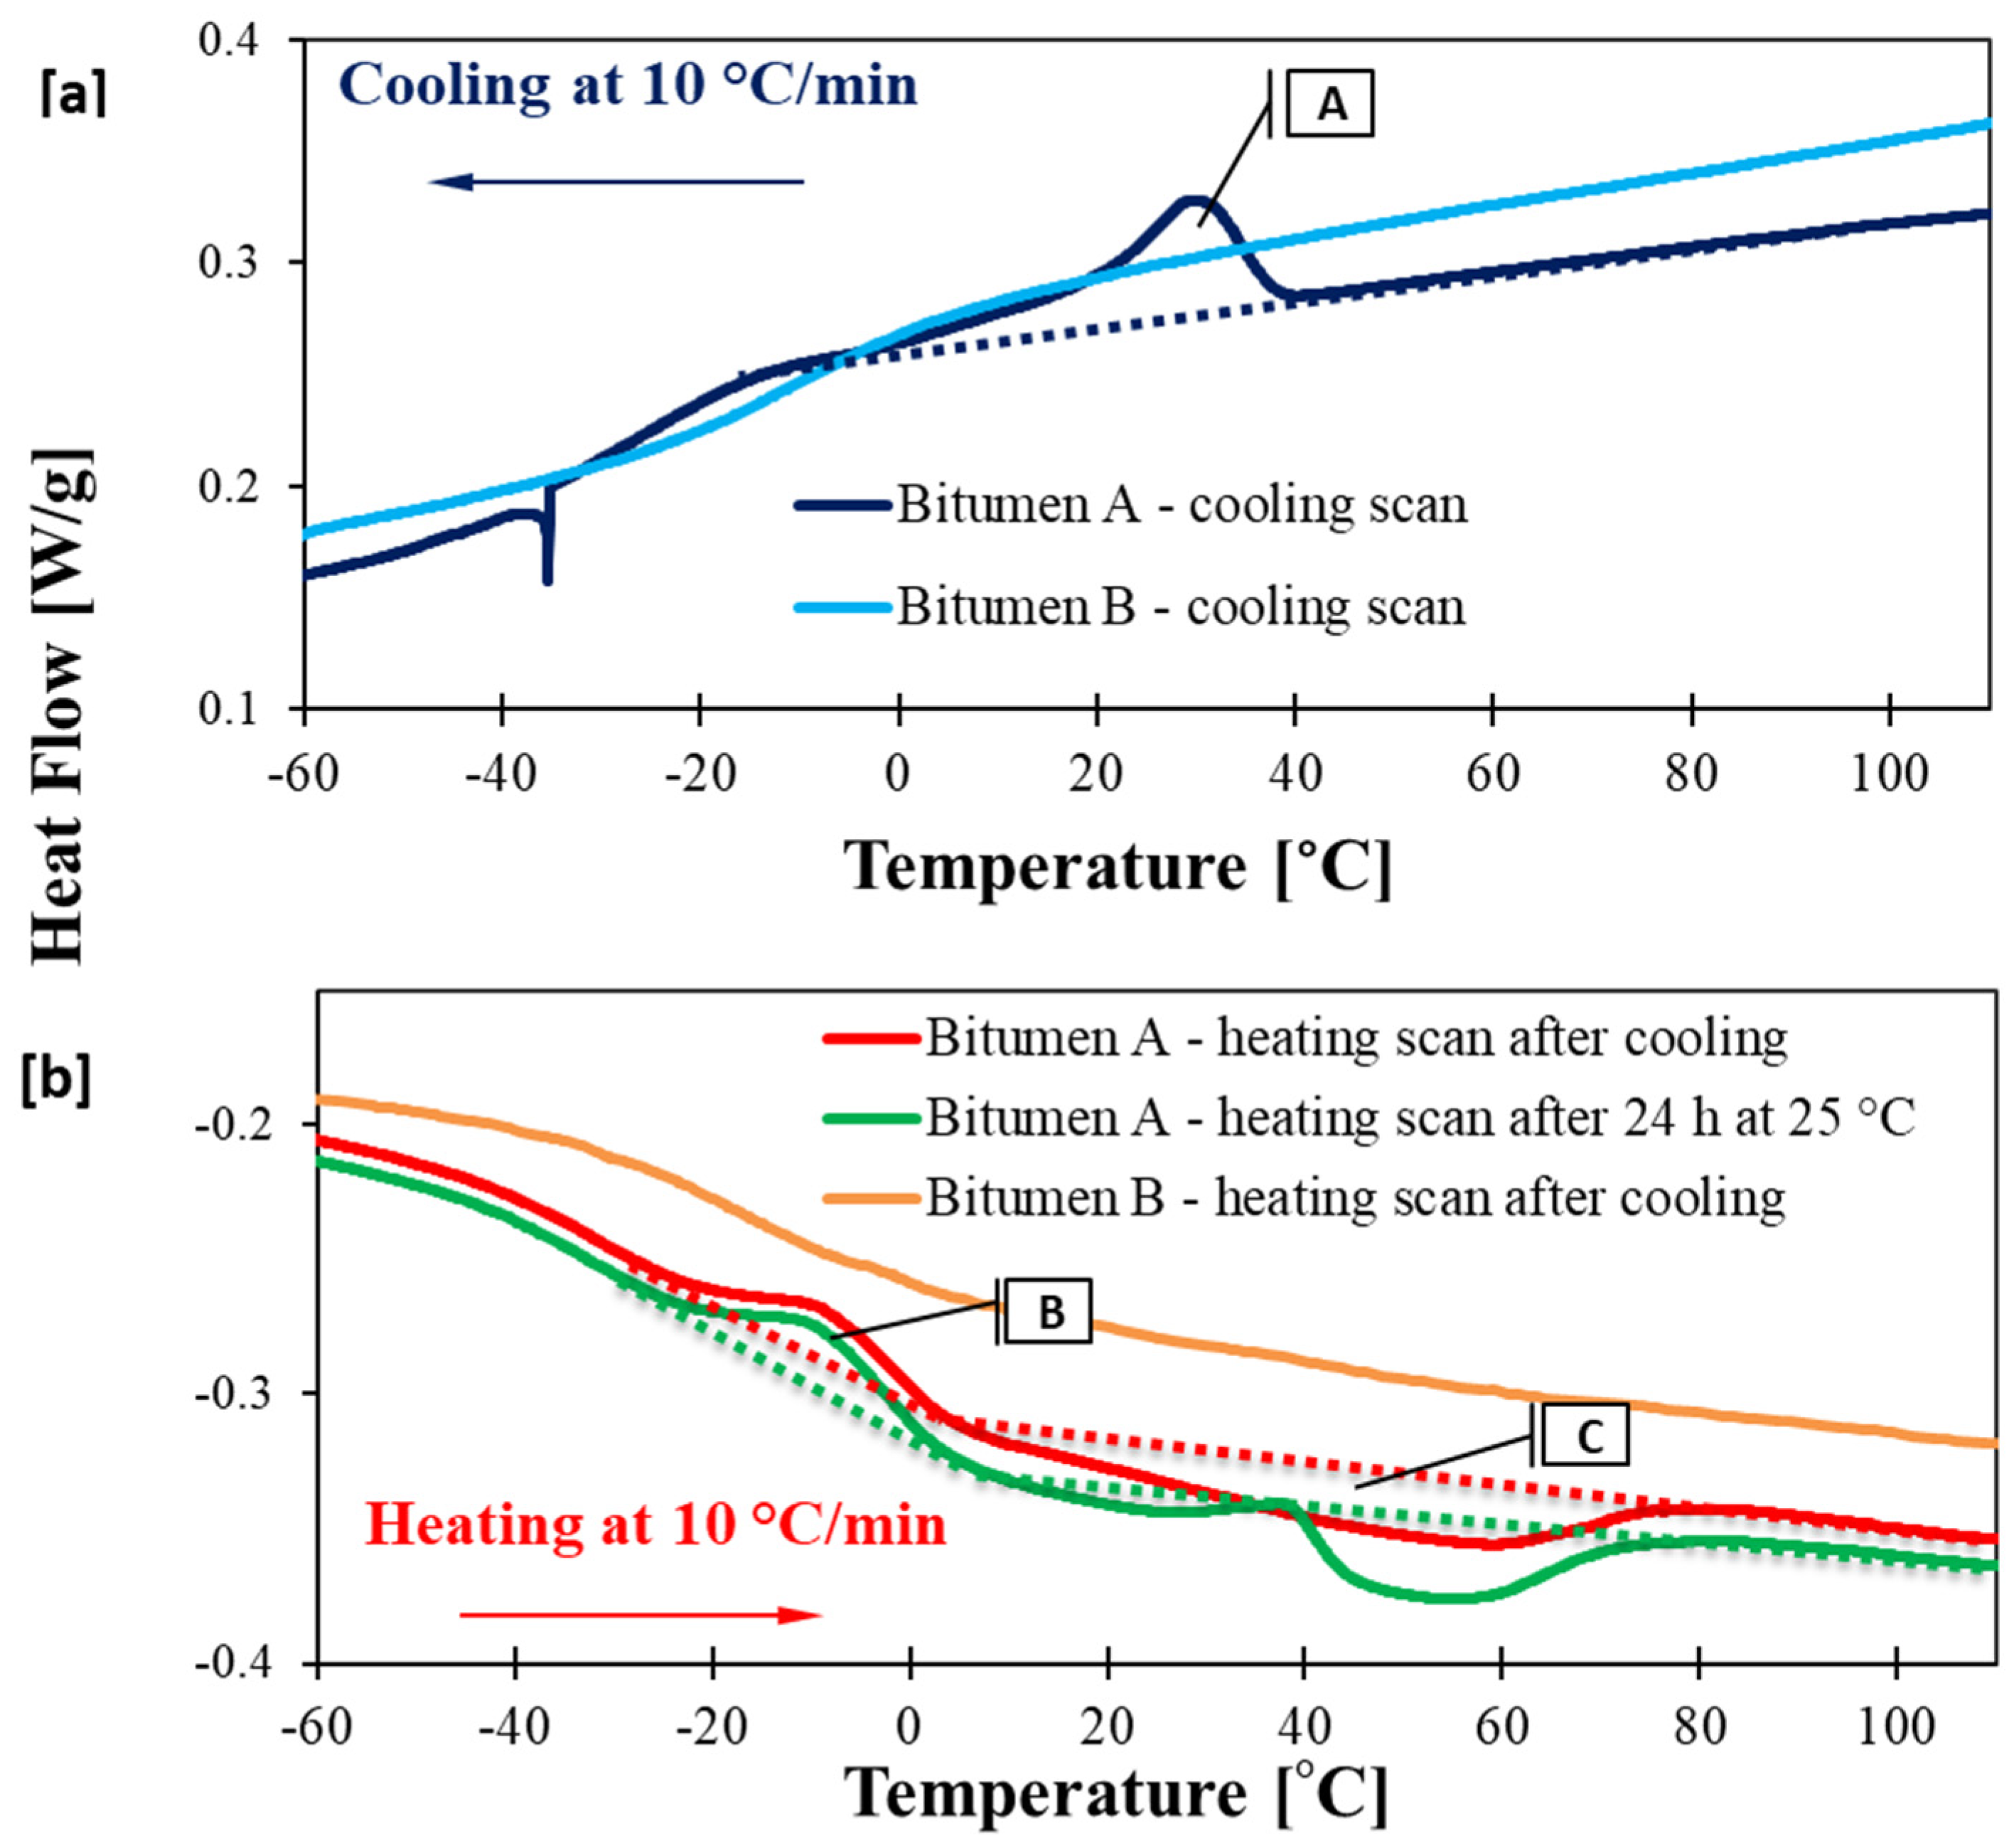
DSC scans obtained during cooling/heating for both binders and heating after 24 h annealing temperature at 25 °C for bitumen A, are shown in
Figure 2. The cooling scan of bitumen A shows an exothermic transition with a maximum at around +30 °C, which is attributed to the wax crystallisation. This transition is indicated by the area A in
Figure 2a. It continues down to the glass transition which appears for bitumen A at around −30 °C. The cooling scan of the wax-free bitumen B confirms the absence of crystallisable components as no exothermic transition can be observed, whereas the glass transition temperature for this bitumen can be found around −15 °C.
In the subsequent heating ramp of the waxy bitumen A, denoted as “heating scan after cooling”, an endothermic transition can be clearly observed (area C), which is related to wax melting. The melting end temperature is much higher than the corresponding crystallisation onset temperature for this bitumen indicating the need of nucleation at a certain degree of undercooling. The heating scan of bitumen A also reveals a small exothermic signal close to the glass transition, which is associated with a cold crystallisation in the literature [
34,
35], denoted as area B in
Figure 2b. Both heating and cooling scans of bitumen A show wide temperature ranges for crystallisation and melting, potentially indicating large differences between the crystals’ sizes and perfection. Changing wax concentrations in the liquid while the crystallisation is progressing may also have contributed to the width of the transition. Indeed, as the crystallinity progresses upon cooling, the remaining melt becomes wax-depleted, for which lower temperatures are needed to induce further crystallisation [
36]. This effect, which is common for crystallisation from mixed melts is mirrored for melting upon heating. On the other hand, bitumen B appears to have no apparent transition phenomena that occur during the heating scan.
Furthermore, the melting scan recorded after the annealing for bitumen A presents a different shape, as illustrated by the green curve in
Figure 2b. In this case, the melting signal consists of two peak temperatures, with the annealing temperature being located between these two peak temperatures of melting, indicating that during the annealing period, recrystallisation takes place forming crystals with a higher melting temperature.
In
Table 2, the onset and peak crystallisation temperatures (Tc), the peak and end melting temperatures (Tm) and the crystallisation and melting enthalpies (ΔH) only of bitumen A are presented. The main difference between the crystallisation and melting enthalpy is mainly due to the additional cold crystallisation during the heating scan. The undercooling effects are again obvious since Tm-end is much higher than the Tc-onset. Furthermore, the melting temperature range of bitumen A before and after annealing slightly differs in accordance with the results of a Round Robin study where the same bitumen was used [
19]. This past study also presented the repeatability and reproducibility between the different laboratories before and after annealing and the melting, crystallisation onset and peak of the current study lie adequately well within the previously reported range. In the current study, changes in the shape of the melting after the second heating were additionally observed, while the annealing procedure does not significantly influence the melting enthalpy.
4.2. WAXD
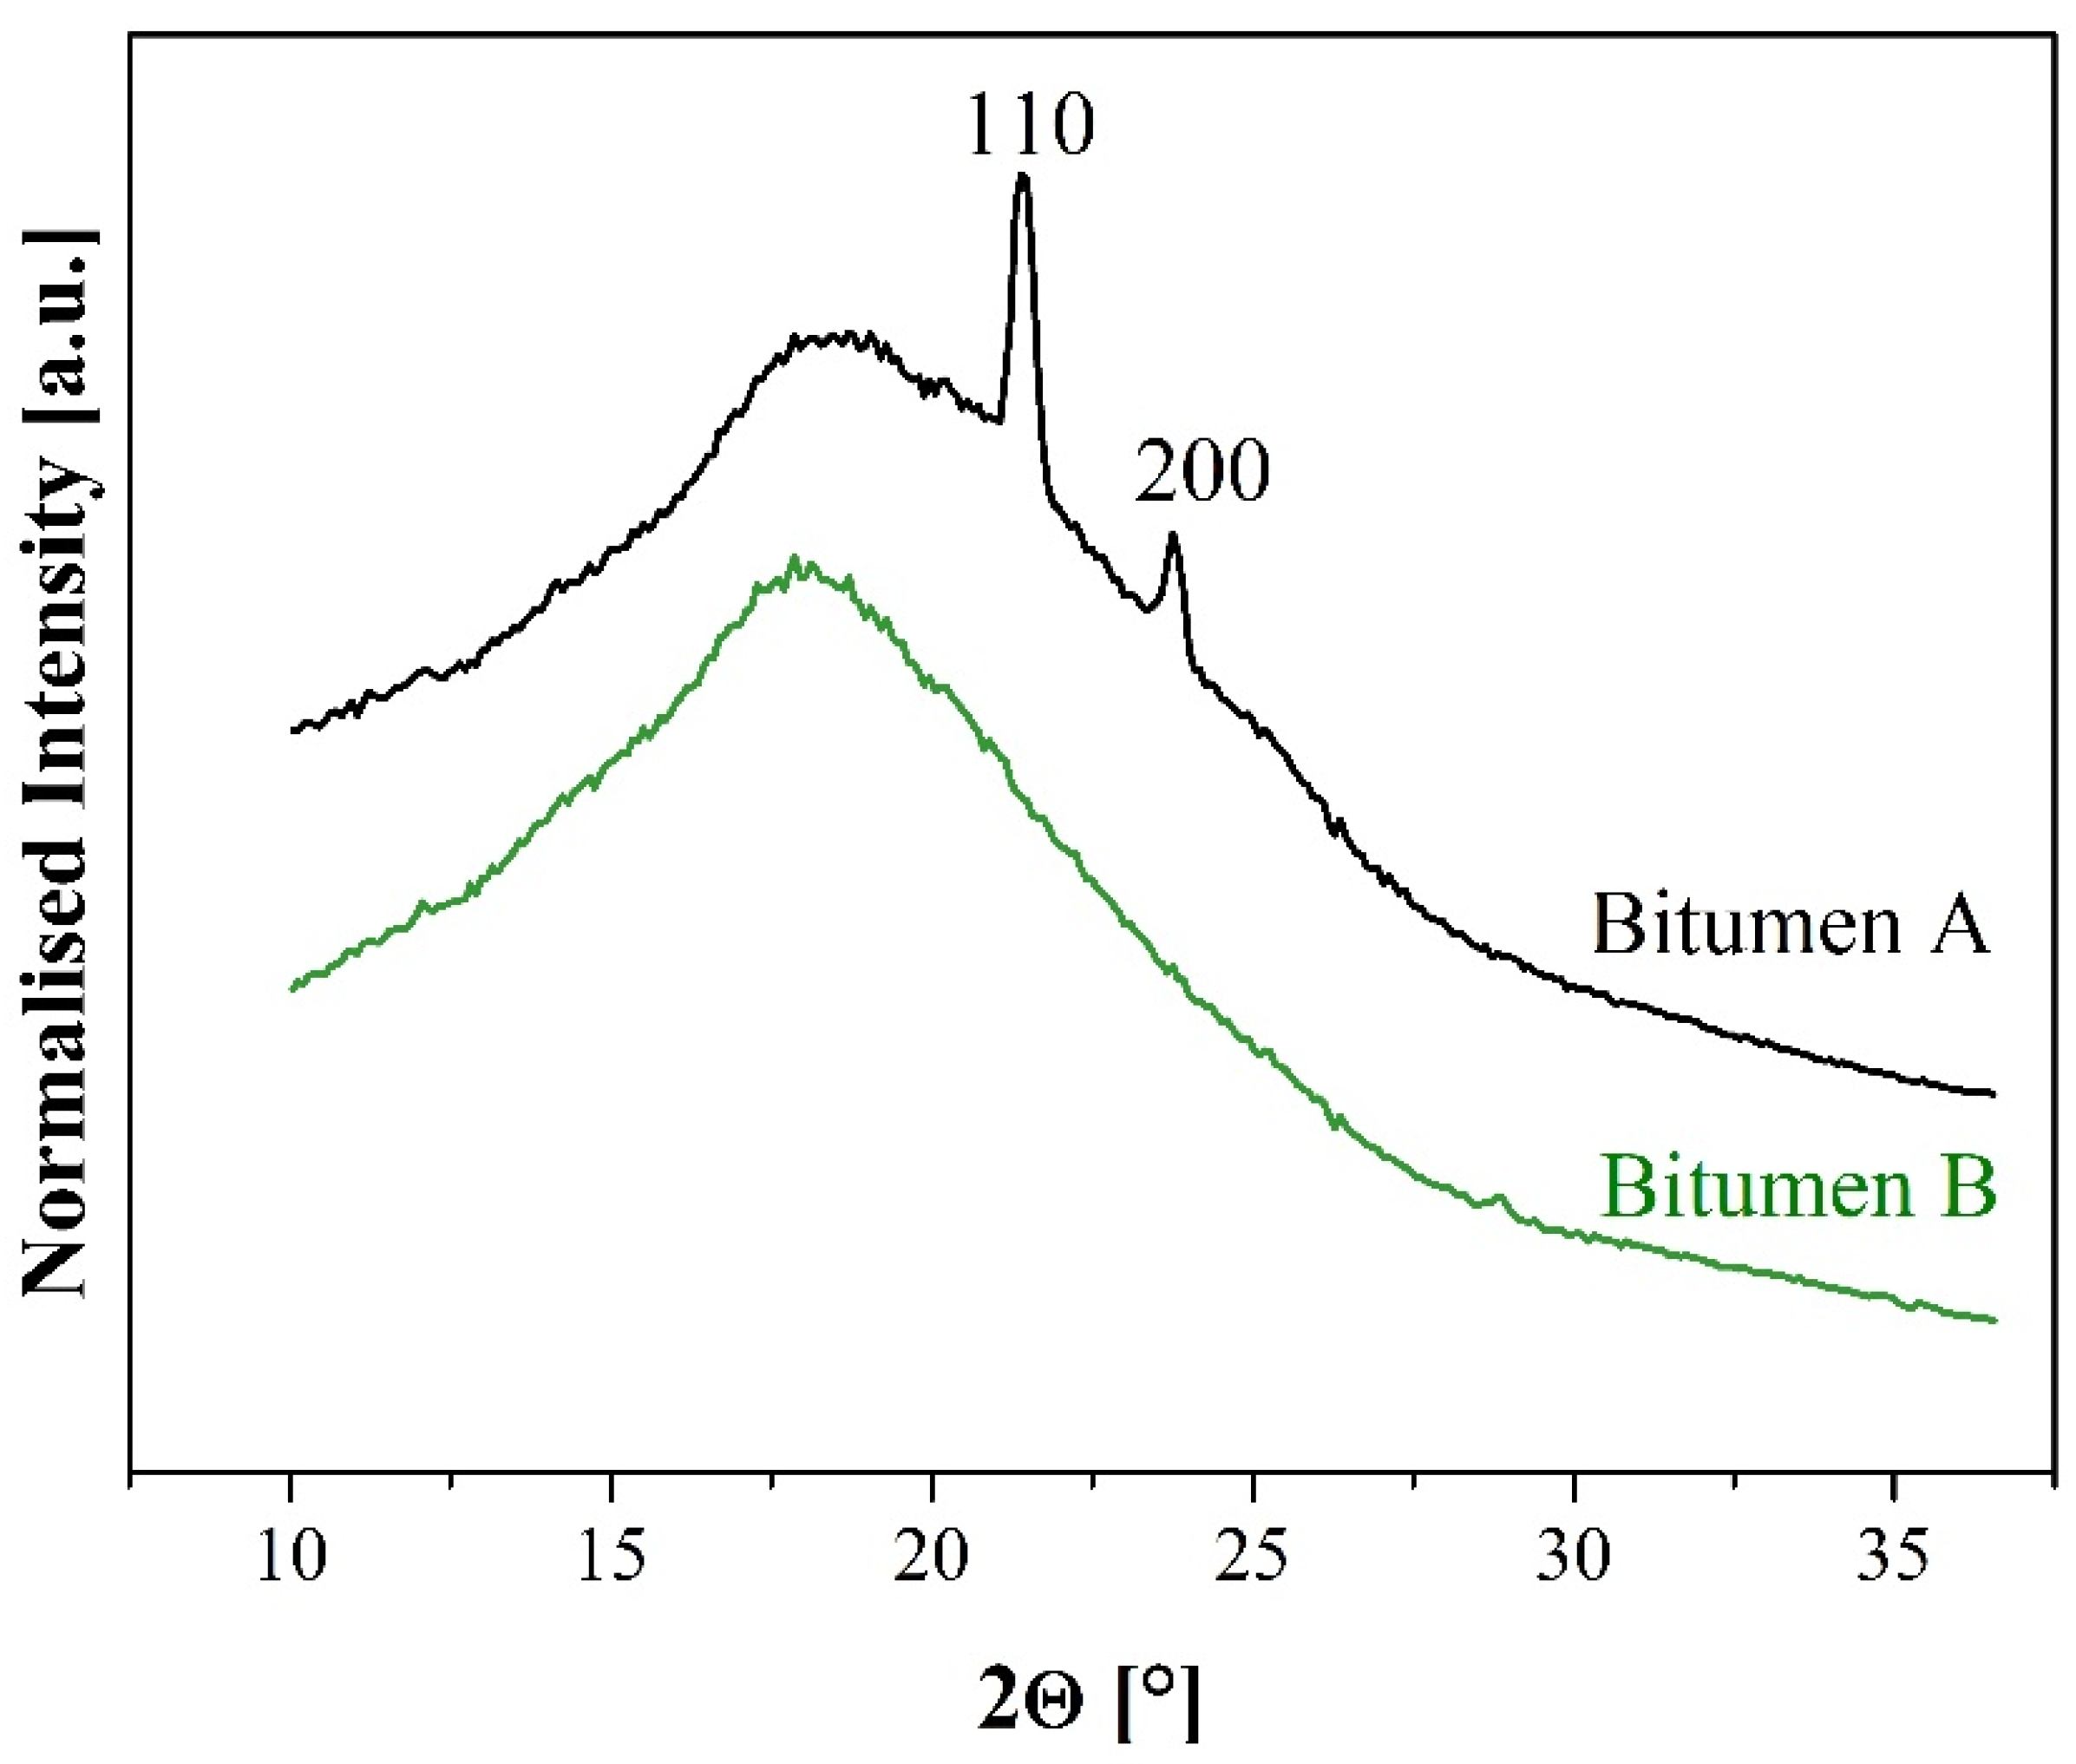
Initially, a WAXD investigation for both bituminous binders was performed at room temperature. As can be seen in
Figure 3, in contrast to bitumen B, only bitumen A contains two sharp crystalline reflections in the WAXD patterns, which are due to orthorhombically organised paraffins as described by Bunn and of which the labelled 110 and 200 reflections are most prominent [
37]. This is in line with the absence of crystallinity expected from the wax-free crude and initially confirmed with DSC.
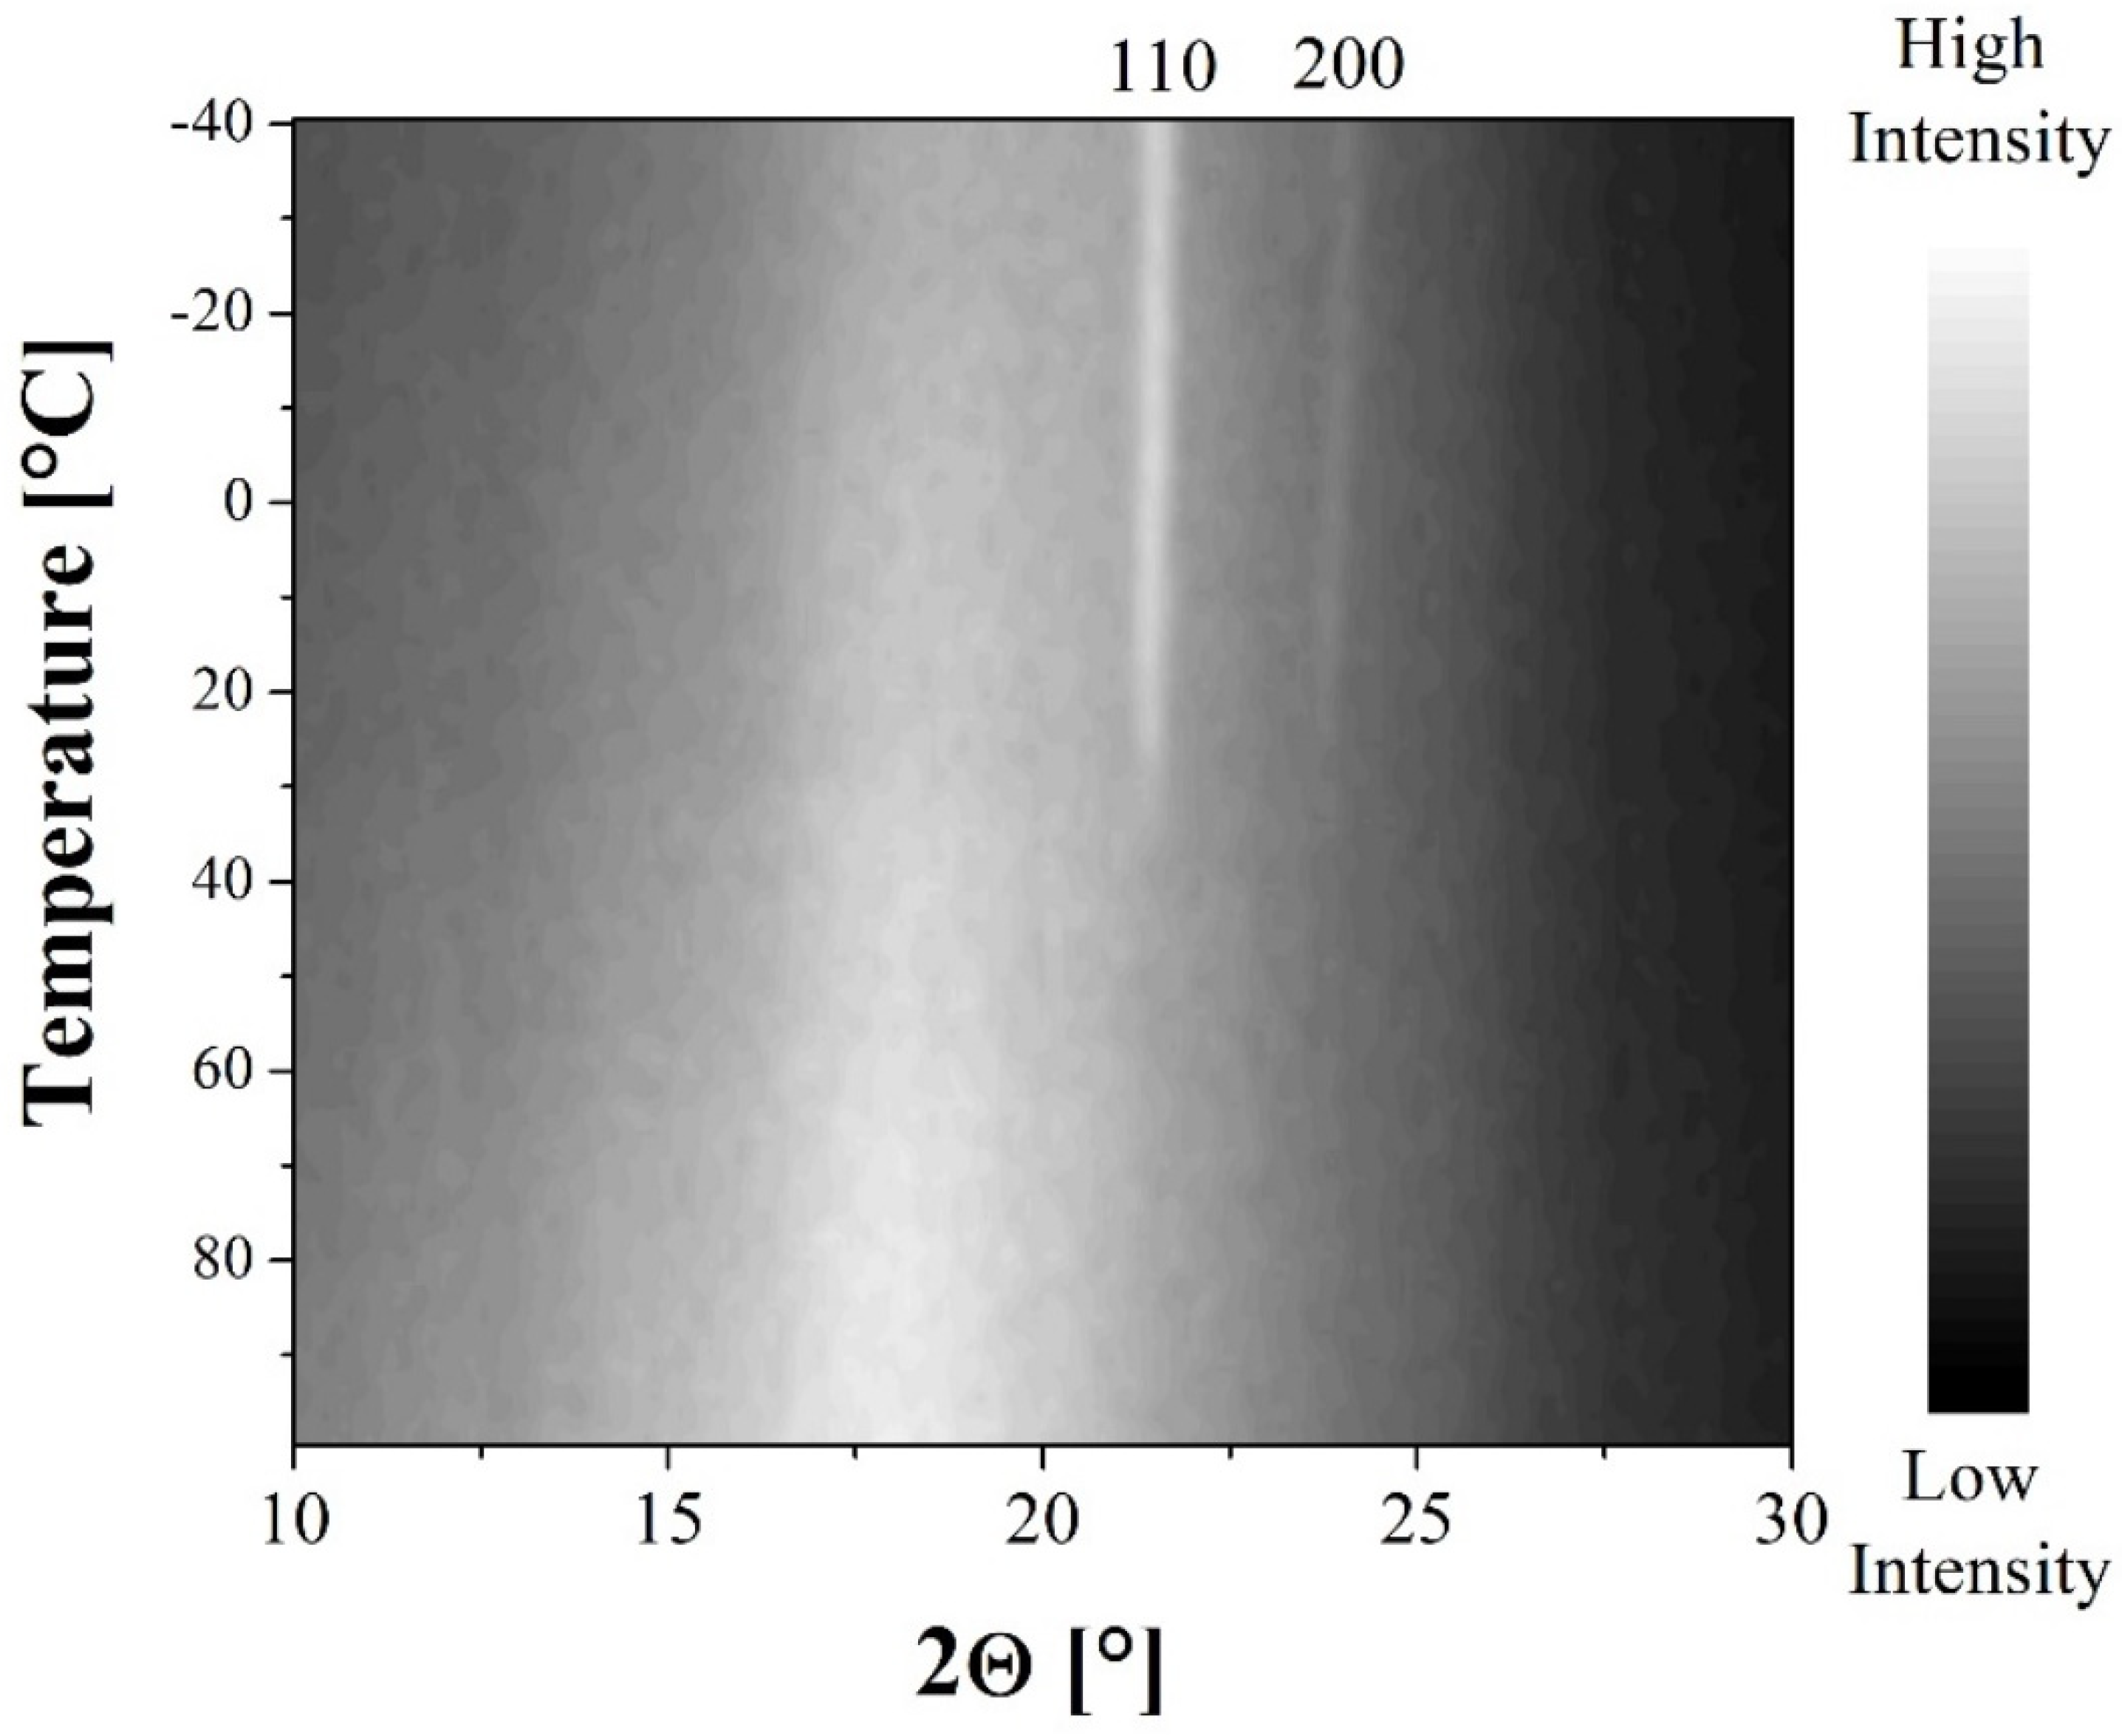
In a second experiment, WAXD patterns for bitumen A, which showed crystalline reflections at room temperature, were recorded during cooling and heating. A representation of the temperature-dependent WAXD patterns during the cooling scan is shown in
Figure 4, in which the scattered intensities are presented by means of a grey scale. It appears that the orthorhombic 110 and 200 reflections are present between roughly +35 and −40 °C and increase upon cooling.
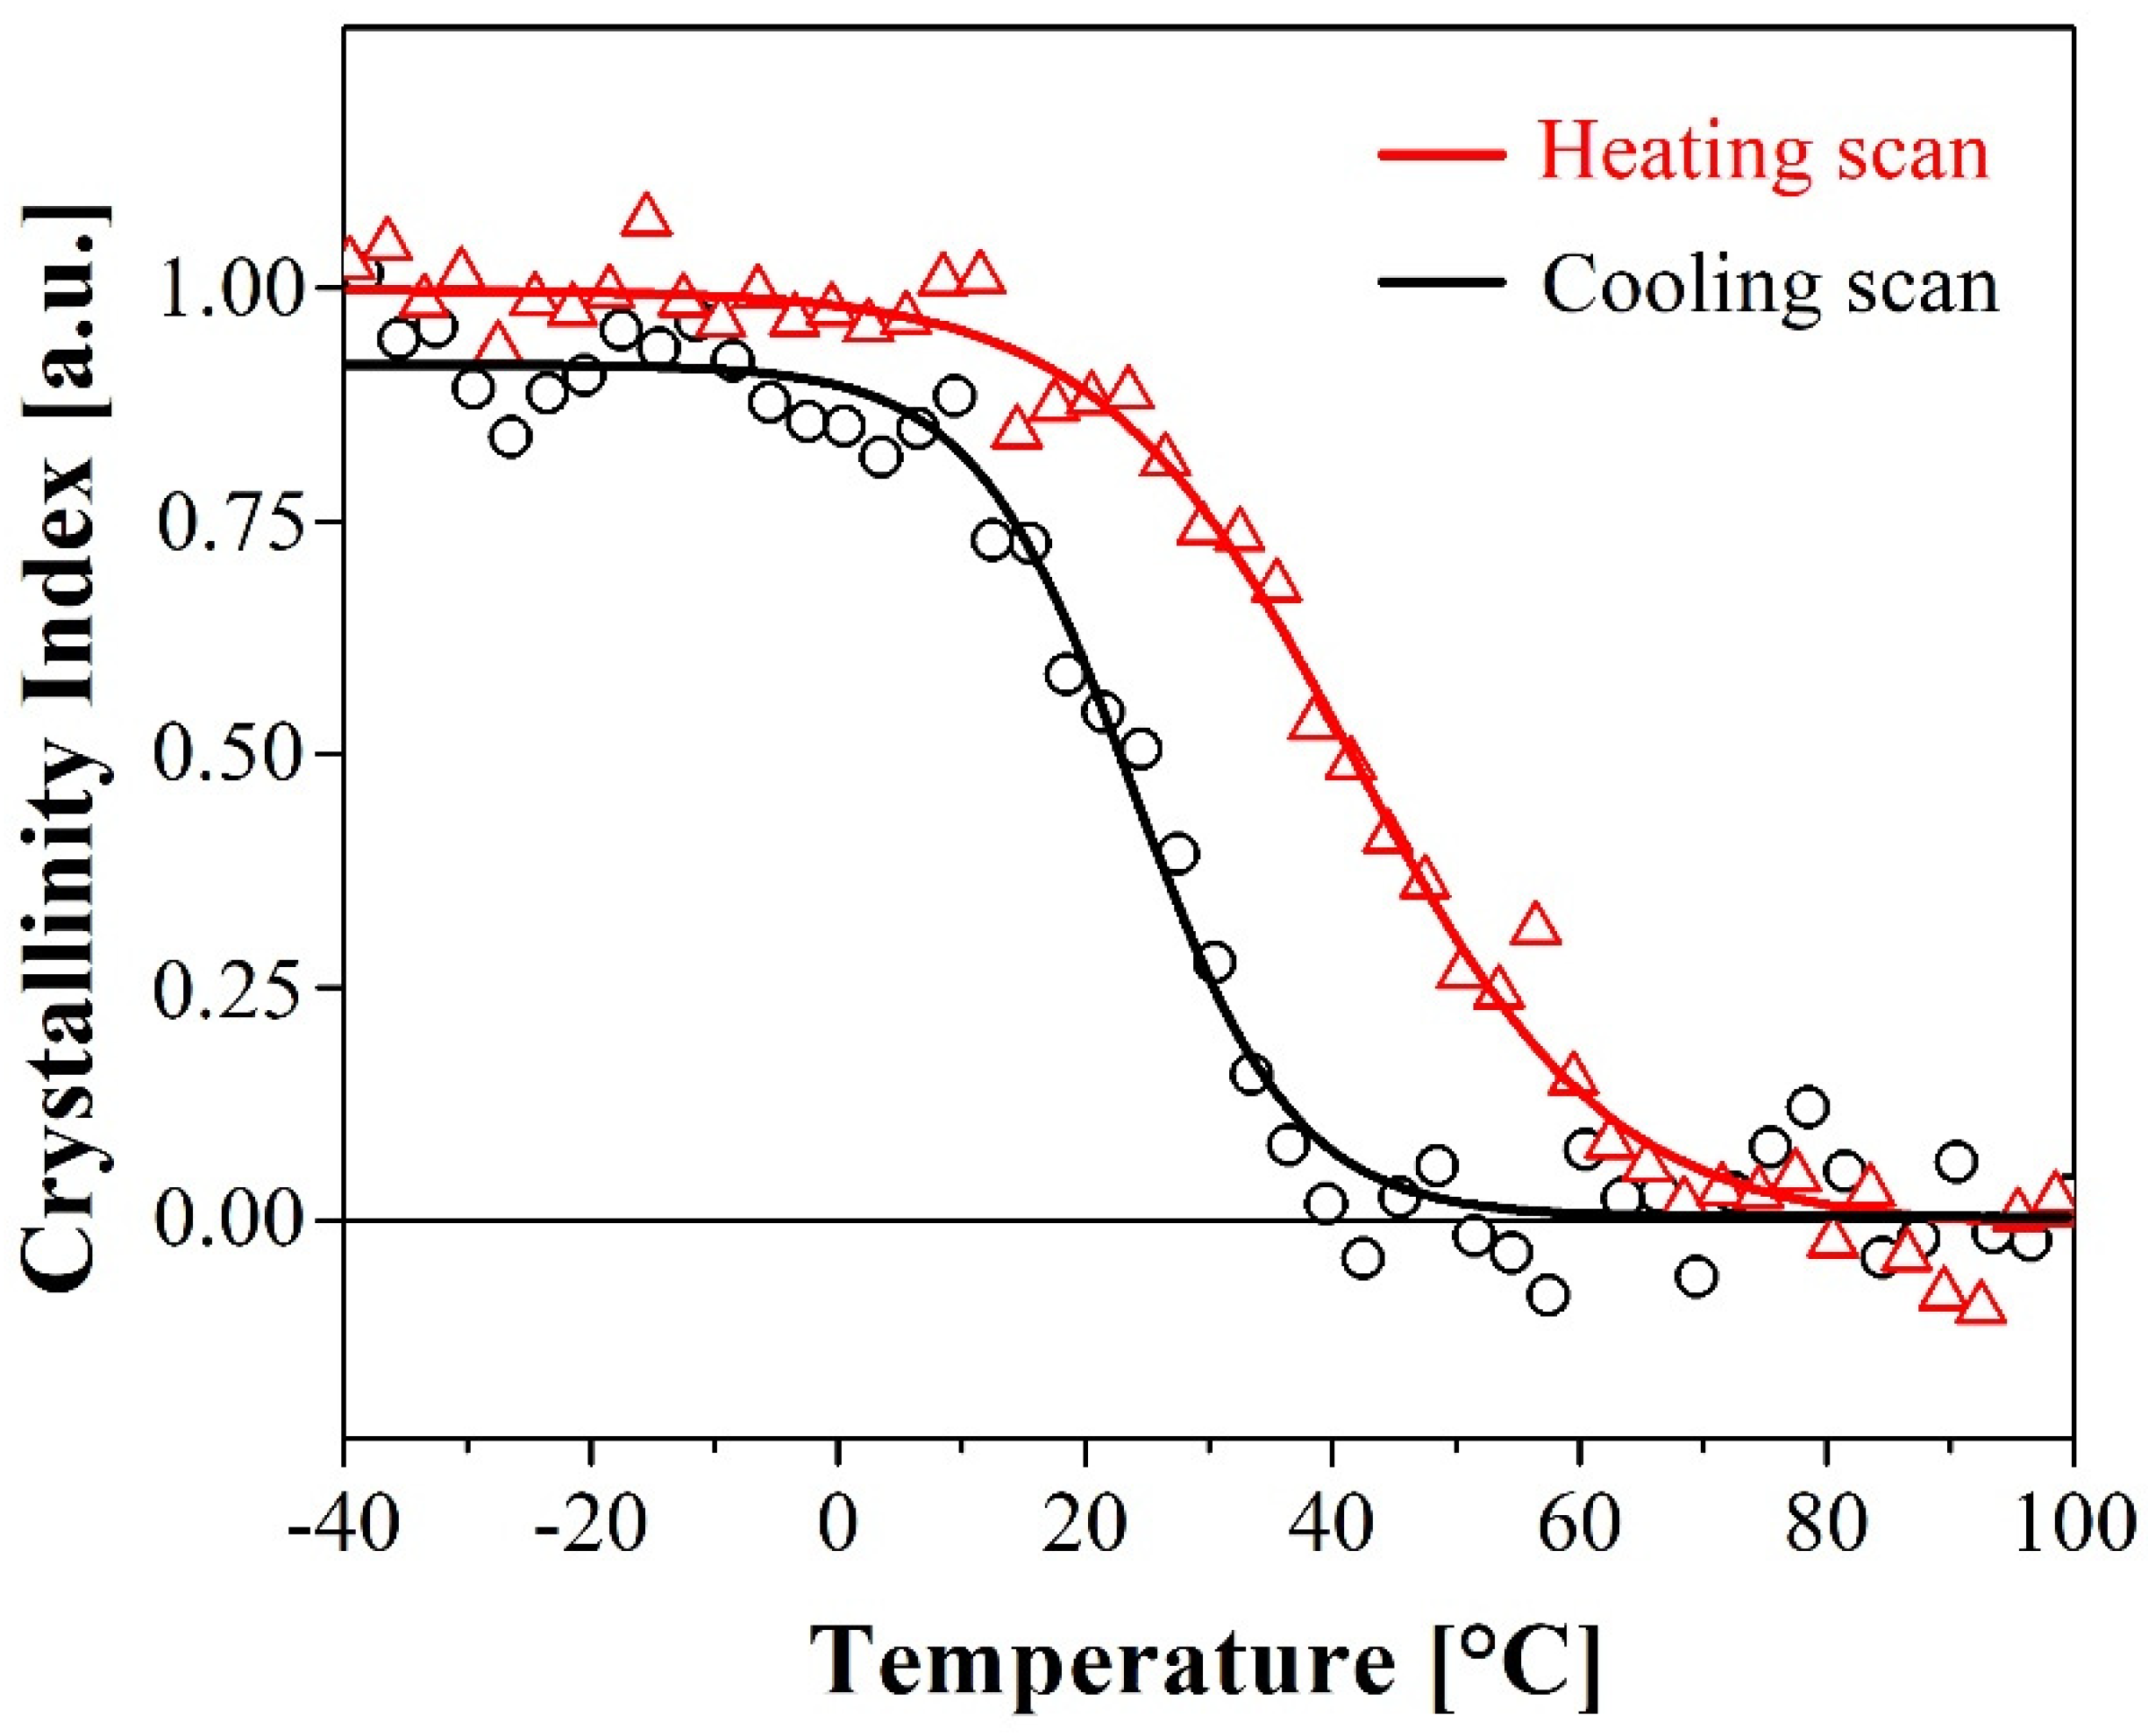
From the integral of the 110 and 200 reflections, a crystallinity index can be obtained as described in
Section 3.2.2. The index was arbitrarily normalised to its value at −40 °C during the heating run. In
Figure 5 this crystallinity index is plotted during the cooling (black data) and heating (red data) scans. For better visualisation of the crystallinity evolution within bitumen A, a smooth sigmoidal fitting curve was added. At low temperatures, both the cooling and heating scans show a plateau of the crystallinity up to 10 and 30 °C, respectively, followed by a steep decrease in intermediate temperatures. At high temperatures, the wax within bitumen A is fully molten and the crystallinity equals zero. The end melting temperature is around 70 °C for the heating scan which is in agreement with the DSC reported temperature. Similar to DSC, undercooling effects are observed by WAXD and the onset of crystallinity at around 50 °C corresponds very well to the DSC temperatures. The starting value of the crystallinity in the heating run also seems to be slightly higher than the end value of the cooling run, indicating that additional crystallinity was generated during the short isothermal stay at −40 °C.
4.3. CLSM
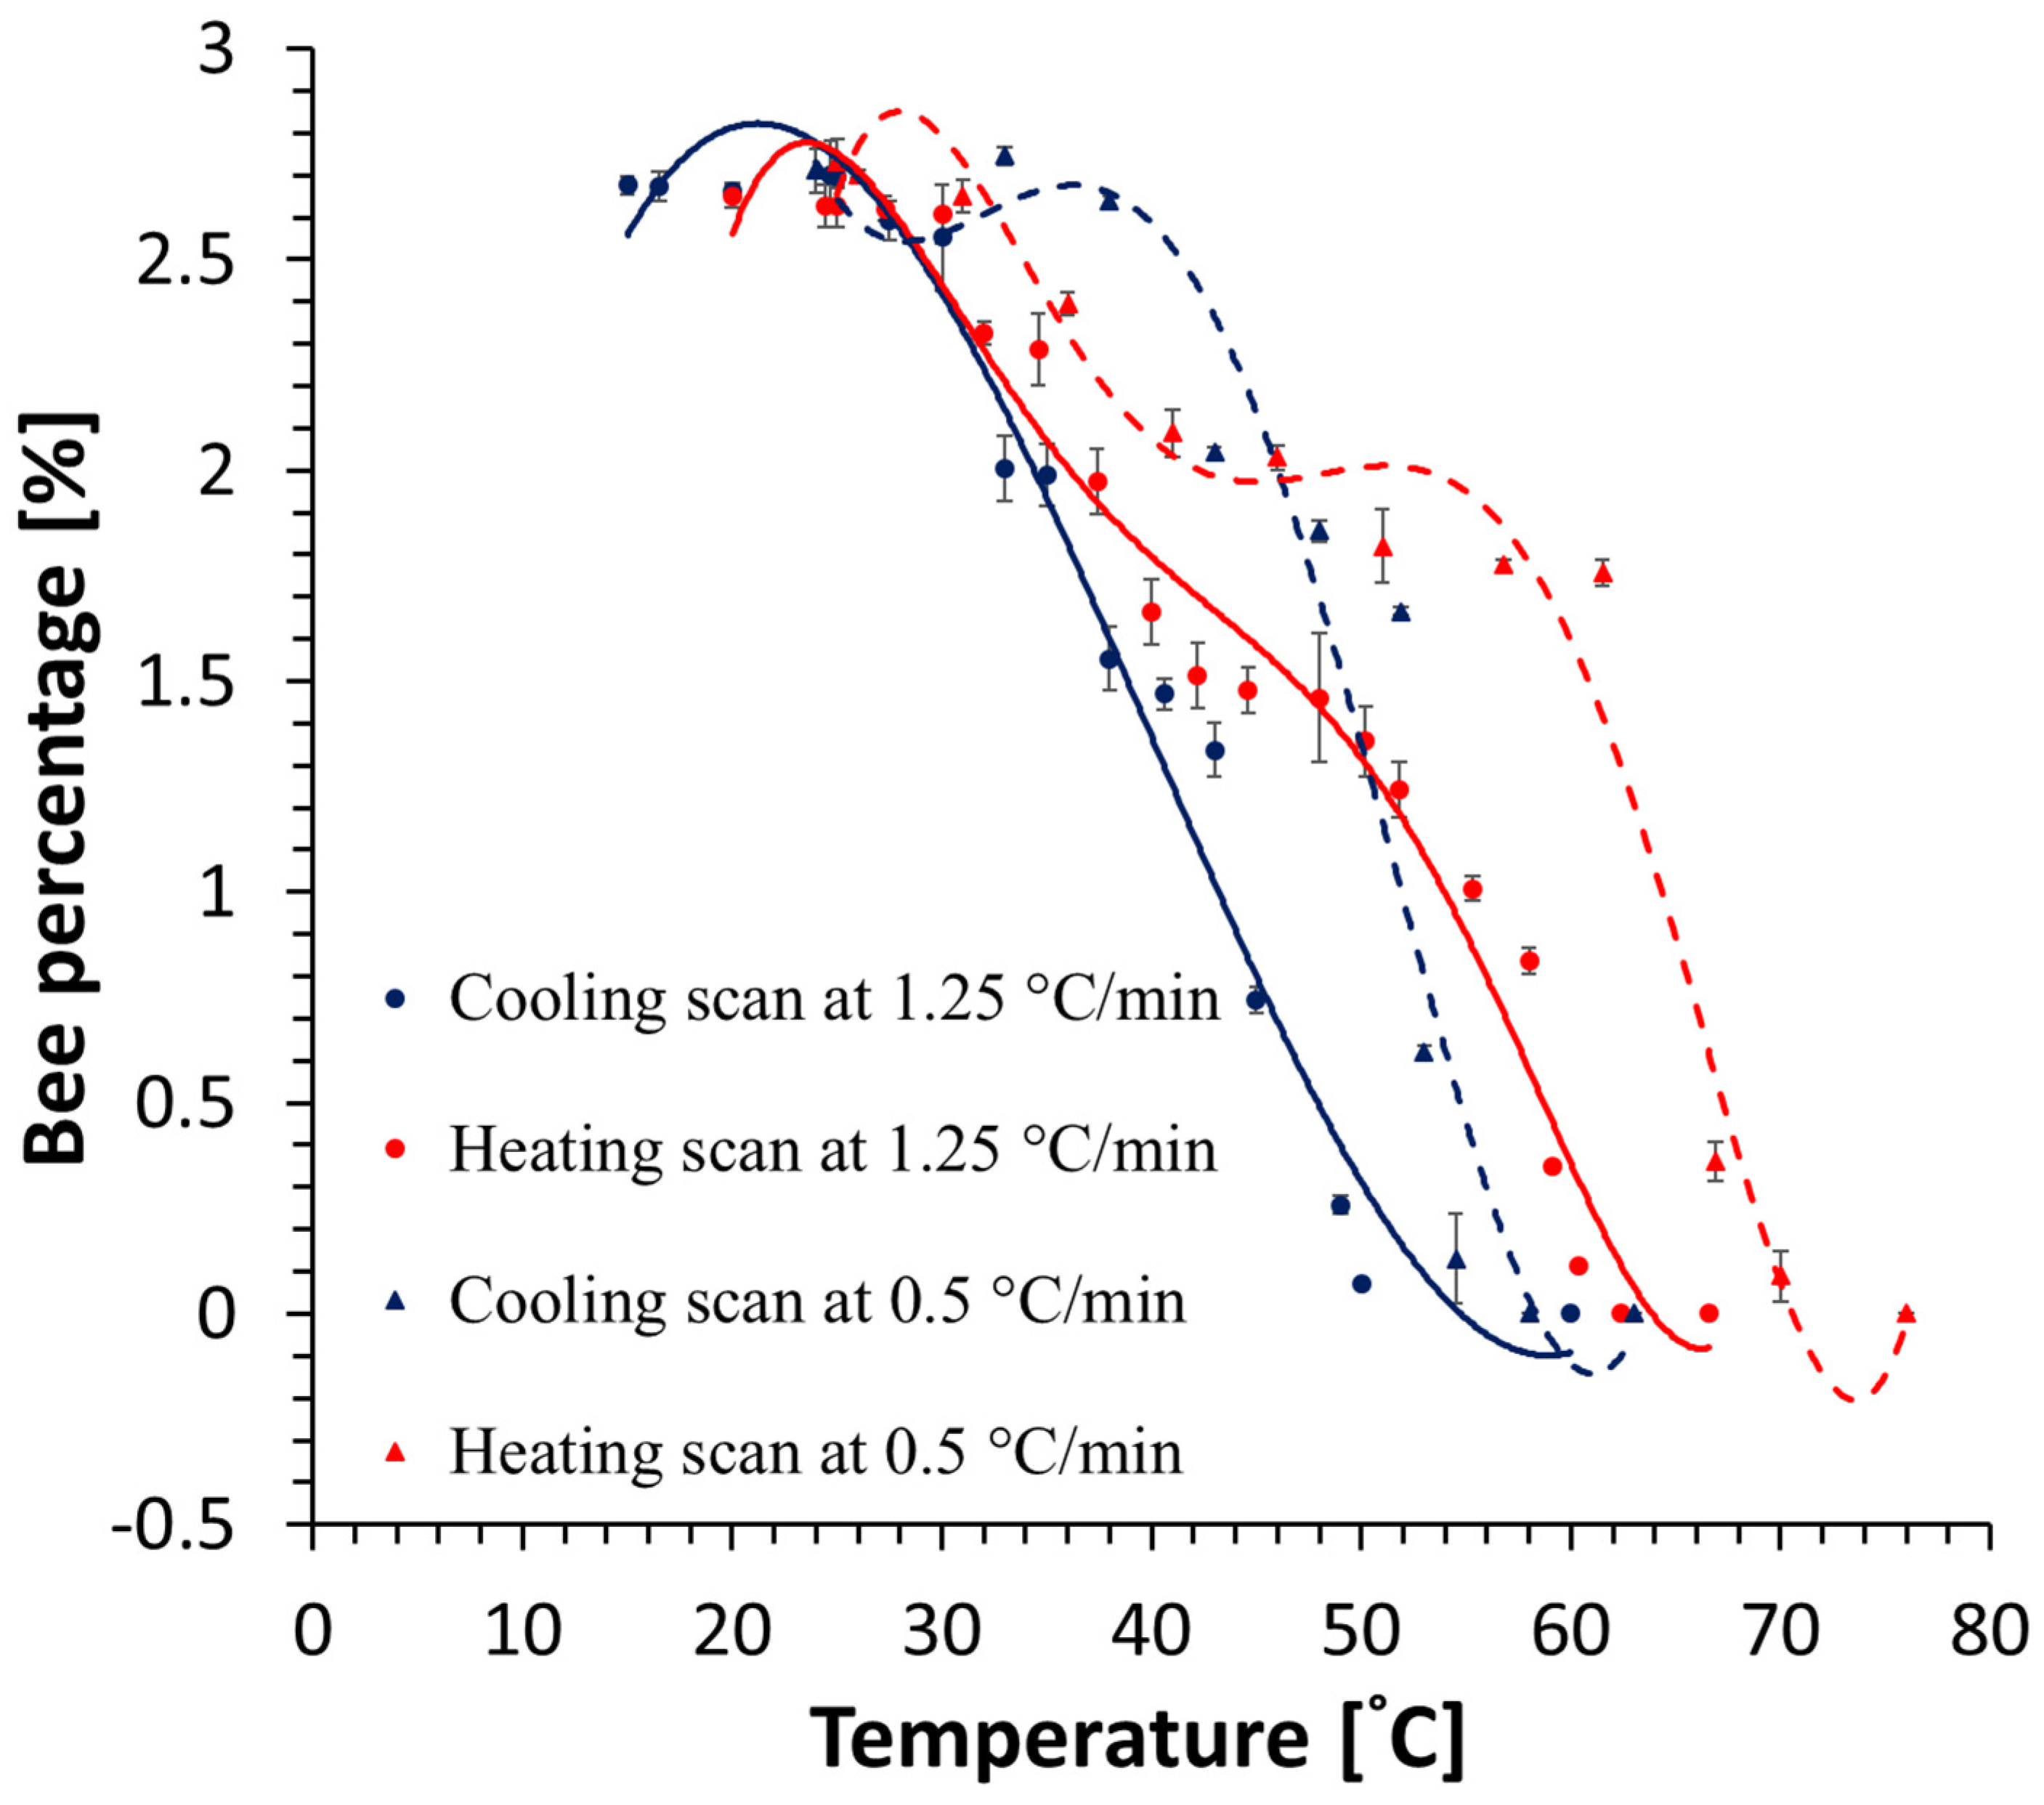
With CLSM, the percentage of the bee structures (% of the total area) for bitumen A is given in
Figure 6, within the temperature range between +10 and +80 °C, during cooling and heating at two different rates. Only the microstructure evolution of bitumen A was investigated, as the non-waxy bitumen B showed no microstructural characteristics in accordance with other studies [
38].
The analysis of the CLSM images shows that during the faster cooling/heating rate, the bees start to form at +50 °C and their percentage increases quickly when cooling further between +50 and +30 °C. In the subsequent heating cycle, the bee percentage decreases in a slightly larger temperature range, between +30 and +60 °C. For the cooling and subsequent heating cycle recorded at a slower rate, the effects are very similar, but the temperatures are shifted to higher values. This indicates that during a slow cooling, there is more time to form larger and more perfect crystals, which, in the corresponding heating cycle, have a higher melting temperature. In addition, in the slower heating and cooling scan, the bee percentage seems to develop in two steps, a steep change between 0 and 2% and then a less steep change up to 2.7% bee area. At this moment, it is not fully clear how to interpret this observation. Some possible reasons for this observation could be related to the parallel viscosity increase/decrease in the binder upon cooling/heating, which, at a certain point, may start to hinder the crystallinity formation or the phase separation of the melt in the paraffin-rich and paraffin-poor phases before crystallisation.
The observations support that the appearance/disappearance of WAXD patterns coincide well with the observed changes in the bee structures and to the thermal observations in DSC. In particular, if one considers that the experimental conditions are not exactly the same, cooling rates are much slower in CLSM as compared to DSC and WAXD and that microscopy is following a surface feature while DSC and WAXD are measuring bulk properties.
In
Figure 7 and
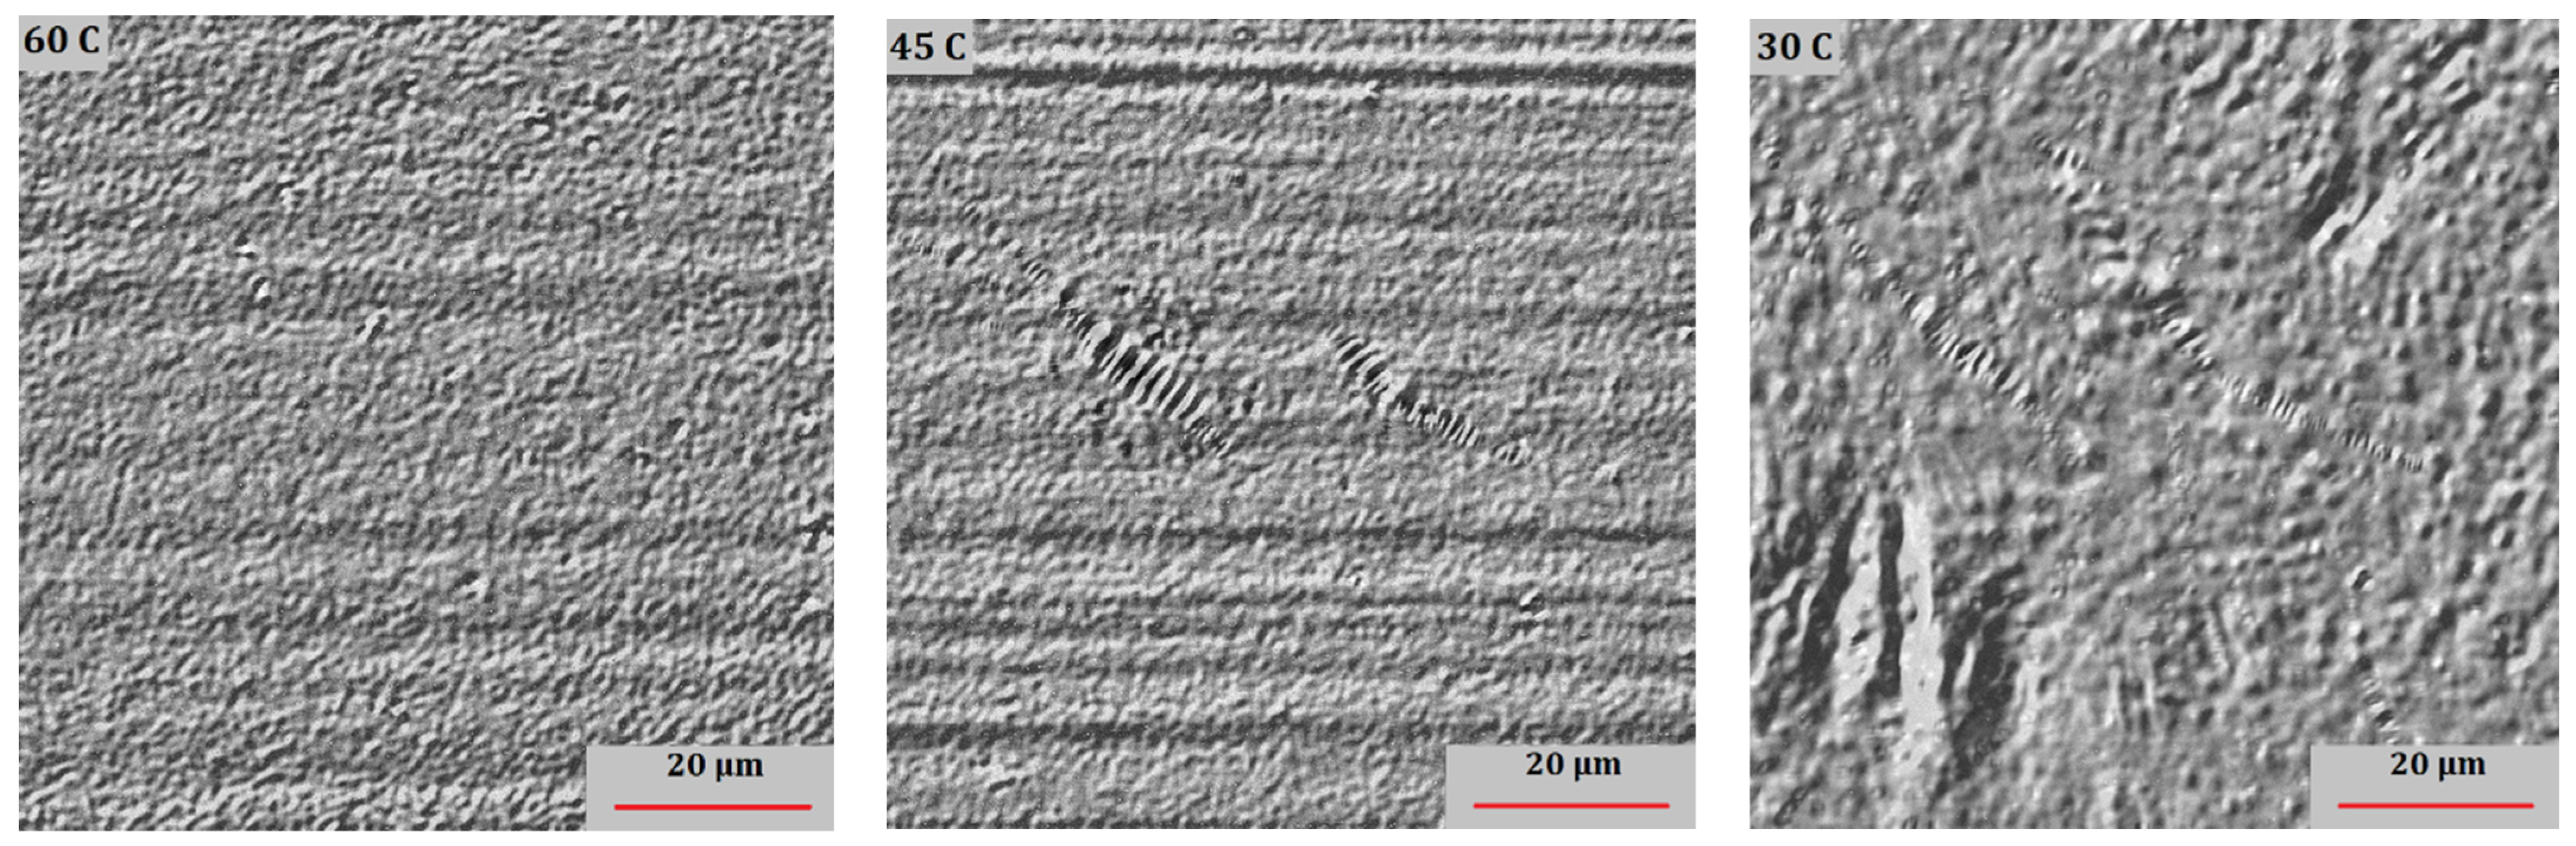
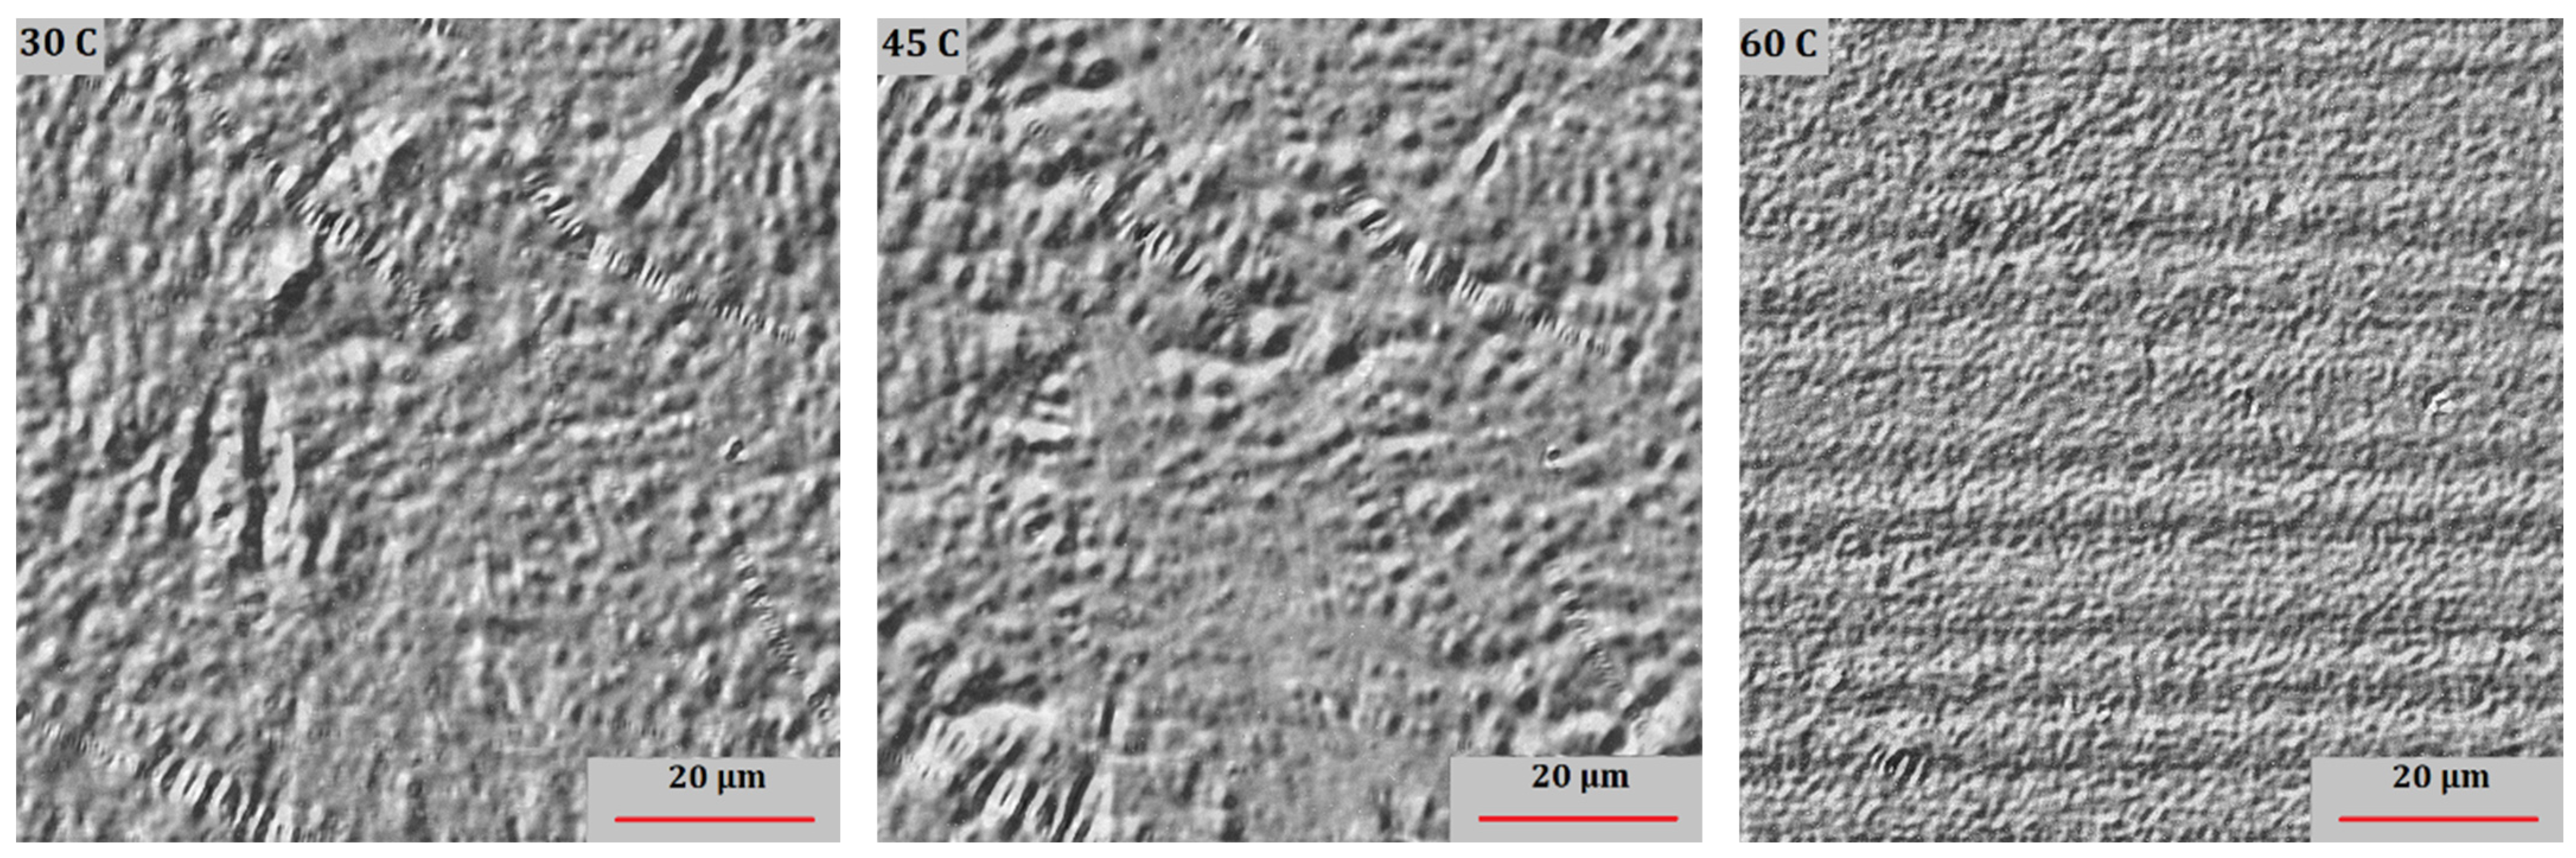
Figure 8, selected temperatures of the cooling, respectively heating scan for bitumen A (rate 1.25 °C/min) are represented. It can be seen in
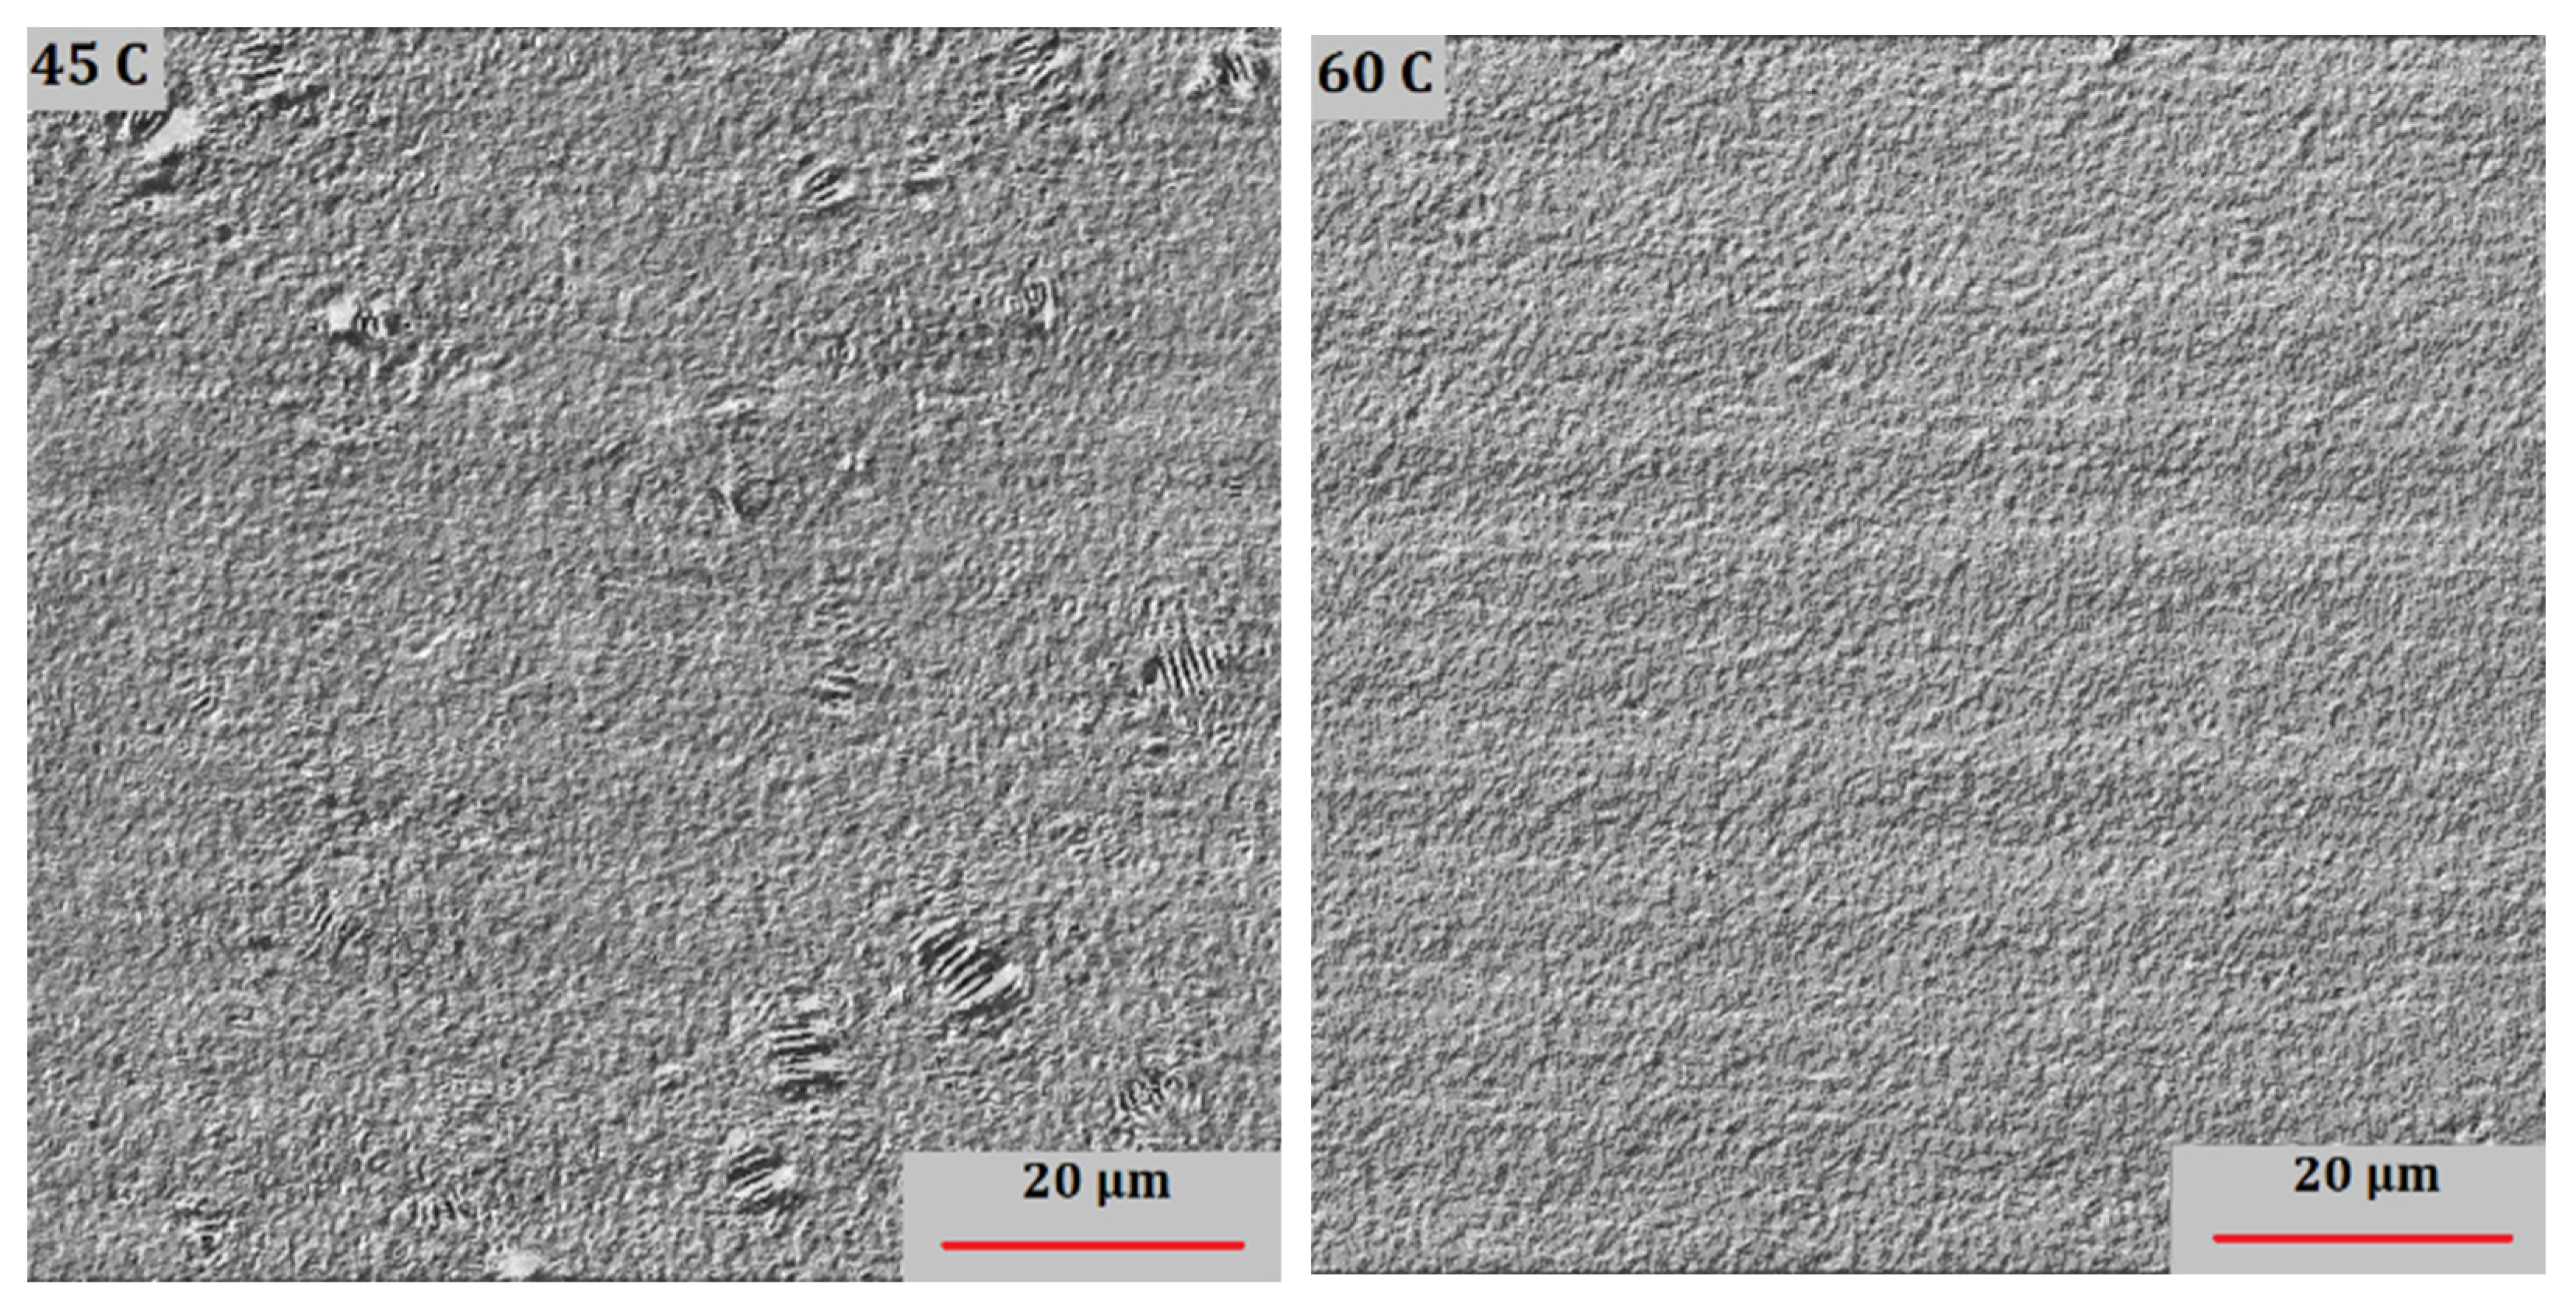
Figure 7 that progressively the bee structures are formed during cooling. The bee structures appear at temperatures below 50 °C and they can be clearly seen at 45 °C. Similarly, as shown in
Figure 8, the bee structures disappear at temperatures greater than 60 °C during heating, in line with the end melting temperature of DSC. Apart from the bee structure formation upon cooling, it was noticed that the surface becomes coarser upon further cooling, whereas any potential vertical-like artefacts are due to small sample movements.
For the sample that was annealed 24 h at room temperature (
Figure 9), this was prepared by placing a drop of binder on a hot plate (120 °C) and cooling it almost immediately to room temperature. When heating this binder at 1.25 °C/min, the authors noted that in this case, the bees disappeared already at 55 °C, so even faster as observed in the case of
Figure 7 and
Figure 8, where a sample was first cooled and subsequently heated at 1.25 °C/min rate. Hence, it seems that the cooling rate before recording the heating scan, rather than an isothermal annealing, determines at what temperature the bees disappear in the subsequent heating scan.
5. Conclusions
This work investigated two bituminous binders, a wax-free and a wax-containing sample using three techniques: DSC, WAXD and CLSM. It attempted to give some answers for the reason behind the CLSM surface microstructure patterns, the so-called bee structures in bitumen, and also to relate thermal transitions to changes in the X-ray diffraction pattern.
The DSC results were as expected, the wax-free binder displayed a glass transition and no other thermal effects. The wax-containing binder showed an exotherm upon cooling followed by a glass transition, while upon heating a broad endotherm including some cold crystallisation, was obvious. There was an influence of annealing, after leaving this sample for 24 h at room temperature, as the shape of the broad endotherm changed, with a negligible effect on the melting enthalpy.
The WAXD results at room temperature showed crystalline diffractions, for the waxy binder only. The diffraction pattern showed that the crystalline material has an orthorhombic unit cell, similar to what is observed for polyethylene. Heating and cooling scans revealed that the WAXD pattern disappeared at around 70 °C during heating, and was formed during cooling at around 50 °C.
The CLSM indicates that on the surface of the waxy binder bee structures are formed, upon cooling, which disappear upon heating. Two cooling, respectively heating rates were studied, and this has an influence on the temperatures where bees are formed or disappear. In CLSM, the cooling and heating rates were much slower as compared to the DSC and WAXD study. The wax-free binder did not show any surface structure.
The correspondence between the various techniques and the temperature ranges where patterns are formed and disappear confirm that wax crystallinity is the reason for the endo- and exothermic transitions in DSC and also for the bee structure formation in bitumen. Finally, it is important to highlight the differences that exist between the techniques which can be related to the specifications and working principles of each technique; the bee structures via CLSM are a surface phenomenon, while the DSC and WAXD tests are related to bulk properties.
Author Contributions
G.P.: Methodology, Investigation, Validation, Software, Formal analysis, Writing—Original draft preparation, H.S.: Conceptualization, Supervision, Investigation, Validation, Writing—Original draft preparation, B.G.: Methodology, Investigation, Validation, Formal analysis Writing—Original draft preparation, J.B.: Investigation, Validation, Writing—Review and Editing, X.L.: Conceptualization, Writing—Review and Editing. All authors have read and agreed to the published version of the manuscript.
Funding
This research received no external funding.
Institutional Review Board Statement
Not applicable.
Informed Consent Statement
Not applicable.
Data Availability Statement
Not applicable.
Acknowledgments
The authors gratefully acknowledge the University of Antwerp for funding the AQ²UABIT (project nr. 40204) and the FWO/WOG project (project nr. 46958) as well as KU Leuven, Nynas and DESY for providing the necessary lab equipment.
Conflicts of Interest
The authors have no competing interest to declare that are relevant to the content of this article.
References
- European Bitumen Association-Eurobitume. The Bitumen Industry: A Global Perspective; Asphalt Institute Inc.: Lexington, KY, USA, 2015. [Google Scholar]
- Corbett, L.W.; Merz, R.E. Asphalt Binder Hardening in the Michigan Test Road after 18 Years of Service. Transp. Res. Rec. 1975, 27–34. [Google Scholar]
- Mühlich, U.; Pipintakos, G.; Tsakalidis, C. Mechanism based diffusion-reaction modelling for predicting the influence of SARA composition and ageing stage on spurt completion time and diffusivity in bitumen. Constr. Build. Mater. 2020, 267, 120592. [Google Scholar] [CrossRef]
- Lu, X.; Soenen, H.; Sjövall, P.; Pipintakos, G. Analysis of asphaltenes and maltenes before and after long-term aging of bitumen. Fuel 2021, 304, 121426. [Google Scholar] [CrossRef]
- Carbognani, L.; DeLima, L.; Orea, M.; Ehrmann, U. Studies on large crude oil alkanes. II. Isolation and characterization of aromatic waxes and waxy asphlatnes. Pet. Sci. Technol. 2000, 18, 607–634. [Google Scholar] [CrossRef]
- Djabourov, M.; Volle, J.; Kane, M.; Lechaire, J.; Frebourg, G. Morphology of paraffin crystals in waxy crude oils cooled in quiescent conditions and under flow. Fuel 2003, 82, 127–135. [Google Scholar] [CrossRef]
- Lu, X.; Sjövall, P.; Soenen, H. Structural and chemical analysis of bitumen using time-of-flight secondary ion mass spectrometry (TOF-SIMS). Fuel 2017, 199, 206–218. [Google Scholar] [CrossRef]
- Claudy, P.; Letoffe, J.M.; King, G.N.; Plancke, J.P. Characterization of asphalts cements by thermomicroscopy and differential scanning calorimetry: Correlation to classic physical properties. Fuel Sci. Technol. Int. 1992, 10, 735–765. [Google Scholar] [CrossRef]
- Sreeram, A.; Blomdahl, D.; Misztal, P.; Bhasin, A. High resolution chemical fingerprinting and real-time oxidation dynamics of asphalt binders using Vocus Proton Transfer Reaction (PTR-TOF) mass spectrometry. Fuel 2022, 320, 123840. [Google Scholar] [CrossRef]
- Pipintakos, G.; Ching, H.Y.V.; Soenen, H.; Sjövall, P.; Mühlich, U.; van Doorslaer, S.; Varveri, A.; van den Bergh, W.; Lu, X. Experimental investigation of the oxidative ageing mechanisms in bitumen. Constr. Build. Mater. 2020, 260, 119702. [Google Scholar] [CrossRef]
- Pipintakos, G.; Soenen, H.; Ching, H.Y.V.; Velde, C.V.; van Doorslaer, S.; Lemière, F.; Varveri, A.; van den Bergh, W. Exploring the oxidative mechanisms of bitumen after laboratory short- and long-term ageing. Constr. Build. Mater. 2021, 289, 123182. [Google Scholar] [CrossRef]
- Mullins, O.C. The Modified Yen Model. Energy Fuels 2010, 24, 2179–2207. [Google Scholar] [CrossRef]
- Mullins, O.C.; Sabbah, H.; Pomerantz, A.E.; Andrews, A.B.; Ruiz-Morales, Y.; Mostow, F.; Mcfarlane, R.; Goual, L.; Lepkowicz, R.; Cooper, T.; et al. Advances in Asphaltene Science and the Yen–Mullins Model. Energy Fuels 2012, 26, 3986–4003. [Google Scholar] [CrossRef]
- Eyssautier, J.; Levitz, P.; Espinat, D.; Jestin, J.; Grillo, I.; Barr, L. Insight into Asphaltene Nanoaggregate Structure Inferred by Small Angle Neutron and X-ray Scattering. J. Phys. Chem. B 2011, 115, 6827–6837. [Google Scholar] [CrossRef] [PubMed]
- Ramm, A.; Downer, M.C.; Sakib, N.; Bhasin, A. Morphology and kinetics of asphalt binder microstructure at gas, liquid and solid interfaces. J. Microsc. 2019, 276, 109–117. [Google Scholar] [CrossRef] [PubMed] [Green Version]
- Pipintakos, G.; Hasheminejad, N.; Lommaert, C.; Bocharova, A.; Blom, J. Application of Atomic Force (AFM), Environmental Scanning Electron (ESEM) and Confocal Laser Scanning Microscopy (CLSM) in bitumen: A review of the ageing effect. Micron 2021, 147, 103083. [Google Scholar] [CrossRef]
- Pipintakos, G.; Blom, J.; Soenen, H.; van den Bergh, W. Coupling AFM and CLSM to investigate the effect of ageing on the bee structures of bitumen. Micron 2021, 151, 103149. [Google Scholar] [CrossRef]
- Fischer, H.; Poulikakos, L.D.; Planche, J.-P.; Das, P.; Grenfell, J. Challenges While Performing AFM on Bitumen. In Multi-Scale Modeling and Characterization of Infrastructure Materials; Kringos, N., Birgisson, B., Frost, D., Wang, L., Eds.; Springer: Dordrecht, The Netherlands, 2013; pp. 89–98. [Google Scholar] [CrossRef]
- Soenen, H.; Besamusca, J.; Fischer, H.R.; Poulikakos, L.D.; Planche, J.; Das, P.K. Laboratory investigation of bitumen based on round robin DSC and AFM tests. Mater. Struct. 2013, 47, 1205–1220. [Google Scholar] [CrossRef]
- Zhang, H.; Xie, Q.; Ding, H.; Rahman, A. Spectroscopic ellipsometry studies on optical constants of crystalline wax-doped asphalt binders. Int. J. Pavement Eng. 2022, 1–13. [Google Scholar] [CrossRef]
- Blom, J.; Soenen, H.; van den Brande, N.; van den Bergh, W. New evidence on the origin of ‘bee structures’ on bitumen and oils, by atomic force microscopy (AFM) and confocal laser scanning microscopy (CLSM). Fuel 2021, 303, 121265. [Google Scholar] [CrossRef]
- Huang, Z.; Zheng, S.; Fogler, H.S. Wax Deposition: Experimental Characterizations, Theoretical Modeling, and Field Practices; CRC Press: Boca Raton, FL, USA, 2016. [Google Scholar]
- Ding, H.; Hesp, S.A.M. Quantification of crystalline wax in asphalt binders using variable-temperature Fourier-transform infrared spectroscopy. Fuel 2020, 277, 118220. [Google Scholar] [CrossRef]
- Lu, X.; Redelius, P. Effect of bitumen wax on asphalt mixture performance. Constr. Build. Mater. 2007, 21, 1961–1970. [Google Scholar] [CrossRef]
- Soenen, H.; Redelius, P. The effect of aromatic interactions on the elasticity of bituminous binders. Rheol. Acta 2014, 53, 741–754. [Google Scholar] [CrossRef]
- Ding, H.; Qiu, Y.; Rahman, A. Low-Temperature Reversible Aging Properties of Selected Asphalt Binders Based on Thermal Analysis. J. Mater. Civ. Eng. 2019, 31, 4018402. [Google Scholar] [CrossRef]
- Claudy, P.M.; Létoffé, J.M.; Martin, D.; Planche, J.P. Thermal behavior of asphalt cements. Thermochim. Acta 1998, 324, 203–213. [Google Scholar] [CrossRef]
- Apostolidis, P.; Elwardany, M.; Porot, L.; Vansteenkiste, S.; Chailleux, E. Glass transitions in bituminous binders. Mater. Struct. 2021, 54, 132. [Google Scholar] [CrossRef]
- Ding, H.; Zhang, H.; Zhang, H.; Liu, D.; Qiu, Y.; Hussain, A. Separation of wax fraction in asphalt binder by an improved method and determination of its molecular structure. Fuel 2022, 322, 124081. [Google Scholar] [CrossRef]
- Polacco, G.; Filippi, S.; Paci, M.; Giuliani, F.; Merusi, F. Structural and rheological characterization of wax modified bitumens. Fuel 2012, 95, 407–416. [Google Scholar] [CrossRef]
- Lu, X.; Redelius, P. Compositional and Structural Characterization of Waxes Isolated from Bitumens. Energy Fuels 2006, 20, 653–660. [Google Scholar] [CrossRef]
- Koch, M.H.J.; Bordas, J. X-ray diffraction and scattering on disordered systems using synchrotron radiation. Nucl. Instrum. Methods Phys. Res. 1983, 208, 461–469. [Google Scholar] [CrossRef]
- Goderis, B.; Reynaers, H.; Scherrenberg, R.; Mathot, V.B.F.; Koch, M.H.J. Temperature Reversible Transitions in Linear Polyethylene Studied by TMDSC and Time-Resolved, Temperature-Modulated WAXD/SAXS. Macromolecules 2001, 34, 1779–1787. [Google Scholar] [CrossRef]
- Michon, L.C.; Netzel, D.A.; Turner, T.F.; Martin, D.; Planche, J.P. A 13C NMR and DSC study of the amorphous and crystalline phases in asphalts. Energy Fuels 1999, 13, 602–610. [Google Scholar] [CrossRef]
- Frolov, I.N.; Okhotnikova, E.S.; Ziganshin, M.A.; Firsin, A.A. Cold crystallization event on DSC heating curves of bitumen. J. Therm. Anal. Calorim. 2022, 147, 5269–5278. [Google Scholar] [CrossRef]
- Mathot, V.B.F. Calorimetry and Thermal Analysis of Polymers; Hanser Publishers: Munich, Germany, 1994; pp. 207–230. [Google Scholar]
- Bunn, C.W. The crystal structure of long-chain normal paraffin hydrocarbons. The “shape” of the CH2 group. Trans. Faraday Soc. 1939, 25, 482–491. [Google Scholar] [CrossRef]
- Mirwald, J.; Hofko, B.; Pipintakos, G.; Blom, J.; Soenen, H. Comparison of Microscopic Techniques to study the Diversity of the Bitumen Microstructure. Micron 2022, 159, 103294. [Google Scholar] [CrossRef]
| Publisher’s Note: MDPI stays neutral with regard to jurisdictional claims in published maps and institutional affiliations. |
© 2022 by the authors. Licensee MDPI, Basel, Switzerland. This article is an open access article distributed under the terms and conditions of the Creative Commons Attribution (CC BY) license (https://creativecommons.org/licenses/by/4.0/).


