
Hydrogen Bonds in Precursor Solution: The Origin of the Anomalous J–V Curves in Perovskite Solar Cells

 ,
,
Abstract
:1. Introduction
2. Materials and Methods
3. Results and Discussion
4. Conclusions
Supplementary Materials
Author Contributions
Funding
Data Availability Statement
Acknowledgments
Conflicts of Interest
References
- Renno, C.; Perone, A. Energy and economic analysis of a point-focus concentrating photovoltaic system when its installation site varies. Front. Energy 2021, 15, 384. [Google Scholar] [CrossRef]
- Rzetelska, D.; Combrinck, M. Fuel poverty and low carbon emissions: A comparative study of the feasibility of the hybrid renewable energy systems incorporating combined heat and power technology. Front. Energy 2021, 1–21. [Google Scholar] [CrossRef]
- Liu, Z.; Yuan, S.; Yuan, Y.; Li, G.; Wang, Q. A thermoelectric generator and water-cooling assisted high conversion efficiency polycrystalline silicon photovoltaic system. Front. Energy 2021, 15, 358. [Google Scholar] [CrossRef]
- Li, Q.; Yu, J.; Zang, Y.; Wang, N.; Jiang, Y. Enhancement of open circuit voltage in organic solar cells by doping a fluorescent red dye. Front. Energy 2012, 6, 179. [Google Scholar] [CrossRef]
- Meng, F.; Liu, J.; Shen, L.; Shi, J.; Han, A.; Zhang, L.; Liu, Y.; Yu, J.; Zhang, J.; Zhou, R.; et al. High-quality industrial n-type silicon wafers with an efficiency of over 23% for Si heterojunction solar cells. Front. Energy 2017, 11, 78. [Google Scholar] [CrossRef]
- NREL Best Research-Cell Effciences Chart. Available online: https://www.nrel.gov/pv/cell-efficiency.html (accessed on 16 March 2022).
- Li, Y.; Wu, H.; Qi, W.; Zhou, X.; Li, J.; Cheng, J.; Zhao, Y.; Li, Y.; Zhang, X. Passivation of defects in perovskite solar cell: From a chemistry point of view. Nano Energy 2020, 77, 105237. [Google Scholar] [CrossRef]
- Chi, W.; Banerjee, S.K. Progress in Materials Development for the Rapid Efficiency Advancement of Perovskite Solar Cells. Small 2020, 16, 1907531. [Google Scholar] [CrossRef] [PubMed]
- Bhandari, S.; Roy, A.; Mallick, T.K.; Sundaram, S. Impact of different light induced effect on organic hole-transporting layer in perovskite solar cells. Mater. Lett. 2020, 268, 127568. [Google Scholar] [CrossRef]
- Min, H.; Lee, D.; Kim, J.; Kim, G.; Lee, K.S.; Kim, J.; Paik, M.J.; Kim, Y.K.; Kim, K.S.; Kim, M.G.; et al. Perovskite solar cells with atomically coherent interlayers on SnO2 electrodes. Nature 2021, 598, 444. [Google Scholar] [CrossRef]
- Cai, M.; Wu, Y.; Chen, H.; Yang, X.; Qiang, Y.; Han, L. Cost-Performance Analysis of Perovskite Solar Modules. Adv. Sci. 2017, 4, 1600269. [Google Scholar] [CrossRef]
- Zheng, X.; Chen, B.; Dai, J.; Fang, Y.; Bai, Y.; Lin, Y.; Wei, H.; Zeng, X.C.; Huang, J. Defect passivation in hybrid perovskite solar cells using quaternary ammonium halide anions and cations. Nat. Energy 2017, 2, 17102. [Google Scholar] [CrossRef]
- Bi, D.; Yi, C.; Luo, J.; Décoppet, J.-D.; Zhang, F.; Zakeeruddin, S.M.; Li, X.; Hagfeldt, A.; Grätzel, M. Polymer-templated nucleation and crystal growth of perovskite films for solar cells with efficiency greater than 21%. Nat. Energy 2016, 1, 16142. [Google Scholar] [CrossRef]
- Chiang, C.-H.; Wu, C.-G. A Method for the Preparation of Highly Oriented MAPbI3 Crystallites for High-Efficiency Perovskite Solar Cells to Achieve an 86% Fill Factor. ACS Nano 2018, 12, 10355. [Google Scholar] [CrossRef] [PubMed]
- He, J.; Chu, Y.; Sun, Y.; Zhang, R.; Li, J.; Zhao, L.; Zhao, H.; Liu, P.; Li, S. Beyond the Limit of Goldschmidt Tolerance Factor: Crystal Surface Engineering to Boost the α-Phase Stability of Formamidinium-Only Hybrid Inorganic–Organic Perovskites. Sol. RRL 2021, 5, 2100188. [Google Scholar] [CrossRef]
- Brinkmann, K.O.; He, J.; Schubert, F.; Malerczyk, J.; Kreusel, C.; van gen Hassend, F.; Weber, S.; Song, J.; Qu, J.; Riedl, T. Extremely Robust Gas-Quenching Deposition of Halide Perovskites on Top of Hydrophobic Hole Transport Materials for Inverted (p–i–n) Solar Cells by Targeting the Precursor Wetting Issue. ACS Appl. Mater. Inter. 2019, 11, 40172. [Google Scholar] [CrossRef]
- Yu, Y.; Zhang, F.; Hou, T.; Sun, X.; Yu, H.; Zhang, M. A Review on Gas-Quenching Technique for Efficient Perovskite Solar Cells. Sol. RRL 2021, 5, 2100386. [Google Scholar] [CrossRef]
- Hwang, K.; Jung, Y.-S.; Heo, Y.-J.; Scholes, F.H.; Watkins, S.E.; Subbiah, J.; Jones, D.J.; Kim, D.-Y.; Vak, D. Toward Large Scale Roll-to-Roll Production of Fully Printed Perovskite Solar Cells. Adv. Mater. 2015, 27, 1241. [Google Scholar] [CrossRef]
- Babayigit, A.; D’Haen, J.; Boyen, H.-G.; Conings, B. Gas Quenching for Perovskite Thin Film Deposition. Joule 2018, 2, 1205. [Google Scholar] [CrossRef] [Green Version]
- Jung, Y.-S.; Hwang, K.; Heo, Y.-J.; Kim, J.-E.; Lee, D.; Lee, C.-H.; Joh, H.-I.; Yeo, J.-S.; Kim, D.-Y. One-Step Printable Perovskite Films Fabricated under Ambient Conditions for Efficient and Reproducible Solar Cells. ACS Appl. Mater. Inter. 2017, 9, 27832. [Google Scholar] [CrossRef]
- Conings, B.; Babayigit, A.; Klug, M.T.; Bai, S.; Gauquelin, N.; Sakai, N.; Wang, J.T.-W.; Verbeeck, J.; Boyen, H.-G.; Snaith, H.J. A Universal Deposition Protocol for Planar Heterojunction Solar Cells with High Efficiency Based on Hybrid Lead Halide Perovskite Families. Adv. Mater. 2016, 28, 10701. [Google Scholar] [CrossRef]
- Ahn, N.; Son, D.-Y.; Jang, I.-H.; Kang, S.M.; Choi, M.; Park, N.-G. Highly Reproducible Perovskite Solar Cells with Average Efficiency of 18.3% and Best Efficiency of 19.7% Fabricated via Lewis Base Adduct of Lead(II) Iodide. J. Am. Chem. Soc. 2015, 137, 8696. [Google Scholar] [CrossRef] [PubMed]
- Xie, Z.; Xu, W.; Ran, G.; Li, Y.; Qin, G.G. Enhancing performance of flexible perovskite solar cell by secondary methimazole treating. Mater. Lett. 2021, 290, 129461. [Google Scholar] [CrossRef]
- Fei, C.; Li, B.; Zhang, R.; Fu, H.; Tian, J.; Cao, G. Highly Efficient and Stable Perovskite Solar Cells Based on Monolithically Grained CH3NH3PbI3 Film. Adv. Energy Mater. 2017, 7, 1602017. [Google Scholar] [CrossRef]
- Sun, M.; Zhang, F.; Liu, H.; Li, X.; Xiao, Y.; Wang, S. Tuning the crystal growth of perovskite thin-films by adding the 2-pyridylthiourea additive for highly efficient and stable solar cells prepared in ambient air. J. Mater. Chem. A 2017, 5, 13448. [Google Scholar] [CrossRef]
- Zhu, L.; Xu, Y.; Zhang, P.; Shi, J.; Zhao, Y.; Zhang, H.; Wu, J.; Luo, Y.; Li, D.; Meng, Q. Investigation on the role of Lewis bases in the ripening process of perovskite films for highly efficient perovskite solar cells. J. Mater. Chem. A 2017, 5, 20874. [Google Scholar] [CrossRef]
- Saliba, M.; Matsui, T.; Seo, J.-Y.; Domanski, K.; Correa-Baena, J.-P.; Nazeeruddin, M.K.; Zakeeruddin, S.M.; Tress, W.; Abate, A.; Hagfeldt, A.; et al. Cesium-containing triple cation perovskite solar cells: Improved stability, reproducibility and high efficiency. Energy Environ. Sci. 2016, 9, 1989. [Google Scholar] [CrossRef] [PubMed] [Green Version]
- Chen, W.; Zhou, Y.; Wang, L.; Wu, Y.; Tu, B.; Yu, B.; Liu, F.; Tam, H.-W.; Wang, G.; Djurišić, A.B.; et al. Molecule-Doped Nickel Oxide: Verified Charge Transfer and Planar Inverted Mixed Cation Perovskite Solar Cell. Adv. Mater. 2018, 30, 1800515. [Google Scholar] [CrossRef] [PubMed]
- Saliba, M.; Matsui, T.; Domanski, K.; Seo, J.-Y.; Ummadisingu, A.; Zakeeruddin, S.M.; Correa-Baena, J.-P.; Tress, W.R.; Abate, A.; Hagfeldt, A.; et al. Incorporation of rubidium cations into perovskite solar cells improves photovoltaic performance. Science 2016, 354, 206. [Google Scholar] [CrossRef]
- Liu, X.; Shi, L.; Huang, J.; Liu, Z.; Zhang, P.; Yun, J.S.; Soufiani, A.M.; Seidel, J.; Sun, K.; Hameiri, Z.; et al. Improvement of Cs-(FAPbI3)0.85(MAPbBr3)0.15 Quality Via DMSO-Molecule-Control to Increase the Efficiency and Boost the Long-Term Stability of 1 cm2 Sized Planar Perovskite Solar Cells. Sol. RRL 2018, 3, 1800338. [Google Scholar] [CrossRef]
- Zhang, F.; Bi, D.; Pellet, N.; Xiao, C.; Li, Z.; Berry, J.J.; Zakeeruddin, S.M.; Zhu, K.; Grätzel, M. Suppressing defects through the synergistic effect of a Lewis base and a Lewis acid for highly efficient and stable perovskite solar cells. Energy Environ. Sci. 2018, 11, 3480–3490. [Google Scholar] [CrossRef] [Green Version]
- Yu, Y.; Wang, C.; Grice, C.R.; Shrestha, N.; Zhao, D.; Liao, W.; Guan, L.; Awni, R.A.; Meng, W.; Cimaroli, A.J.; et al. Synergistic Effects of Lead Thiocyanate Additive and Solvent Annealing on the Performance of Wide-Bandgap Perovskite Solar Cells. ACS Energy Lett. 2017, 2, 1177. [Google Scholar] [CrossRef]
- Kim, M.; Kim, G.-H.; Oh, K.S.; Jo, Y.; Yoon, H.; Kim, K.-H.; Lee, H.; Kim, J.Y.; Kim, D.S. High-Temperature–Short-Time Annealing Process for High-Performance Large-Area Perovskite Solar Cells. ACS Nano 2017, 11, 6057. [Google Scholar] [CrossRef] [PubMed]
- Li, P.; Liang, C.; Bao, B.; Li, Y.; Hu, X.; Wang, Y.; Zhang, Y.; Li, F.; Shao, G.; Song, Y. Inkjet manipulated homogeneous large size perovskite grains for efficient and large-area perovskite solar cells. Nano Energy 2018, 46, 203. [Google Scholar] [CrossRef]
- He, J.; Xiang, Y.; Zhang, F.; Lian, J.; Hu, R.; Zeng, P.; Song, J.; Qu, J. Improvement of red light harvesting ability and open circuit voltage of Cu:NiOx based p-i-n planar perovskite solar cells boosted by cysteine enhanced interface contact. Nano Energy 2018, 45, 471. [Google Scholar] [CrossRef]
- Zhang, F.; Song, J.; Hu, R.; Xiang, Y.; He, J.; Hao, Y.; Lian, J.; Zhang, B.; Zeng, P.; Qu, J. Interfacial Passivation of the p-Doped Hole-Transporting Layer Using General Insulating Polymers for High-Performance Inverted Perovskite Solar Cells. Small 2018, 14, 1704007. [Google Scholar] [CrossRef] [PubMed]
- Yang, B.; Dyck, O.; Poplawsky, J.; Keum, J.; Puretzky, A.; Das, S.; Ivanov, I.; Rouleau, C.; Duscher, G.; Geohegan, D.; et al. Perovskite Solar Cells with Near 100% Internal Quantum Efficiency Based on Large Single Crystalline Grains and Vertical Bulk Heterojunctions. J. Am. Chem. Soc. 2015, 137, 9210. [Google Scholar] [CrossRef]
- You, J.; Yang, Y.; Hong, Z.; Song, T.-B.; Meng, L.; Liu, Y.; Jiang, C.; Zhou, H.; Chang, W.-H.; Li, G.; et al. Moisture assisted perovskite film growth for high performance solar cells. Appl. Phys. Lett. 2014, 105, 183902. [Google Scholar] [CrossRef] [Green Version]
- Chen, G.; Zheng, J.; Zheng, L.; Yan, X.; Lin, H.; Zhang, F. Crack-free CH3NH3PbI3 layer via continuous dripping method for high-performance mesoporous perovskite solar cells. Appl. Surf. Sci. 2017, 392, 960. [Google Scholar] [CrossRef]
- Jo, Y.; Oh, K.S.; Kim, M.; Kim, K.-H.; Lee, H.; Lee, C.-W.; Kim, D.S. High Performance of Planar Perovskite Solar Cells Produced from PbI2(DMSO) and PbI2(NMP) Complexes by Intramolecular Exchange. Adv. Mater. Interfaces 2016, 3, 1500768. [Google Scholar] [CrossRef]
- Jeon, N.J.; Noh, J.H.; Kim, Y.C.; Yang, W.S.; Ryu, S.; Seok, S.I. Solvent engineering for high-performance inorganic–organic hybrid perovskite solar cells. Nat. Mater. 2014, 13, 897. [Google Scholar] [CrossRef]
- Lee, J.-W.; Dai, Z.; Lee, C.; Lee, H.M.; Han, T.-H.; De Marco, N.; Lin, O.; Choi, C.S.; Dunn, B.; Koh, J.; et al. Tuning Molecular Interactions for Highly Reproducible and Efficient Formamidinium Perovskite Solar Cells via Adduct Approach. J. Am. Chem. Soc. 2018, 140, 6317. [Google Scholar] [CrossRef] [PubMed]
- Dualeh, A.; Tétreault, N.; Moehl, T.; Gao, P.; Nazeeruddin, M.K.; Grätzel, M. Effect of Annealing Temperature on Film Morphology of Organic–Inorganic Hybrid Pervoskite Solid-State Solar Cells. Adv. Funct. Mater. 2014, 24, 3250. [Google Scholar] [CrossRef]
- Yang, Y.; Feng, S.; Li, M.; Xu, W.; Yin, G.; Wang, Z.; Sun, B.; Gao, X. Annealing Induced Re-crystallization in CH3NH3PbI3−xClx for High Performance Perovskite Solar Cells. Sci. Rep. 2017, 7, 46724. [Google Scholar] [CrossRef] [PubMed] [Green Version]
- Yang, H.; Zhang, J.; Zhang, C.; Chang, J.; Lin, Z.; Chen, D.; Xi, H.; Hao, Y. Effects of Annealing Conditions on Mixed Lead Halide Perovskite Solar Cells and Their Thermal Stability Investigation. Materials 2017, 10, 837. [Google Scholar] [CrossRef] [PubMed] [Green Version]
- Dualeh, A.; Gao, P.; Seok, S.I.; Nazeeruddin, M.K.; Grätzel, M. Thermal Behavior of Methylammonium Lead-Trihalide Perovskite Photovoltaic Light Harvesters. Chem. Mater. 2014, 26, 6160. [Google Scholar] [CrossRef]
- Williams, A.E.; Holliman, P.J.; Carnie, M.J.; Davies, M.L.; Worsley, D.A.; Watson, T.M. Perovskite processing for photovoltaics: A spectro-thermal evaluation. J. Mater. Chem. A 2014, 2, 19338. [Google Scholar] [CrossRef]
- Padchasri, J.; Yimnirun, R. Effects of annealing temperature on stability of methylammonium lead iodide perovskite powders. J. Alloy. Compd. 2017, 720, 63. [Google Scholar] [CrossRef]
- Shi, L.X.; Wang, Z.S.; Huang, Z.; Sha, W.E.I.; Wang, H.; Zhou, Z. The effects of interfacial recombination and injection barrier on the electrical characteristics of perovskite solar cells. AIP Advances 2018, 8, 025312. [Google Scholar] [CrossRef] [Green Version]
- Cao, J.; Jing, X.; Yan, J.; Hu, C.; Chen, R.; Yin, J.; Li, J.; Zheng, N. Identifying the Molecular Structures of Intermediates for Optimizing the Fabrication of High-Quality Perovskite Films. J. Am. Chem. Soc. 2016, 138, 9919. [Google Scholar] [CrossRef]
- Guo, Y.; Shoyama, K.; Sato, W.; Matsuo, Y.; Inoue, K.; Harano, K.; Liu, C.; Tanaka, H.; Nakamura, E. Chemical Pathways Connecting Lead(II) Iodide and Perovskite via Polymeric Plumbate(II) Fiber. J. Am. Chem. Soc. 2015, 137, 15907. [Google Scholar] [CrossRef]
- Long, M.; Zhang, T.; Liu, M.; Chen, Z.; Wang, C.; Xie, W.; Xie, F.; Chen, J.; Li, G.; Xu, J. Abnormal Synergetic Effect of Organic and Halide Ions on the Stability and Optoelectronic Properties of a Mixed Perovskite via In Situ Characterizations. Adv. Mater. 2018, 30, 1801562. [Google Scholar] [CrossRef] [PubMed]
- Fielding, L. Determination of Association Constants (Ka) from Solution NMR Data. Tetrahedron 2000, 56, 6151. [Google Scholar] [CrossRef]
- Wagner, G.; Pardi, A.; Wuethrich, K. Hydrogen bond length and proton NMR chemical shifts in proteins. J. Am. Chem. Soc. 1983, 105, 5948. [Google Scholar] [CrossRef]
- Wong, K.F.; Ng, S. On the use of the modified Benesi—Hildebrand equation to process NMR hydrogen bonding data. Spectrochim. Acta Pt. A Mol. Spectrosc. 1976, 32, 455. [Google Scholar] [CrossRef]


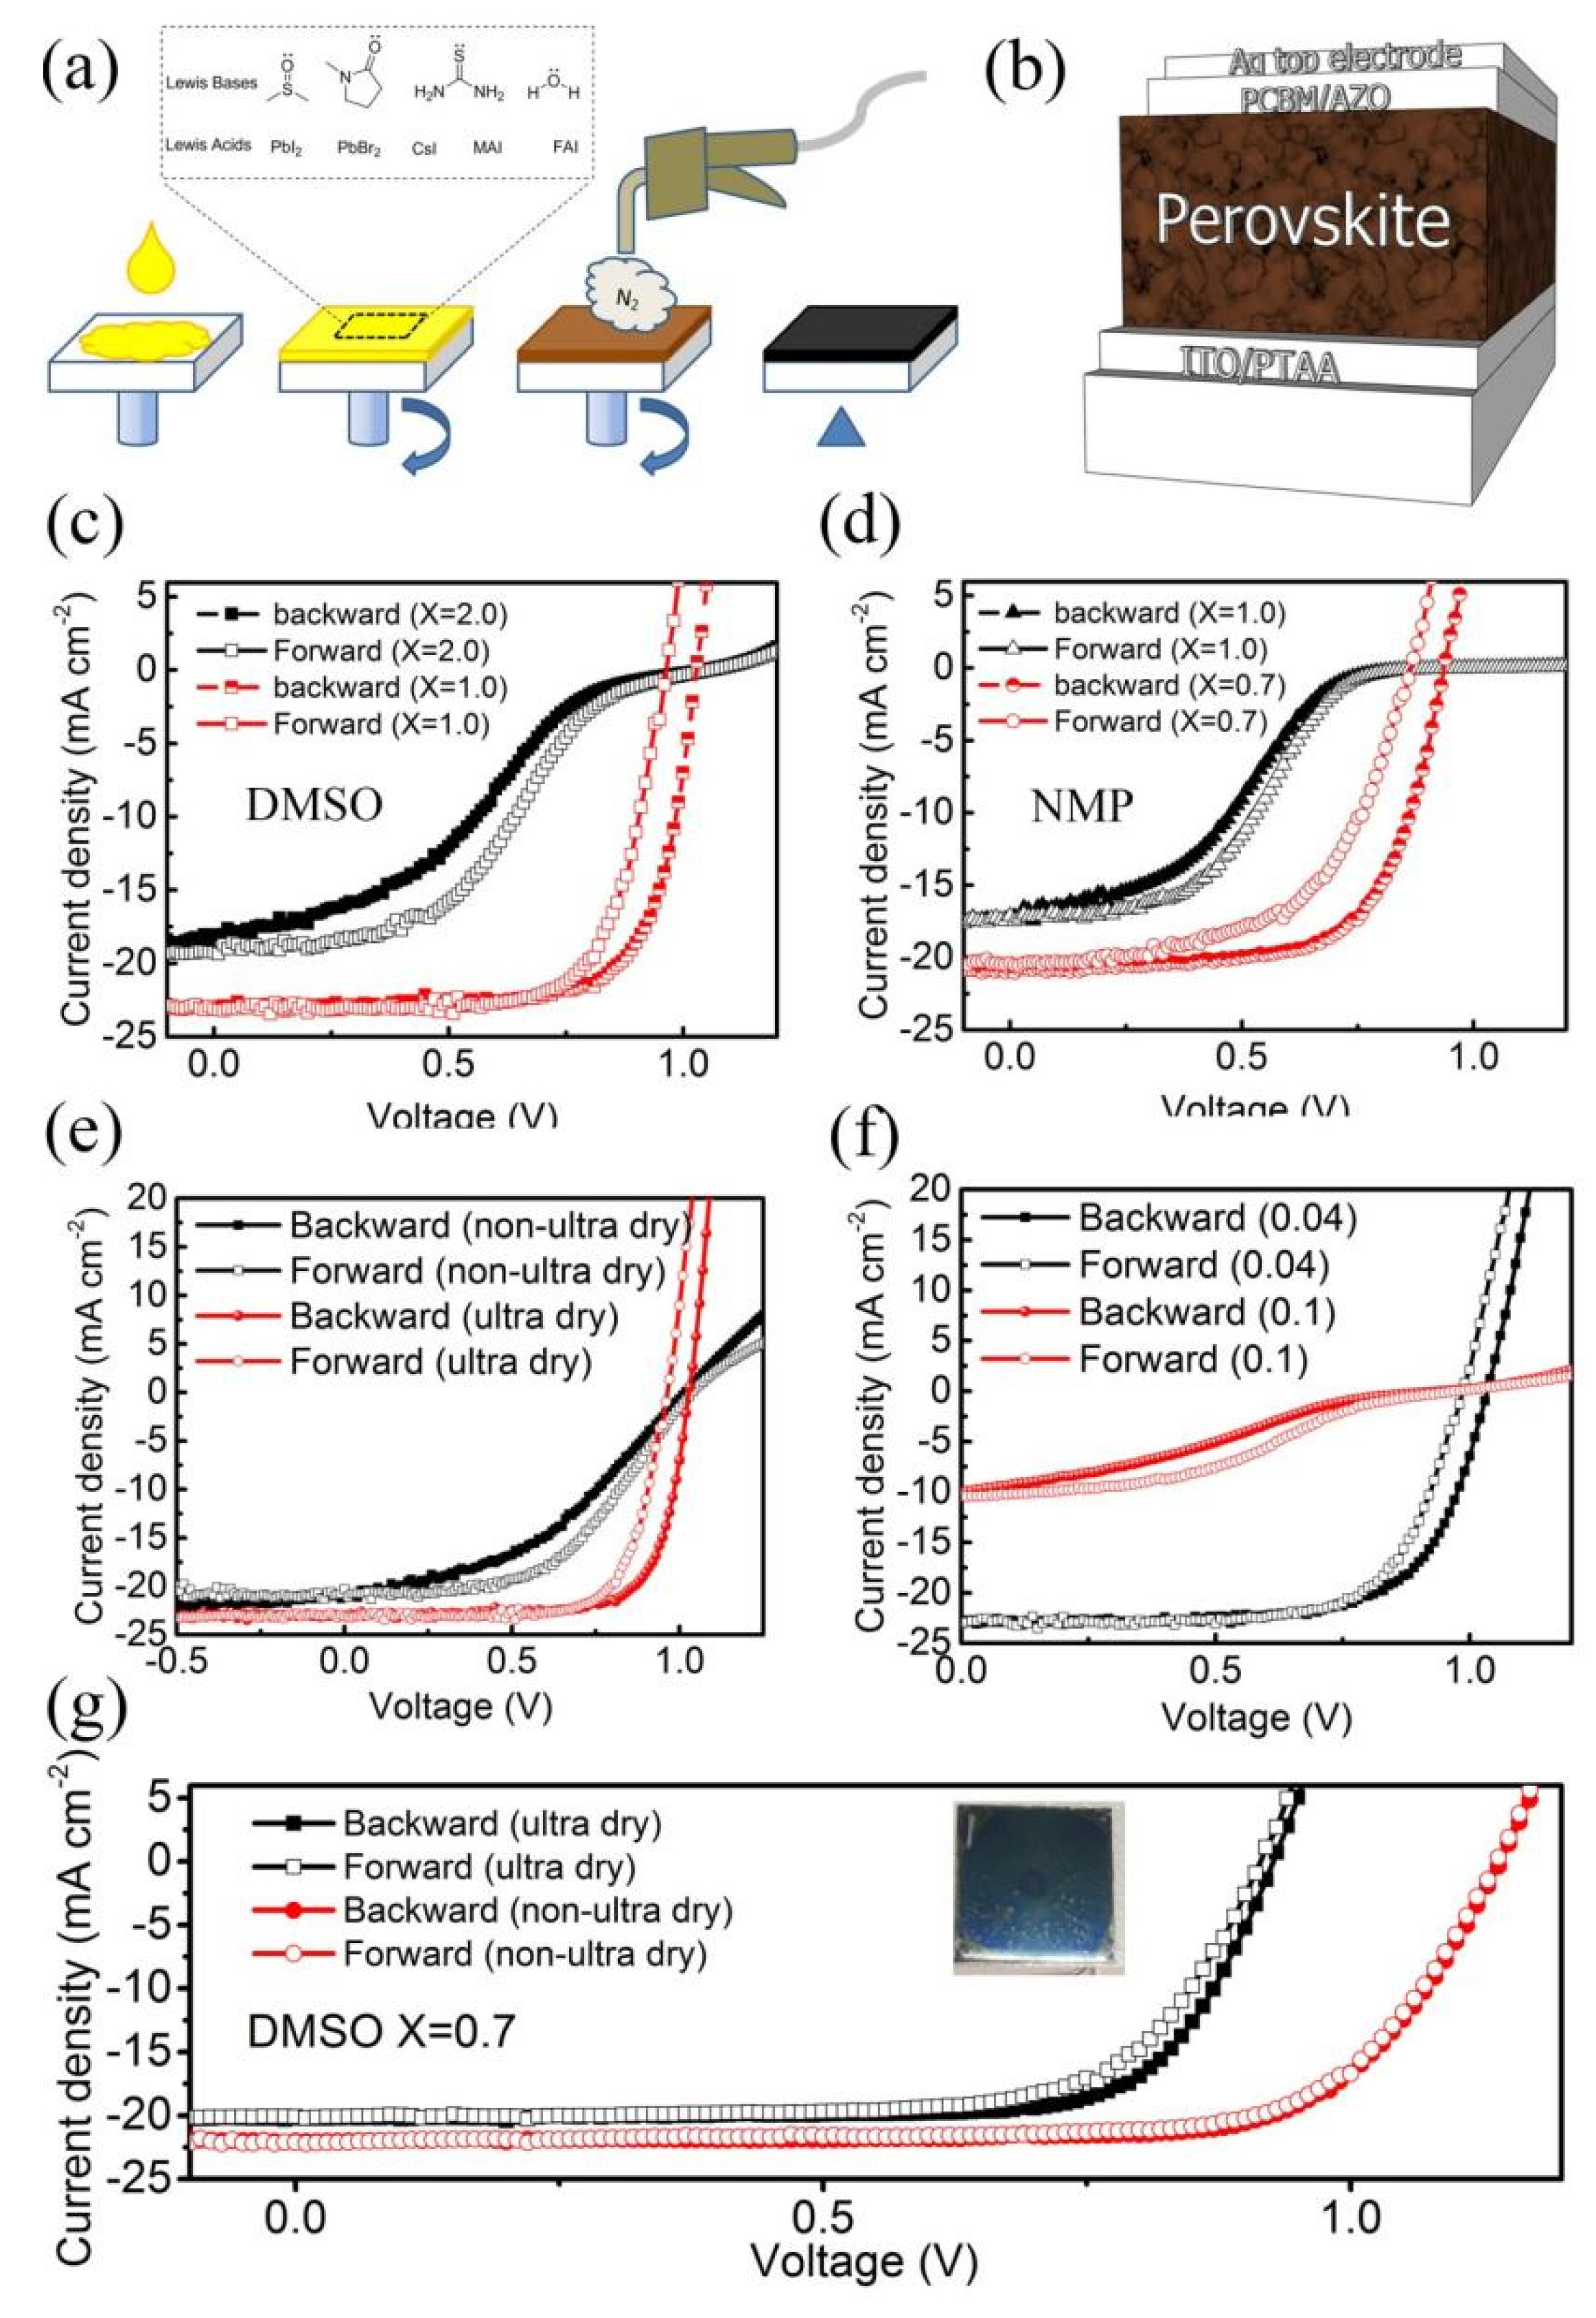
| Samples | Scan Direction | Voc (V) | Jsc (mA cm−2) | FF (%) | PCE (%) | S-shaped J–V Curve * | Note * | |
|---|---|---|---|---|---|---|---|---|
| DMSO | X = 2 | Forward | 1.06 | 19.2 | 39.1 | 8.0 | Yes | |
| Backward | 1.04 | 18.1 | 32.9 | 6.2 | ||||
| X = 1 | Forward | 0.93 | 20.3 | 40.1 | 7.9 | Yes | Non-ultra-dry lead halide source. | |
| Backward | 1.02 | 21.1 | 47.2 | 9.8 | ||||
| Forward | 1.00 | 22.6 | 62.2 | 14.0 | No | |||
| Backward | 1.06 | 22.6 | 72.0 | 17.2 | ||||
| Forward | 0.97 | 22.9 | 73.2 | 16.3 | No | 0.04 mole equivalent thiourea. | ||
| Backward | 1.03 | 23.1 | 73.6 | 17.5 | ||||
| Forward | 0.99 | 13.8 | 30.6 | 4.2 | Yes | 0.1 mole equivalent thiourea. | ||
| Backward | 1.00 | 14.5 | 41.6 | 6.1 | ||||
| X = 0.7 | Forward | 0.92 | 20.2 | 73.2 | 13.6 | No | ||
| Backward | 0.92 | 20.2 | 76.7 | 14.3 | ||||
| Forward | 0.89 | 16.3 | 72.2 | 10.5 | No | 0.1 mole equivalent thiourea. | ||
| Backward | 0.90 | 16.3 | 75.0 | 11.0 | ||||
| Forward | 1.14 | 22.0 | 73.1 | 18.4 | No | Non-ultra-dry lead halide source. No thiourea was used | ||
| Backward | 1.14 | 22.2 | 74.3 | 18.6 | ||||
| Forward | 1.05 | 21.4 | 65.0 | 14.5 | No | Non-ultra-dry lead halide source. 0.06 mole equivalent thiourea. | ||
| Backward | 1.05 | 21.5 | 66.6 | 15.0 | No | |||
| NMP | X = 2.0 | Forward | 0.86 | 13.4 | 55.2 | 6.4 | No | Cs0.5MA0.95PbI3 |
| Backward | 0.86 | 14.9 | 53.9 | 6.9 | ||||
| X = 1.0 | Forward | 1.01 | 17.1 | 35.7 | 6.2 | Yes | ||
| Backward | 0.98 | 17.2 | 30.7 | 5.2 | ||||
| X = 0.7 | Forward | 1.07 | 21.7 | 55.9 | 13.1 | No | ||
| Backward | 1.08 | 20.4 | 64.0 | 14.0 | ||||
| LBMs | FAI | MAI | ||||
|---|---|---|---|---|---|---|
| Chemical Shift of Ha (ppm) | Movement of △δ (ppm) | |△δ| (ppm) | Chemical Shift of Ha (ppm) | Movement of △δ (ppm) | |△δ| (ppm) | |
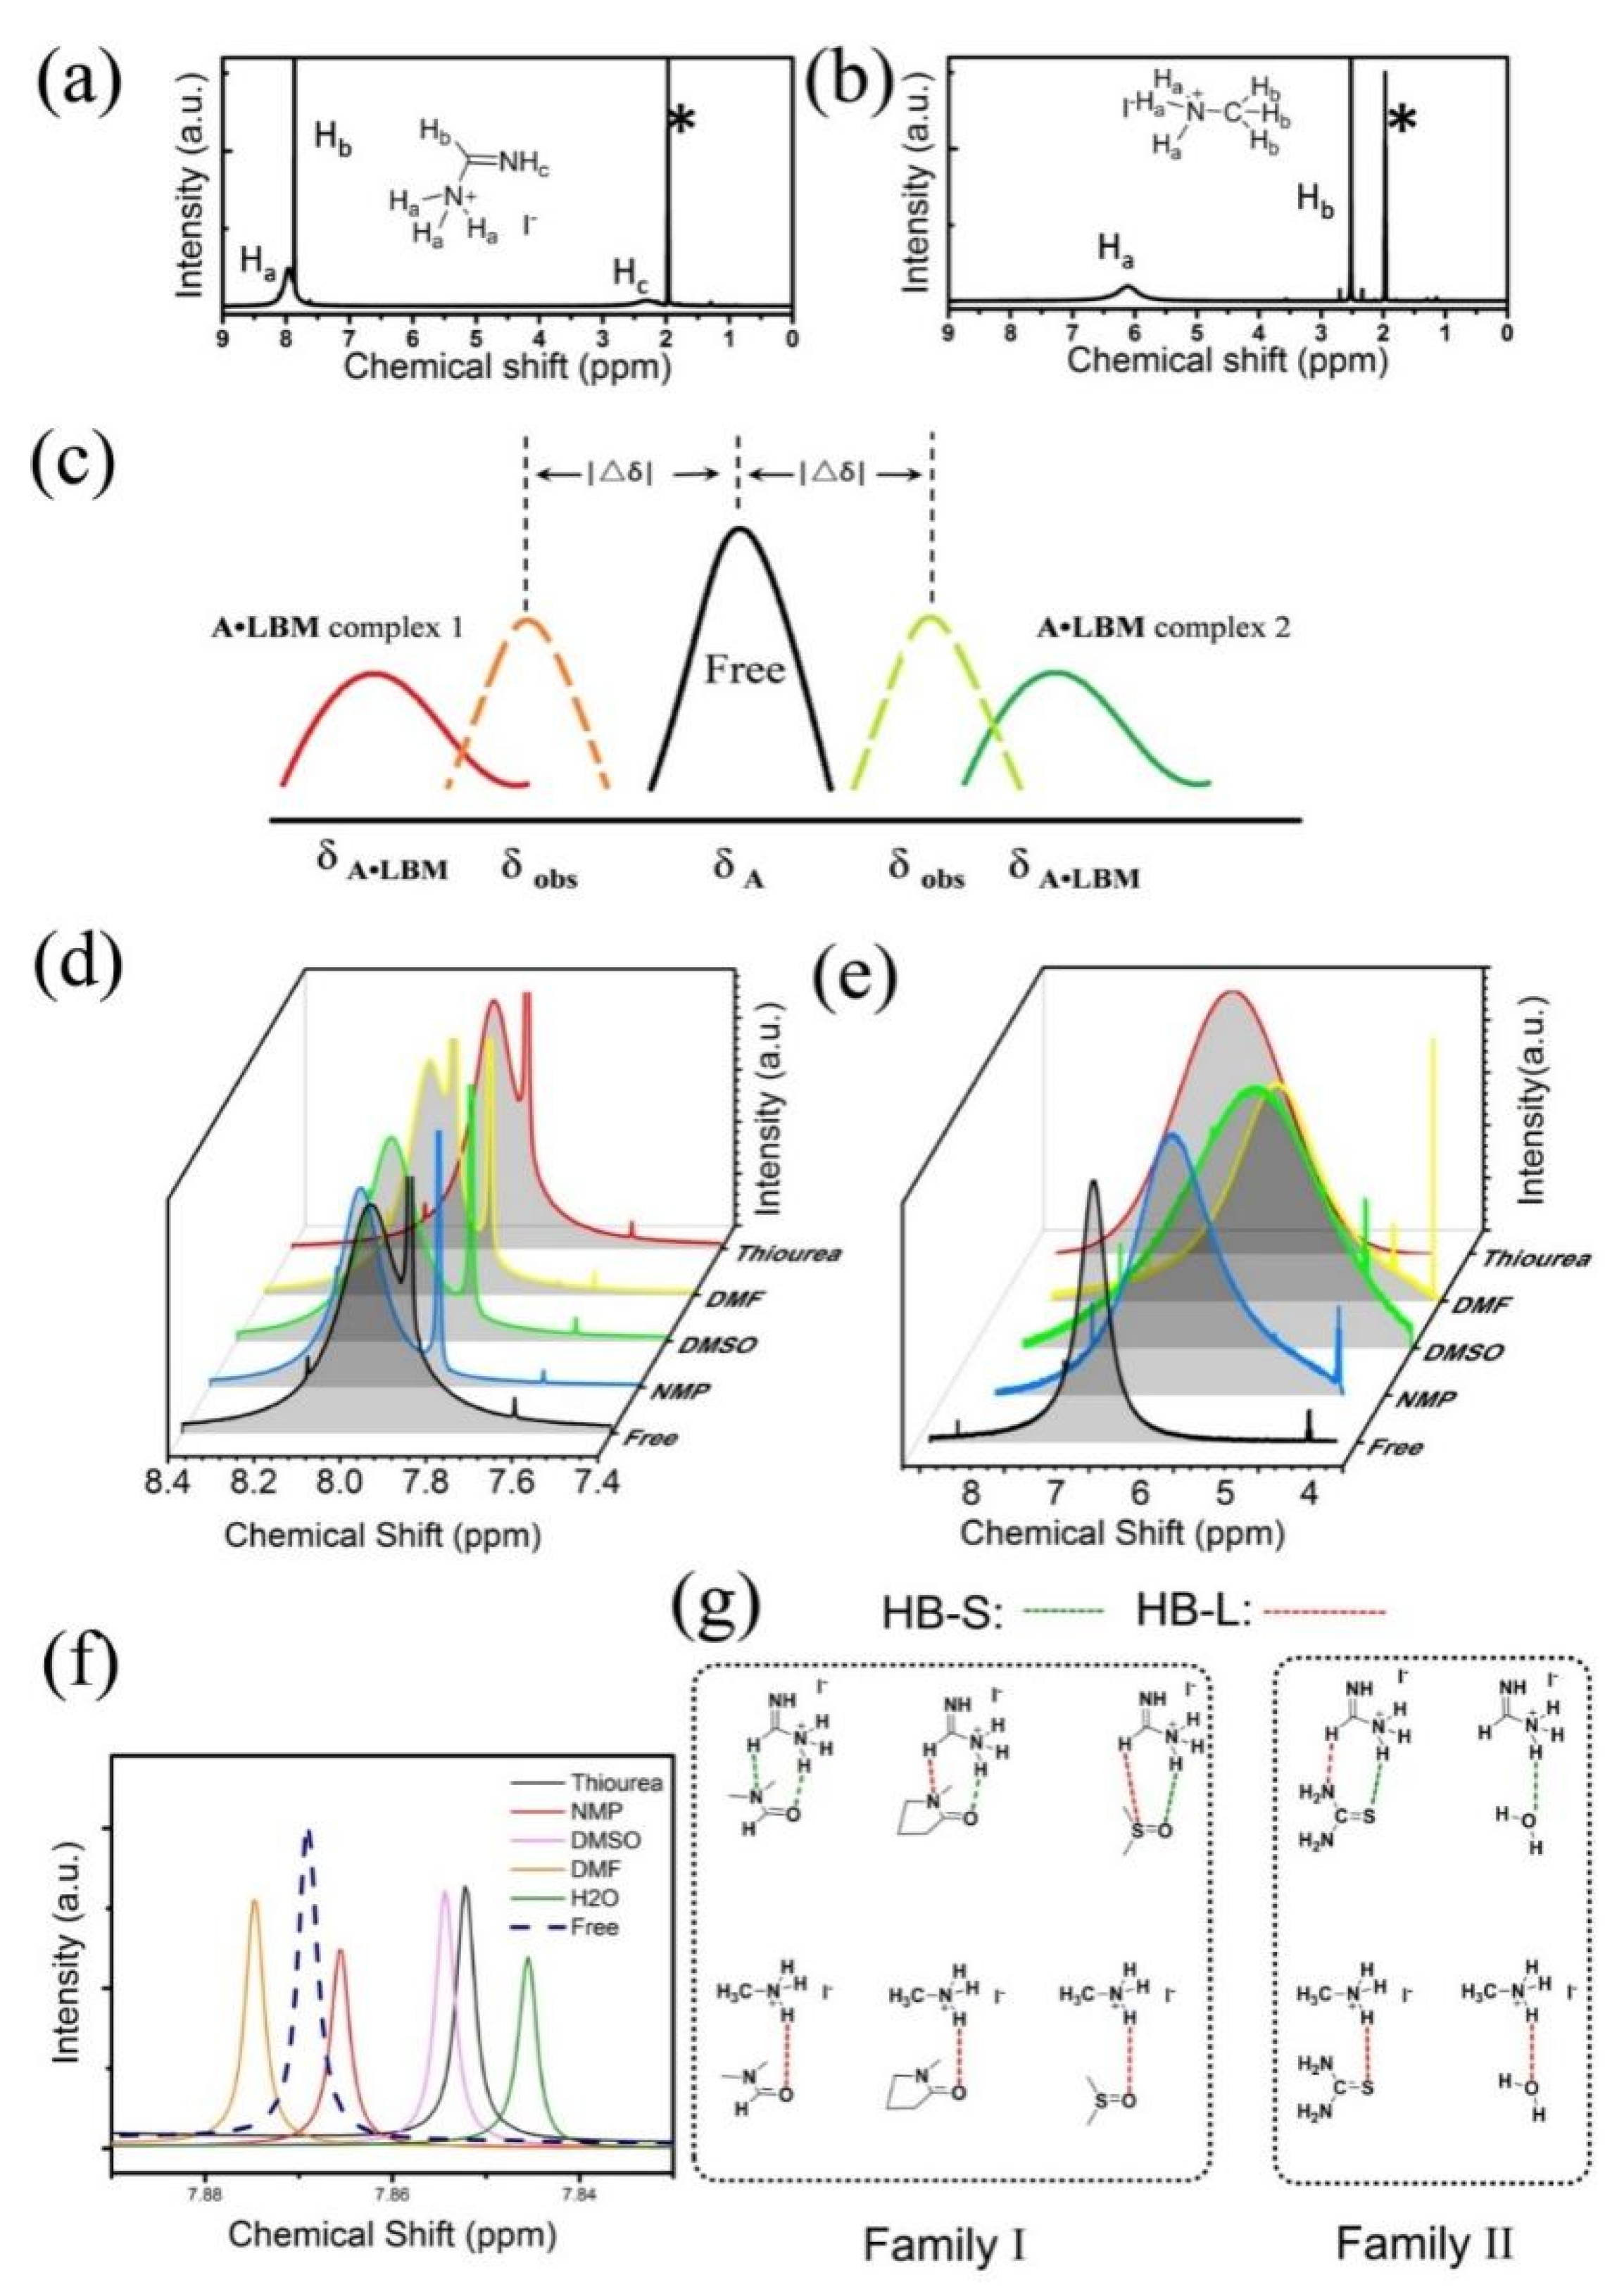
| Free | 7.96 | - | - | 6.11 | - | - |
| Thiourea | 7.93 | −0.03 | 0.03 | 5.8 | −0.31 | 0.31 |
| DMF | 8.01 | 0.05 | 0.05 | 4.96 | −1.15 | 1.15 |
| DMSO | 8.04 | 0.08 | 0.08 | 4.89 | −1.22 | 1.22 |
| NMP | 8.05 | 0.09 | 0.09 | 5.48 | −0.63 | 0.63 |
Publisher’s Note: MDPI stays neutral with regard to jurisdictional claims in published maps and institutional affiliations. |
© 2022 by the authors. Licensee MDPI, Basel, Switzerland. This article is an open access article distributed under the terms and conditions of the Creative Commons Attribution (CC BY) license (https://creativecommons.org/licenses/by/4.0/).
Share and Cite
Zhang, L.; Yao, L.; Chu, Y.; Zhao, L.; Zhao, H.; Sun, Y.; Li, J.; He, J. Hydrogen Bonds in Precursor Solution: The Origin of the Anomalous J–V Curves in Perovskite Solar Cells. Crystals 2022, 12, 610. https://doi.org/10.3390/cryst12050610
Zhang L, Yao L, Chu Y, Zhao L, Zhao H, Sun Y, Li J, He J. Hydrogen Bonds in Precursor Solution: The Origin of the Anomalous J–V Curves in Perovskite Solar Cells. Crystals. 2022; 12(5):610. https://doi.org/10.3390/cryst12050610
Chicago/Turabian StyleZhang, Lin, Lin Yao, Yanfang Chu, Lei Zhao, Hongmei Zhao, Yuchen Sun, Jing Li, and Junjie He. 2022. "Hydrogen Bonds in Precursor Solution: The Origin of the Anomalous J–V Curves in Perovskite Solar Cells" Crystals 12, no. 5: 610. https://doi.org/10.3390/cryst12050610