1. Introduction
Polymorphism in crystallography was first defined by Eilhardt Mitscherlich in the 19th century and refers to the property of some chemical compositions to exist in multiple crystalline forms [
1]. These different crystal structures are often a result of different molecular shapes caused by different torsion angles. Indeed, free rotation about single bonds within a molecule allows for several arrangements with potential energy minima and are therefore considered stable conformations. Consequently, the distinct molecular shapes result in different packing configurations. This particular form of polymorphism is termed conformational polymorphism [
2]. However, different conformations exhibit different properties, such as stability, dissolvability, physiological activity, and/or bioavailability. This explains the importance of studies on crystal polymorphism in the pharmaceutical field. In drug development, the main objective is to achieve specific properties, and contamination with an undesired polymorph would be detrimental [
3,
4,
5,
6].
A model compound for studying polymorphism is 5-methyl-2-[(2-nitrophenyl)amino]-3-thiophenecarbonitrile or ROY because of its ability to form at least 11 polymorphs, of which 6 are stable at room temperature. The latter are yellow prisms (Ys), orange needles (ONs), orange plates (OPs), red prisms (Rs), yellow needles (YNs), and orange-red plates (ORPs) and are formed by increasing the antisolvent-to-solvent ratio, which are water and acetone, respectively. The less stable and consequently less characterized forms are red plates (RPL), Y04, R05, YT04, and PO13. Red plates crystallize from vapor on succinic acid, Y04 and R05 can be obtained from a melt crystallization, and YT04 is a transformed form of Y04. PO13 is a supercooled melt form of YNs [
7]. This abundance of polymorphs can be explained by the presence of three torsion angles and their different conformations. Moreover, the polymorphs are easily detected according to their color and shape, an aspect represented in the acronym Red Orange Yellow (ROY) [
5,
6,
7,
8].
Creating a controlled mixing regime that allows the selection of one particular polymorph with its specific properties is relevant for multiple industrial disciplines [
3,
9]. However, the crystallization of polymorphic compounds is a complex process and depends on many parameters, such as temperature, the solvent-to-antisolvent ratio, antisolvent properties, concentration, etc. As a first step toward a controlled and constant mixing environment, this work reports on the implementation of a microfluidic chip to achieve different controlled mixing regimes [
10].
2. Materials and Methods
2.1. Chemicals
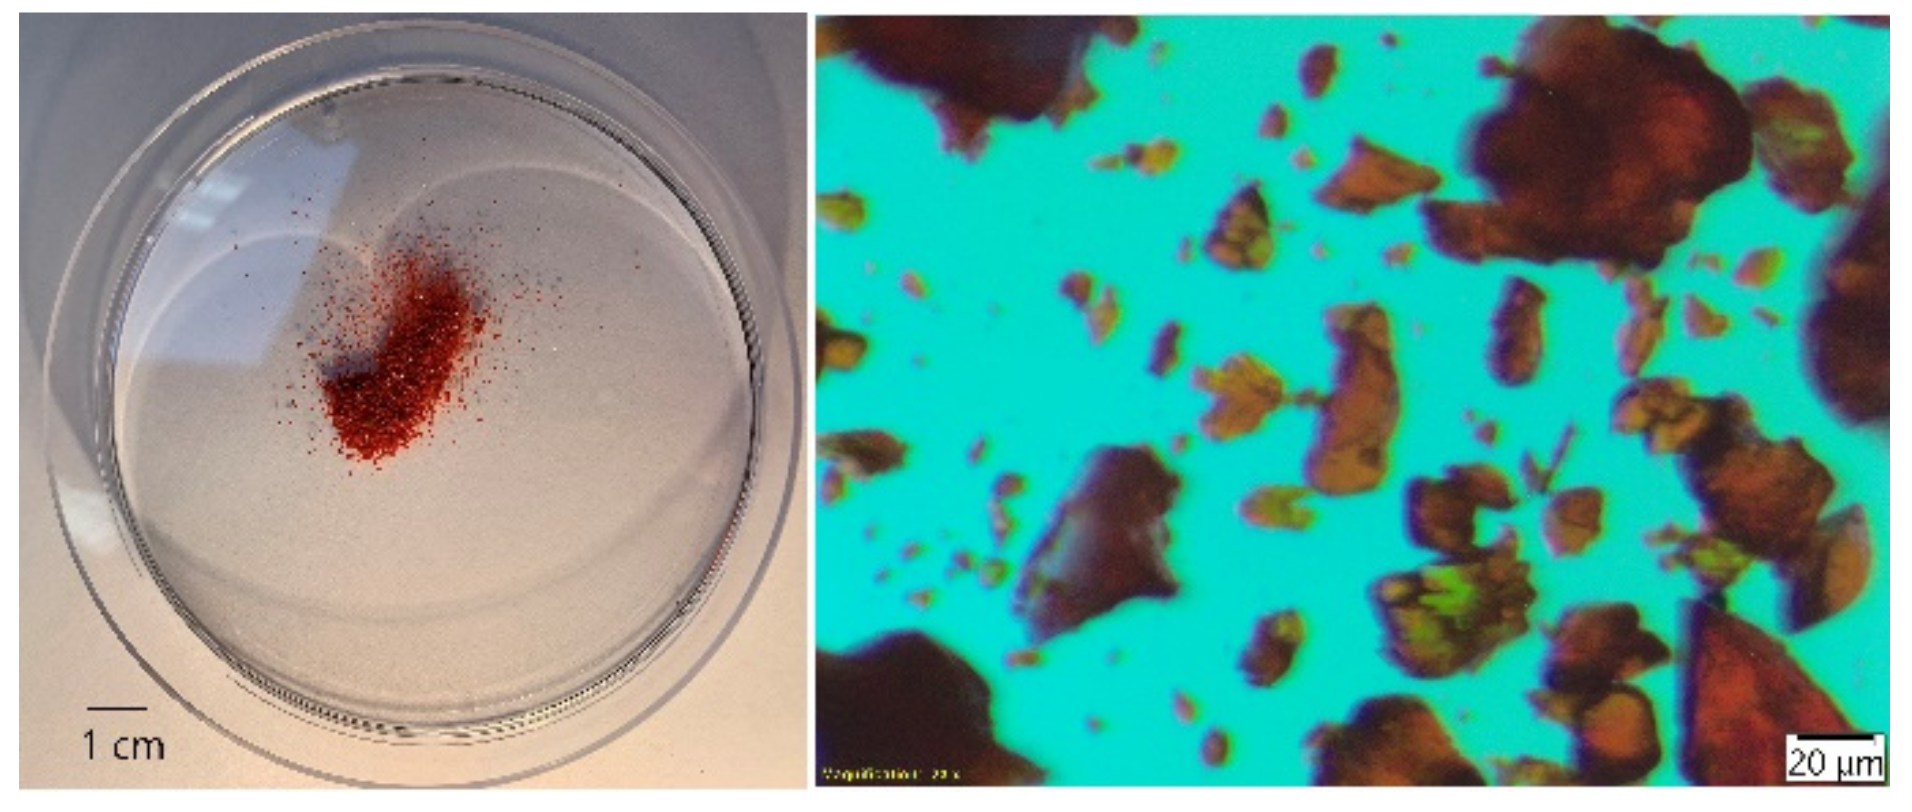
5-methyl-2-[(2-nitrophenyl)amino]-3-thiophenecarbonitrile (ROY) was purchased from TRC Canada
® (Toronto, Canada) and consisted of a mixture of polymorphs with sizes ranging from about 1 to 200 µm (
Figure 1). For stock solutions, synthesis-grade acetone from Acros Organics
® (Geel, Belgium) with a purity of 99.9% and milliQ water were used. Stock solutions (starting solutions with ROY and antisolvent solutions without ROY) were prepared with a Sartorius CPA224S scale (Goettingen, Germany) with an accuracy of 0.1 mg. In the following, the concentrations of the samples are mentioned according to “acetone (Vol%)/Water (Vol%)/ROY (mg/mL)”. The volumes of all prepared stock solutions were selected to be sufficiently large (>20 mL) so that the concentrations of all samples were reported with an accuracy of volume fractions below 0.01 Vol% and accuracy of ROY concentrations below 0.1 mg/mL.
2.2. Crystallization in Bulk Experiments
Antisolvent solution was added to and mixed with starting solution up to a total volume of 1.0 mL in 1.5 mL transparent vials at room temperature (RT). The respective volumes of the infused solutions were adjusted with KD Scientific
® model 100 syringe pumps (Holliston, MA, USA) using Hamilton
® Gastight
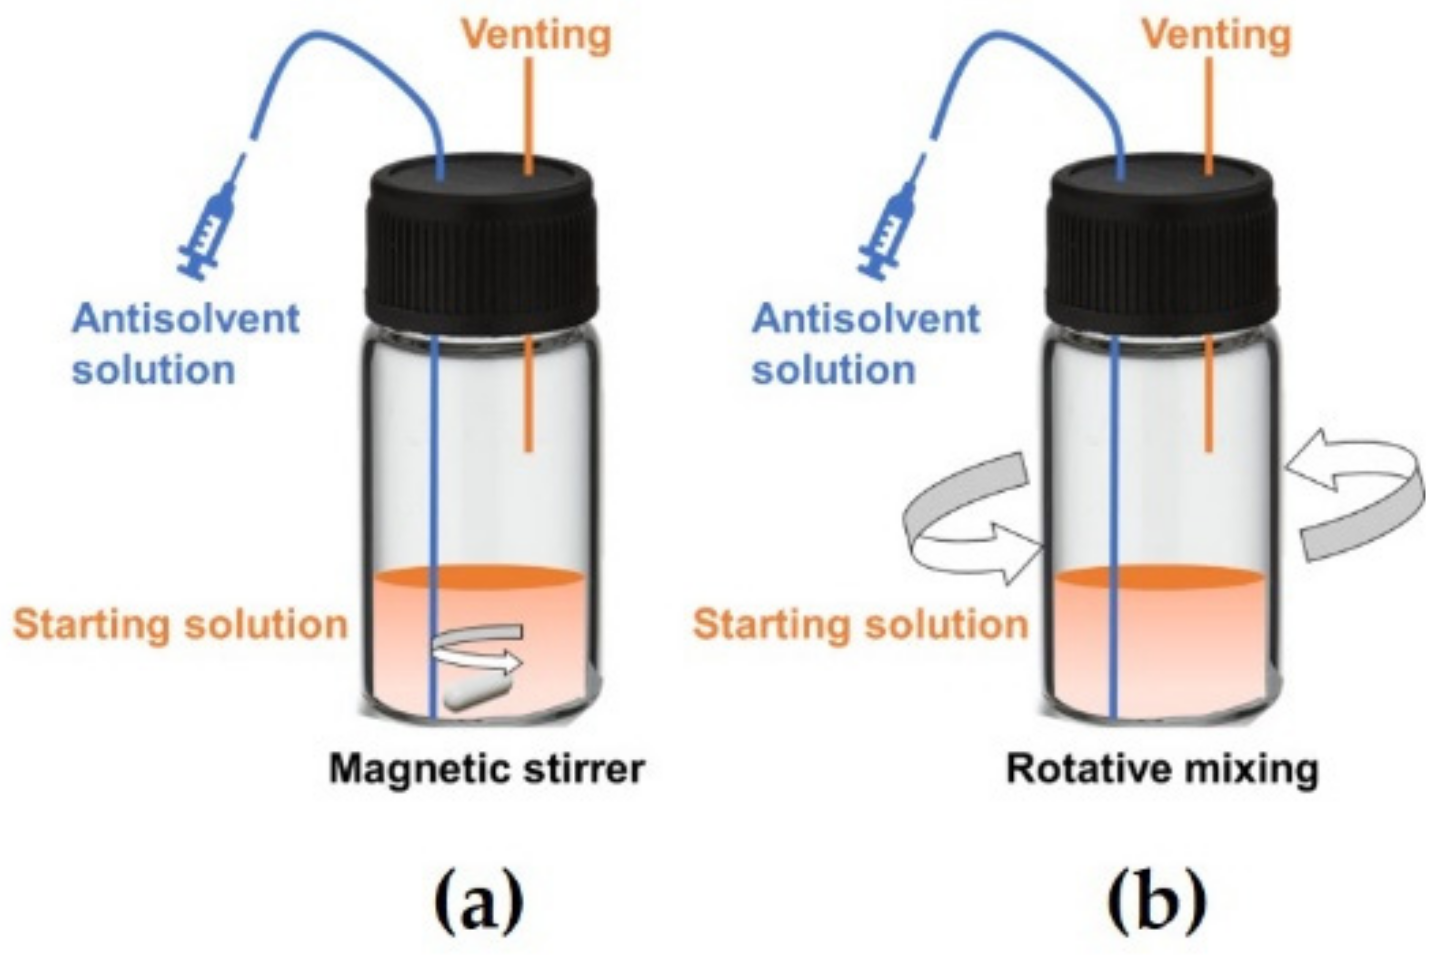
® Luer Lock syringes (Allston, MA, USA). Connections between the syringes and the vials were realized with Idex connectors and 450 µm inner diameter (i.d.) and 670 µm outer diameter (o.d.) glass capillaries. The flow rate was set for each sample such that the total infusion time per sample was 10 min. During infusion, mixing was performed by rotating an 8 mm magnet at 100 RPM unless otherwise mentioned, or by shaking the vial with an Eppendorf thermomixer comfort at 500 RPM unless otherwise mentioned. Evaporation of the sample was prevented by sealing the glass vials (
Figure 2). Each result documented in the following is based on at least three experimental runs unless otherwise mentioned.
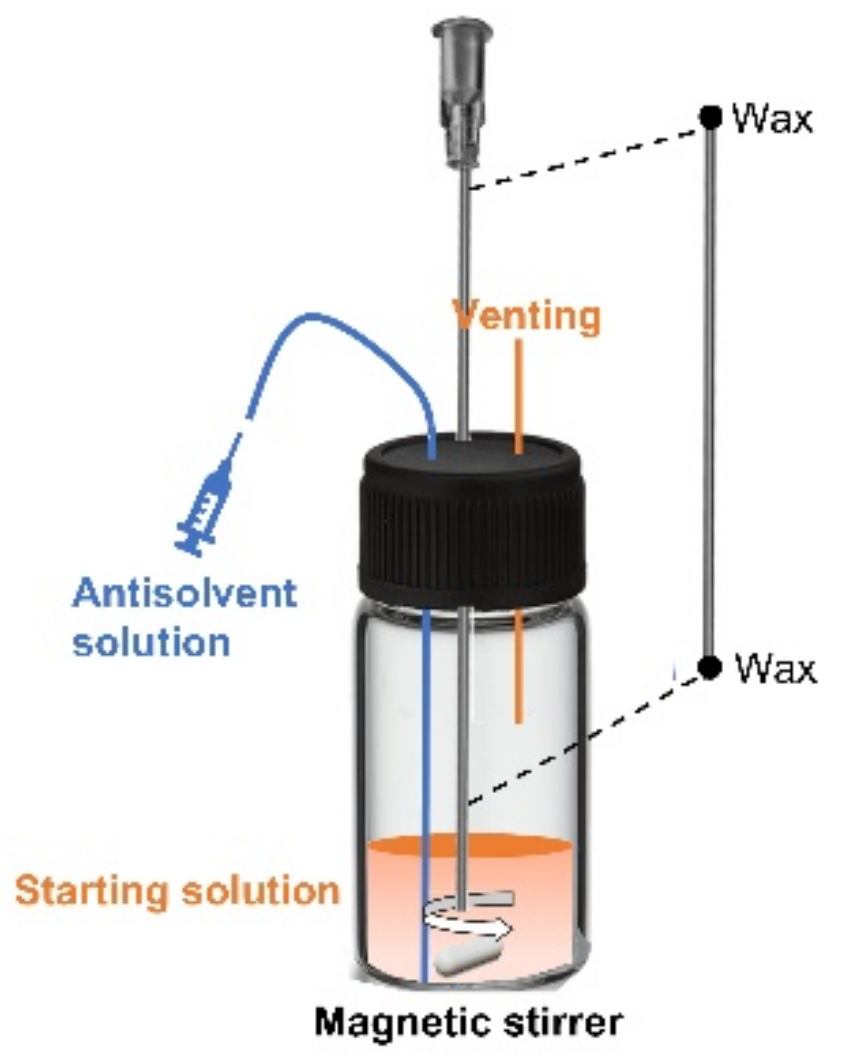
2.3. Crystzallization in Confinement
To evaluate the possible influence of volume on the crystallization process of ROY, mixing was first performed as mentioned in the previous
Section 2.2. Immediately after mixing and before crystallization occurred, the final solution was administered to capillaries with an i.d. of 100 µm, 200 µm, or 400 µm (Borosilicate glass round tubes from CM Scientific
® (Silsden, UK)). The capillaries were then sealed with melted wax (
Figure 3).
2.4. Polymorph Identification
Samples were analyzed with an Olympus® SZX16 microscope (Tokyo, Japan). The combination of the magnification of the microscope and the objective of the Olympus® SC100 color camera (Tokyo, Japan) resulted in a magnification of 23×. Different ROY polymorphs are so distinct in structure and color that optical identification was an easy and suitable method for this study. Moreover, experiments were repeated at least three times to fully characterize the observed sample.
2.5. Microfluidic Setup
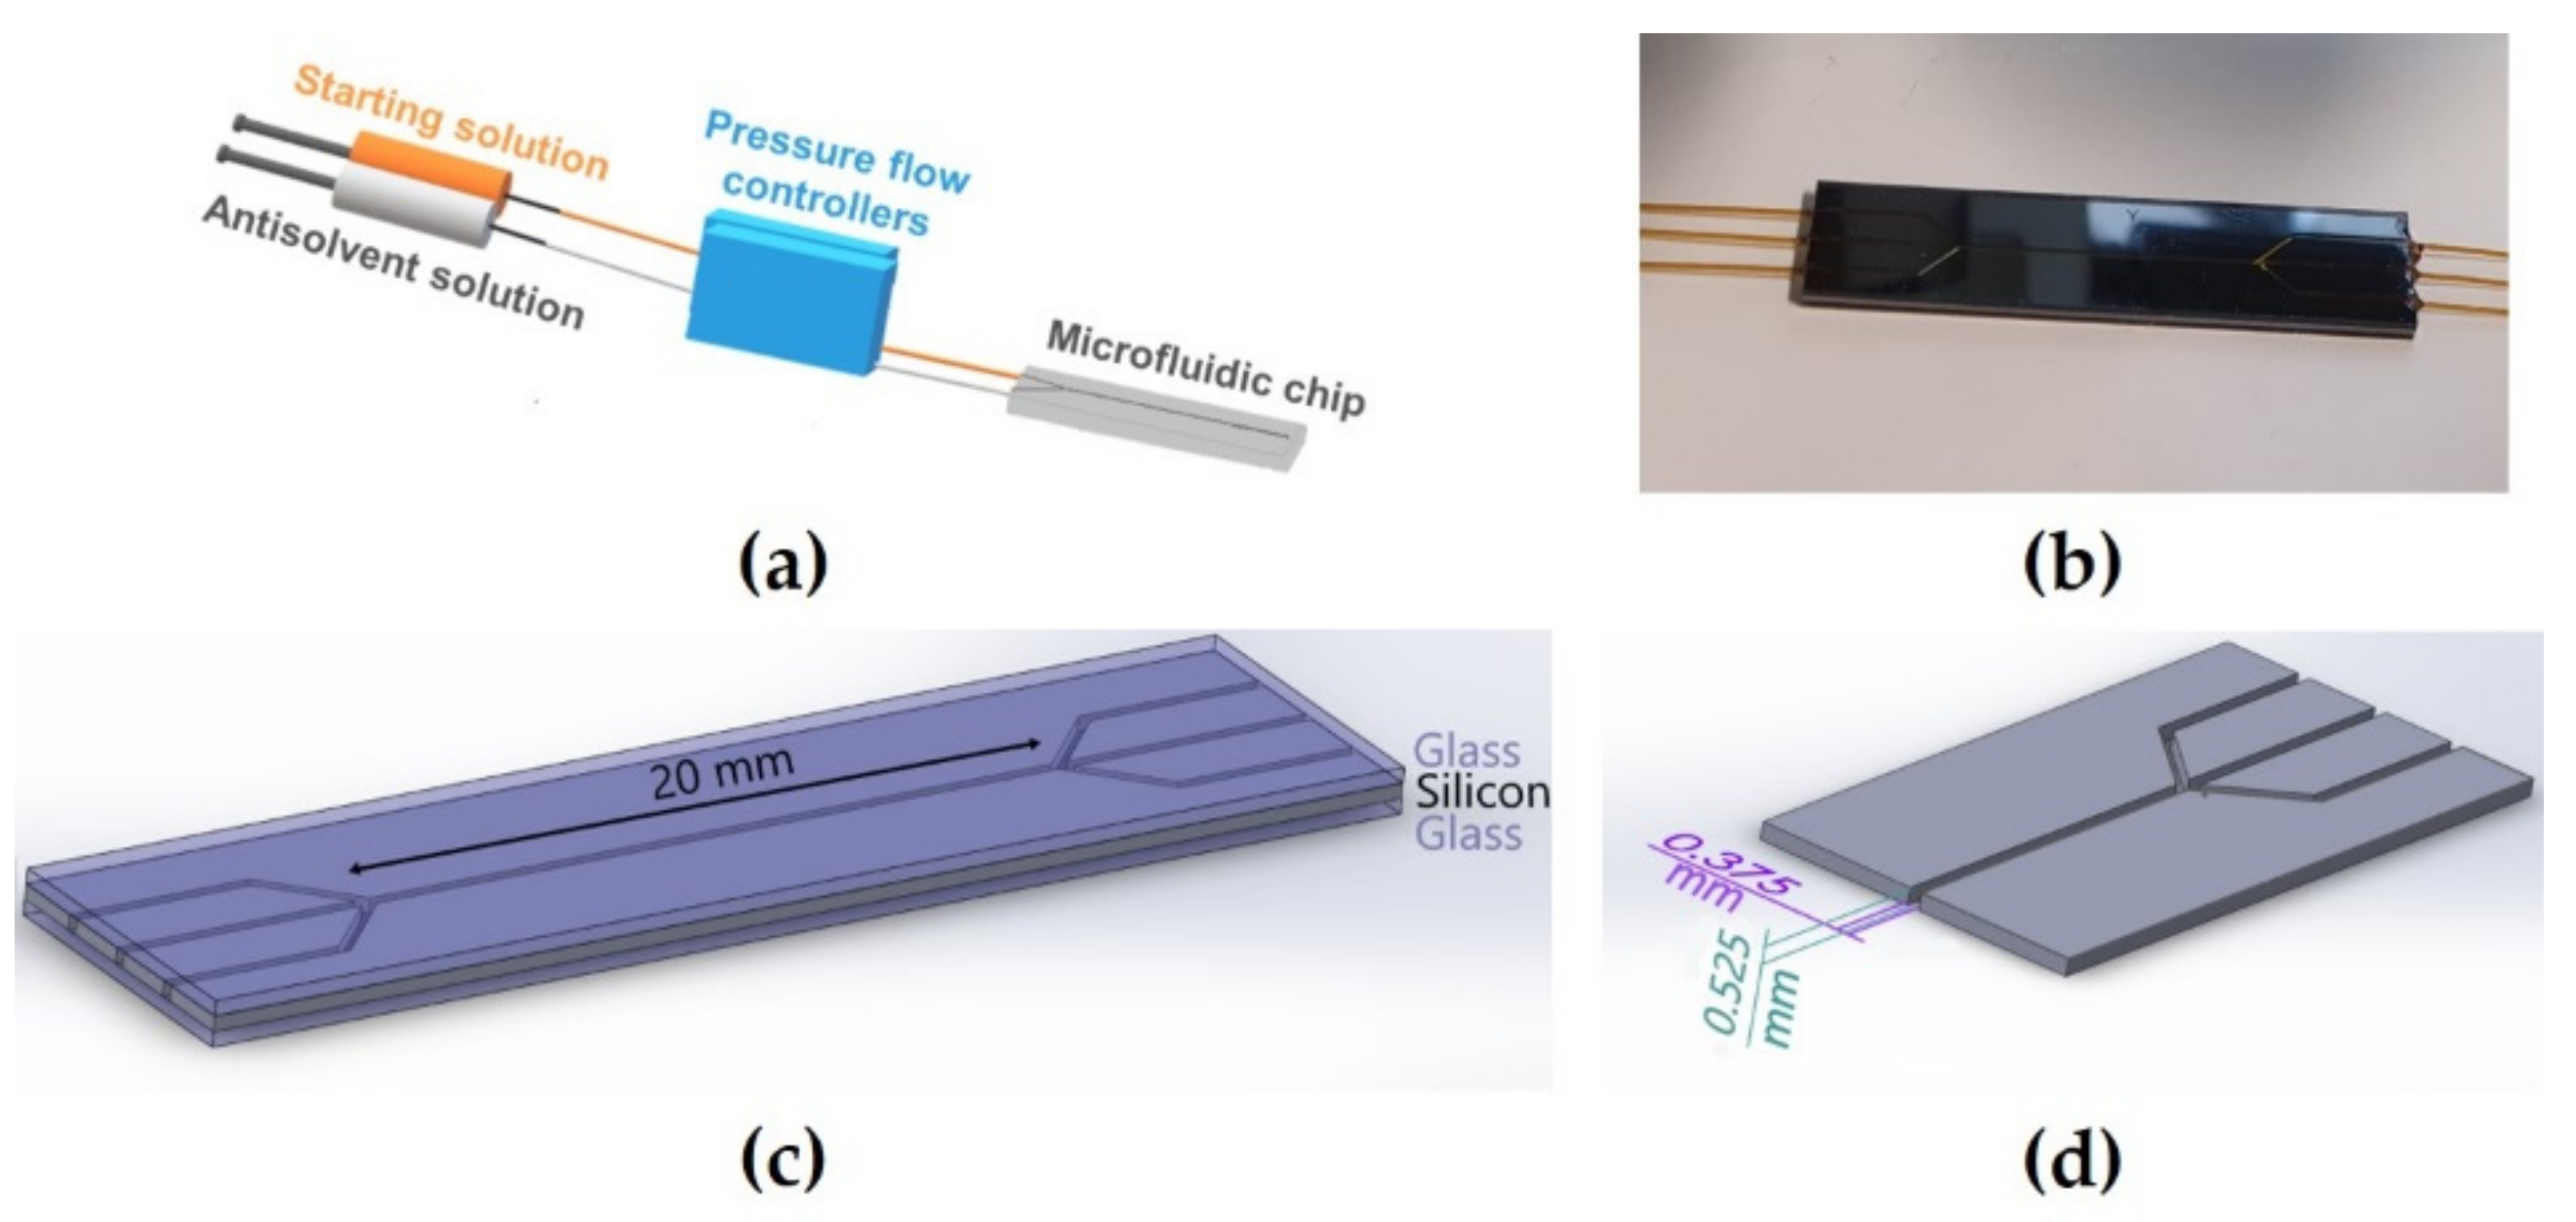
All experiments were performed in microfluidic chips. The microchannel was etched in a silicon wafer, and the top and bottom of the channel were sealed with borosilicate glass. The internal section (width × depth) of the channels used in this study was 0.375 mm × 0.525 mm, and the channel length was 20 mm (
Figure 4c,d). The channels were equipped with three inlets and outlets for infusion and evacuation of liquids and sealed by bonding 200 µm internal diameter Polymicro Technologies
® (Phoenix, AZ, USA) glass capillaries with dual-cure epoxy sealant (
Figure 4b). All connections were realized with IDEX connectors. Starting solution and antisolvent solution were simultaneously infused, and accurate flow rate controls were performed using Fluigent
® pressure flow controllers (Lowell, MA, USA) (
Figure 4a).
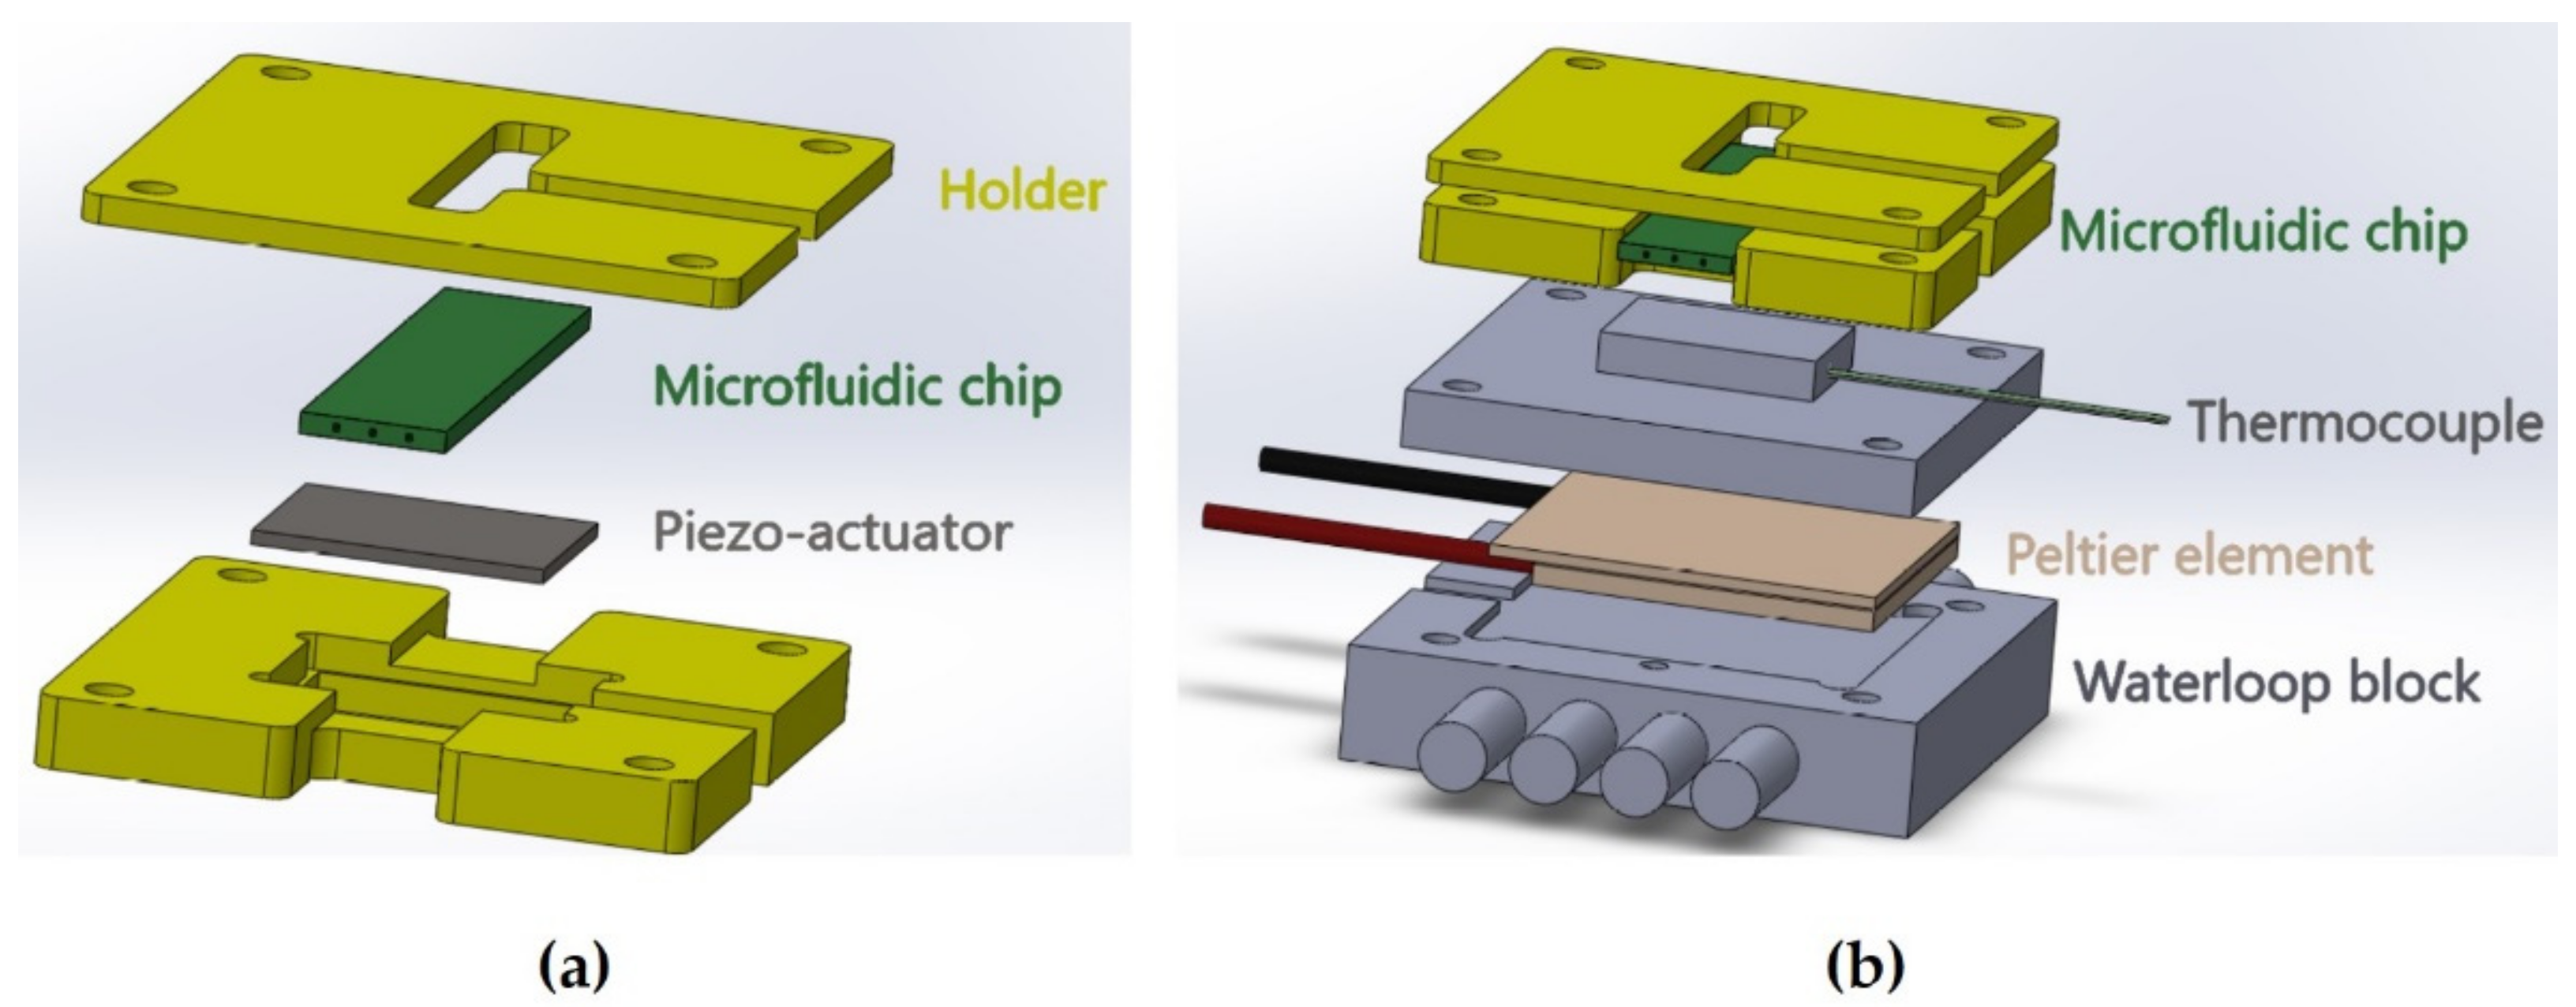
In-chip liquid mixing was performed by inducing acoustic streaming, for which a piezo-ceramic actuator (15 mm × 20 mm × 1 mm, APC international, Mackeyville, PA USA) with an eigenfrequency of around 2.0 MHz was placed at the back of the chip (
Figure 5a). A Tektronix AFG1062 function generator was used to apply a sinusoidal voltage to the piezo element and an RF power amplifier (210 L, Electronics & Innovations, Rochester, NY USA) amplified the applied voltage with a maximal total output power of 10 W. To prevent the heating of the sample with the supplied acoustic energy, active temperature control was implemented: the sample was thermostabilized by a Peltier element driven by a PID controller with feedback from a thermistor incorporated in an aluminum block close to the working volume. A 120 W Peltier element was used, and a constant temperature water loop was applied at the backside of the thermoelectric element to improve the performance of the system (
Figure 5b).
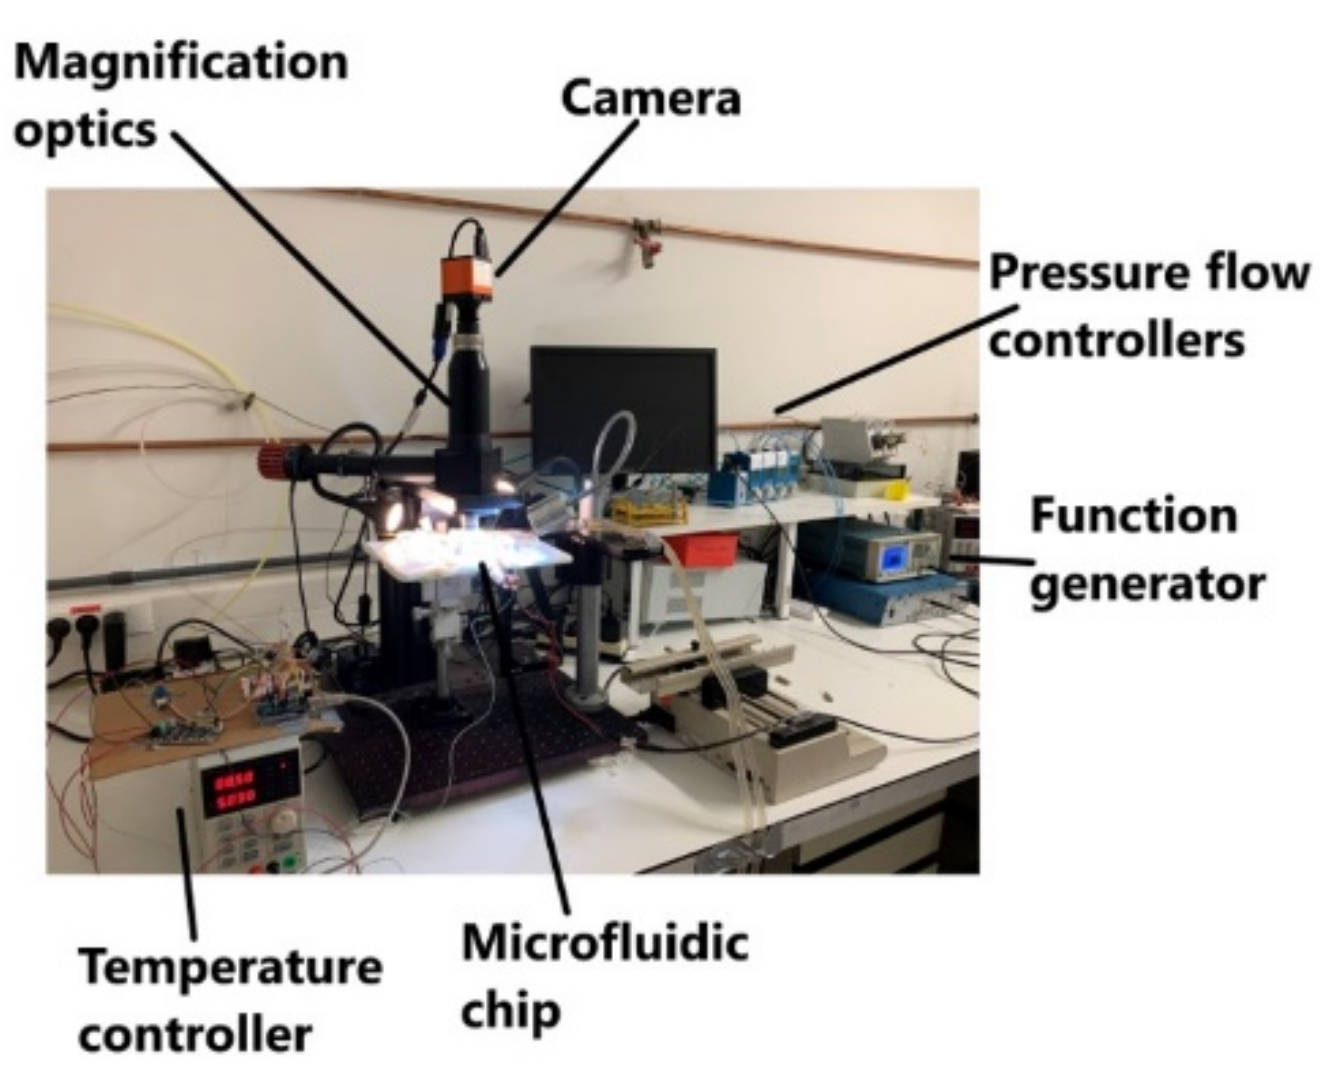
The overall setup was installed on an optical bench and imaged with a color HD camera through a 4× magnification objective. The microchannel was fixed on a translation stage, and the entire length of the channel could be placed in the field of view of the camera when searching for polymorphs. An overview of the experimental setup is pictured in
Figure 6.
3. Results
3.1. Supersaturation Protocol Influences ROY Polymorphism
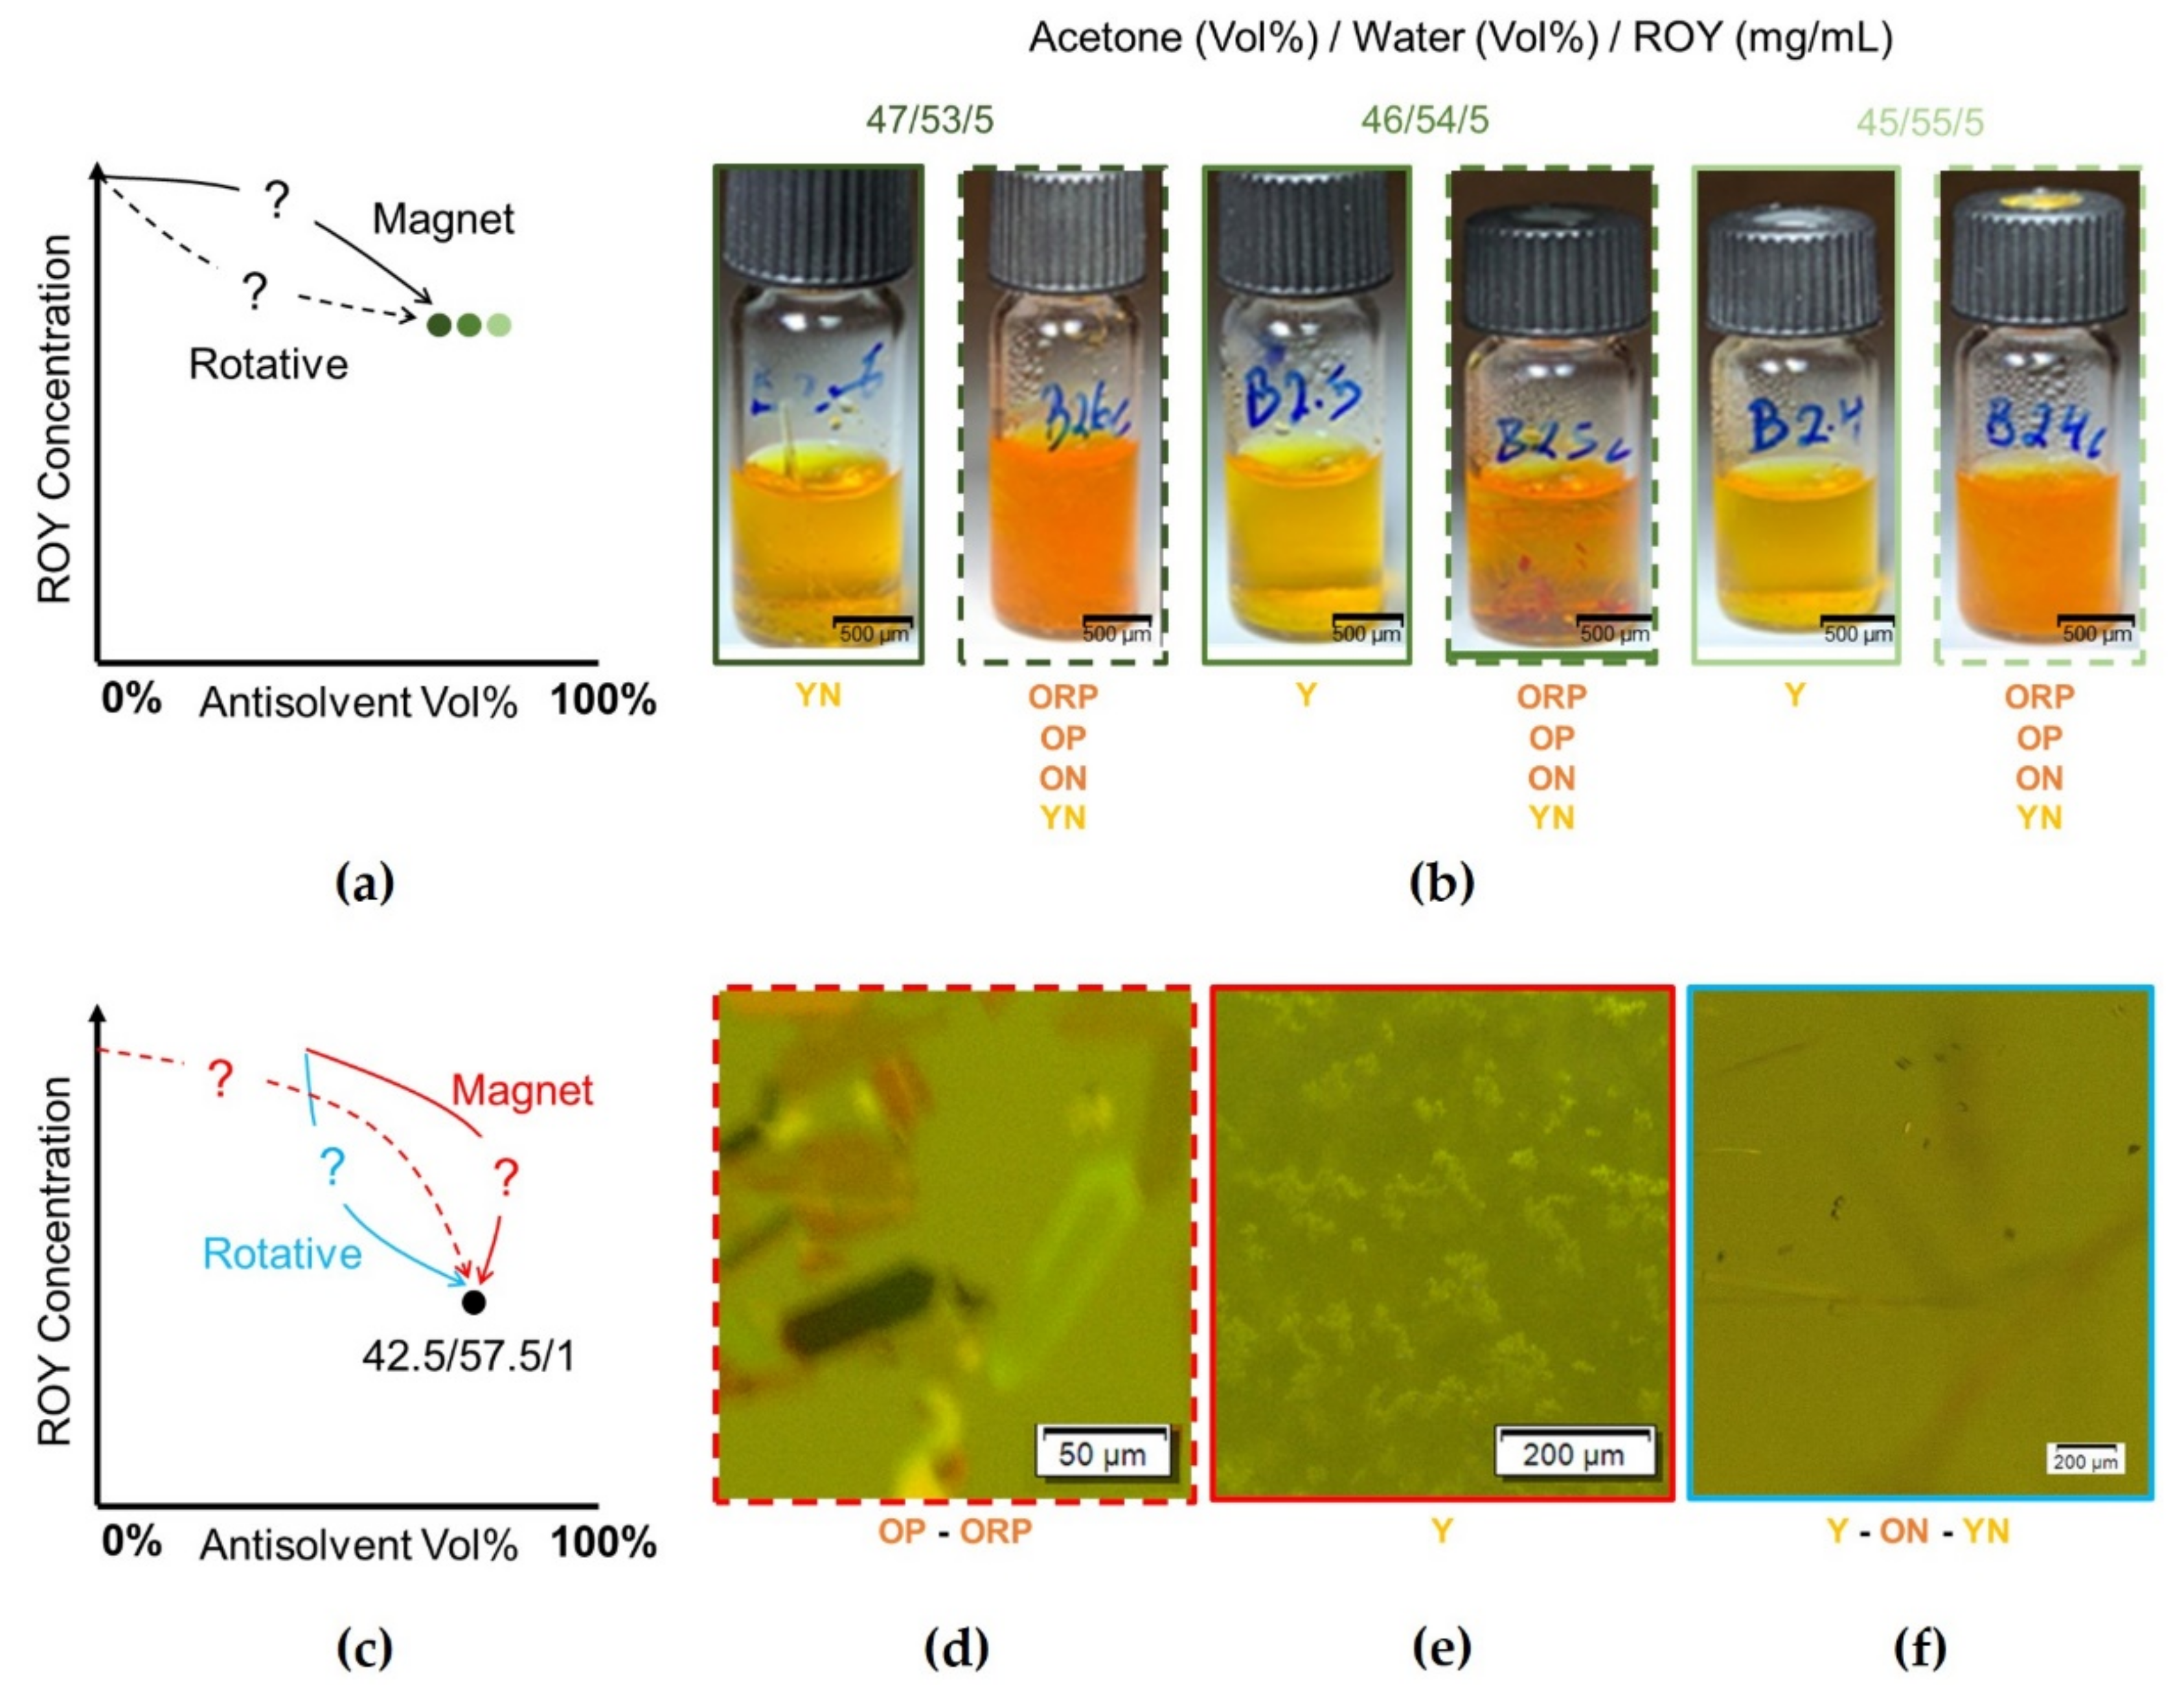
The most important parameters of crystallization of any compound are the concentration and the solvent-to-antisolvent ratio. ROY polymorphism has proven to be very sensitive to this ratio, and even the slightest change influences ROY polymorphism. To illustrate this, one batch shown here with a solvent volume percentage of 47.00 Vol% contained yellow needles (YNs) after mixing with a magnetic stirrer, while two batches with 46.00 Vol% and 45.00 Vol% solvent presented no YNs (
Figure 7b). These minimal changes with different results prompted the implementation of repetitions between 3 and 20 for the following results.
To better control mixing, a setup was created in which flows were controlled so that different parameters could be tested. Within this setup, we observed that despite the same final position within the phase diagram of ROY, the supersaturation protocol to reach this position can alter ROY polymorphism. First, the initial concentrations of the starting solution and the antisolvent solution before mixing alter the final polymorphs observed after mixing. Indeed, mixing an antisolvent mixture of 100.00 Vol% antisolvent with a starting solution until a final volume percentage of 57.50 Vol% was reached resulted in orange plates (OPs) and orange-red plates (ORPs). Contrarily, mixing a solution of 70.00 Vol% antisolvent with a starting solution until the same volume percentage of 57.50 Vol% was reached resulted in yellow prisms (Ys) (
Figure 7d,e).
Secondly, different mixing methods also alter the polymorph behavior independent of the final concentration and the solvent-to-antisolvent ratio (1.0 mg/mL ROY and 42.50 Vol% solvent, respectively). Mixing by a magnetic stirrer resulted in Ys, while mixing by rotation resulted in orange needles (ONs), yellow needles (YNs), and Ys (
Figure 7e,f). Similarly, mixing by rotation until an end concentration of 5.0 mg/mL ROY was reached led to a different mix of polymorphs compared with samples mixed by a magnetic stirrer (
Figure 7b). The effect of the mixing rate was also analyzed: the same set of polymorphs was consistently found, indicating that the mixing rate has no influence on polymorphism (
Figures S1 and S2). In conclusion, the supersaturation protocol clearly affects ROY polymorphism. These observations led to the realization that a more controlled mixing method is required and thus motivated our implementation of several mixing methods in a microfluidic setup.
3.2. Confinement Has Minimal Effect on ROY Polymorphism
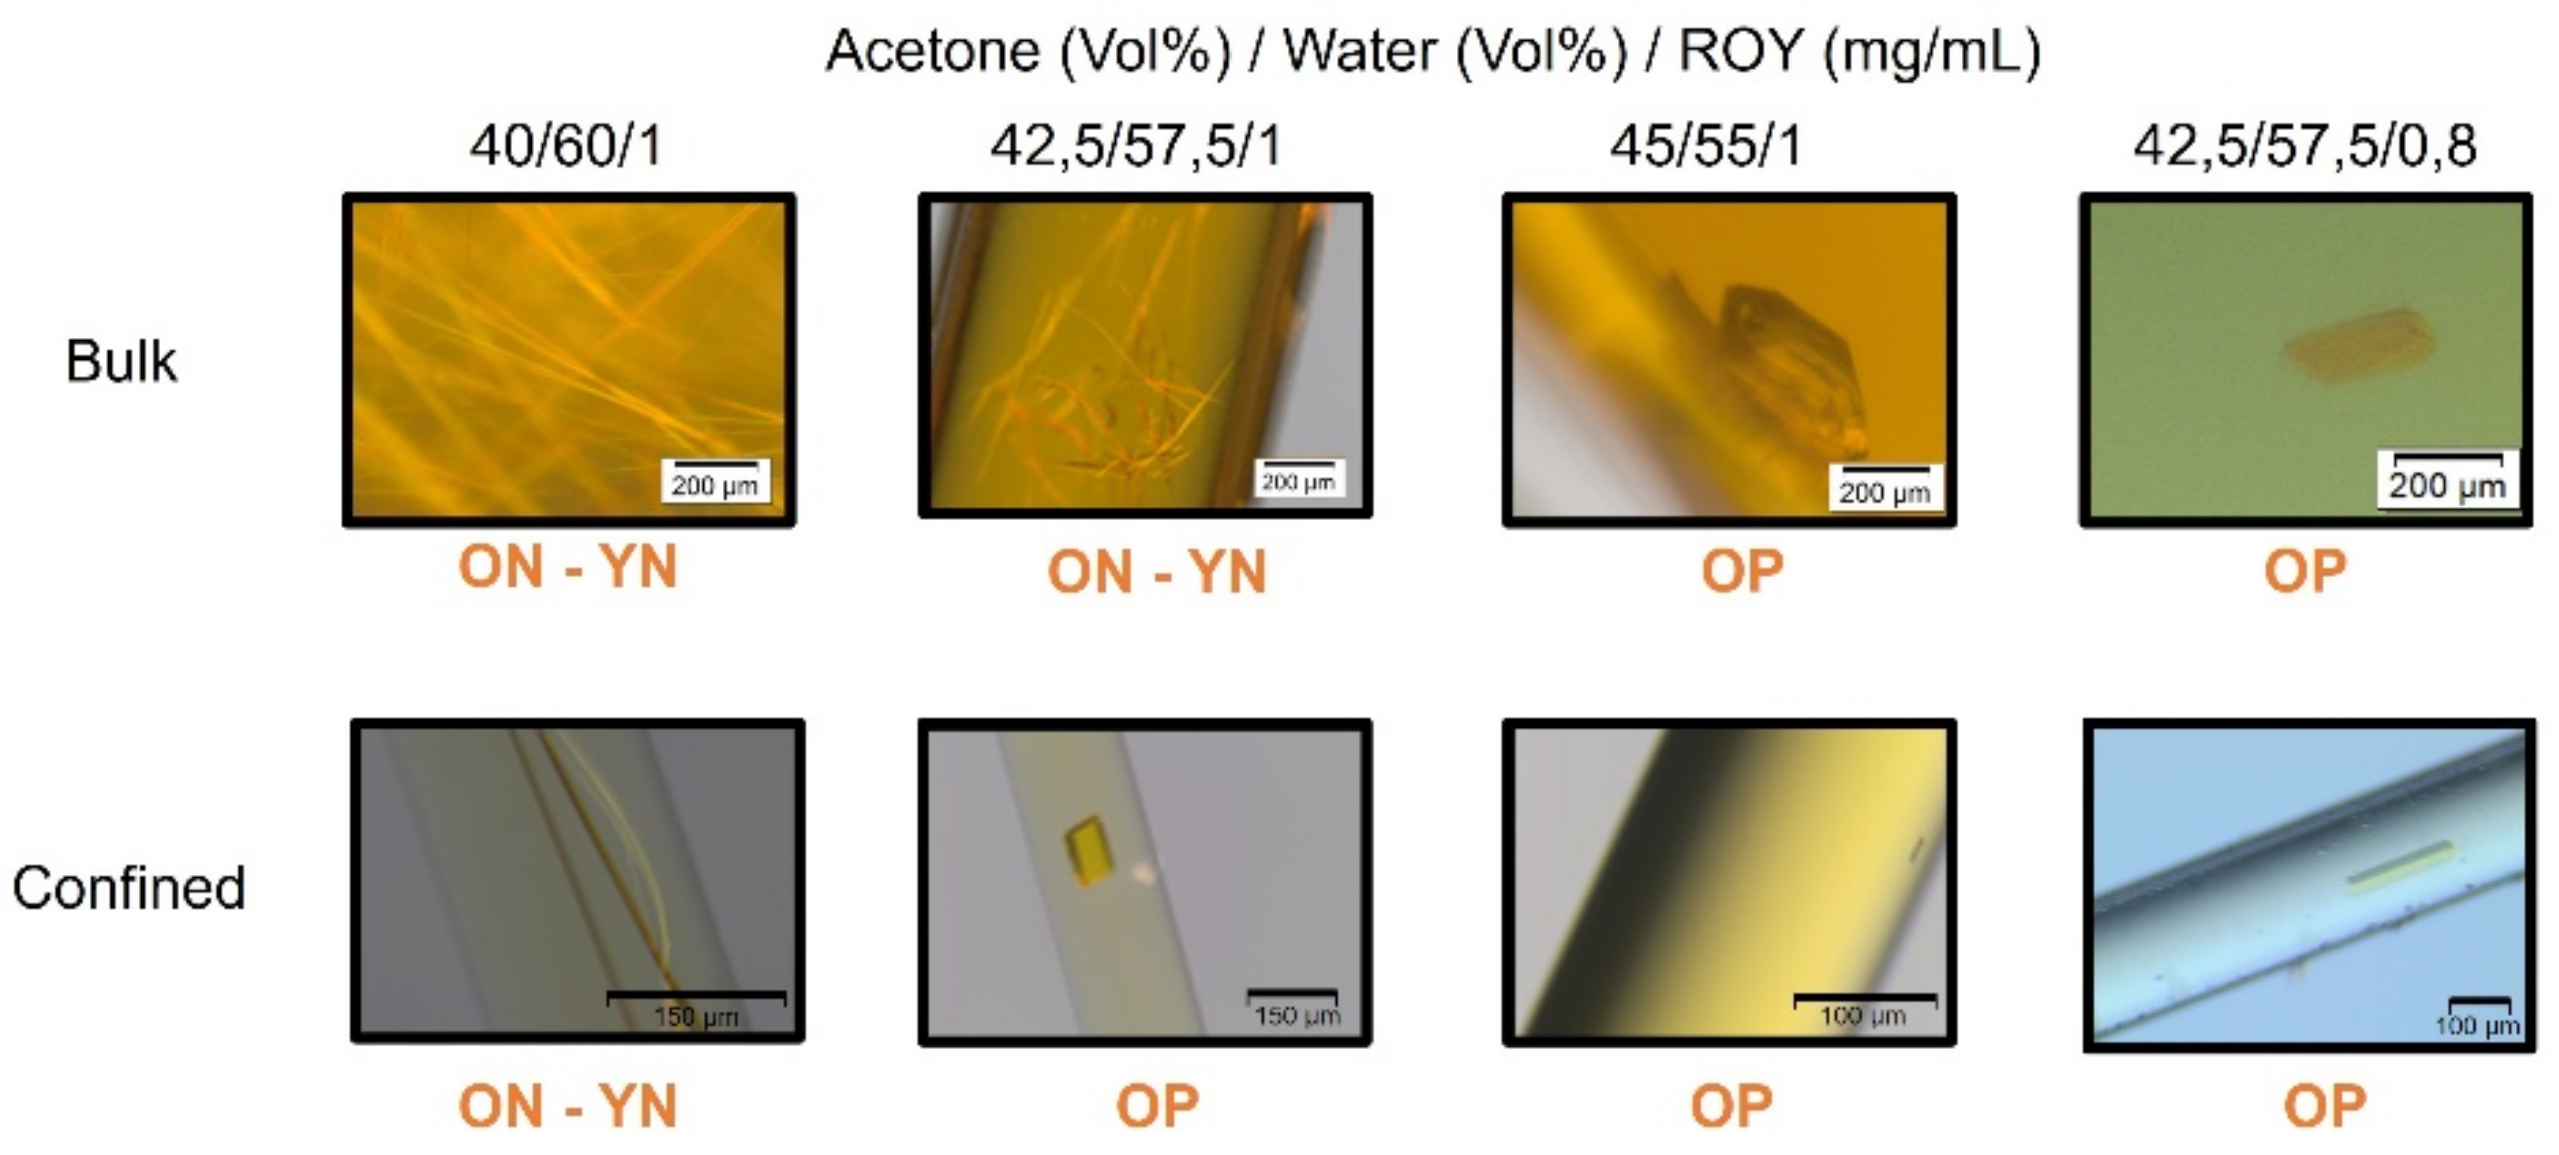
Continuing in a microfluidic environment raises the question of whether confinement is also to be considered as a parameter that influences ROY polymorphism. To analyze this effect, samples were administered to capillaries with a diameter of 100 µm, 200 µm, or 400 µm before crystallization. The dimensions of the tested capillaries compare to the dimensions of the microfluidic chips. For all experimental conditions, the same polymorphs were found in all capillaries independently of the diameter. To mimic a more drastic change in volume, the comparison of the crystallization of identical samples between bulk and confinement was made. No major differences could be seen between bulk and confinement for the different samples tested, except for the following condition: 1.0 mg/mL ROY in 42.50 Vol% of solvent (
Figure 8). In this sample, orange needles (ONs) with yellow needles (YNs) were observed when mixed in bulk, while orange plates (OPs) were observed when administered to a capillary. In order to identify the cause for these contrasting results, we set up a condition in bulk with the same solvent volume percentage and a lower ROY concentration of 0.8 mg/mL. In these conditions, OPs were formed, as they were in the capillary with 1.0 mg/mL. This suggests that the effect of confinement on ROY polymorphism is minimal and can be explained by transient local depletion of ROY molecules that can nucleate within a confined space.
3.3. In-Chip Mixing
Two parallel flows of ROY and antisolvent solutions were infused simultaneously in the microchannel, and mixing was performed by inducing acoustic streaming. Acoustic streaming is known to be very sensitive to the experimental parameters. Indeed, acoustically soft water inside the channel surrounded by the acoustically hard silicon/glass chip forms an acoustic cavity. This implies that acoustic resonance occurs for certain specific frequencies. By tuning the applied frequency to one of the resonance frequencies so as to obtain a stationary wave along the width of the channel, the acoustic energy density inside the cavity is several orders of magnitude larger than it is at other frequencies [
11], and the acoustic forces become strong enough to obtain efficient mixing [
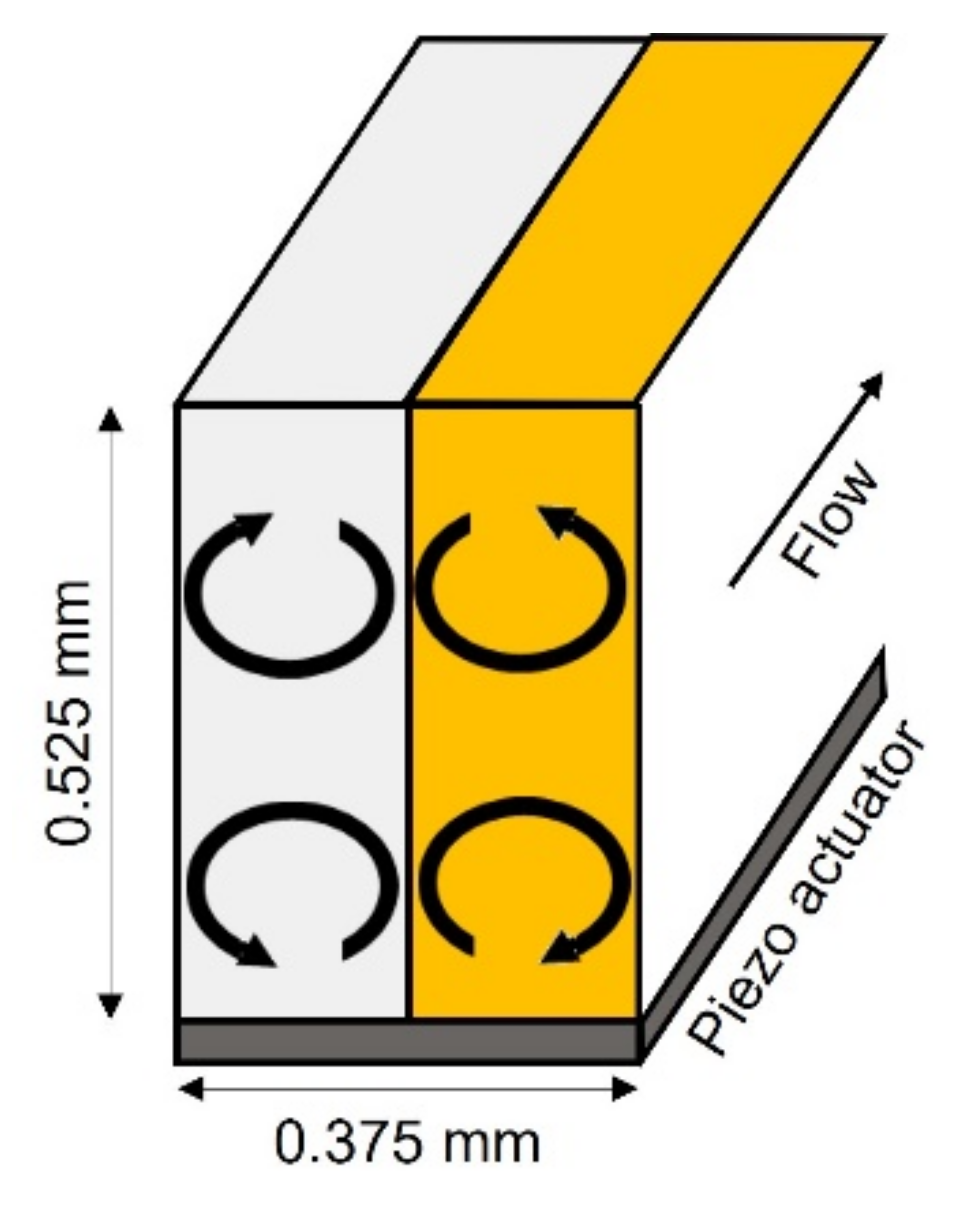
12]. The frequency of the applied signal was carefully adjusted to a resonance frequency with a precision of up to 0.001 MHz. Experimentally, this step was performed by infusing colored liquids and by monitoring the efficiency of the acoustic mixing as a function of the frequency. When an optimal frequency was reached, colored vortices were easily observed. Under these conditions, viscous attenuation of the acoustic wave in the liquid boundary layer resulted in four vortices in the direction of the acoustic propagation [
11] (
Figure 9). In addition, it is well known from the literature that the velocity of the liquid in the vortices increases approximately quadratically with the amplitude of the applied voltage [
13]. Different mixing rates were obtained by varying the amplitude of the voltage applied to the piezoelectric element; voltage values of 0.12 V, 0.2 V, 0.5 V, and 1 V were used.
By applying sufficient acoustic power, complete mixing in the microfluidic channel occurred very rapidly. The amount of energy transferred was high, and this system caused the sample to heat up. In the absence of regulation, an increase of about 30 °C was observed within one minute. To counteract this, a PID temperature controller was used to stabilize the sample at room temperature. A typical stability of the measured temperature was ±0.1 °C (RMS value).
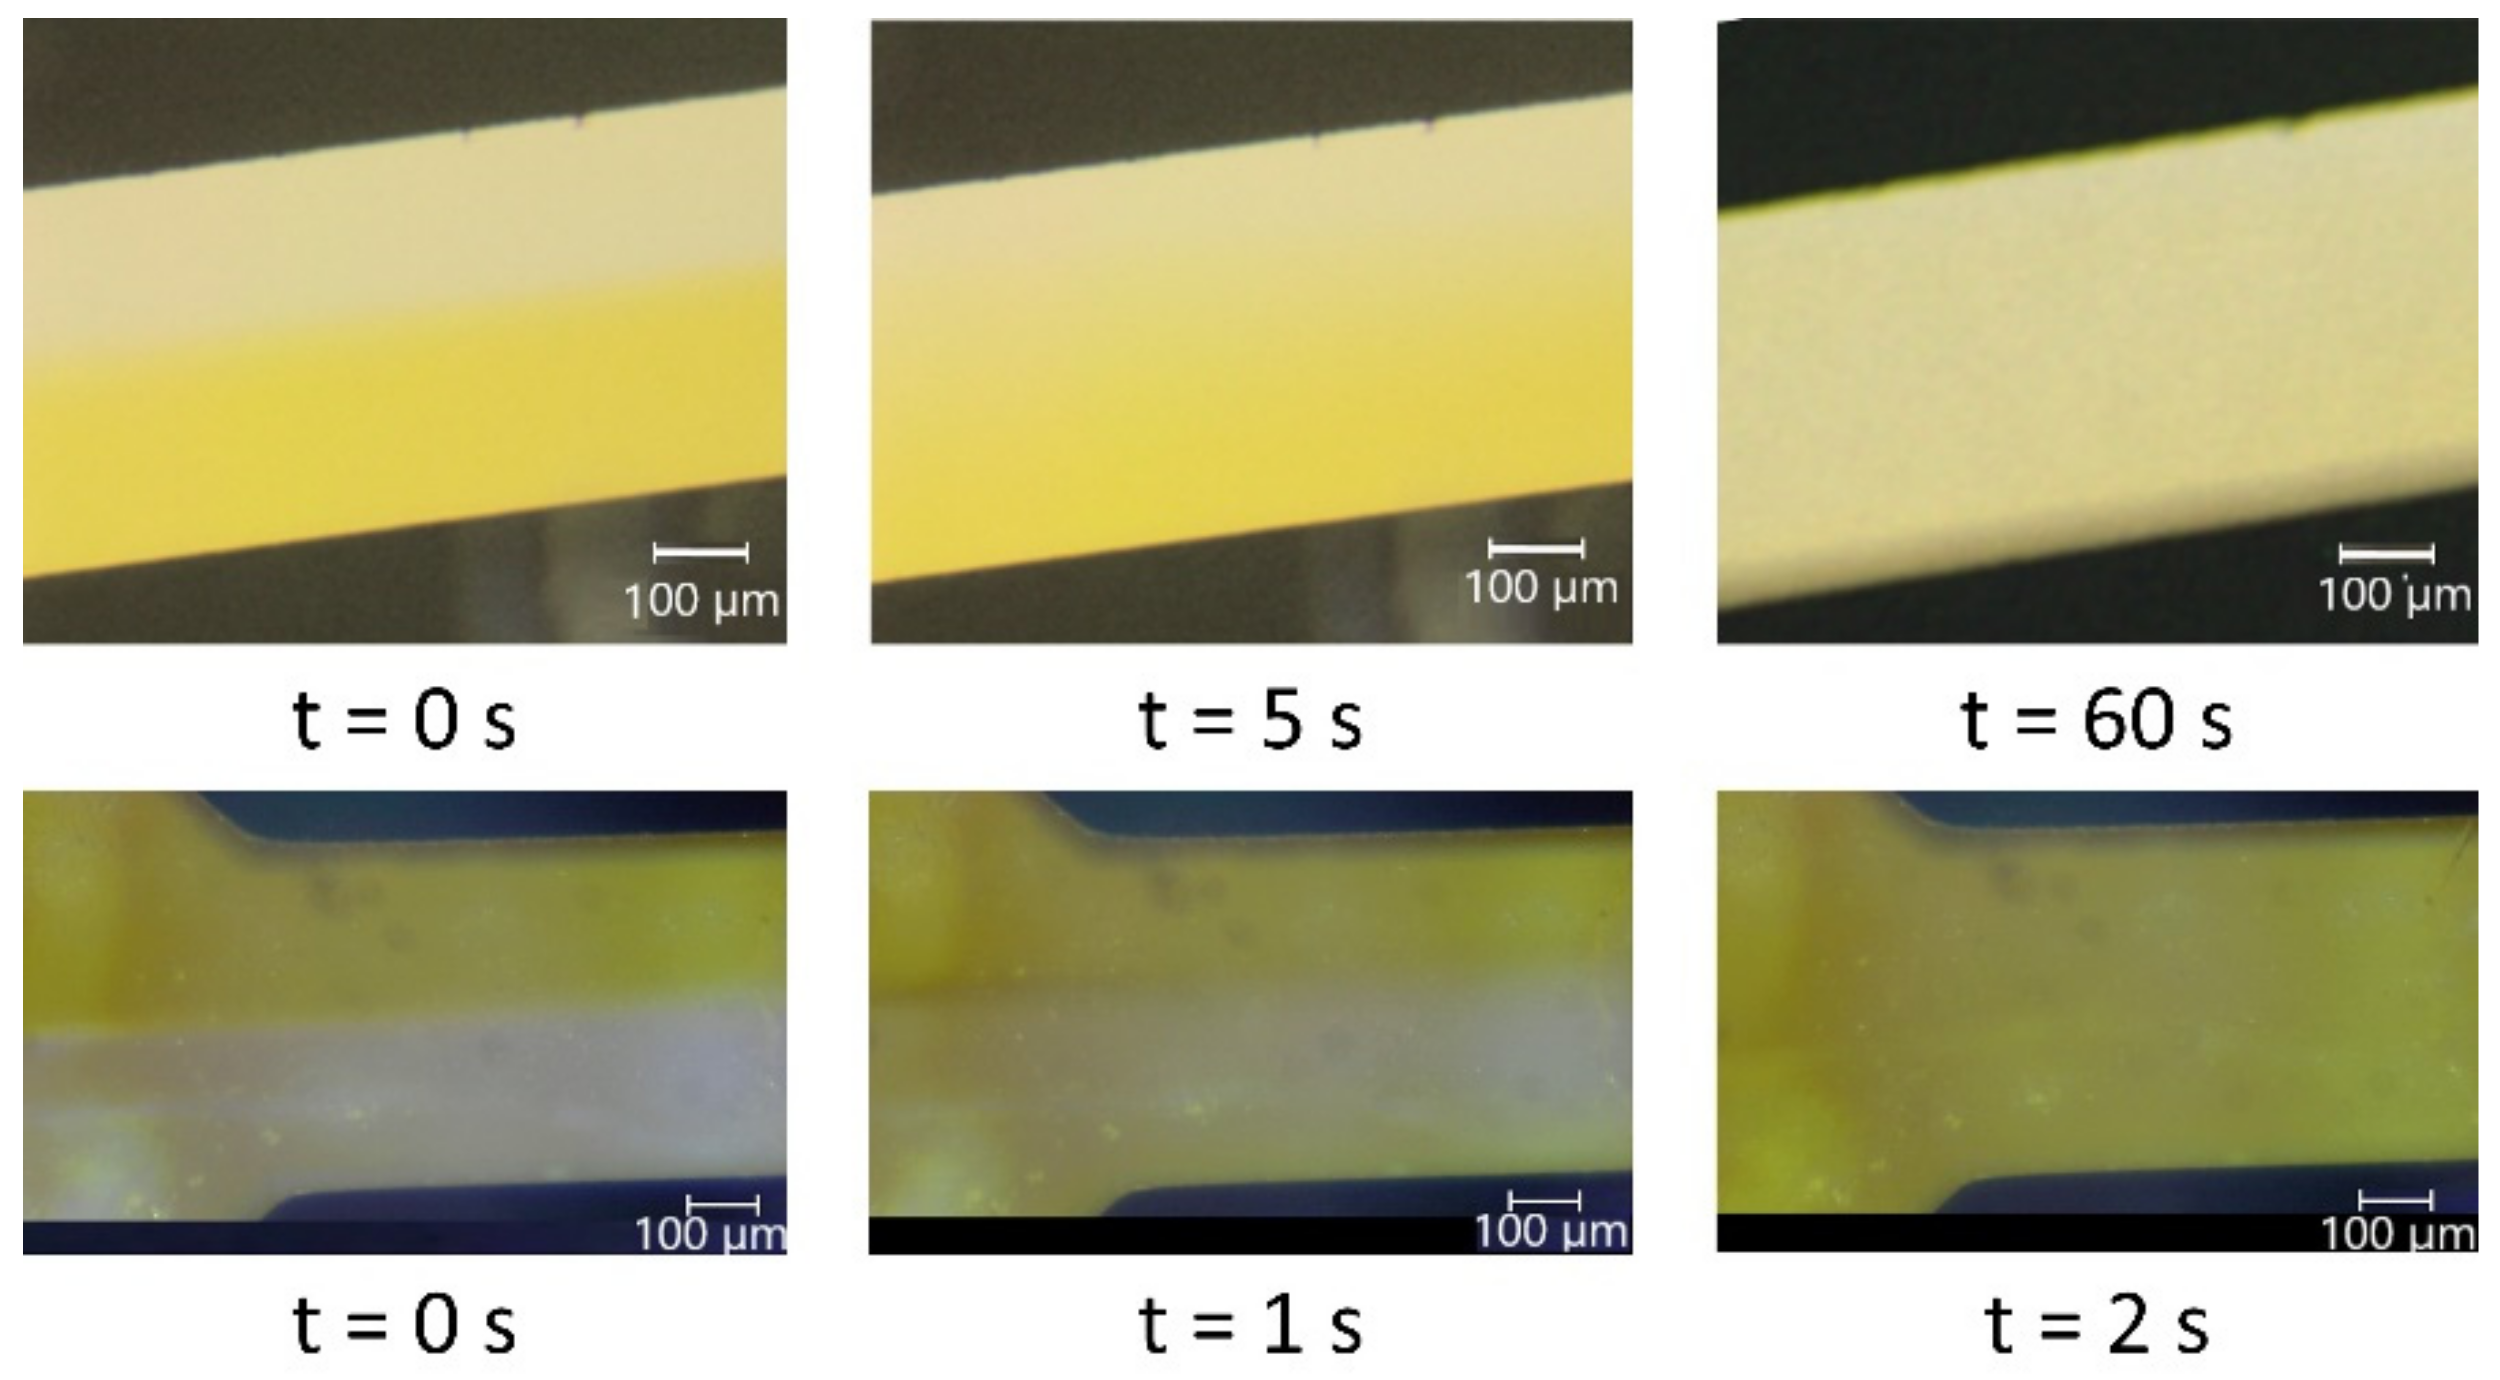
The two extreme cases tested are compared in
Figure 10: in the first case, no voltage was applied, and the mixing occurred spontaneously by molecular diffusion. At time zero, when the flows were stopped, a clear interface between the liquids was observed. Mixing occurred gradually and was monitored qualitatively by the color variation. After about 60 s, no more color change was observed. In the second case, a 1 V
pp voltage was applied to the piezo element. Vortices instantaneously appeared, and complete mixing was obtained within about 2 s.
3.4. Supersaturation Protocol Used within Microfluidic Channel Influences ROY Polymorphism
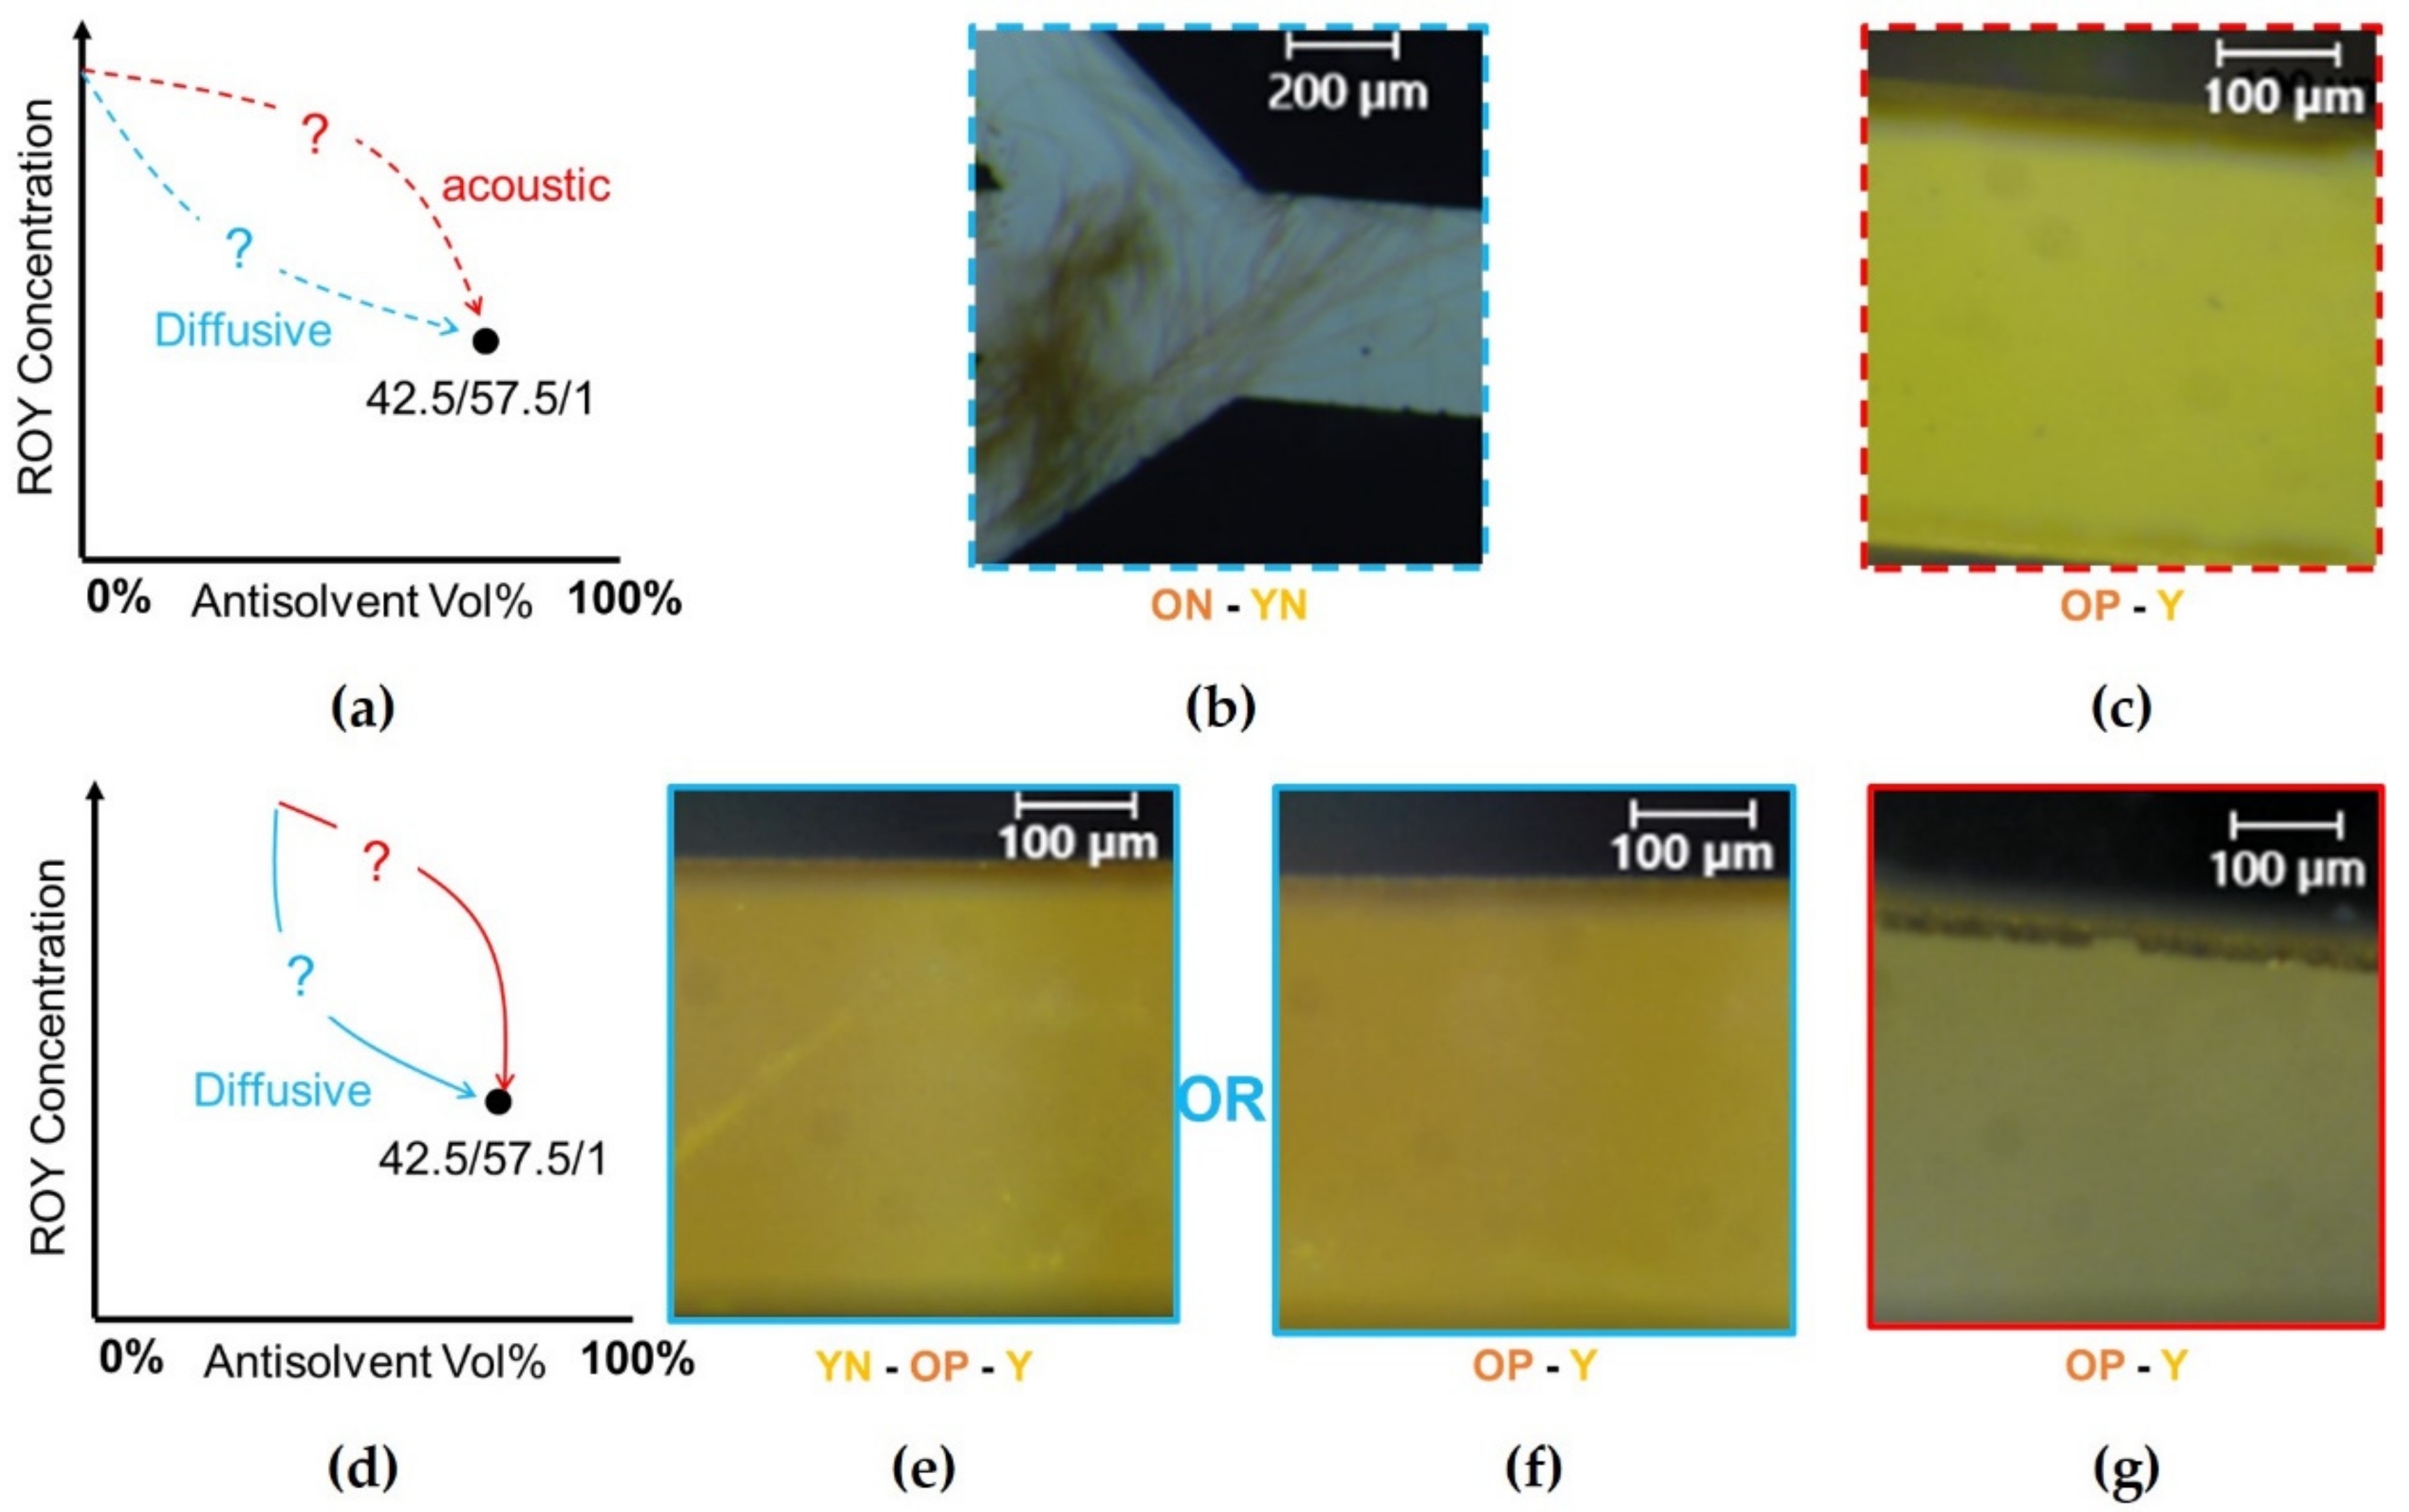
A large number of experiments was performed in order to investigate the polymorphism in a microfluidic environment. Two main parameters were tested: on the one hand, different solvent and antisolvent concentration gradients were tested by varying the concentration of the infused solutions. For the first series of samples, depicted with dotted lines in
Figure 11, pure antisolvent and ROY–acetone solutions were infused in the channel. For the other samples, depicted with solid lines in
Figure 11, smaller solvent and antisolvent concentration gradients were created by infusing solutions with 70.00 and 55.00 Vol% antisolvent. Respective flowrates were adjusted so that after mixing, the final concentration in the microchannel corresponded to 42.50 Vol% acetone, 57.50 Vol% water, and 1.0 mg/mL ROY. These concentrations were identical to the concentrations of samples d, e, and f tested in bulk conditions in
Figure 7.
Both the initial concentrations of the solutions and the mixing methods were found to play an important role in polymorphism. Indeed, large initial concentration gradients (
Figure 11a) and diffusive mixing consistently resulted in yellow and orange needles (YNs and ONs), as shown in
Figure 11b. The needles appeared in the central region of the channel, at the interface between the two liquids, and quickly developed in the entire volume.
However, with the same solutions, crystallization appeared to be very different when acoustic mixing was applied and mixtures of orange plates (OPs) and yellow prisms (Ys) were obtained for all tested samples, as shown in
Figure 11c.
With smaller concentration gradients (
Figure 11d), diffusive mixing resulted in different polymorphs. For most samples (7 out of 10), a mixture of OPs and Ys was obtained (
Figure 11f), while for three samples, large YNs were also observed (
Figure 11e). Orange plates were mostly observed along the walls of the channel, but crystals appeared everywhere. Finally, for those solutions and in all tested samples, acoustic mixing resulted in OPs and Ys, as shown in
Figure 11g.
In these samples, crystallization began as soon as mixing started along the walls of the microchannels, and crystals were observed in the entire volume in a few seconds. In most experimental runs, OPs grew faster, and Ys were detected 30 s to one minute after the mixing. Identical polymorphs were obtained for all tested intensities of acoustic mixing (
Figure S3).
4. Discussion
From the overall experimental dataset obtained in this study, we made some general key observations about ROY polymorphism. ROY polymorphism is very sensitive to the solvent-to-antisolvent ratio, as shown in the results obtained in
Figure 7. Moreover, it appears that mixing is a key parameter. A homogeneous sample after mixing by rotation is reached after several seconds. On the timescale of seconds, different local concentrations are possible in the vial during the entire infusion process, and strong local concentration gradients exist in the mixture. This allows the system to sample several regions in the free energy diagram and nuclei of various polymorphs to form and reach critical sizes. This results in very complex final mixtures of many polymorphs, as shown in the dotted lined samples in
Figure 7b. This statement is supported by the results displayed in
Figure 7d,e, in which different start concentrations were used to mix to the final end concentration. Indeed, lowering the initial concentration gradients results in smaller local concentration gradients, resulting in a smaller variety of polymorphs in the end. Contrarily, mixing with a magnetic stirrer allows faster mixing and keeps the concentration homogeneous in the entire vial. This mixing method results in less drastic local concentration gradients, prohibiting the system from reaching certain regions in the free energy diagram. This gives rise to a smaller variety of polymorphs compared with the samples mixed by rotation.
Similar observations emerged when analyzing the results of microfluidic experiments. The results in
Figure 8 show that the influence of the confinement of the sample is low. However, for identical final conditions, two mixing methods within the microfluidic channels led to other polymorphs, as shown in
Figure 11. Diffusive mixing is slower, and the concentration gradients in the liquid result in less reproducible experiments allowing the formation of different polymorphs, while acoustic mixing always leads to orange plates and yellow prisms. Acoustic mixing is very efficient, and the system reaches its final mean concentration in the entire microfluidic channel within 1 to 2 s. These results indicate that in the final concentration condition, that is, 47.50 Vol% acetone, 52.50 Vol% water, and 1.0 mg/mL ROY; orange plates and yellow prisms are the most stable polymorphs.
It also appears that needles can be obtained with rotative mixing in bulk or with diffusive mixing in a microchannel, but over the very large number of experiments that we performed, needles were never obtained with magnetic stirring in vials nor with acoustic mixing in microchannels. These observations suggest that needle nucleation occurs on longer timescales. On the basis of our experiments, however, it is not possible to draw a solid conclusion, and the formation of needles could also be hindered by excessive shear and flow resulting from the magnetic stirring and acoustic mixing. Moreover, a separate study on nucleation may bring interesting insights into the driver of these differences observed.
Throughout all our experiments, orange-red plates were observed in very few samples. This polymorph is not stable in the concentration domain that we tested. Finally, it appears that the microfluidic environment and the use of fast mixing methods represent an interesting opportunity for the selective production of certain polymorphs. Under the conditions that we tested, the preparation of the samples in microfluidic reactors and using acoustic mixing consistently produced orange plates and yellow prisms.
5. Conclusions
This work reports on ROY crystallization in various conditions. Not only do the final end concentration of the solvent, antisolvent, and ROY affect polymorphism, but the selected protocol used to reach supersaturation also affects the polymorphism behavior. Here, we reported on two different sets of protocols resulting in different polymorphs: first by changing the initial mixing solutions, and second, by altering the mixing method. In bulk, mixing was performed either by rotation or a magnetic stirrer. In a microfluidic setup, we created controlled mixing environments and tested the two sets of protocols: changing the initial concentrations and the mixing method. In the microfluidic channel, this was achieved by either diffusive mixing or mixing acoustic streaming. To analyze mixing in a microfluidic setup, the influence of confinement on polymorphism was considered. The only effect of confinement that we discovered was the transient local depletion of ROY molecules.
Both in bulk and in a microfluidic environment, changing the initial stock solutions resulted in different polymorphs, as did the applied mixing method. We believe that mixing by rotation in bulk and mixing by diffusion in a microfluidic channel allows the system to reach minima in the free energy diagram because of slow mixing and large local gradients, which are not reached (or do not last long enough) when fast mixing is performed by a magnetic stirrer in bulk or acoustic streaming in a microfluidic channel. This results in more variable and less stable polymorphs in the conditions tested when slow mixing occurs. On the basis of these findings, we conclude that orange plates and yellow prisms are the most stable polymorphs in the system that we tested. Indeed, needles only appear under gentle mixing conditions, such as diffusion and mixing by rotation, while orange-red plates were sporadically obtained.
In the microfluidic setup, in which mixing can be accurately controlled, orange plates and yellow prisms can be efficiently and reproducibly selected. Overall, these findings show that the start conditions, supersaturation protocol, and flow are critical parameters in ROY polymorphism that have to be considered in the design of systems for polymorph selectivity.
Supplementary Materials
The following supporting information can be downloaded at:
https://www.mdpi.com/article/10.3390/cryst12050577/s1, Figure S1: mixing rate in bulk experiments with rotative mixing does not influence polymorphism; Figure S2: mixing rate in bulk experiments with magnetic stirrer does not influence polymorphism; Figure S3: intensity of acoustic mixing does not influence polymorphism in microfluidics.
Author Contributions
Conceptualization, D.M., W.D.M., Q.G. and M.V.N.; methodology, D.M., Q.G., M.H. and M.V.N.; experiment design, Q.G., M.V.N., M.H. and P.G.; resources, M.H.; writing—original draft preparation, M.V.N. and Q.G.; writing—review and editing, M.V.N., Q.G., D.M. and J.F.L.; supervision, D.M. and W.D.M.; project administration, D.M.; funding acquisition, D.M. All authors have read and agreed to the published version of the manuscript.
Funding
This research was funded by the European Space Agency under Prodex Contract No. ESA AO-2004-070 and by a Strategic Research Program on Microfluidics (SRP51) at Vrije Universiteit Brussel.
Institutional Review Board Statement
Not applicable.
Informed Consent Statement
Not applicable.
Data Availability Statement
Not applicable.
Conflicts of Interest
The authors declare no conflict of interest. The funders had no role in the design of the study; in the collection, analyses, or interpretation of data; in the writing of the manuscript; or in the decision to publish the results.
References
- Morrow, S. One hundred and fifty years of isomorphism. J. Chem. Educ. 1969, 46, 580. [Google Scholar] [CrossRef]
- Cruz-Cabeza, A.; Bernstein, J. Conformational polymorphism. Chem. Rev. 2014, 114, 2170–2191. [Google Scholar] [CrossRef] [PubMed]
- Lee, E. A practical guide to pharmaceutical polymorph screening & selection. Asian J. Pharm. Sci. 2014, 9, 163–175. [Google Scholar] [CrossRef] [Green Version]
- Thakuria, R.; Thakur, R.S. Crystal Polymorphism in Pharmaceutical Science. In Comprehensive Supramolecular Chemistry II, 2nd ed.; Atwood, J.L., Ed.; Elsevier: Edinburgh, UK, 2017; Volume 2, pp. 283–309. [Google Scholar]
- Raza, K. Polymorphism: The Phenomenon Affecting the Performance of Drugs. SOJ Pharm. Pharm. Sci. 2014, 1, 10. [Google Scholar] [CrossRef] [Green Version]
- Mitchell, C.A.; Yu, L.; Ward, M.D. Selective nucleation and discovery of organic polymorphs through epitaxy with single crystal substrates. J. Am. Chem. Soc. 2001, 123, 10830–10839. [Google Scholar] [CrossRef] [PubMed]
- Gushurst, K.S.; Nyman, J.; Boerrigter, S.X.M. The PO13 crystal structure of ROY. Cryst. Eng. Comm. 2019, 21, 1363–1368. [Google Scholar] [CrossRef]
- Yu, L. Polymorphism in molecular solids: An extraordinary system of red, orange, and yellow crystals. Acc. Chem. Res. 2010, 43, 1257–1266. [Google Scholar] [CrossRef] [PubMed]
- Nagaki, W.; Doki, N.; Yokota, M.; Yamashita, K.; Kojima, T.; Tanaka, T. Control of Crystal Size and Morphology of Calcium Carbonate Crystal Polymorphism. J. Mater. Sci. Chem. Eng. 2021, 9, 38–45. [Google Scholar] [CrossRef]
- Ziemecka, I.; Gokalp, S.; Stroobants, S.; Brau, F.; Maes, D.; de Wit, A. Polymorph selection of ROY by flow-driven crystallization. Crystals 2019, 9, 351. [Google Scholar] [CrossRef] [Green Version]
- Barnkob, R.; Augustsson, P.; Laurell, T.; Bruus, H. Measuring the local pressure amplitude in microchannel acoustophoresis. Lab Chip 2010, 10, 563–570. [Google Scholar] [CrossRef] [PubMed]
- Gelin, P.; Maes, D.; de Malsche, W. Reducing Taylor-Aris dispersion by exploiting lateral convection associated with acoustic streaming. Chem. Eng. J. 2021, 417, 128031. [Google Scholar] [CrossRef]
- Muller, P.B.; Barnkob, R.; Jensen, M.J.H.; Bruus, H. A numerical study of microparticle acoustophoresis driven by acoustic radiation forces and streaming-induced drag forces. Lab Chip 2012, 12, 4617–4627. [Google Scholar] [CrossRef] [PubMed] [Green Version]
Figure 1.
ROY used in this study produced a mixture of polymorphs with sizes ranging from 1 to 200 µm.
Figure 1.
ROY used in this study produced a mixture of polymorphs with sizes ranging from 1 to 200 µm.
Figure 2.
Setup of crystallization in bulk experiments: (a) sample is mixed by a magnetic stirrer during 10 min infusion; (b) mixed by rotation during 10 min infusion.
Figure 2.
Setup of crystallization in bulk experiments: (a) sample is mixed by a magnetic stirrer during 10 min infusion; (b) mixed by rotation during 10 min infusion.
Figure 3.
Confinement experiment in which sample is administered to capillaries before nucleation. Capillary is sealed afterwards with wax.
Figure 3.
Confinement experiment in which sample is administered to capillaries before nucleation. Capillary is sealed afterwards with wax.
Figure 4.
Microfluidic setup: (a) Simultaneous infusion of starting solution and antisolvent solution with accurate flow controls were performed with pressure flow controllers; (b) inlets and outlets were sealed with glass capillary tubes; (c) channel length of the chips was 20 mm; (d) internal section (width × depth) of the chips was 375 µm × 525 µm.
Figure 5.
In-chip liquid mixing: (a) acoustic mixing of the liquid was obtained by vibrating the window of the chip with a piezo-ceramic actuator; (b) the cell system incorporated a PID temperature control system.
Figure 5.
In-chip liquid mixing: (a) acoustic mixing of the liquid was obtained by vibrating the window of the chip with a piezo-ceramic actuator; (b) the cell system incorporated a PID temperature control system.
Figure 6.
Overview of microfluidic experimental setup, including the PID temperature control system and the pressure flow controllers.
Figure 6.
Overview of microfluidic experimental setup, including the PID temperature control system and the pressure flow controllers.
Figure 7.
Supersaturation protocol influences ROY Polymorphism. (a) Schematic overview with possible trajectories of bulk mixing experiments performed within phase diagram; the supersaturation protocols represented here are mixing by rotation versus mixing by a magnetic stirrer. (b) Results after mixing with a magnetic stirrer (full line) or rotation (dotted line) with shown end concentrations and solvent to antisolvent ratios. (c) Schematic overview. Supersaturation protocols represented here are mixing by rotation versus mixing by a magnetic stirrer (blue versus red) and varying concentrations of the infused solutions (dotted versus full line). (d–f) Microscopic images of samples with the following concentrations and supersaturation protocol. (d) Mixed with a magnetic stirrer. Initial antisolvent solution: 100.00 Vol%. (e) Mixed with a magnetic stirrer. Initial antisolvent solution: 70.00 Vol%. (f) Mixed by rotation. Initial antisolvent solution: 100.00 Vol%. Unable to focus on all polymorphs simultaneously, the picture depicted here was carefully chosen with Ys in focus and ONs and YNs observed in the background.
![Crystals 12 00577 g007]()
Figure 8.
Confinement has minimal effect on ROY polymorphism. Obtained microscopic images of samples with concentrations and solvent to antisolvent ratios mentioned above the respective images. The upper part represents experiments performed in bulk. The bottom parts represent experiments in capillaries with an i.d. of 200 µm.
Figure 9.
The frequency of the piezo element was tuned to the depth of the microfluidic channel to obtain stable vortices.
Figure 9.
The frequency of the piezo element was tuned to the depth of the microfluidic channel to obtain stable vortices.
Figure 10.
Acoustic mixing efficiency. Top: in the absence of acoustic mixing, mixing occurs through diffusion and lasts about 60 s. Bottom: when a 1 Vpp voltage is applied to the piezo electric element, vortices appear in the microchannel, and complete mixing is achieved within about 2 s.
Figure 10.
Acoustic mixing efficiency. Top: in the absence of acoustic mixing, mixing occurs through diffusion and lasts about 60 s. Bottom: when a 1 Vpp voltage is applied to the piezo electric element, vortices appear in the microchannel, and complete mixing is achieved within about 2 s.
Figure 11.
The supersaturation protocol influences ROY polymorphism in a microfluidic environment. Unable to focus on all polymorphs simultaneously, the pictures depicted here were carefully chosen with Ys in focus and the other polymorphs observed in the background. (a,d) Two supersaturation protocols were tested by varying the concentrations of the infused solutions. Influence of mixing rate was investigated by comparing diffusive mixing and acoustic mixing. (b) Larger initial concentration gradients and diffusive mixing consistently resulted in orange needles (ONs) and yellow needles (YNs). (c) Larger initial concentration gradients and acoustic mixing consistently resulted in orange plates (OPs) and yellow prisms (Ys). (e,f) Smaller concentration gradients and diffusive mixing produced different results: in 7 samples out of 10, orange plates (OPs) and yellow prims (Ys) were obtained. In 3 samples, yellow needles (YNs) were also observed. (g) Smaller initial concentration gradients and acoustic mixing consistently resulted in orange plates (OPs) and yellow prisms (Ys).
![Crystals 12 00577 g011]()
| Publisher’s Note: MDPI stays neutral with regard to jurisdictional claims in published maps and institutional affiliations. |
© 2022 by the authors. Licensee MDPI, Basel, Switzerland. This article is an open access article distributed under the terms and conditions of the Creative Commons Attribution (CC BY) license (https://creativecommons.org/licenses/by/4.0/).


 ,
, 


