Article

Oxidation and Microstructural Behaviors at 1200 °C of 32.5 wt.% Cr–Containing Co–Based Alloys Strengthened by HfC Carbides

Department of Chemistry and Physics of Solids and Surfaces, Centre National de la Recherche Scientifique, Institut Jean Lamour, Université de Lorraine, Campus ARTEM, 54000 Nancy, France
Crystals 2022, 12(3), 361; https://doi.org/10.3390/cryst12030361
Submission received: 26 January 2022 / Revised: 28 February 2022 / Accepted: 4 March 2022 / Published: 8 March 2022

Abstract

:
Two alloys based on cobalt, designed to be reinforced by HfC and containing chromium with content beyond 30 wt.%, were produced by casting. They were subjected to a 46 h–long isothermal exposure at 1200 °C in synthetic air with thermogravimetric monitoring of the oxidation progress. In the as–cast state, the two alloys contain high quantities of script–like shaped HfC carbides. Both of them demonstrated a much better behavior than previous similar alloys containing only 25 wt.% Cr. After 46 h at 1200 °C, the morphology of the carbides had almost not evolved. The control of the creep behavior at 1200 °C showed that these oxidation–resistant alloys are, additionally, as creep–resistant as the 25 wt.% Cr containing previous alloys.

1. Introduction

Aeronautic engines and power–production plants exploiting gas turbines are more and more demanding in terms of working temperatures level [1]. The higher the temperature of the gas mixtures produced in the combustion chambers, the higher the resulting energy efficiency. There is, thus, a need for metallic materials able to be used at elevated temperatures, offering high refractoriness but with the density staying admissible. Good mechanical properties are also demanded, together with the oxidation resistance staying acceptable. The cast superalloys which are still the best ones currently—the γ/γ’ nickel–based single crystals [2]—unfortunately lose their remarkable reinforcing particles as soon as temperatures increase beyond 1100 °C. Numerous new metallurgical solutions are being explored to take over from nickel–based single–crystalline alloys, for working temperatures higher than 1100 °C. Among them, one can find polycrystalline cobalt–based experimental superalloys using hafnium, not only for improving the high temperature oxidation behavior [3] but for generating primary HfC expected to be efficient for a long time.
Hafnium has been known for several decades as an important element for superalloys [4], even if it is not frequently met in their chemical compositions. Its recognized beneficial effects are related to the resistance against oxidation at high temperature of alloys of various families: NiAl or NiAlPt alloys [5,6], NbAlV alloys [7], NbSiCr alloys [8] and high entropy alloys [9,10,11]. However, hafnium is also a strong MC–forming element (MC: monocarbide), leading notably to carbides which show remarkable stability at elevated temperatures in cobalt–based model alloys [12].
The use of HfC carbides in refractory metallic alloys, or refractory materials in general, is not really novel. This type of MC carbide was earlier present in the microstructures of tungsten–based alloys [13], in ceramics [14], or in refractory composites [15]. HfC carbides with partial substitutions of Hf by Ta, can be also encountered in ceramic coatings [16], and even in structural ceramics [17], again for applications at high temperatures.
In an earlier work, cobalt–based alloys containing 25 wt.% Cr and HfC carbides were cast and tested at 1200 °C for exploring their resistance to creep deformation during 100 h, and to oxidation in the air during 50 h [18,19]. They demonstrated very interesting behavior during flexural creep bending tests at 1200 °C in an inert atmosphere. Unfortunately, the behavior in oxidation in air at this same temperature was worrying, suggesting that catastrophic oxidation will occur soon. The remarkable creep resistance was supposed to be significantly threatened by oxidation.
The 25 wt.% Cr contained by these first alloys was possibly a little too low. In this work, it was envisaged to increase the chromium content up to a little more than 30 wt.% Cr to favor better oxidation behavior at 1200 °C. New cobalt–based alloys were thus elaborated, with the same C and Hf contents as the preceding alloys, but with more chromium (7.5 wt.% Cr more). They were tested in oxidation at 1200 °C for 50 h in order to explore their oxidation behavior, which was expected to be better than previous alloys.
It is hoped to have at the end, superalloys available for service at temperatures beyond 1100 °C, thanks to their moderate density compared to many refractory alloys (cobalt–based), to their ease of elaboration and shaping (polycrystalline and equi–axed), to their mechanical resistance against creep (cobalt–based, HfC–strengthened) and to their resistance to both oxidation and corrosion (efficiently protected by chromia). Such alloys combining all those properties and being usable at elevated temperatures are rare, perhaps non–existent.

2. Materials and Methods

2.1. Design of the Alloys

Two alloys were synthesized for this work. They are inspired by two of the cobalt alloys rich in Hf previously elaborated and studied by us [18,19]: Co-25Cr-0.25C-3.72Hf (wt.%) and Co (bal.)-25Cr-0.50C-7.44Hf (wt.%). These alloys were initially defined to respect the molar equivalence between C and Hf to favor the formation of HfC exclusively. This was successful since no chromium carbides appeared, neither after solidification and cooling nor during new exposures to high temperatures. Adding 7.5 wt.% Cr to these bases was motived by the willingness to give the best possible chances to the alloys to benefit from a chromia–forming behavior (by choosing a Cr content beyond 30 wt.%) without risking a loss in toughness in case of sigma phase precipitation (by remaining below 35 wt.%). The chosen increase in chromium content led to the following chemical compositions:
Co (bal.)-32.5Cr-0.25C-3.72Hf (wt.%)
Co (bal.)-32.5Cr-0.50C-7.44Hf (wt.%)

2.2. Syntheses of the Alloys

The two alloys were obtained by the melting of pure Co, Cr, C and Hf (metallic flakes and graphite rod bought by Alfa Aesar, purity > 99.9%). The fusion of the mixtures of pure elements and the solidification of the resulting alloys were achieved in a 50 kW induction furnace (CELES, Lautenbach, France), in an atmosphere consisting of 300 mbar of pure argon, prepared in the fusion chamber isolated from laboratory air by a silica tube. The maximal input voltage was 5 kV and the frequency was about 100–110 kHz. Two compact ingots, with an ovoid geometry (average diameter of about 20 mm) and a mass of about 40 g each, were obtained. They were cut into several parts using a metallographic saw.

2.3. Chemical and Metallographic Control of the Obtained Alloys

After cutting of the ingots, parts were embedded in resin, ground (using SiC papers from 240 to 1200–grit) then carefully washed (to remove all the abrasive particles coming from the SiC papers). Final polishing was carried out using a textile disk enriched with 3 µm hard particles). This led to metallographic samples with a mirror–like state.
The microstructures were observed using a Scanning Electron Microscope (SEM) JEOL JSM 6010LA (Tokyo, Japan) in the Back Scattered Electrons mode (BSE). The chemical compositions were controlled by Energy Dispersion Spectrometry (EDS) (Tokyo, Japan) using the EDS device attached to the SEM. Full frame analyses were performed on three {×250}–zones randomly chosen in the samples. Spot EDS analyses were performed in the matrix (on three locations randomly chosen in dendrites cores, when magnification was ×250) and carbide phase present in the microstructures (in the coarsest carbides present, when magnification was ×1000). All BSE observations and imaging as well as all EDS analyses were obtained with an acceleration voltage rated at 20 kV and for a working distance of 10 mm.

2.4. Thermogravimetric Oxidation Tests

A parallelepiped was cut in each of the two ingots, to be used as a sample for the oxidation tests. The dimensions of these samples were approximately 3 mm × 3 mm × 10 mm. Their six faces were ground using 1200–grit SiC papers. Their twelve edges and their eight corners were smoothed using the same papers. Each sample was placed in a thermobalance (model TGA92, SETARAM, Caluire, France), suspended in the future hot zone of the furnace part of the thermobalance. Here the sample was exposed to a continuous 1.5 L h−1 flow of dry synthetic air (80%N2–20%O2) during the total thermal cycle. Heating up to 1200 °C was performed at +20 °C min−1. After a {50 h}–long isothermal stage at 1200 °C, a cooling performed at −5 °C min−1 allowed the return to ambient temperature. This test was applied for one sample by alloy.

2.5. Exploitation of the Mass Gain Files

The isothermal mass gain curves were plotted either versus time (isothermal part), or versus temperature (the whole cycle). Concerning the isothermal part (mass gain plotted versus time), it was first seen whether the kinetic seemed linear (fast oxidation without limitation by the external oxides formed), or whether it seemed parabolic (slowing oxidation due to limitation by a covering oxide scale). In the first case, a global linear constant can be generally estimated. In the second case—kinetics obeying Wagner’s law—the parabolic constant, but also a chromia volatilization constant, can be specified, according to procedures described in earlier work [20]. Indeed, because of the high level of the test temperature, a part of the formed chromia (Cr2O3) is suspected to be lost by re–oxidation into gaseous CrO3. This phenomenon starts to be significant at 1000 °C and intensifies with temperature. Its consequences on the mass gain rate and on the chromium consumption must be taken into account.
Plotting mass gain versus temperature allows studying the possible oxide spallation during the cooling. The mass gain files were corrected from the mass variations artificially caused by the varying air buoyancy. This was performed using a method earlier described [21], prior to plotting the mass variation versus temperature.

2.6. Post–Mortem Characterization

The oxidized samples were carefully taken from the thermo–balance and thereafter handled to be subjected to X-ray diffraction (Philips X’Pert Pro, radiation: Cu Kα), prior to cross–section preparation. The two oxidized samples were covered by a thin gold layer which was deposited by cathodic pulverization (JEOL, Tokyo, Japan), for giving electrical conductivity to the oxidized surfaces. The samples were thus, covered all around with electrolytic nickel, in a Watt’s bath heated at 50 °C (1.6 A/dm2 applied for 2 h). Protected by this nickel shell, the samples were divided into two parts, using the Buehler metallographic saw. They were embedded in resin (ESCIL resin and hardener). The obtained metallographic samples were ground (SiC papers from 240–grit to 1200–grit), washed and polished, as were the samples for the as–cast microstructures observations. The obtained cross–sectional samples were used to observe the external and internal oxides with the SEM in BSE mode. EDS spot analyses were performed to identify the oxides’ natures and to specify their chemical composition in the most external part of the alloys. The bulk microstructures were also observed to analyze the possible consequences of exposure to 1200 °C on the microstructures.

2.7. Creep Resistance Control

Adding 7.5 wt.% Cr is a rather significant change in chemical composition. Thus, this may have consequences on the mechanical behavior of the alloys. A verification test of the creep deformation behavior was carried out on the Co-32.5Cr-0.25C-3.72Hf alloy in the same conditions as the same test previously achieved on a Co-25Cr-0.25C-3.72Hf [18]. A parallelepiped, with the following approximate dimensions 2 mm (width) × 1.5 mm (thickness) × 15 mm (length), was placed on two alumina rods perpendicularly oriented to the sample (distance between the two parallel rods: 12 mm). A load calculated to induce a maximal tensile stress equal to 20 MPa (in the middle of the bottom face of the sample) was progressively applied, and the sample and its environment were heated up to 1200 °C in the furnace of a SETARAM dilatometer modified to allow flexural tests at high temperatures. The test was performed under pure argon flow. Temperature and load (thus the induced 20 MPa stress) were maintained constant during the whole duration of the test (100 h).

3. Results and Discussion

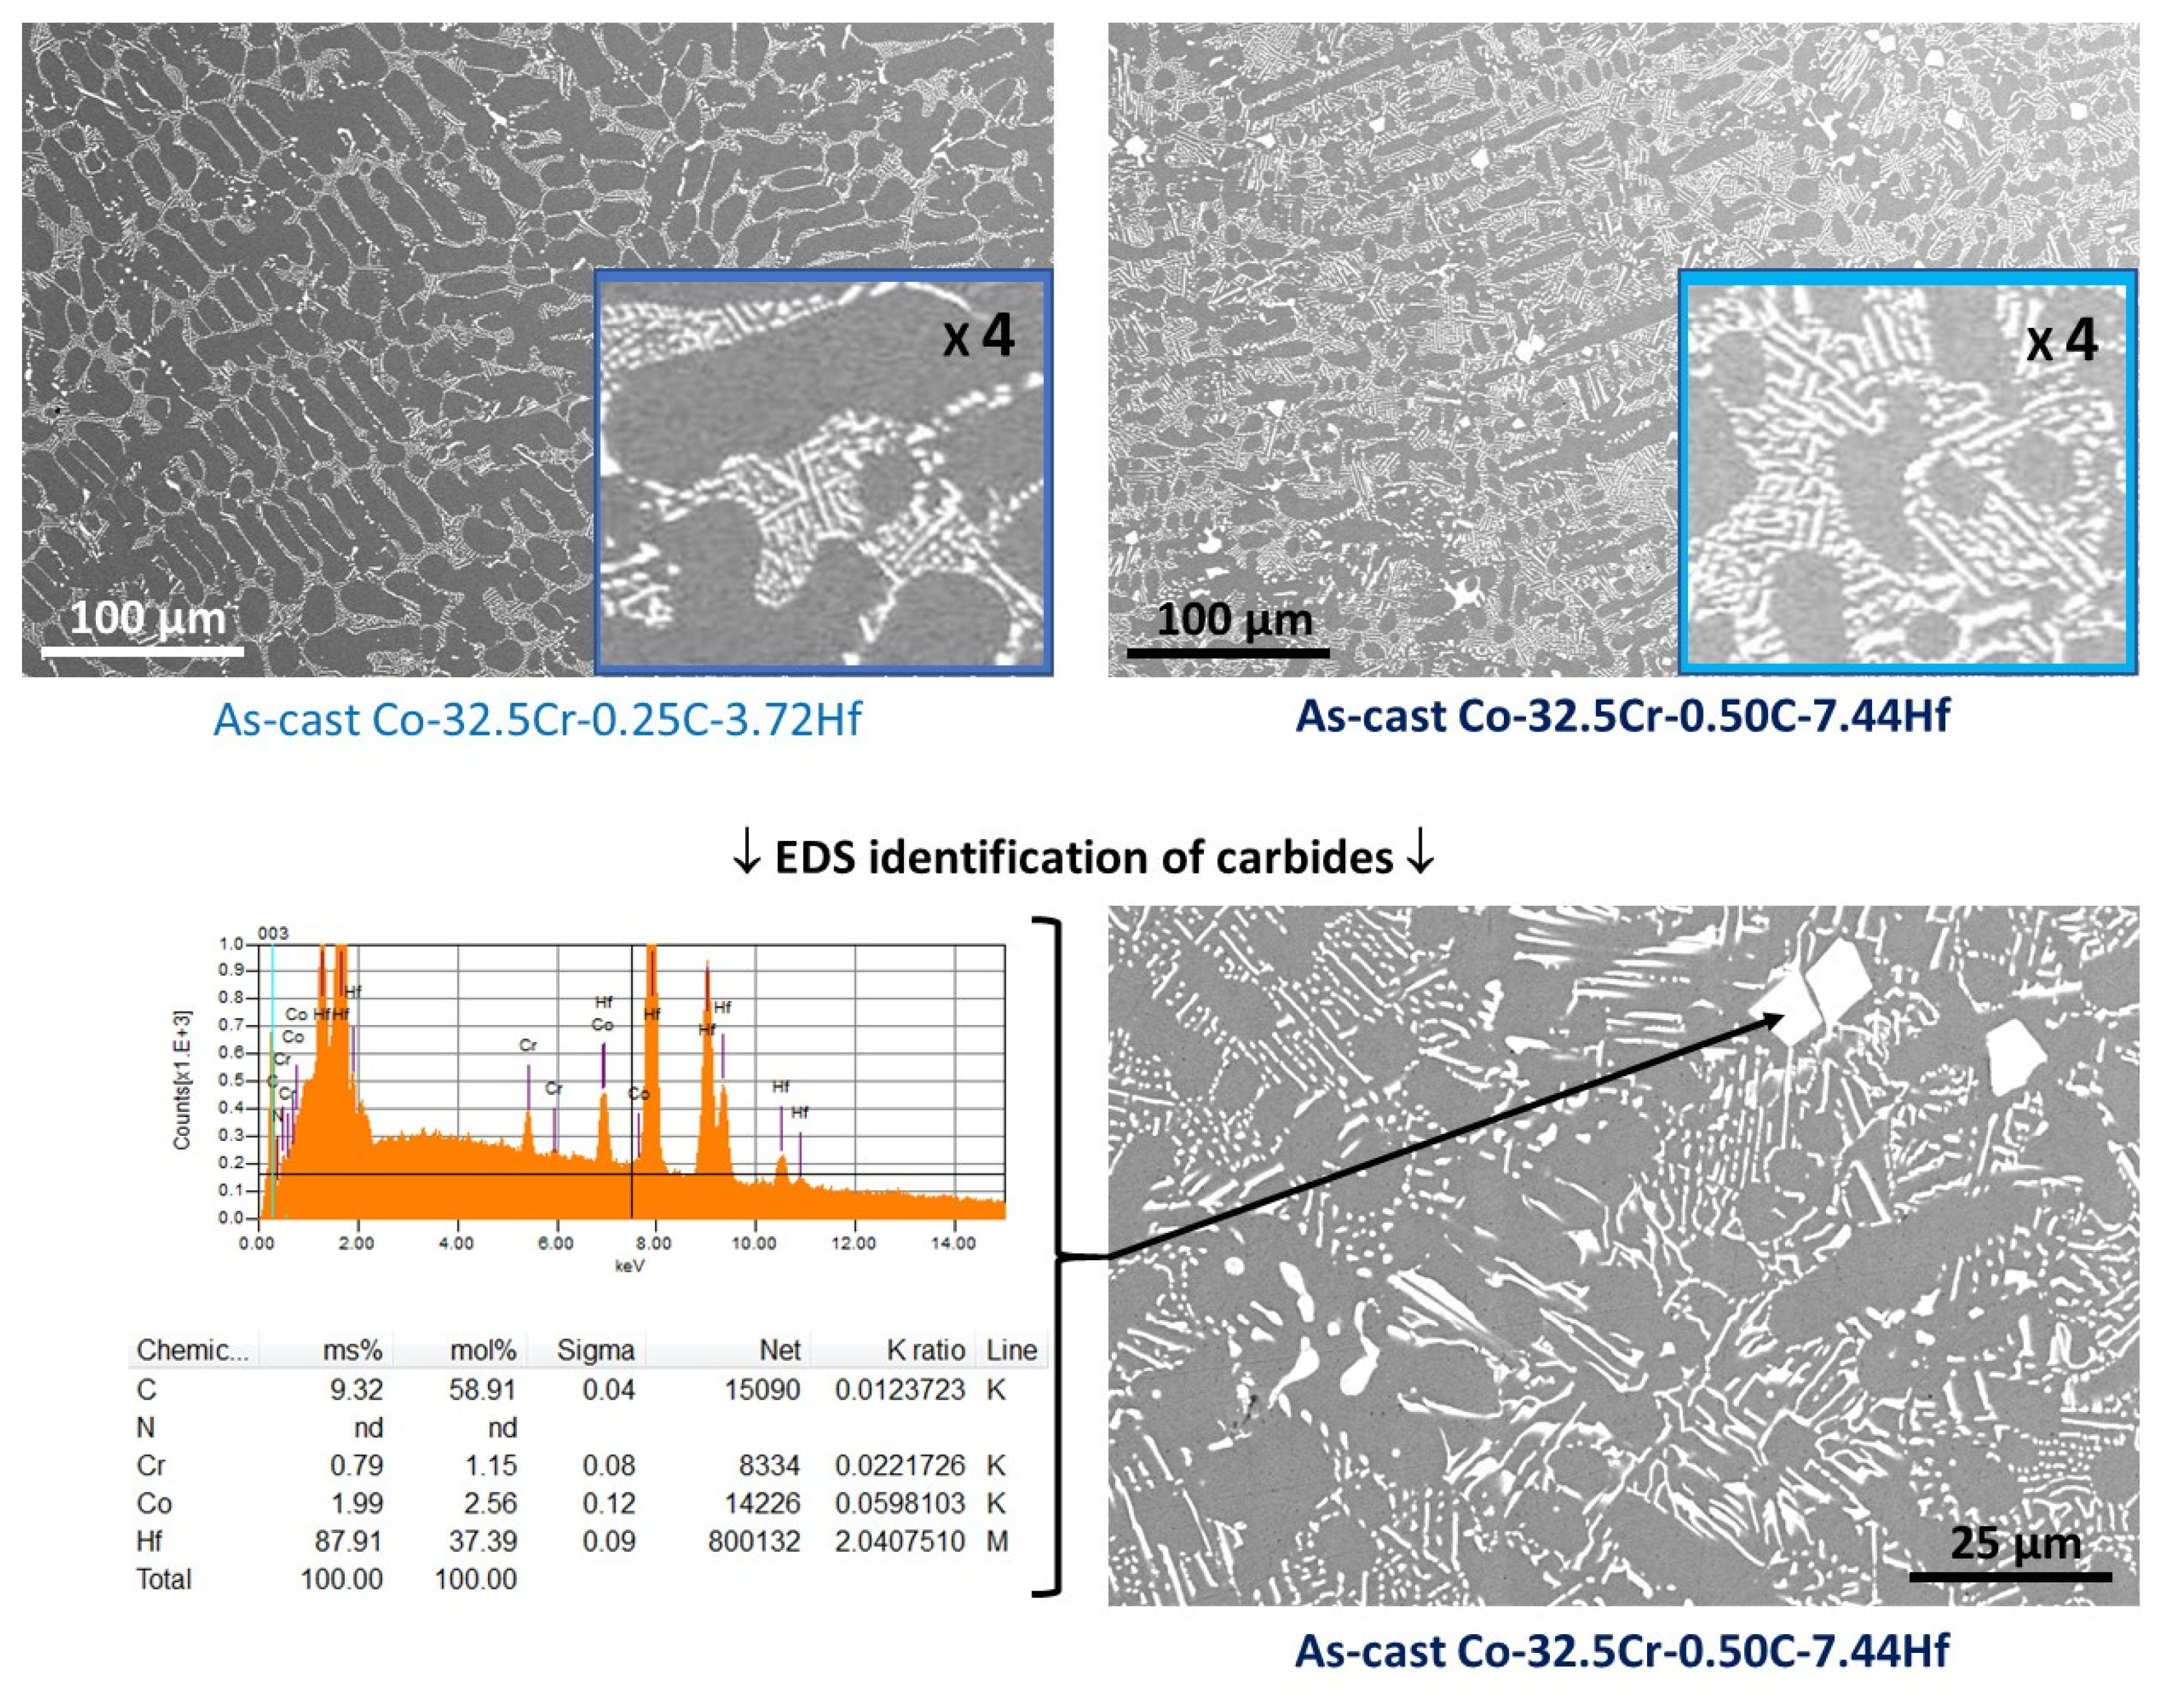
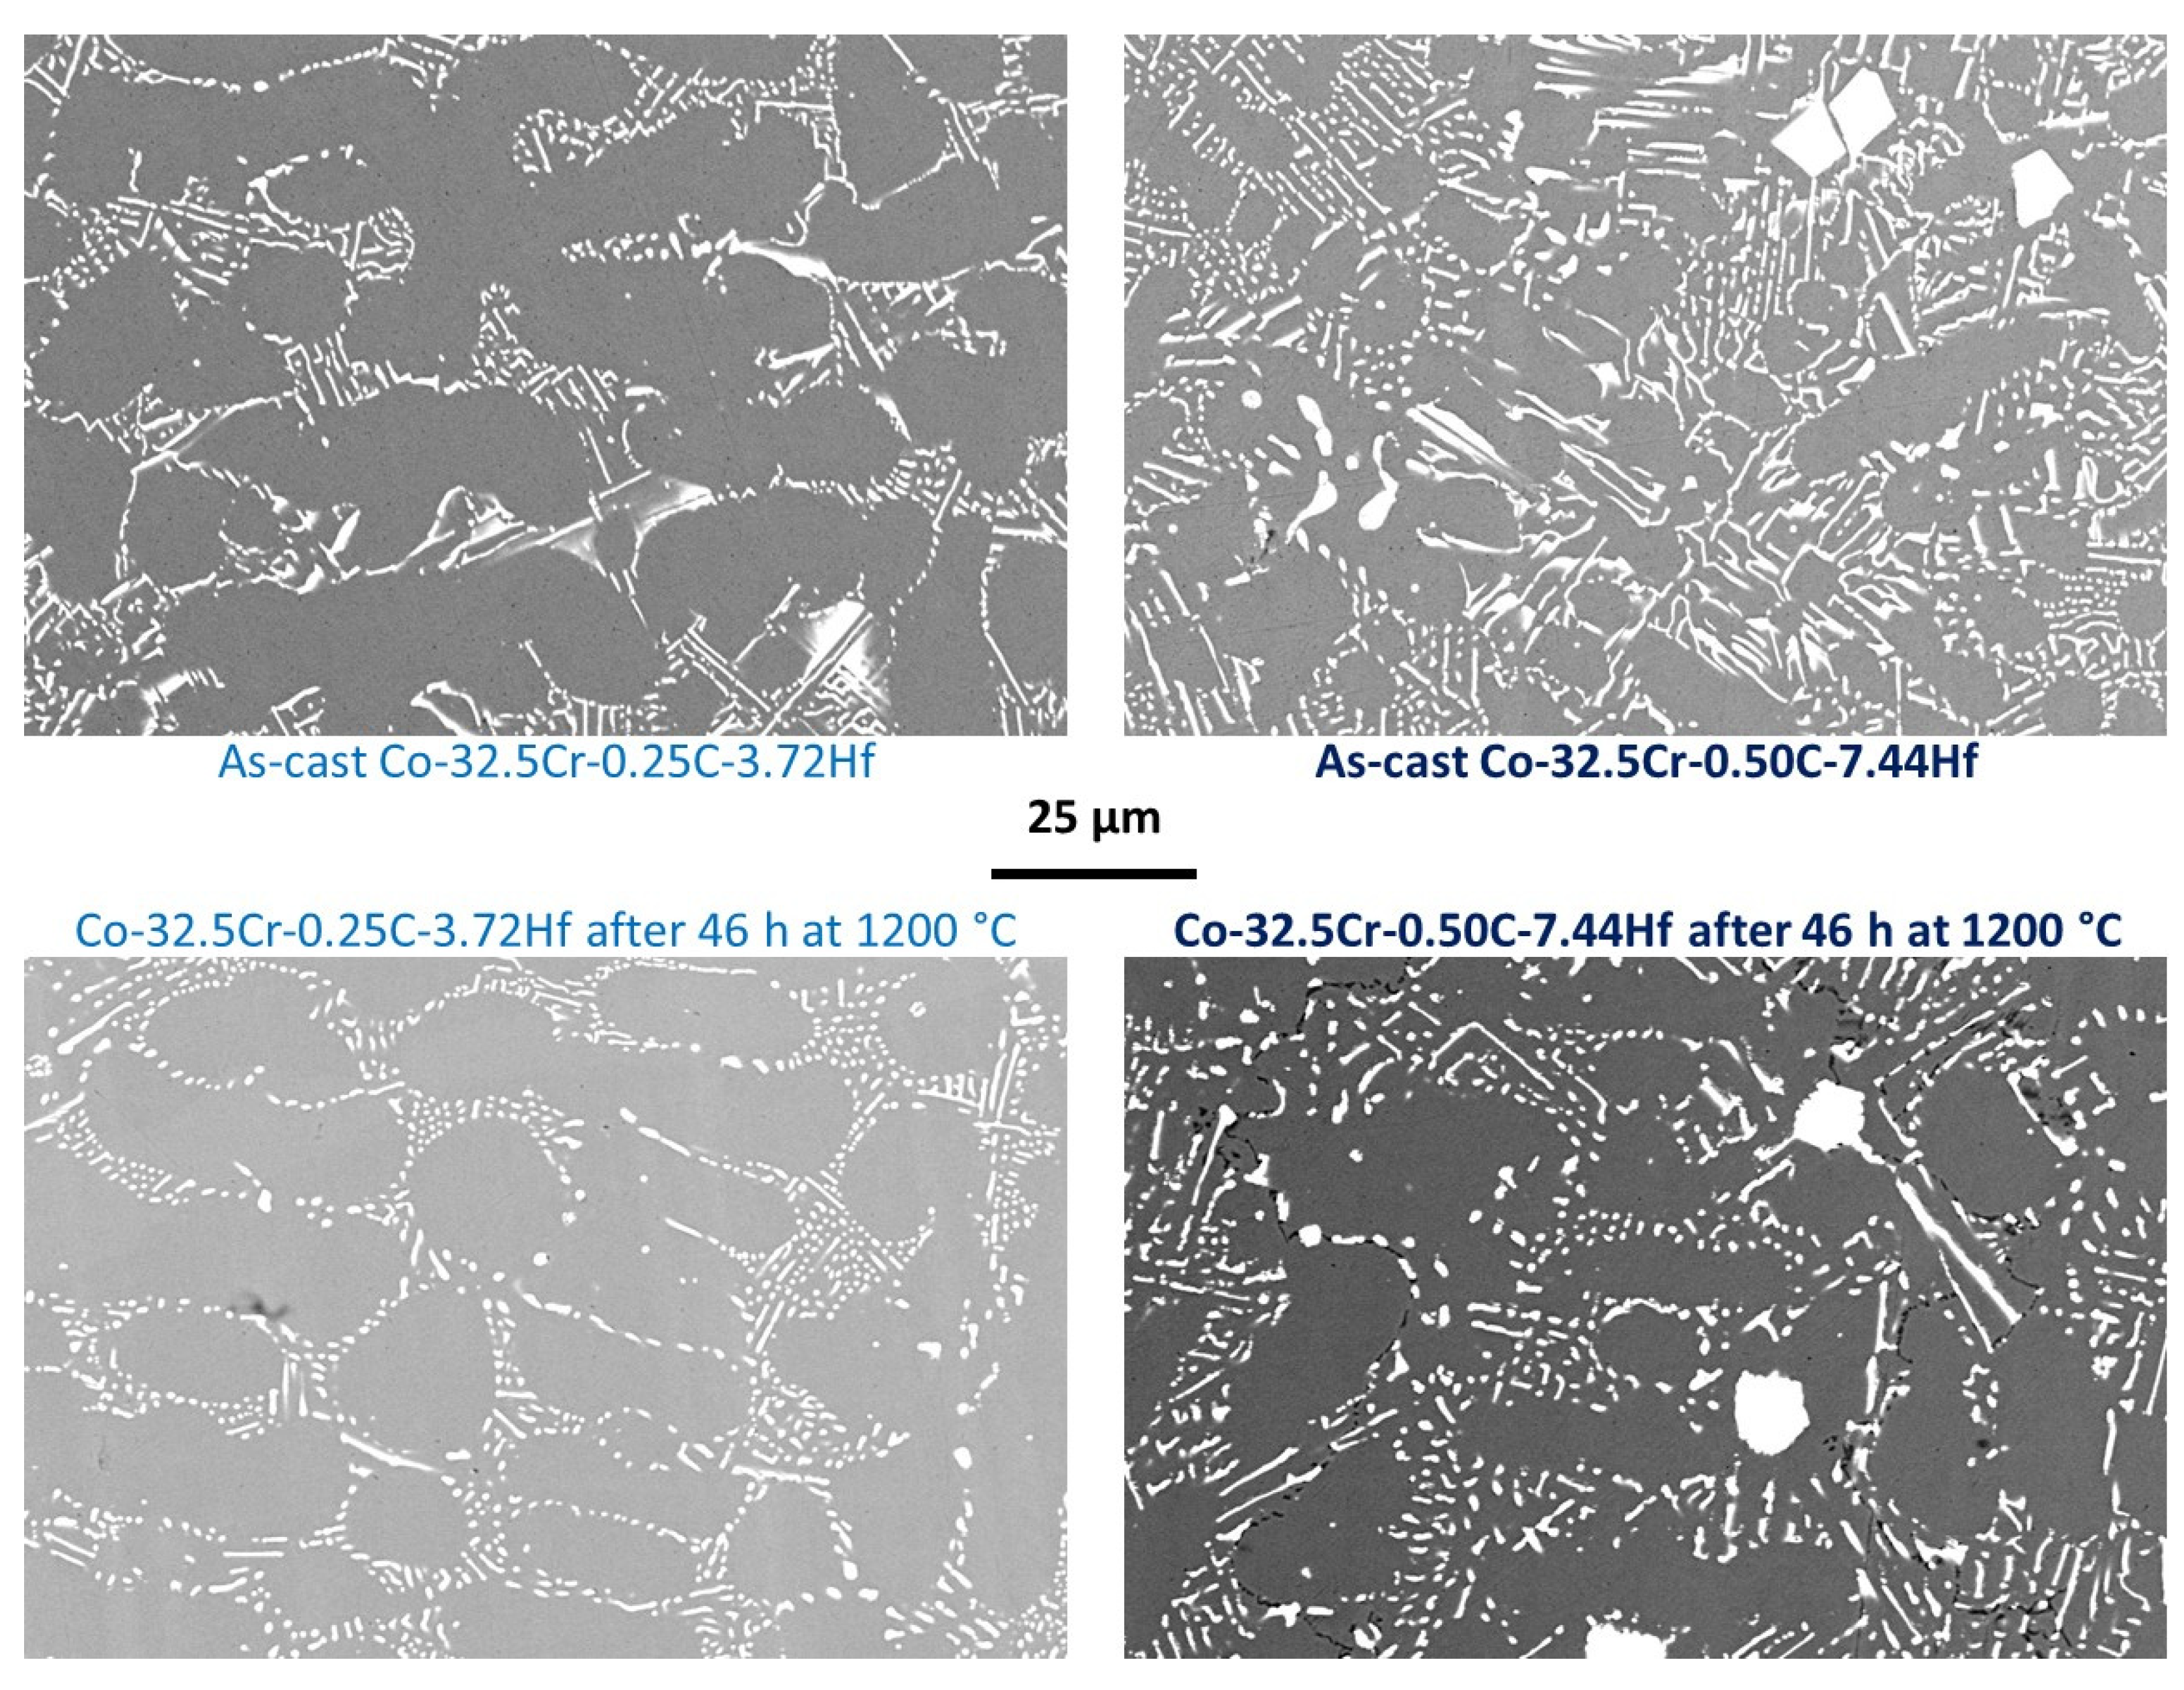
3.1. Microstructures and Chemical Compositions of the Two As–Cast Alloys

The as–cast microstructures of both alloys are illustrated in Figure 1, with a ×250 SEM/BSE micrographs for both of them (general view) and a ×4 enlargement in the bottom right corner of the ×250 images for observing the morphologies of the carbides in better conditions (×1000). The two alloys are obviously only double–phased. They contain first a dendritic matrix with a 25 µm fineness (approximate secondary dendrite arms spacing). The second phase is HfC, as specified by EDS spot analysis on the coarsest carbides found in the microstructures. In the Co-32.5Cr-0.25C-3.72Hf alloy, the HfC carbides are present only as one of the two phases of a eutectic compound located in the interdendritic areas (the second phase in this eutectic is the matrix itself). The morphology of these eutectic HfC carbides is Chinese script. This means that the HfC are locally made of interconnected elongated parts closely mixed with the peripherical parts of the dendrites. This type of morphology results from the re–distribution of the elements between the HfC part and the cobalt solid solution part of the eutectic compound, during their coupled growths). The HfC carbides are present in great quantity, and they form an interdendritic network almost continuously. In the Co-32.5Cr-0.50C-7.44Hf alloy, the eutectic script–like HfC are also present, with a fraction that is higher than in the first alloy, as an interconnected interdendritic carbide network. Other carbides are also present, with a coarse morphology, dispersed in the microstructure as polygonal carbides. Their morphology and distribution in the alloy suggest that these HfC are of a pre–eutectic nature (i.e., the first solid phase to crystallize at the beginning of solidification). Despite the presence of supplementary chromium in a significant quantity (32.5 wt.%, i.e., 30% Cr more by comparison with 25 wt.% Cr), one can remark that no chromium carbides appeared. As for the previous alloys with 25 wt.% Cr [18,19], the Hf atoms still monopolize carbon, for forming exclusively HfC, again. EDS spot analyses performed on the coarsest white carbides (to avoid penetration of the interaction peer in the subjacent matrix) show high concentrations of Hf and C (Figure 1, bottom). The obtained C content is slightly overestimated.
SEM/EDS allowed controlling the chemical composition of the whole alloys (Table 1), except carbon for which this was not possible because of its too low atomic mass and its too low targeted weight content. The obtained contents in hafnium are not lower than introduced in the charges before melting, on the contrary. The obtained Hf contents are a little higher than targeted. This is a classical effect of the involvement of such heavy elements in numerous primary carbides. This is an effect that is also usually encountered with tantalum, for instance. The contents in Cr are well respected. Additionally, three EDS spot analyses were performed in the matrix of each alloy (Table 2). Matrices are rich in chromium (content slightly higher than in the whole alloy) and they contain no hafnium. Hafnium is seemingly totally involved in carbides. This suggests a very high carbide–former behavior of this element.

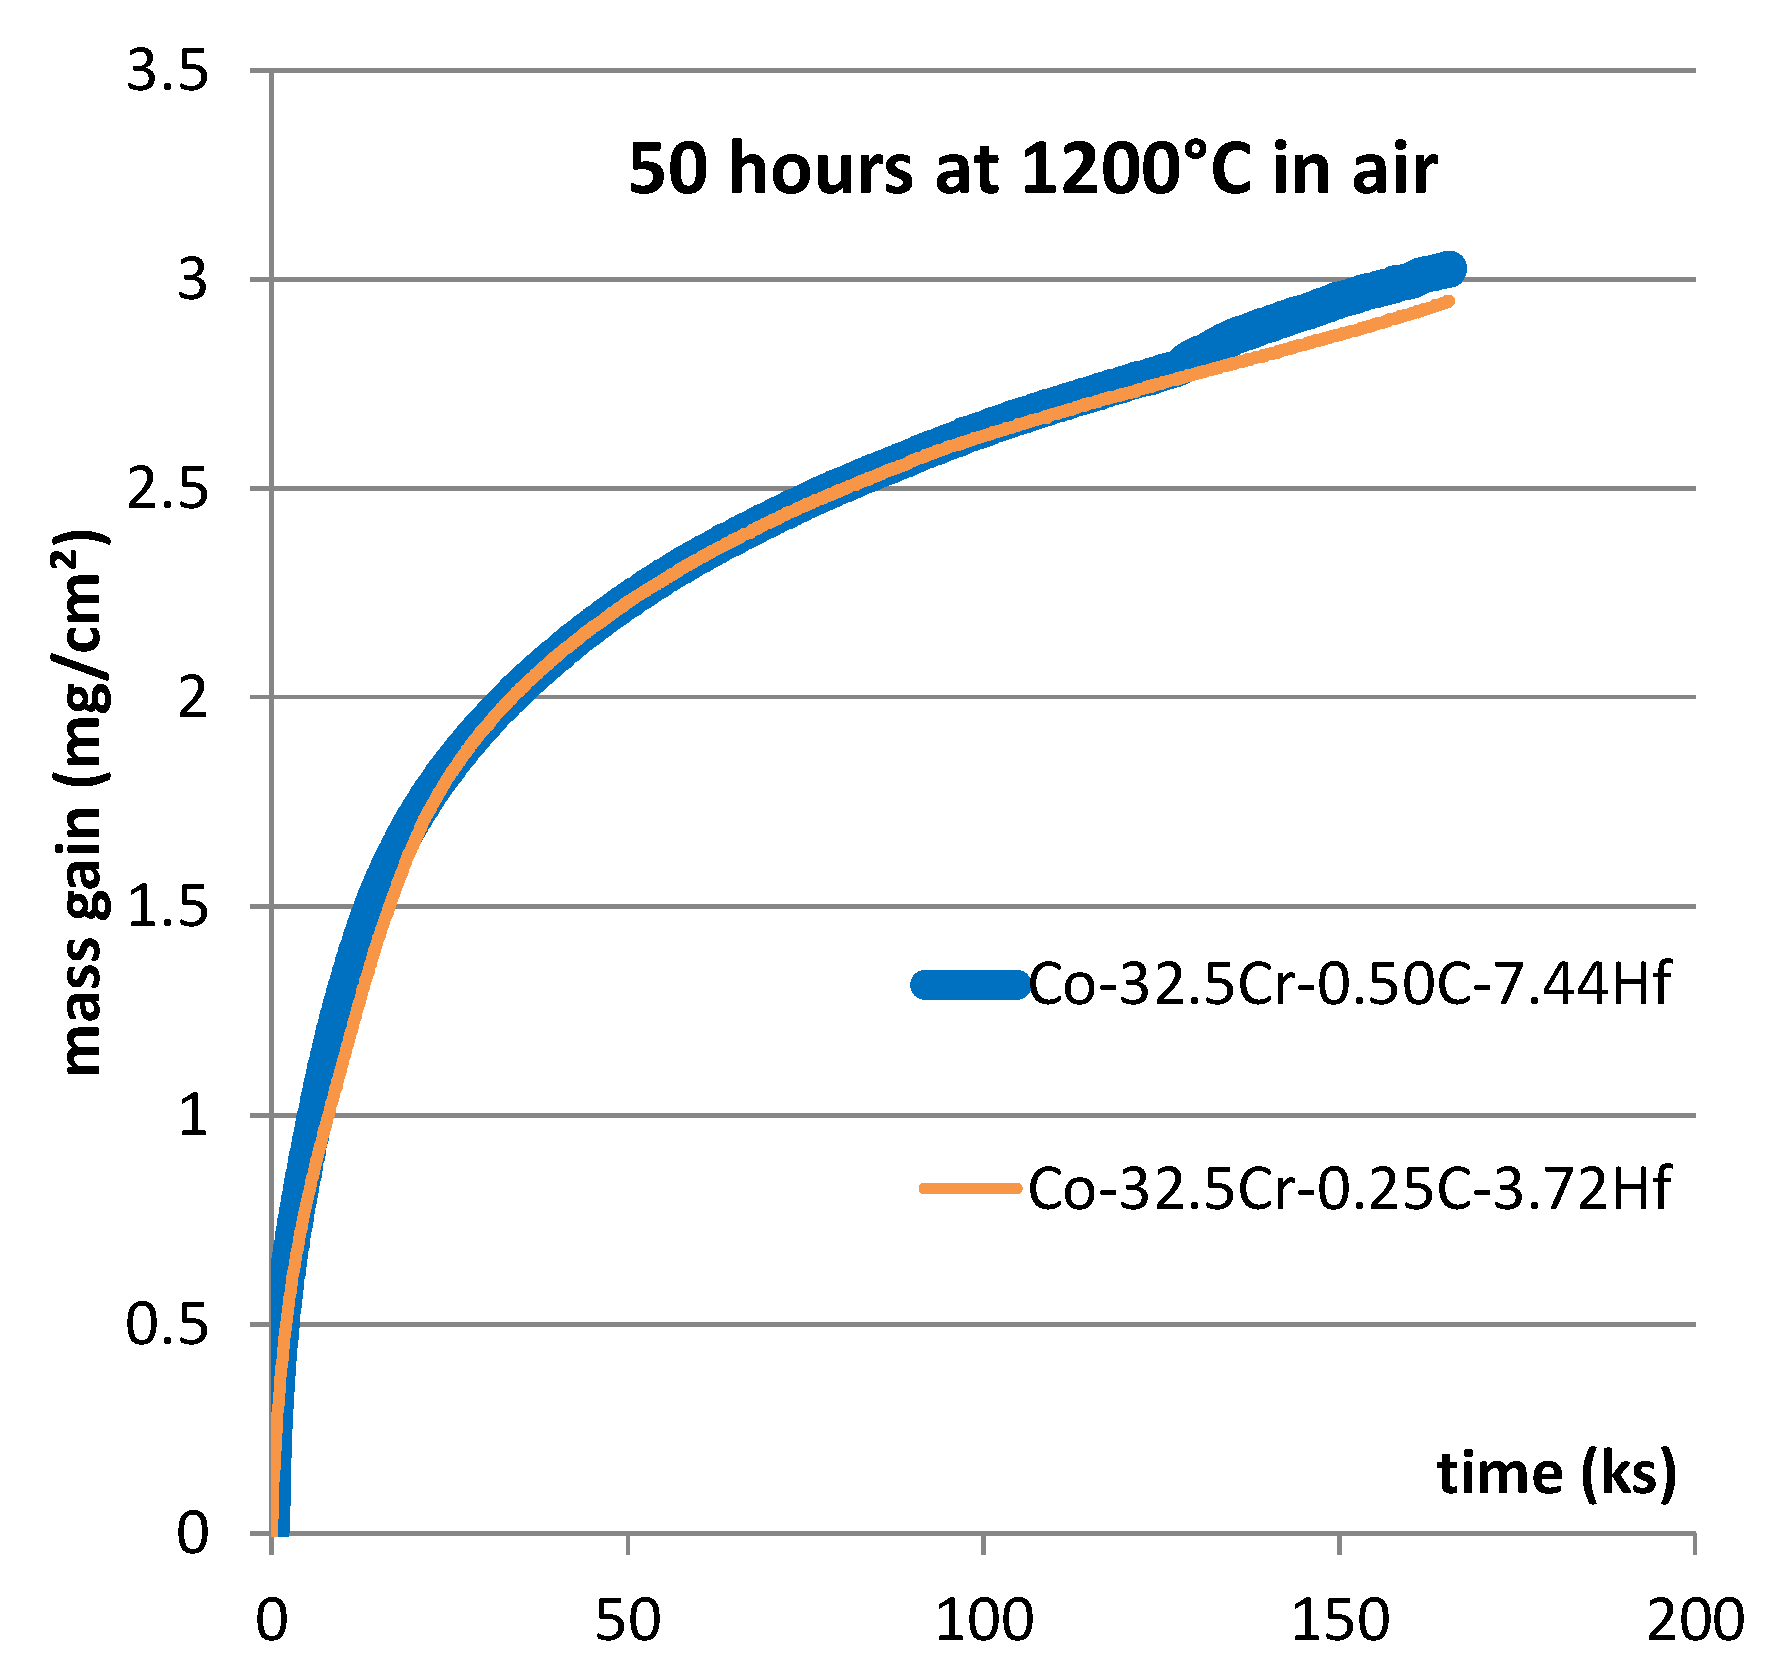
3.2. Isothermal Oxidation

The mass gain curves of the two alloys are plotted together in Figure 2. They are almost identical. Both of them start with a fast mass gain during 20 h approximately, followed by a strong slow down leading to a parabolic regime. Such a parabolic regime suggests that the whole surface of the sample is separated from the air by a continuous oxide scale. The growth of this scale is governed by the diffusion of the species involved in the oxidation process (Wagner’s law). In such a case, the best characteristic allowing to anticipate the oxidation rate for a longer time is the parabolic constant noted “Kp”. In the first time, the mass gain was plotted versus the square root of time to specify the value of Kp for each alloy at 1200 °C. Kp is usually deduced from the slope of the obtained straight line. However, the obtained {mass gain versus the square root of time}–curves are not linear and their slopes decrease with time. Considering on the first hand the high level of chromium content of both alloys, and on the second hand the high level of the test temperature, it appeared clear that chromia covered the samples and that this oxide was subjected to re–oxidation into gaseous CrO3. Consequently, after having estimated the average slope and the value of Kp, both mass gain files were analyzed according to a method described in [20]. By plotting versus the opposite value of the mass gain per surface unit area (noted “m”) the value of m multiplied by its derived value versus time dm/dt, the obtained graph may present a linear part. The equation of this linear part may lead to the value of a reliable Kp constant, as well as to the value of the constant Kv. The obtained value of Kp is reliable since it is not underestimated because of the loss of a part of chromia. The obtained Kv value represents the rate of linear loss of re–oxidized chromia.
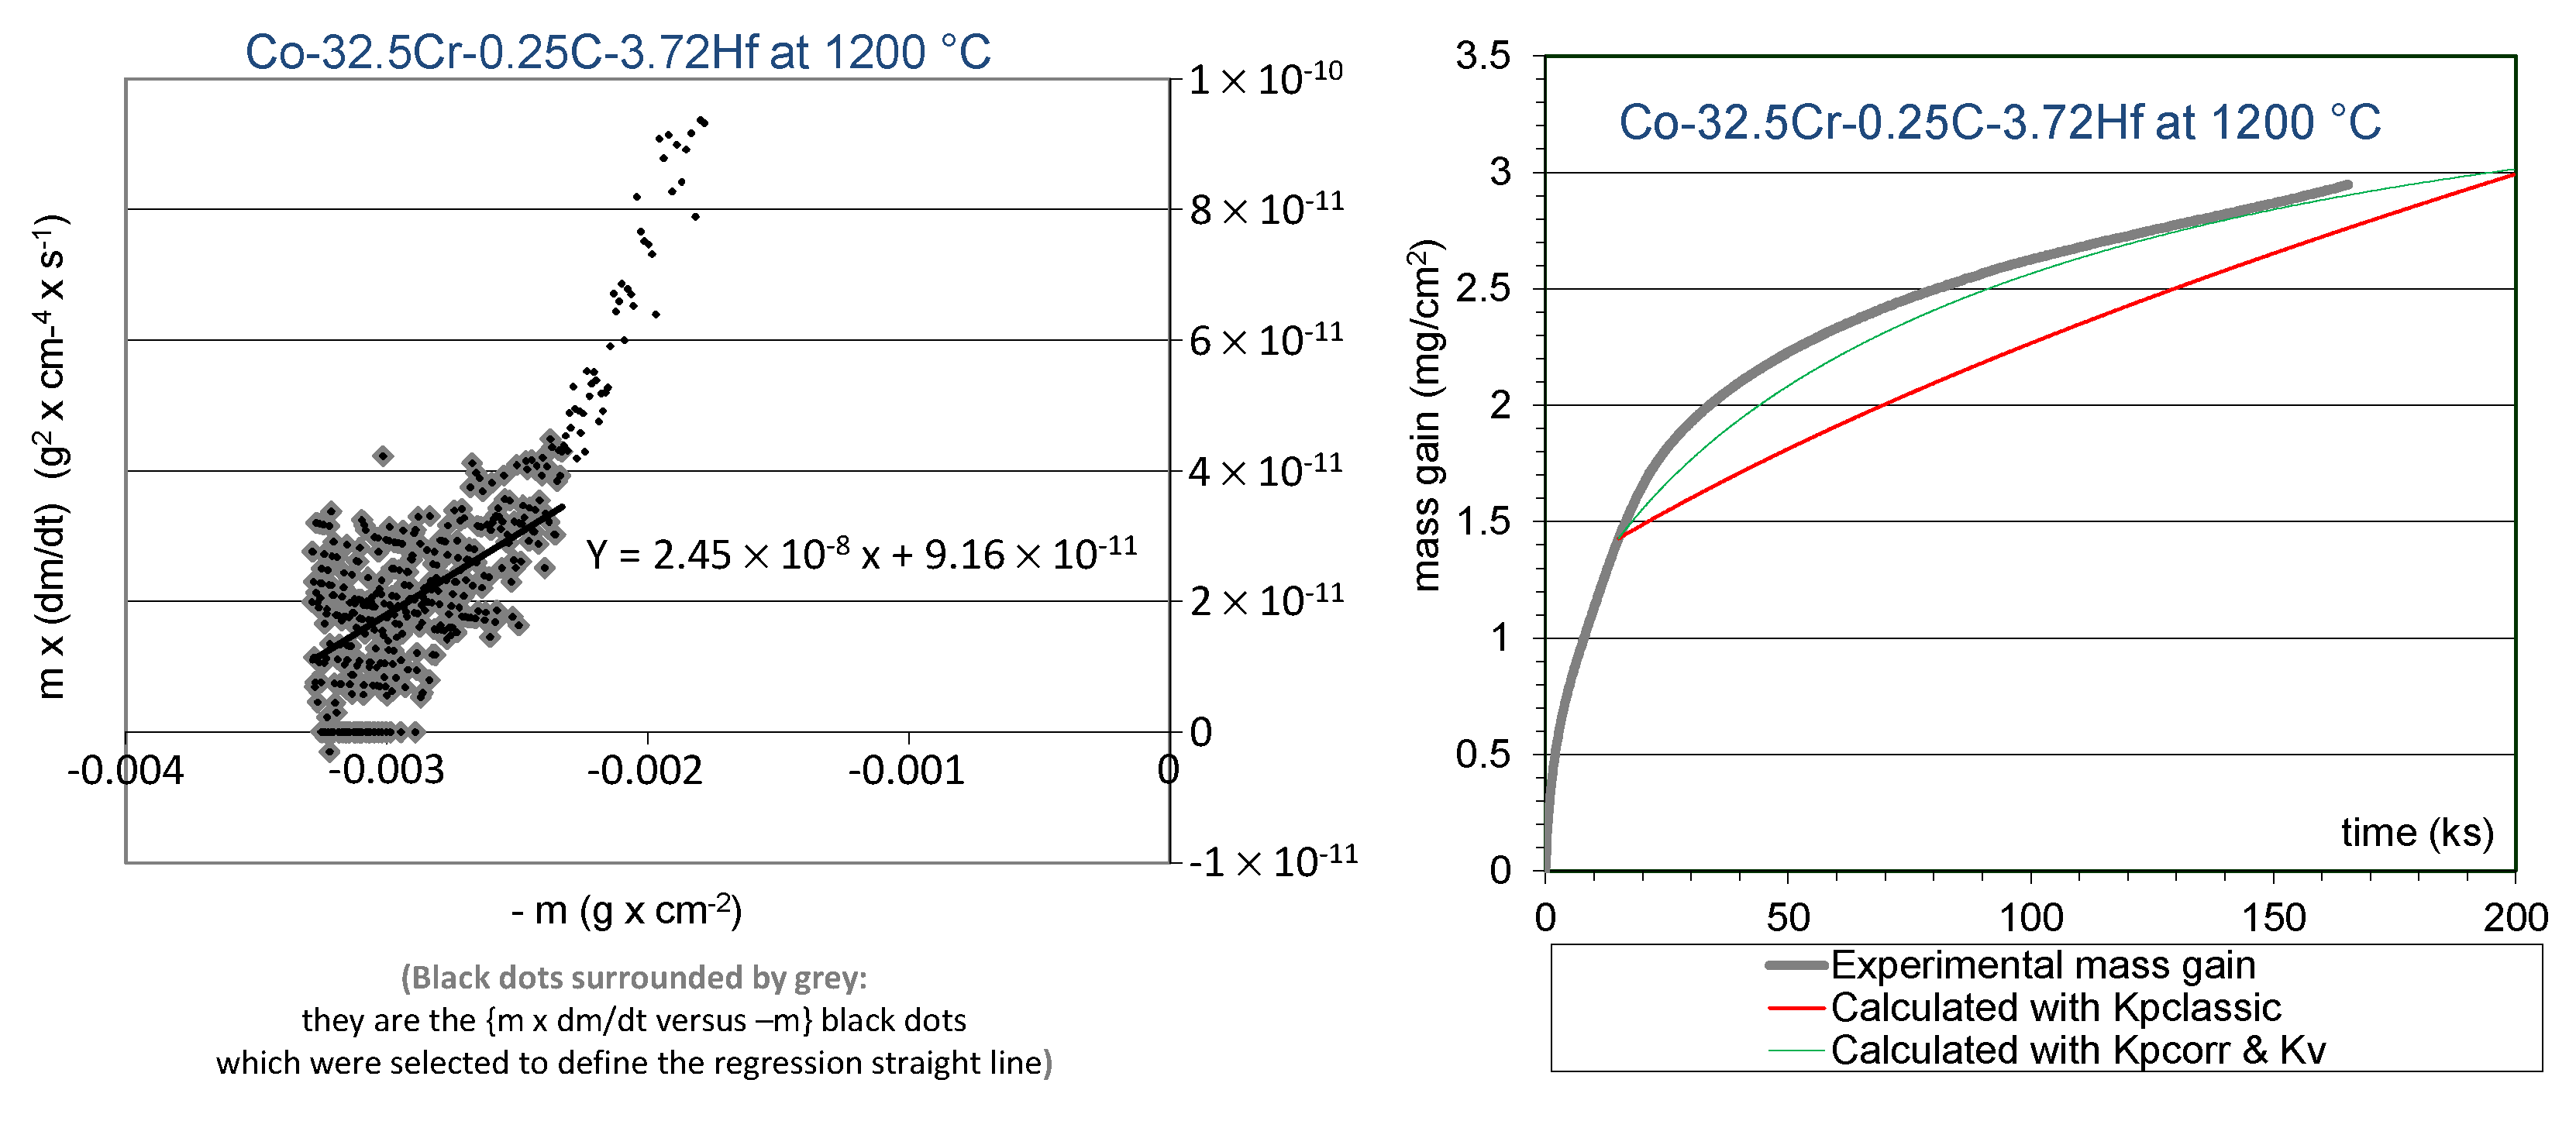
The {m × dm/dt versus -m}–plot led to the graphs showed in the left side of Figure 3 for the Co-32.5Cr-0.25C-3.72Hf alloy and in the left side of 
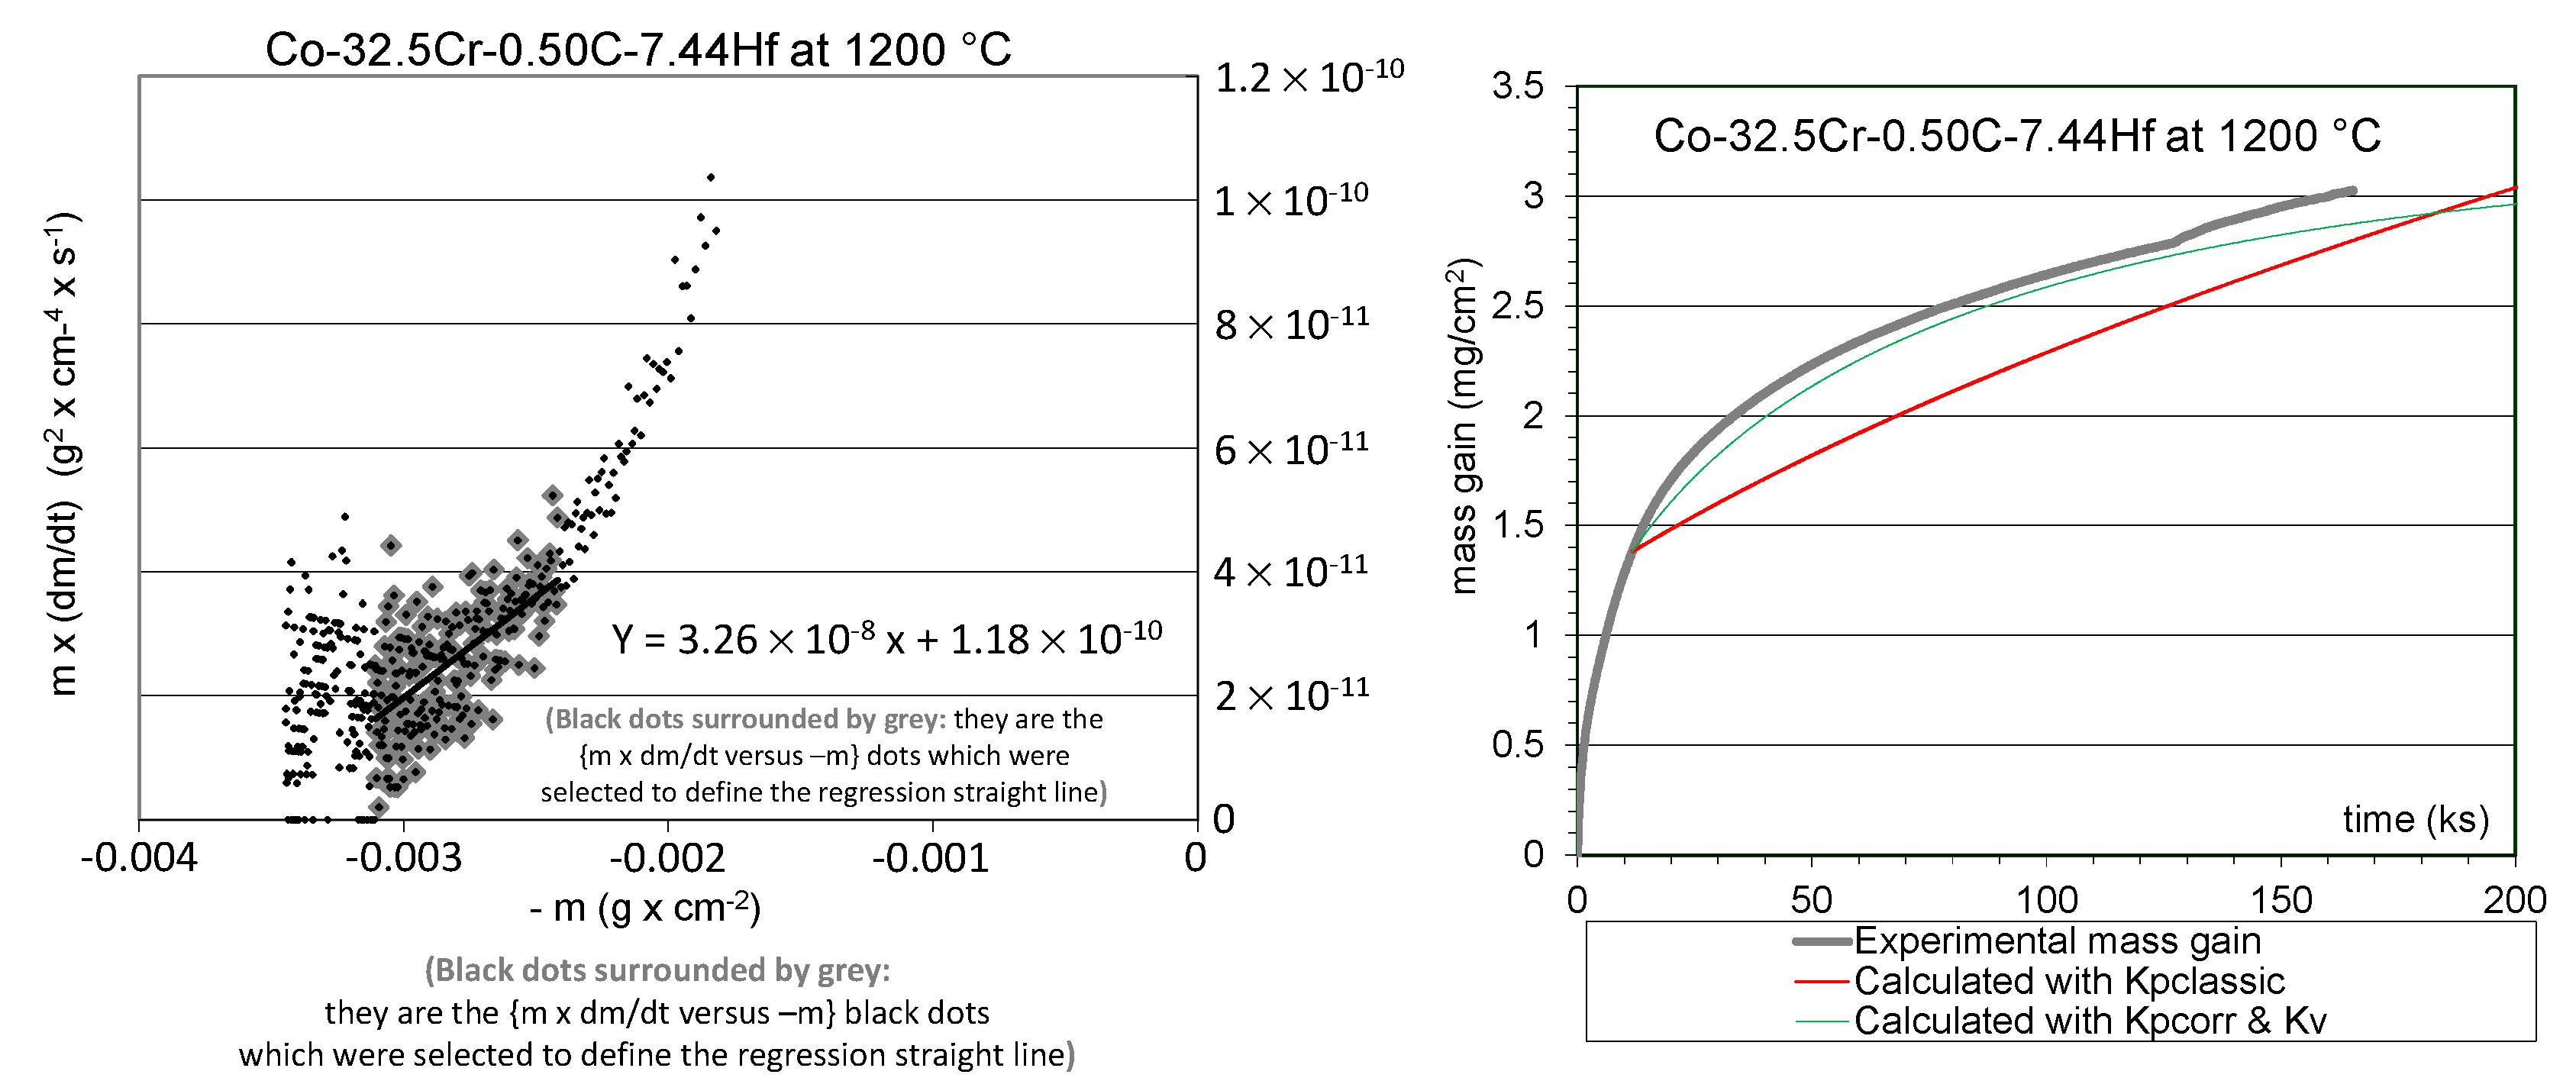
Figure 4 for the Co-32.5Cr-0.50C-7.44Hf alloy.
In both cases, only the points corresponding to the mass gain values beyond the first 20 h were considered. Indeed, this is over the [20 h; 46 h] time range that the chromia scale can be expected to be continuous. For the Co-32.5Cr-0.25C-3.72Hf alloy (Figure 3, left), all points were kept for determining the equation of the regression straight line. For the Co-32.5Cr-0.50C-7.44Hf alloy (Figure 4, left), the last points, recorded during the last ten hours before the isothermal stage’s end (on the left of the graph), were omitted since they correspond to a small jump in mass gain (visible in Figure 2) due to a local detachment of the external scale.
The equations of the regression straight lines are given in Figure 3 (left) and Figure 4 (left). In each of them, the values of the ordinate at the origin are the parabolic constants Kp corrected from chromia volatilization, and the slopes are the volatilization constants Kv.
The values of all the kinetic constants determined by the exploitation of the curves shown in Figure 2 and of the graphs shown in Figure 3 and Figure 4, are gathered in Table 3. Model curves were plotted using these values obtained for the kinetic constants, to be compared to the experimental isothermal mass gain curves (Figure 3, right; Figure 4, right). The obtained values of Kp corr volat and Kv volat obviously represent the real mass gain kinetic much better than the Kp classic values.
In Table 3 the first line contains the values of the linear constants Kl featuring in the {m = Kl × t}–equation of the straight line tangent to the mass gain curves in Figure 2. These linear constants are the instantaneous rates of mass gain existing at the beginning of the isothermal stage. They are also called transient oxidation rates. The linear constant tends to be higher for the Co-32.5Cr-0.50C-7.44Hf alloy than for the other alloy. For each alloy, the Kl value obtained here is similar to the ones obtained for the previous alloys containing only 25 wt.% Cr (42 × 10−5 mg/cm2 for the Co-25Cr-0.25C-3.72Hf alloy and 80 × 10−5 mg/cm2 for the Co-25Cr-0.50C-7.44Hf [19]). This tends to confirm that it is more the HfC carbides density than the chromium content that influences this first kinetic constant.
The second line (Kp classically determined, Kp classic) and the third line (Kp corrected from volatilization of chromia, Kp corr volat) in Table 3 suggest that the Co-32.5Cr-0.50C-7.44Hf tends to oxidize a little faster than the other alloys in this study. However, the differences are not significant. In contrast, there are very great differences between the Kp classic and Kp corr volat values determined here, and the ones previously determined for the corresponding alloys containing only 25 wt.% Cr. For 32.5 wt.% Cr the Kp values are several ten times lower than for the previous alloys containing 7.5 wt.% Cr less (globally 600 to 800 × 10−6 mg cm−4 s−1 for Kp classic, and 1300 to 2500 × 10−6 mg cm−4 s−1 for Kp corr volat [19]).
Differences can be also noted concerning the chromia volatilization constants, but they are much less spectacular. They are here slightly lower than the ones previously determined for the 25 wt.% Cr containing alloys: 250 to 330 × 10−7 mg cm−2 s−1 here, against 470 to 530 × 10−7 mg cm−2 s−1 for the 25wt.% Cr containing alloys [19]. On the mass gain kinetic first, one can conclude that adding 7.5 wt.% Cr more to the earlier alloys considerably enhances their resistance to isothermal oxidation at 1200 °C.

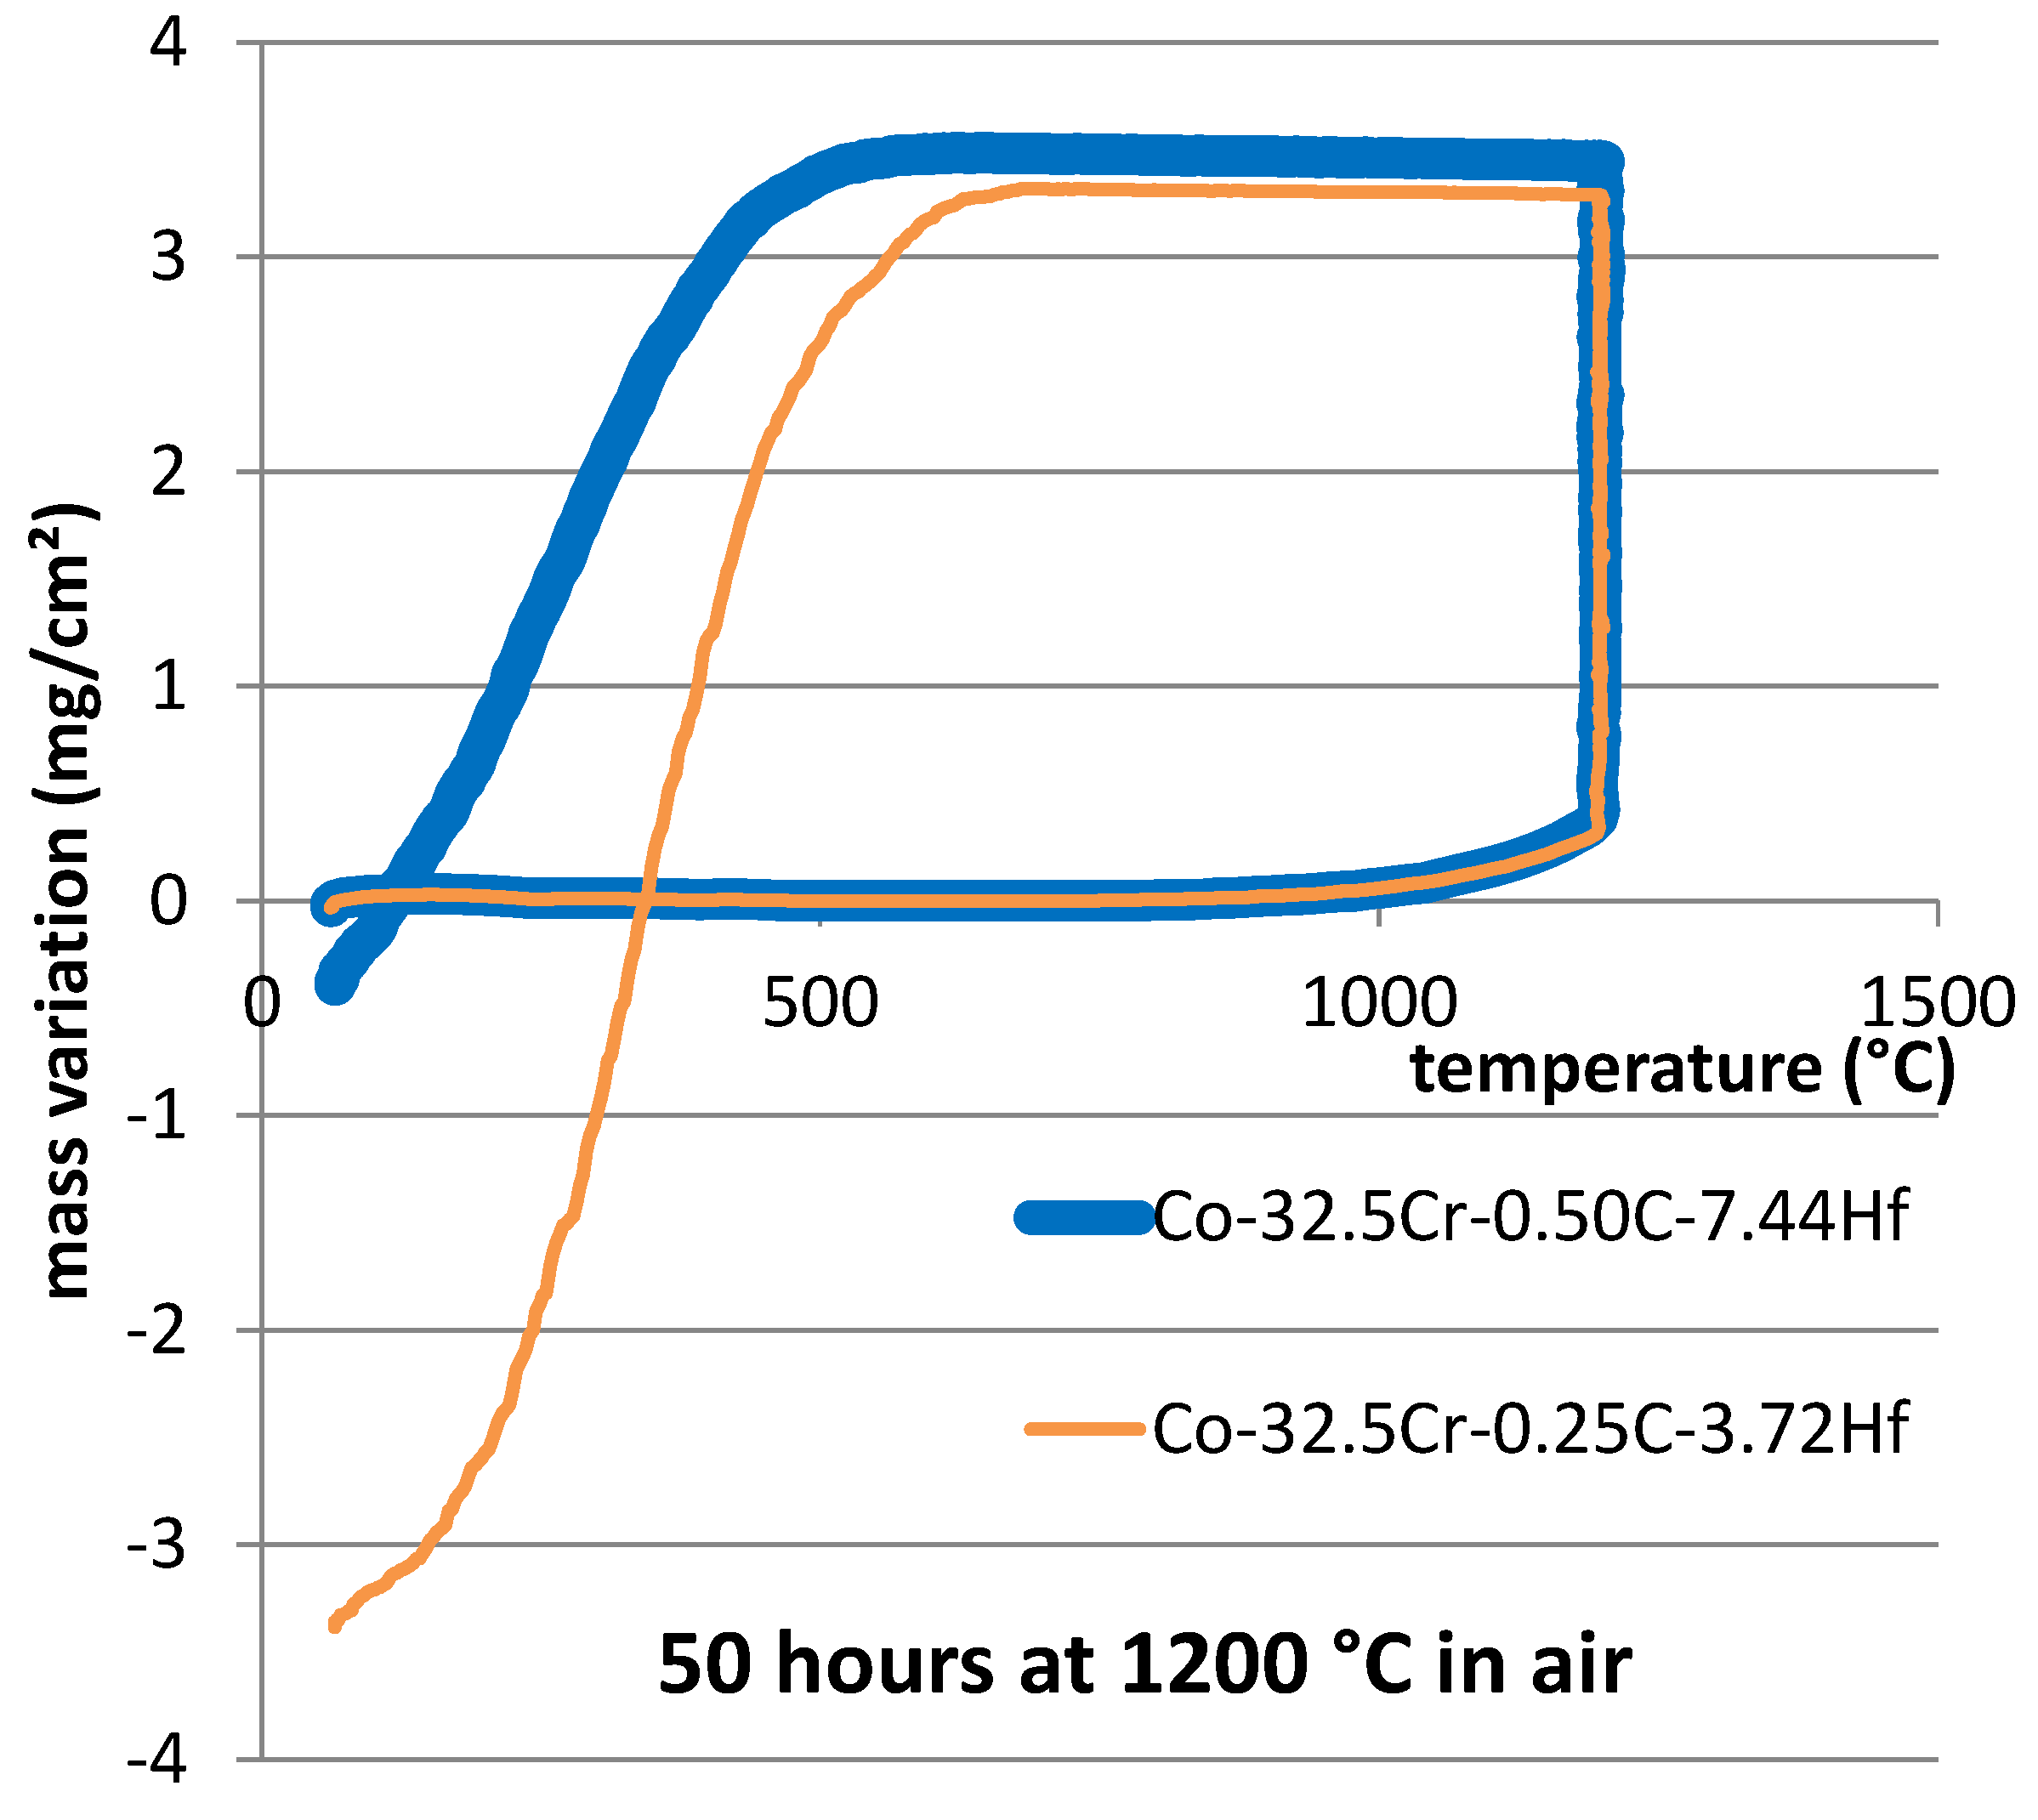
3.3. Oxidation at Heating and Oxide Spallation at Cooling

The whole files containing the recorded mass variation values were exploited too. After correction for air buoyancy variation, the two files were plotted versus temperature (Figure 5).
One can see first that a small but significant part of the total mass gain was achieved during heating. Indeed, heating was performed in the flow of industrial air, and oxidation started to be detectable as soon as the temperature became high enough. The used thermo–balance detected the mass gain due to oxidation when the temperature reached about 740 °C. The values displayed in the first line of Table 4 suggest that the Co-25Cr-0.50C-7.44Hf alloy was a little less reactive than the other alloy since the mass gain due to oxidation was detected a little later (at a temperature about 35 °C higher). There was no difference between the oxidation start temperatures at heating for the 25 wt.% Cr containing alloys: about 900 °C for both of them [19]. This temperature is 150 °C higher than the oxidation start temperatures of the alloys studied here. This suggests that the 7.5 wt.% Cr addition increased the reactivity of the present alloys in comparison with the ones earlier studied. Probably due to that, the mass gains during the whole heating are, for the present alloys, 1.5 to 2 times higher than the ones of the 25 wt.% Cr containing alloys earlier studied (second line in Table 4 and [19]). In contrast, the mass gains achieved during the isothermal stage are here much lower than for the earlier alloys: 3.3–3.4 mg cm−2 for 46 h at 1200 °C (third line in Table 4) against 14–18 mg cm−2 for the 25 wt.% Cr containing alloys [19]. This is consistent with the differences in Kp constant values seen above. Consequently, the proportion of the mass gain during heating in the total mass gain achieved until the end of isothermal oxidation is here ten times higher than for the 25 wt.% Cr containing alloys: about 10% (fourth line in Table 4) against 1–2 %.
The cooling taking place after the end of the isothermal stage usually induces more and more intense compressive stresses on the oxide scales externally formed around the samples. This generally provokes local ruptures of the scale and possibly the loss of oxide parts. These oxide losses are shown by mass losses then falls in the mass curves. Such phenomena occurred here (Figure 5). This is more obvious for the Co-32.5Cr-0.25C-3.72Hf alloy than for the Co-32.5Cr-0.50C-7.44Hf alloy. The values of the parameters characterizing the oxide scale spallation phenomena were measured on the {m versus T}–curves (Figure 5) and these values are reported in Table 5. For the present oxidized samples, scale spallation started about 15 min later for the Co-32.5Cr-0.50C-7.44Hf alloy than for the other, and after 80 °C more cooling (first line in Table 5). A similar difference was previously noticed for the 25 wt.% Cr containing alloys (about 650 °C for the Co-25Cr-0.25C-3.72Hf alloy and 570 °C for the Co-25Cr-0.50C-7.44Hf one [19]. Oxide spallation occurred here sooner than for the 25 wt.% Cr containing alloys which started spalling off about 30 °C below. The total mass loss, achieved between the start of oxide spallation and the return to room temperature, appears as being lower for the Co-32.5Cr-0.50C-7.44Hf alloy than for the other alloy (bottom line in Table 5). Such difference was also noticed for the 25 wt.% Cr containing alloys (about −50 g cm−2 for the Co-25Cr-0.25C-3.72Hf alloy against −30 g cm−2 for the Co-25Cr-0.50C-7.44Hf one). This allows pointing out the better resistance against oxide spallation when the Hf content is higher. The better isothermal oxidation resistance of the alloys of the present study allowed the 32.5 wt.% Cr containing alloys to lose less oxide masses (about ten times lower than for the 25 wt.% Cr containing ones [19]).

3.4. Post–Mortem Metallography Characterization of the Oxidized Samples

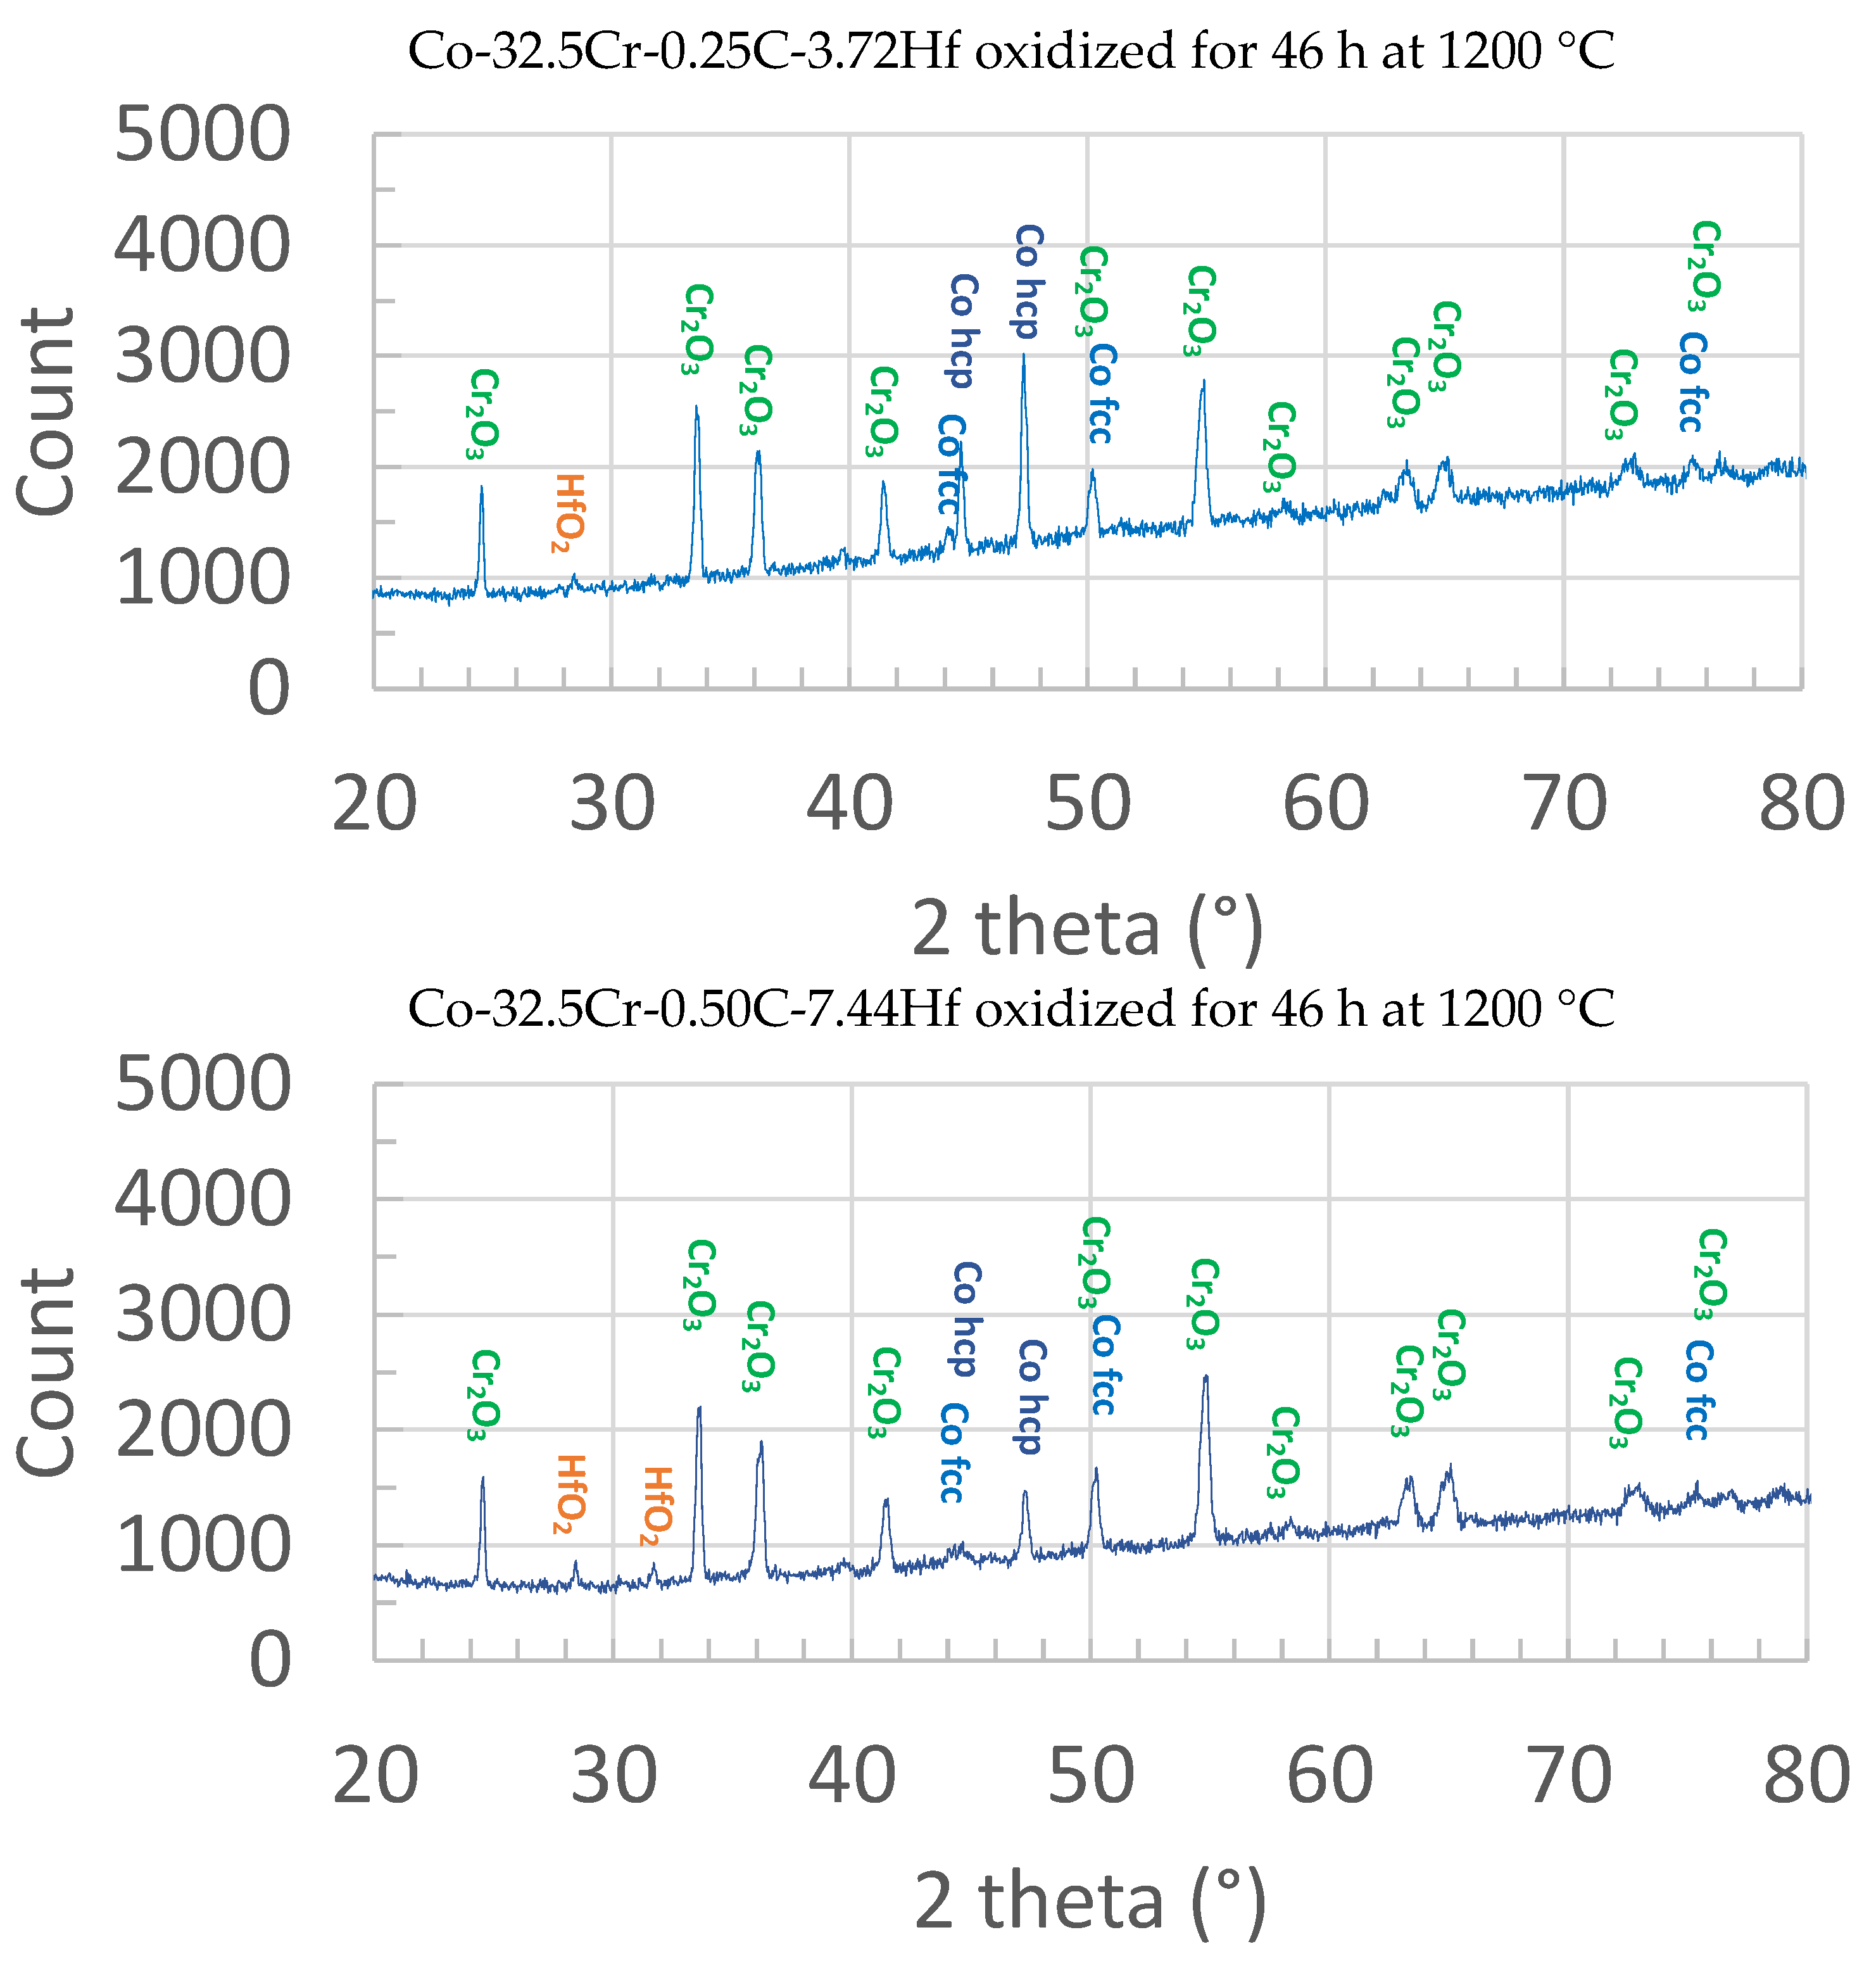
First, X-ray diffraction was performed on the oxidized surfaces of the oxidized samples. The obtained diffractograms are displayed in Figure 6. One can see that, in both cases, the principal oxide present is clearly chromia. Very small peaks point out the presence of hafnium oxide. The other diffraction peaks correspond to the alloy, the matrix of which is double–phased (austenitic and hexagonal compact) due to partial allotropic transformation during the cooling.
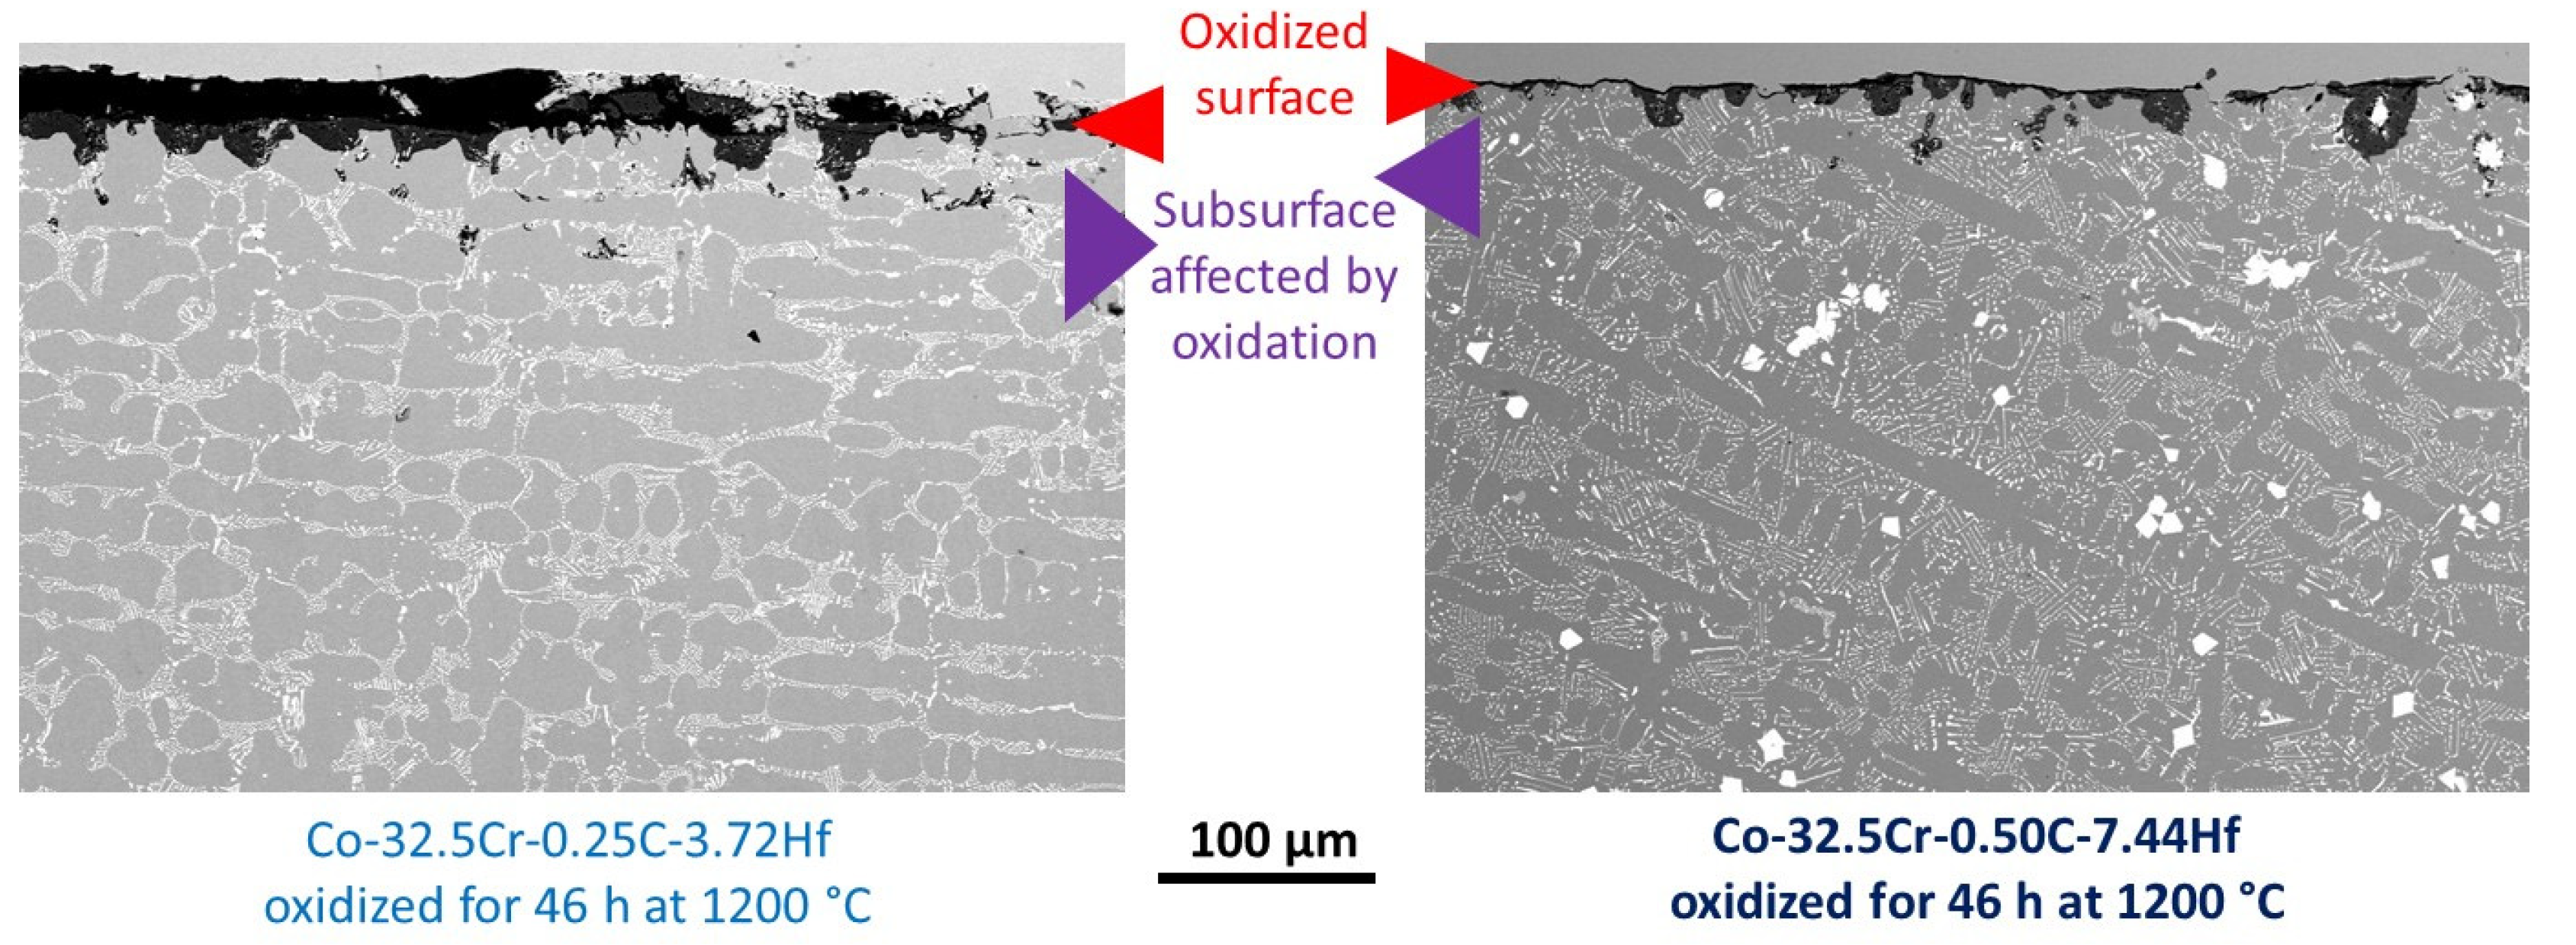
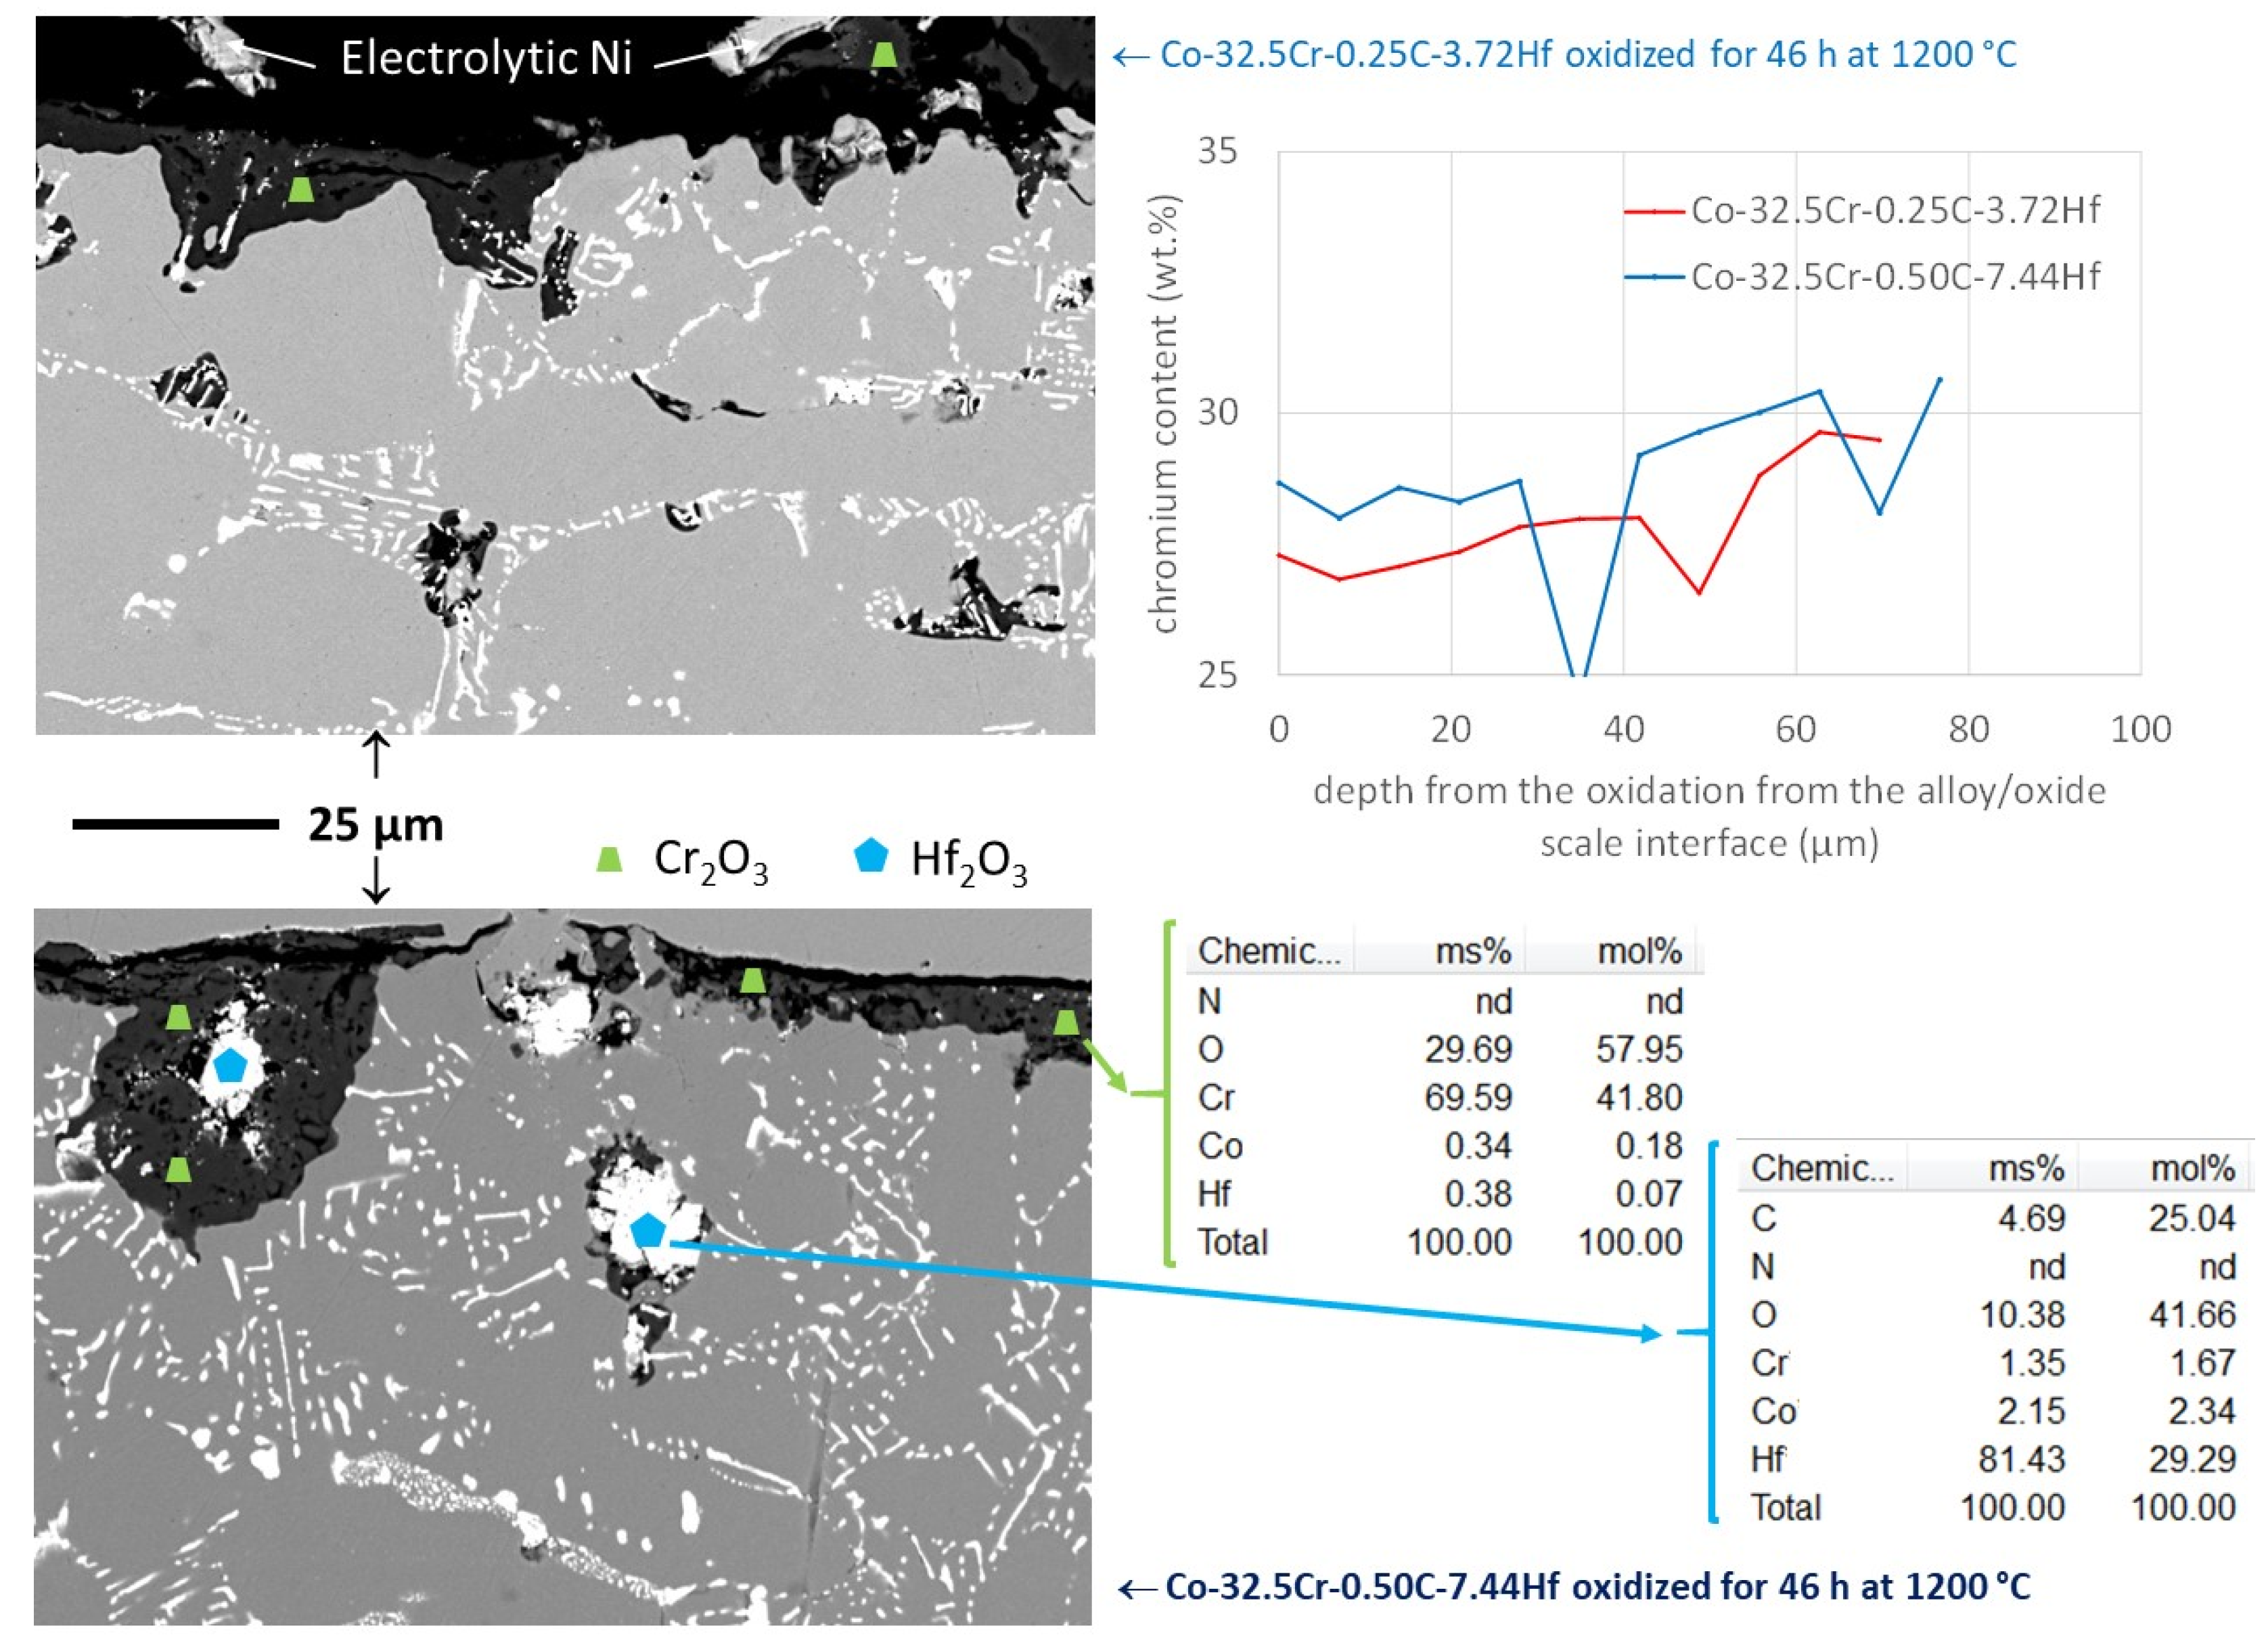
The cross–sectional samples were prepared from the oxidized alloys by electrolytic coating, cutting and grinding/polishing. Despite the careful handling of the oxidized samples, parts of the oxide scales were unfortunately lost. These cross–sectional samples were examined all around. Low magnification SEM/BSE micrographs were taken where the oxide scale was still sufficiently present. These micrographs are provided in Figure 7 to benefit from a general view of the oxidized state. Obviously, oxidation acted both externally and internally (Figure 8, left). Inward progression of oxidation was generalized, as this was already the case for the 25 wt.% Cr containing alloys studied previously [19]. Chromia was present all around with the two types of location (external scale and internal oxides). Other oxides were also present as internal oxides. Several EDS spot analyses performed on these white internal oxides demonstrated that their stoichiometry was Hf2O3 (examples of EDS results inserted in Figure 8) It seemed that the Hf2O3 oxide, mainly met in the subsurface of the Co-32.5Cr-0.50C-7.44Hf alloy, resulting from the oxidation of the compact pre–eutectic HfC present close to the oxidation front (Figure 8, left). Unlike the 25 wt.% Cr containing alloys previously studied [19], no cobalt oxides or CoCr2O4 spinel oxides were observed here. In addition, no local catastrophic oxidation started anywhere for the two alloys, unlike in the 25 wt.% Cr containing alloys which were affected by fast oxidation here and there before the end of the oxidation tests. Seemingly, the chromium content was high enough to maintain a chromia–forming behavior. Several EDS Cr profiles were acquired from the oxidation front toward the bulk. Two Cr profiles, one per alloy, are drawn together in Figure 8 (left). The chromium content decreases from the content in the bulk over a depth equal to about 100 µm in both cases (Figure 8, right). The minimal Cr content values were mostly about 27.5 wt.% Cr for both alloys, despite that lower contents (e.g., 24 wt.%) were met in some locations. Such Cr contents, significantly higher than the 12 to 15 wt.% Cr met for the 25 wt.% Cr containing alloys close to the oxidation front [19], guaranteed the continuation of the chromia–forming behavior.
Concerning hafnium, as for the previous 25 wt.% Cr containing alloys [19], the Hf content is extremely low (even inexistent) in the subsurface. The carbide network is almost not affected, even very close to the oxidation front where only a limited part of HfC was converted in hafnium oxide. This is totally different from TaC–strengthened cobalt alloys [22] for which tantalum diffuses outward to be oxidized at the scale/alloy interface as CrTaO4 and for which a TaC–free zone usually develops inward from the oxidation front. Seemingly Hf cannot enter in solid solution in the matrix and is, therefore, not able to quit carbides and diffuse.
Since the HfC network stayed in place for all the oxidation test duration, taking into account the very high density of this carbide network (in the Co-32.5Cr-0.50C-7.44Hf alloy but also in the other one), one may think that the diffusion of chromium itself may be made more difficult and slowed down. This was maybe a reason for why the 25 wt.% Cr containing alloys oxidized with the formation of chromia but also of other oxides [19]. In the present case, with 7.5 wt.% Cr more, the Cr content initially present everywhere in the alloys and in the zones close to the sample surface, in particular, was high enough to allow the chromia–forming behavior to be less dependent on Cr diffusion from deeper in the alloys. However, because of the no disappearance of the carbide network, the diffusion barrier effect of the HfC may be a serious problem for oxidation in the long term. For 46 h at 1200 °C in air, the probable hindering to Cr diffusion caused by the HfC network was responsible for a significant inward oxygen diffusion. This oxygen diffusion from the oxidation front is revealed by the chromia islands formed internally.

3.5. Microstructure Evolution in the Bulk

At such high temperatures, the microstructure of the alloys may have evolved, more or less. What is generally expected is the tendency to diminish the interfacial areas separating the matrix and carbides to decrease the interfacial energy of the alloys. In the case of the TaC–containing alloys, this decrease in interfacial energy leads to globularization and coarsening for the initial script–like carbides. These ones become rounder and blockier, with a weakening effect on the mechanical properties at high temperatures [23,24]. The micrographs presented in Figure 9 were taken in the center of the ingot (initial microstructure) or in the center of the oxidized samples (microstructures aged at 1200 °C for 46 h) at high magnification with the SEM in BSE mode. They clearly show that the morphological evolutions encountered for TaC carbides did not take place for the HfC carbides. The carbides populations of the two alloys studied here are almost unchanged. One may just notice a very limited fragmentation of the script–like eutectic carbides and a loss of geometrical regularity of the pre–eutectic carbides present in the Co-32.5Cr-0.50C-7.44Hf (polygons are slightly roughed after aging). Consequently, the microstructures of the present alloys do not have lost the excellent stability earlier shown by the 25 wt.% Cr containing alloys [18]. The addition of 7.5 wt.% Cr did not affect the stability of the carbides. This suggests that the mechanical properties at 1200 °C will be maintained at the same level as at the beginning of the high temperature exposure.

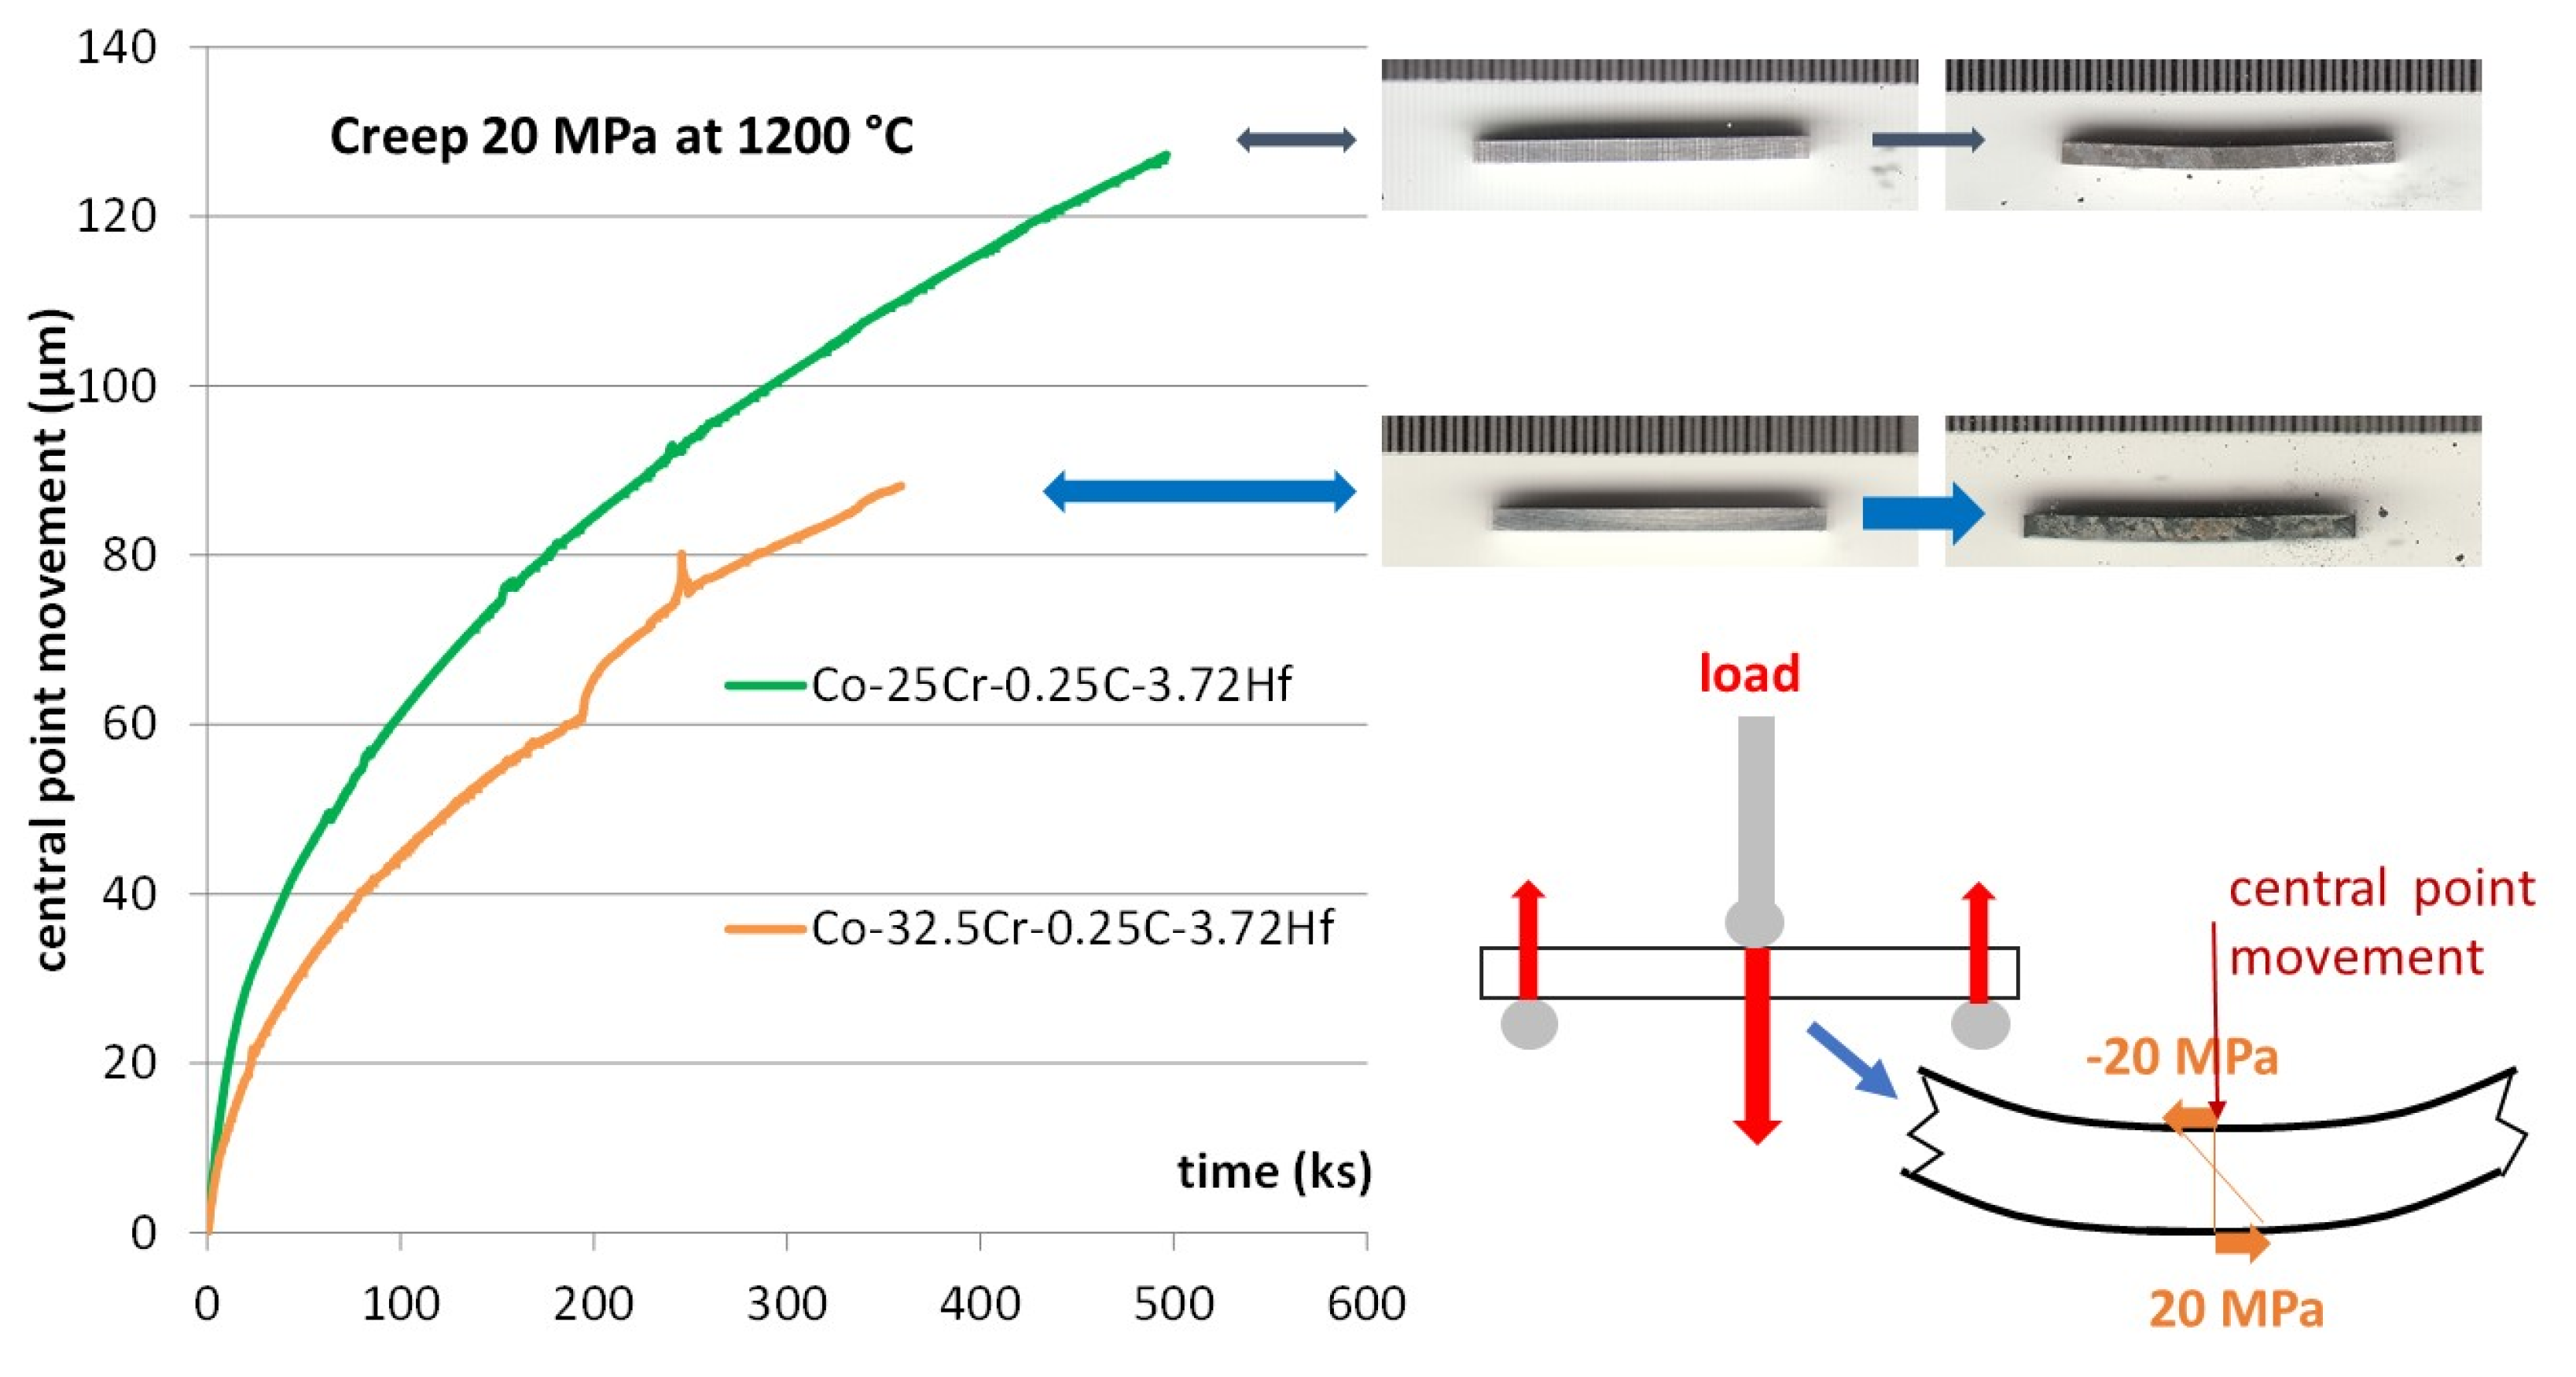
3.6. Creep Behavior Control

Logically, enriching in chromium the creep–resistant 25 wt.% containing alloys previously studied [19] was expected to increase their resistance against high temperature oxidation (now verified and confirmed). However, this modification of the chemical composition of the alloy may also possibly influence the mechanical properties at high temperatures. It was just seen below that the stability of the carbides network was not affected by this Cr addition, neither in the as–cast condition nor after aging. However, the absence of any deleterious effect due to chromium addition needs to be checked by mechanically testing the alloys at high temperatures. A result of a flexural creep test at 1200 °C was earlier carried out on the Co-32.5Cr-0.25C-3.72Hf alloy and it demonstrated remarkable creep resistance. The same test was here performed, on the Cr–enriched corresponding alloy in the same conditions for comparison. The Co-32.5Cr-0.25C-3.72Hf alloy was thus tested here, at 1200 °C for a resulting maximal stress of 20 MPa, with the same apparatus and for the same protocol as earlier, during 100 h. The used device and the test protocol are noted by a scheme in the right–bottom corner of Figure 10. Prior to heating to 1200 °C, a load (long red arrow downward oriented) is progressively applied—using the grey top rod—on the center of the top face of the parallelepiped sample, until inducing here 20 MPa for the horizontal compressive stress (and a 20 MPa horizontal tensile stress in the other side (according to the elastic theory). This load is equilibrated by the sum of the support’s reactions (short red arrows upward oriented). The sample deformation started, of course, before reaching 1200 °C, as soon as the temperature became high enough. The deformation re–initialized to 0 when the temperature reached 1200 °C. The creep deformation progression is characterized by the downward movement of the central point, counted with positive values.
The resulting deformation curve is plotted in the left part of Figure 10, together with the one previously obtained for the 25 wt.% Cr containing alloy [18]. The resistance is globally of the same level as the previous result, with a deformation rate a little lower but also with a little instability appearing at about t = 200,000 s. Of course, this needs to be confirmed by some repeated tests to take into account a possible lack of reproducibility.

4. Conclusions

The HfC–reinforced cobalt–based alloys containing only 25 wt.% Cr—points of departure of this work—demonstrated remarkable creep resistance for temperatures at which the intermetallic particles reinforcing the current best superalloys cannot be present longer. Unfortunately, their low oxidation resistance was their weak point. With their chromium content increased up to 32.5 wt.%, the oxidation rates at 1200 °C are significantly decreased and no cobalt oxides or spinel formed. Except for hafnium oxides, only chromia was present. In addition, this is obviously without detrimental influence on the characteristics of the primary carbides and on their strengthening effect. Indeed, HfC still remains as the single carbide present. Second, no decrease in the HfC fraction and morphology destabilization were noted. Third, the creep resistance at 1200 °C still stayed at a high level. More Cr immediately available in the subsurface of test samples (and further of real components) is a major advantage. However, working for a longer time at 1200 °C supposes that chromium existing deeper can diffuse toward the oxidation front. To correct the partial diffusion barrier that is the permanent dense HfC network, solutions to improve volume Cr diffusion must be found and tested. The lack of oxide scale adherence when the temperature evolves is also a problem for which possible solutions are to be explored. A possible solution to improve the resistance against scale spallation is through yttrium addition. This will be the objective of new investigations and tests to continue to enhance the resistance of these alloys against hot oxidation.

Funding

This research received no external funding.

Institutional Review Board Statement

Not applicable.

Informed Consent Statement

Not applicable.

Data Availability Statement

The data presented in this study are available in article.

Acknowledgments

The author wish thanking Elodie Conrath for her technical help for the thermogravimetry tests and the creep test as well as Pascal Villeger and Ghouti Medjahdi for the XRD runs.

Conflicts of Interest

The author declares no conflict of interest.

References

  1. Donachie, M.S.; Donachie, S.J. Superalloys: A Technical Guide, 2nd ed.; ASM International: Materials Park, OH, USA, 2002. [Google Scholar]
  2. Selvaraj, S.K.; Sundaramali, G.; Dev, S.J.; Swathish, R.S.; Karthikeyan, R.; Vishaal, K.E.V.; Paramasivam, V. Recent Advancements in the Field of Ni-Based Superalloys. Adv. Mater. Sci. Eng. 2021, 2021, 9723450. [Google Scholar] [CrossRef]
  3. Young, D.J. High Temperature Oxidation and Corrosion of Metals; Elsevier: Amsterdam, The Netherlands, 2008. [Google Scholar]
  4. Kofstad, P. High Temperature Corrosion; Elsevier Applied Science: London, UK, 1988. [Google Scholar]
  5. Smola, G.; Jedlinski, J.; Gleeson, B.; Hayashi, S.; Grosseau Poussard, J.L.; Bonnet, G.; Nocuń, M. On the early stages of scale development on Ni-22Al-30Pt with and without Hf additions at 1150 °C. Mater. High Temp. 2012, 29, 70–80. [Google Scholar] [CrossRef]
  6. Yan, K.; Guo, H.; Gong, S. High-temperature oxidation behavior of minor Hf doped NiAl alloy in dry and humid atmospheres. Corros. Sci. 2013, 75, 337–344. [Google Scholar] [CrossRef]
  7. Ding, R.; Jones, I.P.; Jiao, H. The role of Hf and TiC additions in the mechanical properties and microstructure of NbAlV alloys. Mater. Sci. Eng. A: Struct. Mater. Prop. Microstruct. Process. 2009, A516, 65–72. [Google Scholar] [CrossRef]
  8. Vazquez, A.; Varma, S.K. High-temperature oxidation behavior of Nb-Si-Cr alloys with Hf additions. J. Alloy. Compd. 2011, 509, 7027–7033. [Google Scholar] [CrossRef]
  9. Yang, X.X.; Sha, J.B.; Zhang, H. Property responses in Nb-Si-Hf-Ti-Al-W-B-Cr alloys for high-temperature applications. Mater. Sci. Forum 2010, 654–656, 468–471. [Google Scholar] [CrossRef]
  10. Wu, W.; Ni, S.; Liu, Y.; Song, M. Effects of cold rolling and subsequent annealing on the microstructure of a HfNbTaTiZr high-entropy alloy. J. Mater. Res. 2016, 31, 3815–3823. [Google Scholar] [CrossRef]
  11. Lu, J.; Chen, Y.; Zhang, H.; Li, L.; Fu, L.; Zhao, X.; Guo, F.; Xiao, P. Effect of Al content on the oxidation behavior of Y/Hf-doped AlCoCrFeNi high-entropy alloy. Corros. Sci. 2020, 170, 108691. [Google Scholar] [CrossRef]
  12. Berthod, P. High temperature properties of several chromium-containing Co-based alloys reinforced by different types of MC carbides (M=Ta, Nb, Hf and/or Zr). J. Alloy. Compd. 2009, 481, 746–754. [Google Scholar] [CrossRef] [Green Version]
  13. Luo, A.; Shin, K.S.; Jacobson, D.L. Hafnium carbide strengthening in a tungsten-rhenium matrix at ultrahigh temperatures. Acta Metall. Mater. 1992, 40, 2225–2232. [Google Scholar] [CrossRef]
  14. Seong, Y.H.; Baek, C.; Kim, J.H.; Kong, J.H.; Kim, D.S.; Lee, S.H.; Kim, D.K. Evaluation of oxidation behaviors of HfC-SiC ultra-high temperature ceramics at above 2500 °C via oxyacetylene torch. Ceram. Int. 2018, 44, 8505–8513. [Google Scholar] [CrossRef]
  15. Cheng, J.W.; Wang, J.; Wang, X.; Wang, H. Preparation and high-temperature performance of HfC-based nanocomposites derived from precursor with Hf-(O,N) bonds. Ceram. Int. 2017, 43, 7159–7165. [Google Scholar] [CrossRef]
  16. Gu, X.; Yang, L.; Ma, X.; Dai, X.; Wang, J.; Wen, M.; Zhang, K. Ta addition effects on the structure, mechanical and thermal properties of sputtered Hf-Ta-C film. Ceram. Int. 2019, 45, 15596–15602. [Google Scholar] [CrossRef]
  17. Zhang, J.; Wang, S.; Li, W.; Yu, Y.; Jiang, J. Understanding the oxidation behavior of Ta-Hf-C ternary ceramics at high temperature. Corros. Sci. 2020, 164, 108348. [Google Scholar] [CrossRef]
  18. Berthod, P.; Conrath, E. Mechanical and Chemical Properties at High Temperature of {M- 25Cr}-based Alloys Containing Hafnium Carbides (M=Co, Ni or Fe): Creep Behavior and Oxidation at 1200 °C. J. Mater. Sci. Technol. Res. 2014, 1, 7–14. [Google Scholar] [CrossRef]
  19. Conrath, E.; Berthod, P. Kinetics of high temperature oxidation of chromium rich HfC reinforced cobalt based alloys. Corros. Eng. Sci. Technol. 2014, 49, 45–54. [Google Scholar] [CrossRef] [Green Version]
  20. Berthod, P. Kinetics of High Temperature Oxidation and Chromia Volatilization for a Binary Ni–Cr Alloy. Oxid. Met. 2005, 64, 235–252. [Google Scholar] [CrossRef] [Green Version]
  21. Berthod, P. Thermogravimetric Study of Oxide Spallation for Chromium-Rich Cast Cobalt-Based and Iron-Based Alloys Oxidized at High Temperature. Open Corros. J. 2009, 2, 61–70. [Google Scholar] [CrossRef]
  22. Berthod, P.; Himeur, Z. Behavior in oxidation at elevated temperature of {25Cr, 0.4C-6Ta}-containing Ni and Co-based cast alloys versus their proportion in nickel and cobalt. Mater. Corros. 2018, 69, 703–713. [Google Scholar] [CrossRef]
  23. Michon, S.; Aranda, L.; Berthod, P.; Steinmetz, P. High temperature evolution of the microstructure of a cast cobalt-base superalloy. Consequences on its thermomechanical properties. Rev. Métallurgie C.I.T./Sci. Génie Des Matériaux 2004, 9, 651–662. [Google Scholar] [CrossRef]
  24. Berthod, P.; Aranda, L.; Gomis, J.P. Effects of Ni Additions on the High Temperature Expansion, Melting and Oxidation Behaviors of Cobalt-Based Superalloys. Crystals 2021, 11, 173. [Google Scholar] [CrossRef]
Figure 1. Microstructures of the two alloys in their as–cast states (top left: the Co-32.5Cr-0.25C-3.72Hf alloy, top right: H alloy, the Co-32.5Cr-0.50C-7.44Hf alloy, bottom right corners: more detailed views at ×1000); Bottom: detailed view of a coarse carbide in the Co-32.5Cr-0.50C-7.44Hf alloy with its EDS spot analysis result (the measured C content is slightly overestimated): this is HfC.
Crystals 12 00361 g001
Figure 2. The isothermal mass gain curves of the two alloys.
Crystals 12 00361 g002
Figure 3. Exploitation of the {m × dm/dt versus -m} plot of the mass gain recorded during the isothermal oxidation of the Co-32.5Cr-0.25C-3.72Hf alloy (left) and test of the values obtained for the kinetic constants (right).
Crystals 12 00361 g003
Figure 4. Exploitation of the {m × dm/dt versus -m} plot of the mass gain recorded during the isothermal oxidation of the Co-32.5Cr-0.50C-7.44Hf alloy (left) and test of the values obtained for the kinetic constants (right).
Crystals 12 00361 g004
Figure 5. Mass gain plotted versus temperature for the whole thermal cycle.
Crystals 12 00361 g005
Figure 6. The obtained X-ray diffractograms and the identification of the oxides present on the surfaces of the oxidized samples (top: the oxidized Co-32.5Cr-0.25C-3.72Hf alloy, bottom: the oxidized Co-32.5Cr-0.50C-7.44Hf alloy).
Crystals 12 00361 g006
Figure 7. Low magnification SEM/BSE micrographs of the oxidized surfaces and subsurfaces of the Co-32.5Cr-0.25C-3.72Hf (left) and Co-32.5Cr-0.50C-7.44Hf (right) alloys.
Crystals 12 00361 g007
Figure 8. High magnification SEM/BSE micrographs of the oxidized surfaces and subsurfaces of the Co-32.5Cr-0.25C-3.72Hf (left, top) and Co-32.5Cr-0.50C-7.44Hf (left, bottom) alloys and typical chromium EDS profiles (right); EDS spot analyses on the oxides present in the surface and subsurface of the second alloy: chromia and Hf2O3 (in the bottom set of EDS results: the 4.7 wt.% C/25 at.% C which can be detected if C is selected is an artefact).
Crystals 12 00361 g008
Figure 9. SEM/BSE micrographs illustrating the bulk microstructures of the Co-32.5Cr-0.25C-3.72Hf (left) and Co-32.5Cr-0.50C-7.44Hf (right) samples before (top) and after (bottom) the {46 h; 1200 °C}–oxidation tests.
Crystals 12 00361 g009
Figure 10. Scheme illustrating the test (right, bottom), initial and final states of the samples (right, top) and the obtained deformation curve for the Co-32.5Cr-0.25C-3.72Hf alloy in comparison with the 25 wt.% Cr containing corresponding alloy (left).
Crystals 12 00361 g010
Table 1. Chemical compositions of the two alloys analyzed in their as–cast conditions (wt.%, SEM/EDS; three ×250 full frame analyses, as is to say about 3 × 600 µm2).
Alloy (3 Zones ×250)As-Cast Co-32.5Cr-0.25C-3.72HfAs-Cast Co-32.5Cr-0.50C-7.44Hf
Cr (average value)33.133.0
Cr (standard deviation)0.10.1
Hf (average value)4.89.2
Hf (standard deviation)0.40.1
C (not measured)(0.25)(0.50)
CoBalanceBalance
Table 2. Chemical compositions of the matrixes of both alloys in their as–cast conditions (wt.%, SEM/EDS; three spot analyses).
Matrix (3 Zones ×250)As-Cast Co-32.5Cr-0.25C-3.72HfAs-Cast Co-32.5Cr-0.50C-7.44Hf
Cr (average value)33.034.6
Cr (standard deviation)0.60.9
Hf (average value)0.10.2
Hf (standard deviation)0.20.1
C (not measured)//
CoBalanceBalance
Table 3. The obtained values of all the kinetic constants.
Kinetic ConstantsCo-32.5Cr-0.25C-3.72HfCo-32.5Cr-0.50C-7.44Hf
Kl/10−5 mg cm−2 s−14872
Kp classic/10−6 mg2 cm−4 s−12224
Kp corr volat/106 mg2 cm4 s192118
Kv volat/10−7 mg cm−2 s−1245326
Table 4. Values of some parameters characterizing the oxidation during heating.
HeatingCo-32.5Cr-0.25C-3.72HfCo-32.5Cr-0.50C-7.44Hf
Oxidation start temp./°C721757
Mass gain at heating’s end/mg cm−20.3150.403
Isothermal mass gain/mg cm−23.2853.446
ratio Heating/Isothermal9.6%11.7%
Table 5. Values of some parameters characterizing the oxide spallation during cooling.
CoolingCo-32.5Cr-0.25C-3.72HfCo-32.5Cr-0.50C-7.44Hf
Oxide spallation start temperature/°C685607
Mass gain just before spallation/mg cm−23.323.48
Mass variation at thermal cycle’s end/mg cm−2−3.39−0.36
Mass loss by spallation/mg cm−2−6.70−3.84
Publisher’s Note: MDPI stays neutral with regard to jurisdictional claims in published maps and institutional affiliations.

