Article

The Critical Behaviour and Magnetism of MnCoGe0.97Al0.03 Compounds

by
Abdul Rashid Abdul Rahman
1,*,
Muhamad Faiz Md Din
1,2,*,
Norinsan Kamil Othman
3,
Jianli Wang
2,4,
Nur Sabrina Suhaimi
1,
Shi Xue Dou
2,
Noor Fadzilah Mohamed Sharif
1 and
Nazrul Fariq Makmor
1
1
Department of Electrical & Electronic Engineering, Faculty of Engineering, National Defence University of Malaysia, Kuala Lumpur 57000, Malaysia
2
Institute for Superconductivity and Electronic Materials, University of Wollongong, Wollongong, NSW 2522, Australia
3
Department of Applied Physics, Faculty of Science and Technology, The National University of Malaysia, 43600 UKM, Bangi 43600, Malaysia
4
College of Physics, Jilin University, Changchun 130012, China
*
Authors to whom correspondence should be addressed.
Crystals 2022, 12(2), 205; https://doi.org/10.3390/cryst12020205
Submission received: 31 December 2021 / Revised: 21 January 2022 / Accepted: 27 January 2022 / Published: 29 January 2022
(This article belongs to the Special Issue Magnetocaloric Effect and Giant Negative Thermal Expansion)

Abstract

:
The critical behaviour associated with the field-induced martensitic transformation heavily relies on the vacancy and transition of the magnetic phase in MnCoGe based-compounds. Due to this revelation, an intensive investigation was brought forth to study the substitution of Ge (atomic radius = 1.23 Å) by Al (atomic radius = 1.43 Å) in MnCoGe0.97Al0.03 alloy compound. The room-temperature X-ray diffraction indicated that the reflections were identified with the orthorhombic structure (TiNiSi-type, space group Pnma) and minor hexagonal structure (Ni2In-type, space group P63/mmc). The substitution of Al in the supersession of Ge transmuted the crystal structure from TiNiSi-type to Ni2In-type structure. The MnCoGe0.97Al0.03 compound’s magnetism was driven by interactions that are long in range, as indicated by the study of the critical behaviour in the proximity of TC. The magnetic measurement and neutron diffraction revealed that the structural transition took place with the decrease in temperature. The results from neutron diffraction signify that the transformation of the magnetic field-induced martensitic has a crucial function in producing the immense effect of magnetocaloric systems such as these. This outcome serves a critical function for investigations in the future.

1. Introduction

The magnetocaloric effect (MCE) is a fundamental magneto-thermal phenomenon known as the cooling or warming of magnetic material in adiabatic conditions due to a change in the applied magnetic field [1]. Weiss and Piccard first discovered this phenomenon in nickel in 1917 [2,3]. Many materials have been examined with magnetic cooling in mind. Interest increased significantly with discovering the giant magnetocaloric effect in Gd during the 1970s to 1990s [4,5]. A great many material families with second-order magnetic phase transitions have been studied for the application of the magnetocaloric effect, such as rare earth and related alloys (e.g., [6,7,8,9]), Laves phases RT2 (e.g., [1,10,11]), rare-earth manganites (e.g., [10,11,12]), RT2 × 2 compounds (X: Si or Ge) (e.g., [13,14,15,16]) and MM’X alloys (M and M’ denote 3d transition elements and X denotes main group elements) [17,18,19,20].
The MnCoGe based alloy is a group of the MM’X family with good physical properties and promising application potential. It has two crystalline structures, TiNiSi-type orthorhombic structure and Ni2In-type hexagonal structure [21]. It was previously found that MnCoGe1-xAlx offers the best ability to control the temperature window [22]. This is important in investigating entropy changes’ structural and magnetic transition effects in giant magnetocaloric effect (GMCE) materials. In addition, the field-induced manner can investigate the martensitic transformation of the GMCE materials.
This work has instigated the critical exponent analysis of MnCoGe0.97Al0.03 compounds in the ferromagnetic (FM) region to paramagnetic (PM) ordering. The analysis was conducted to better understand the behaviour of the physical quantities of near-continuous phase transitions in MnCoGe0.97Al0.03. The scaling hypothesis theorizes that a second-order transition near TC is characterized by a set of critical exponents, namely β, γ, and δ [23]. The critical properties of MnCoGe0.97Al0.03 alloy around the ferromagnetic to paramagnetic phase transition were investigated through various methods: the modified Arrott plots (MAP), the Kouvel–Fisher method, and the critical isotherm analysis. The study effectively shifted the magnetic phase transition and structural change into the temperature region of interest, contributing to a GMCE. In addition, the strong reliance on proper tuning for the phase transition critical behaviour served as a point of reference for a fascinating discovery concerning the replacement for Ge (1.37 Å atomic radius) by Al (1.43 Å atomic radius) in MnCoGe0.97Al0.03 compounds. The tuning dependency was caused by magnetic and structural transition voids and a field-induced martensitic transformation. Results demonstrated that the sample exhibited a structural transition at a temperature of 420 K and a second-order FM–PM transition at a temperature of 352 K. Lastly, neutron diffraction with a temperature-dependent experiment was conducted to confirm the coupling of the magnetic phase transition and the structural transition.

2. Materials and Methods

In preparing the batch of MnCoGe0.97Al0.03 compounds, suitable amounts of Mn (99.9%), Ge (99.99%) powder, Co (99.9%), and Al (99.9%) chips were arc-melted under an argon atmosphere. About 3% of Mn above the stoichiometric amount was required of the starting materials. This is required for evaporation to compensate for lost weight during the melting procedure. In attaining good homogeneity of the samples, the ingots were melted 5 times consecutively. After that, they were closed in an evacuated quartz tube and toughened at a temperature of 900 °C for 120 h. In characterizing the samples, they were then put under the X-ray diffraction (XRD) (Cu Kα radiation, λ = 1.5418 Å) and differential scanning calorimetry (DSC) measuring devices at the room temperature. A 14 T physical property measurement system (Quantum Design) was used to measure the magnetization using its vibrating sample magnetometer option. This was performed at a 10–600 K temperature range and up to 5 T of applied fields. The Wombat high-intensity powder diffractometer was used to collect the neutron data at a 5–340 K temperature range with an incident neutron wavelength of λ = 2.4205 Å located at the Open Pool Australia Lightwater (OPAL) reactor.

3. Results

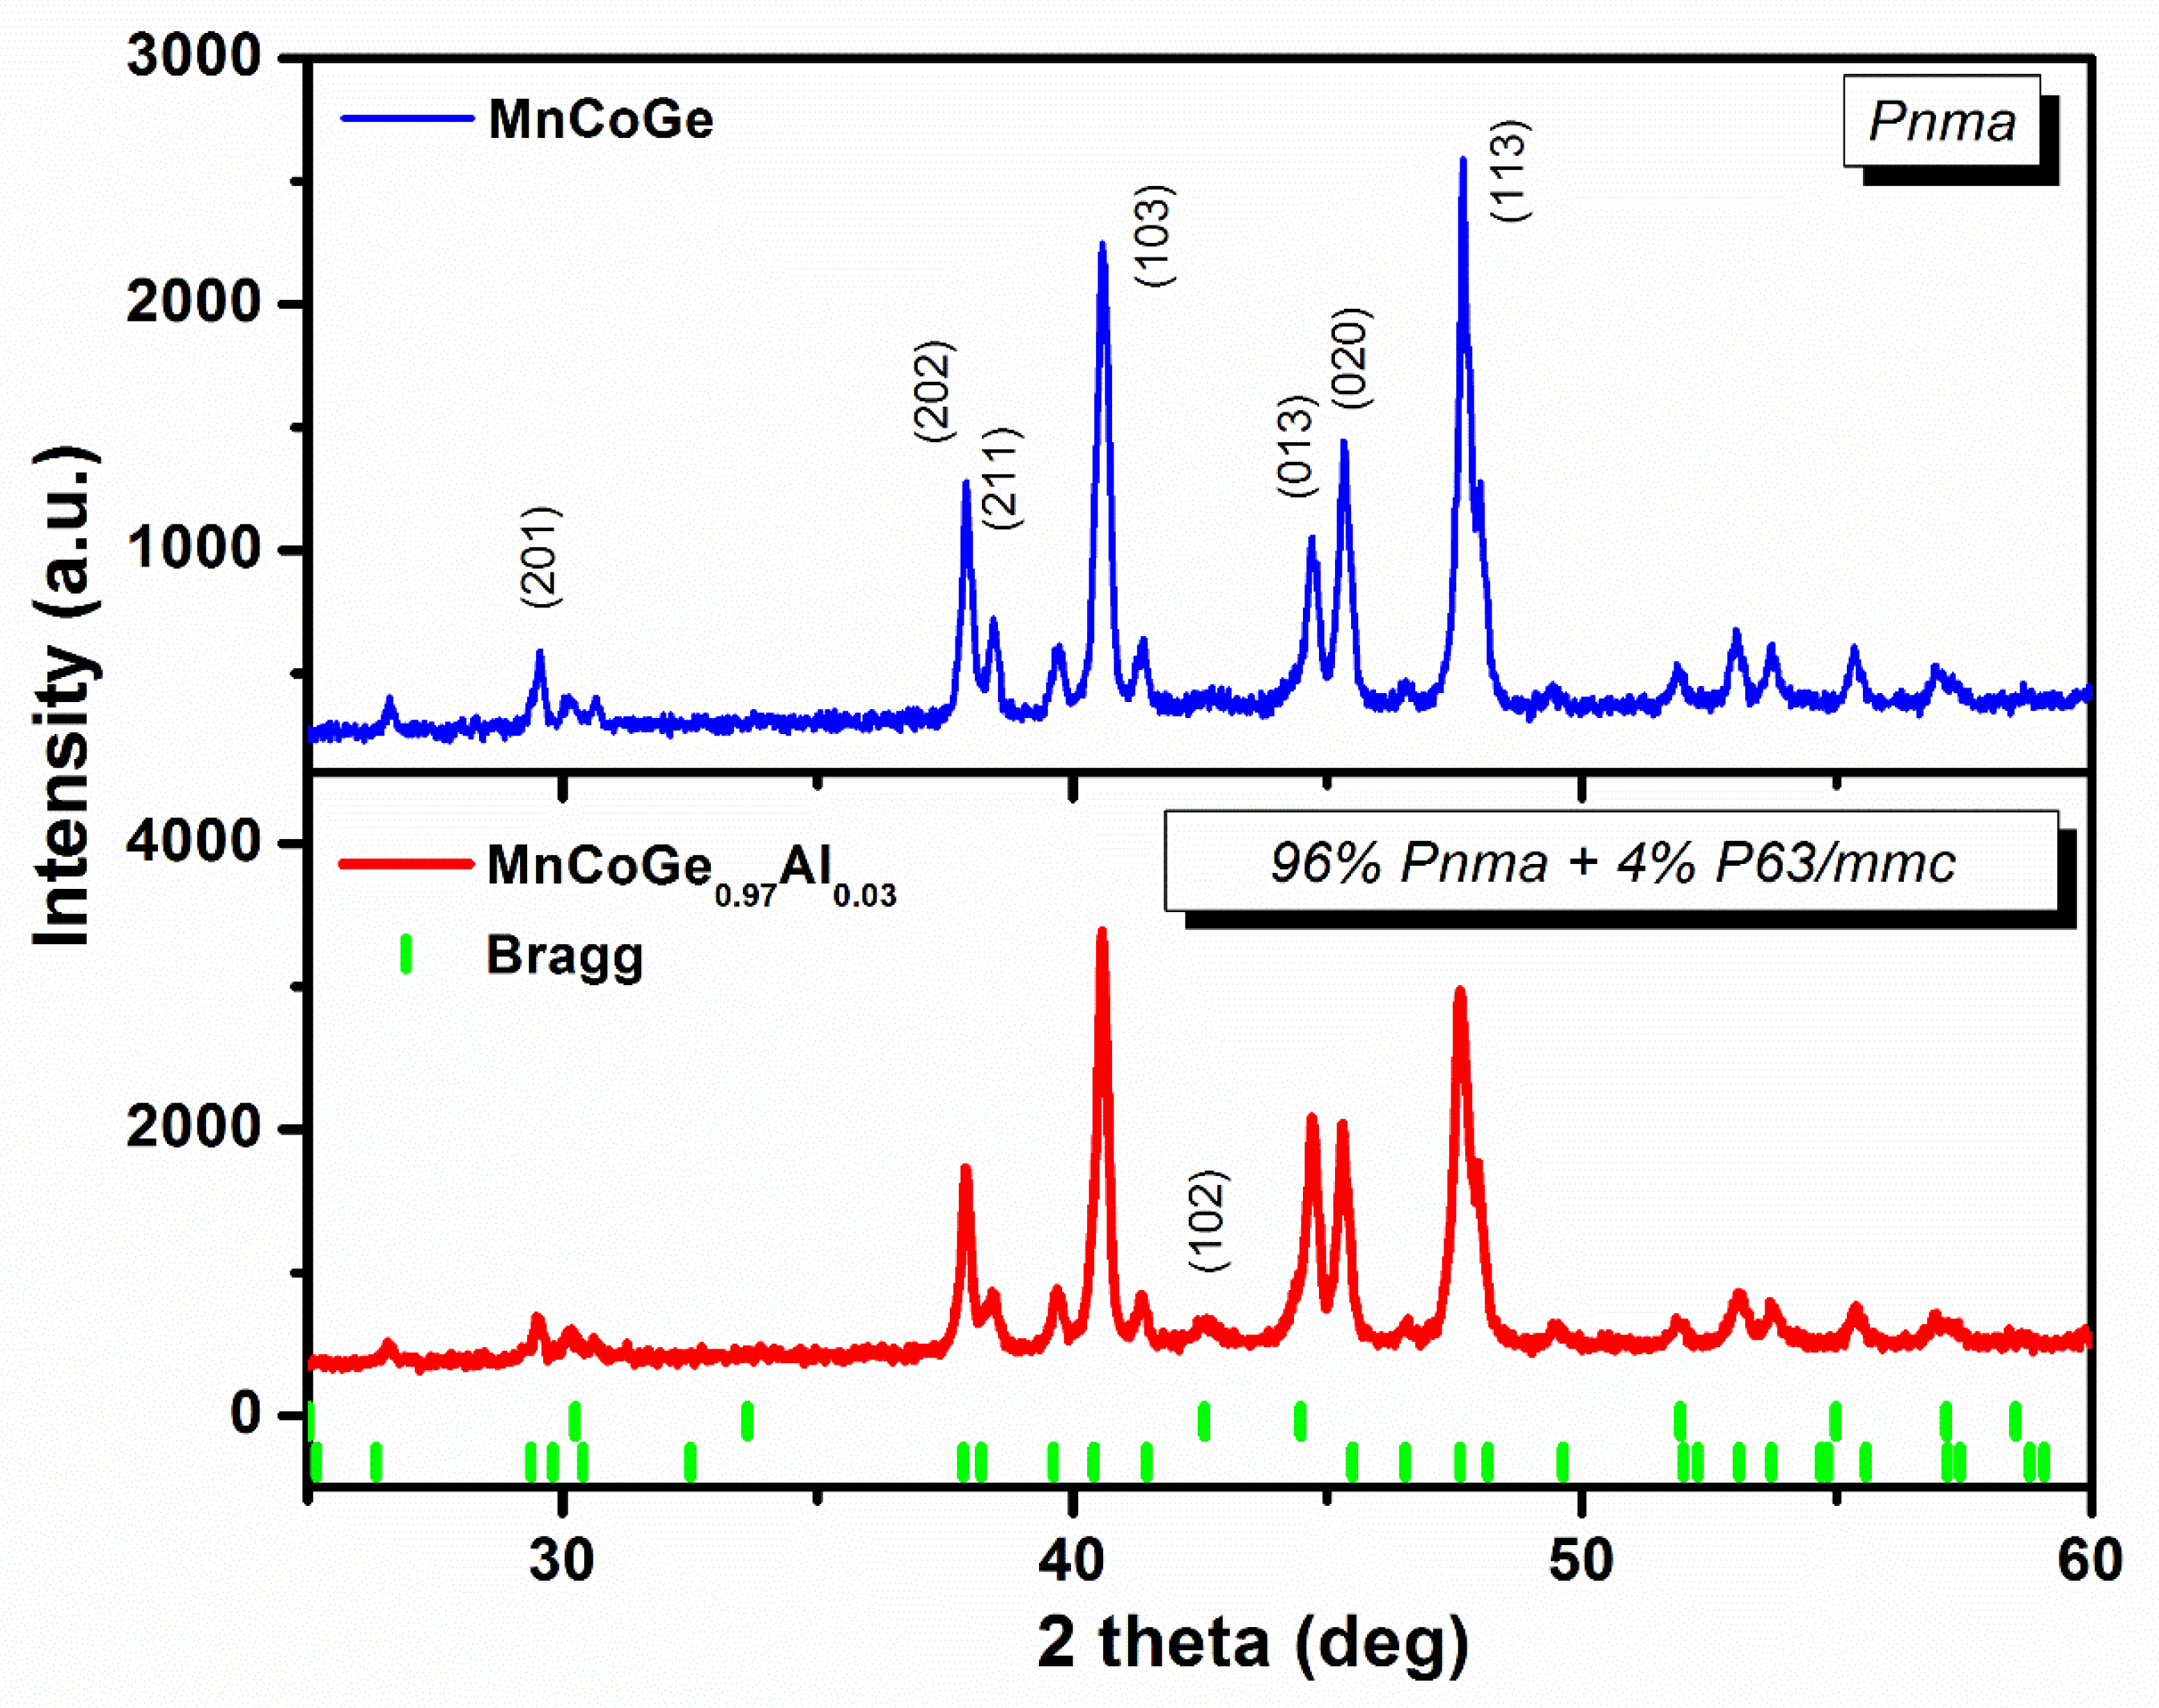
3.1. Structure Properties

Figure 1 shows the X-ray diffraction (XRD) patterns of MnCoGe0.97Al0.03 at room temperature. The peaks were identified with primary TiNiSi-type structure (orthorhombic; space group Pnma) and minor Ni2In- type structure (hexagonal, space group P63/mmc). The change in crystal structure was noticeable with the Al substitution for Ge atoms. As shown by the refinement analysis, the MnCoGe0.97Al0.03 pattern exhibited an orthorhombic TiNiSi-type structure that has a mix of a minuscule number of 4 ± 0.2 wt % of hexagonal phase. The results suggest that with the Al-doping, there was also an increase in the fraction of hexagonal austenite at room temperature. This means there was a tendency to maintain the Ni2In-type austenite and lower the Tstr value by employing Al substitution for Ge.

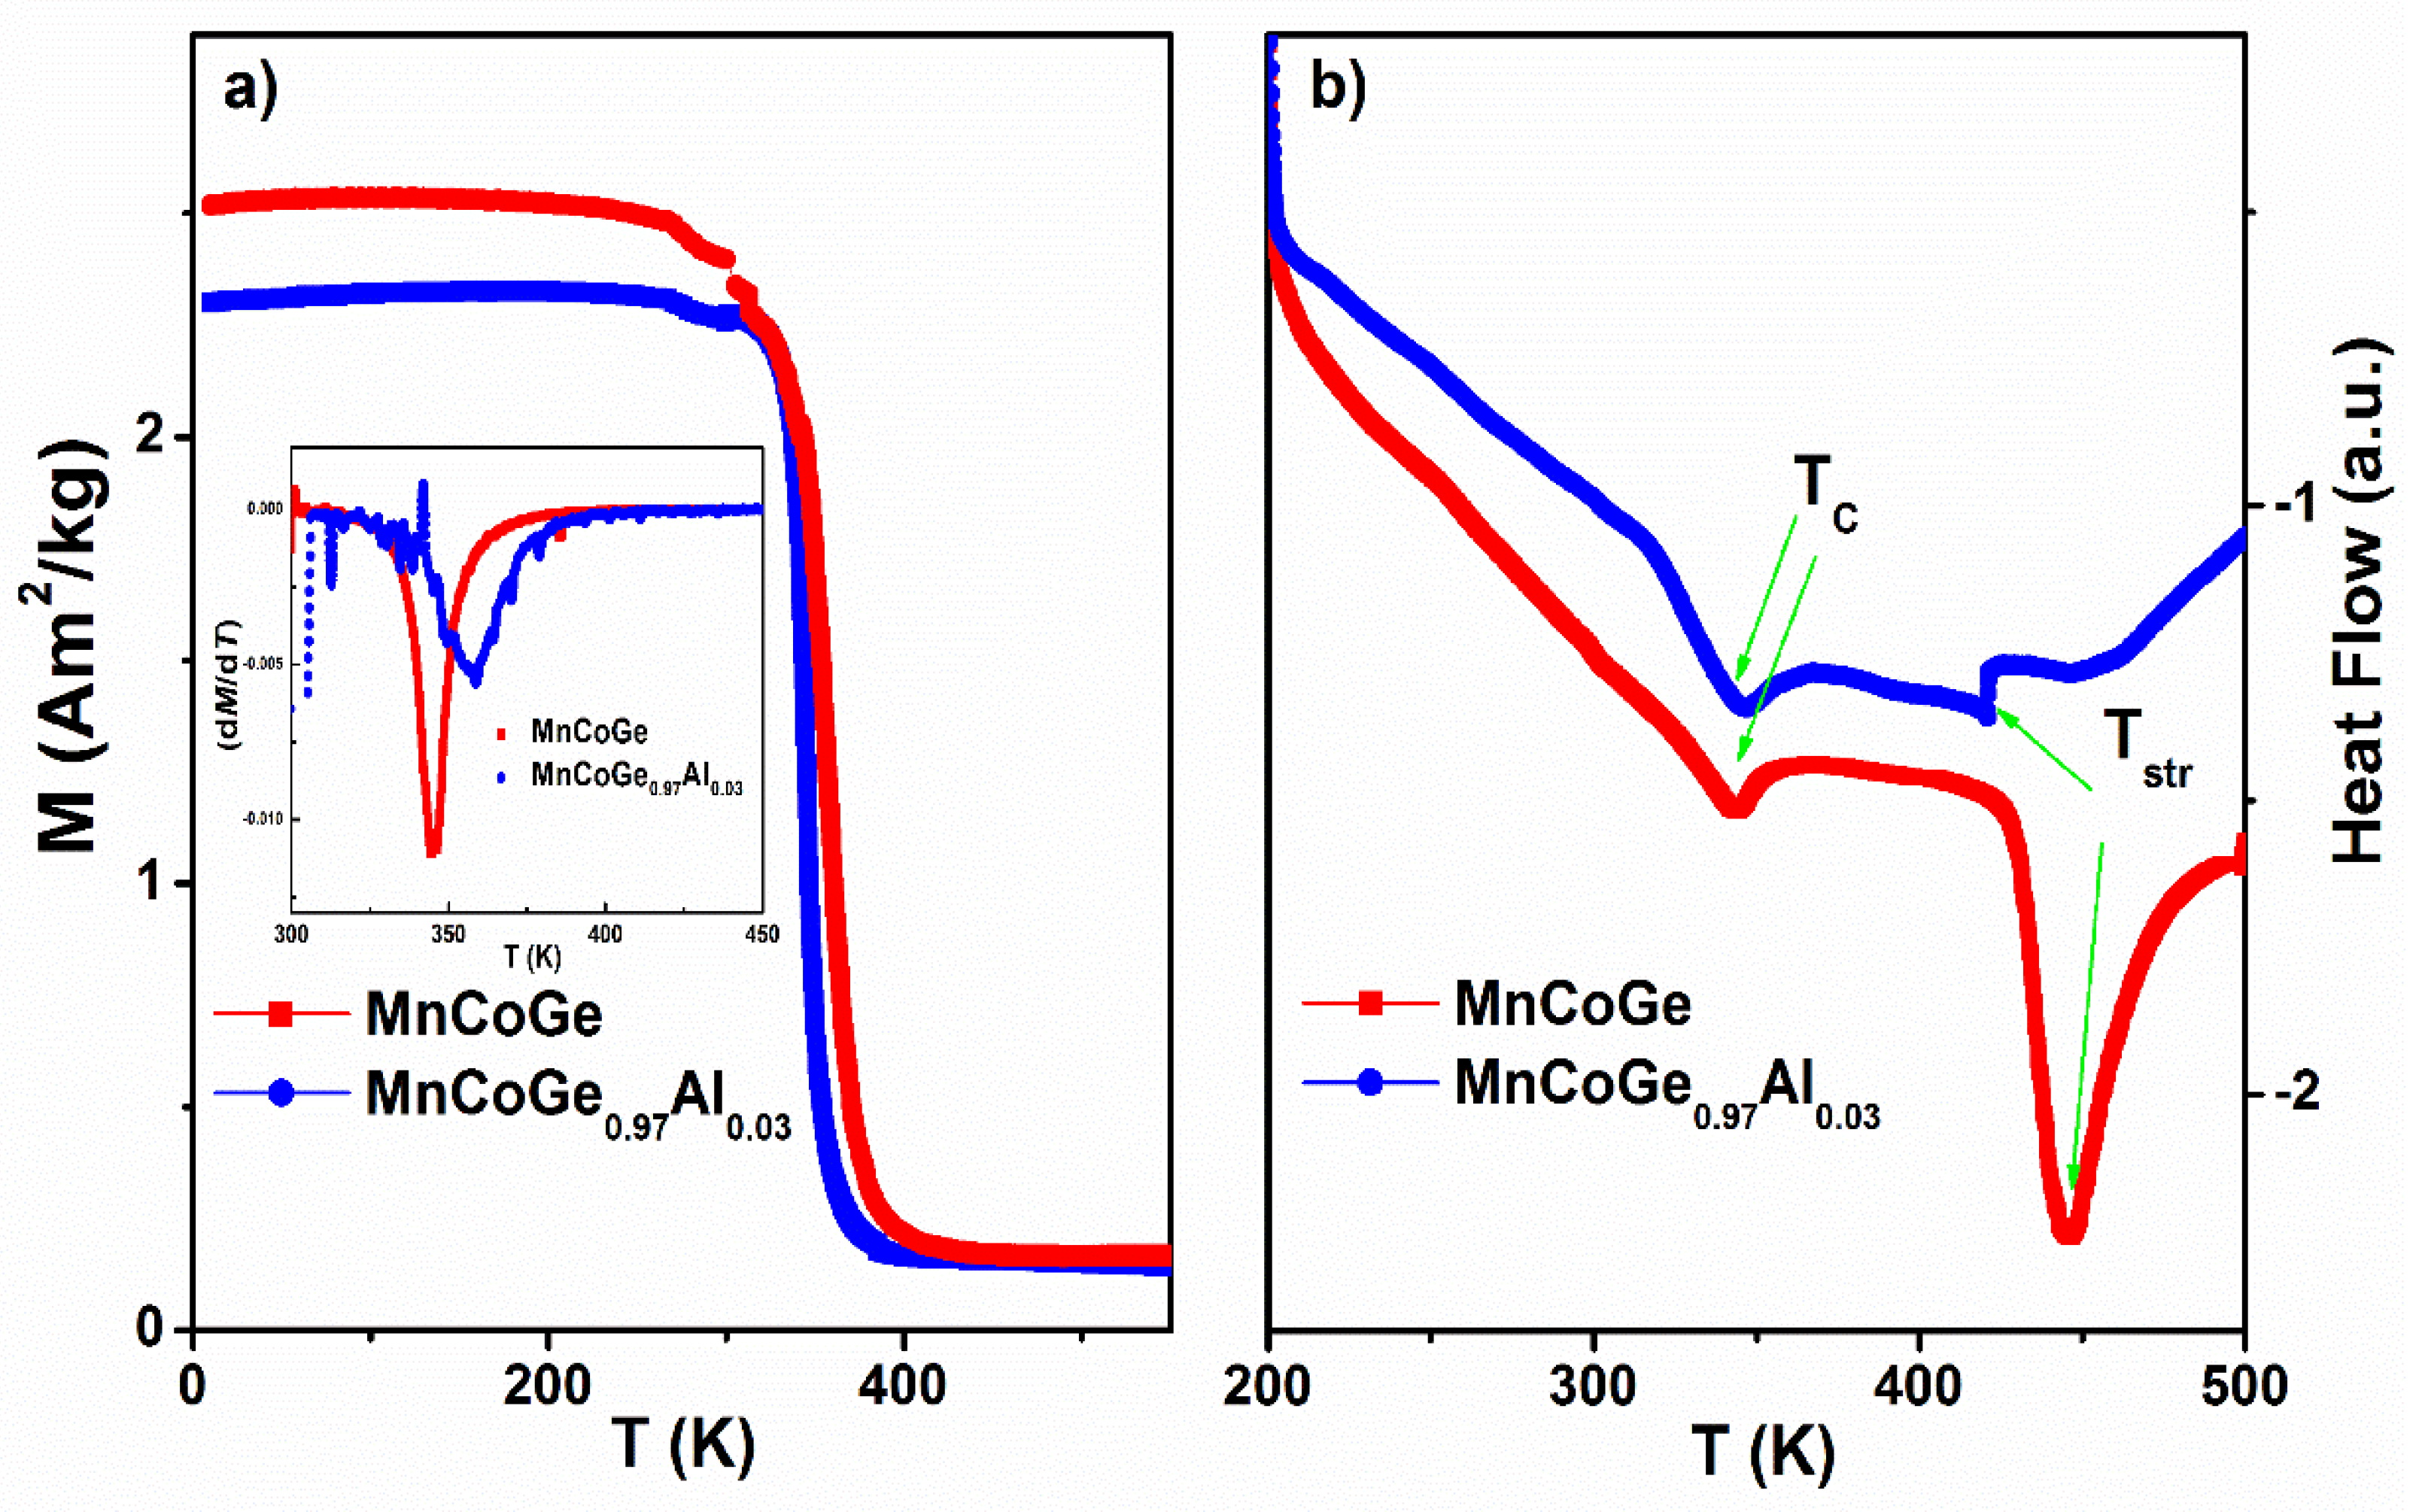
3.2. Magnetic Phase Transitions

Temperature dependence of magnetization (M–T curves) with the influence of 0.01 T low-field and differential scanning calorimetry measurement (DSC) of MnCoGe0.97Al0.03 compounds was conducted in the 10–600 K range to determine the transition temperature, as depicted in Figure 2. The FM to PM transition temperature is defined as the one in which the largest slope occurs, as depicted in the inset of Figure 2a. The Curie temperature (TC) is TC = 342 at MnCoGe and TC = 352 at MnCoGe0.97Al0.03. The TC increased with Al doping, which implies that the exchange interaction among the magnetic atom became stronger with the Al substitution [24]. The DSC measurement revealed a slight drop in the structural transition temperature from Tstr ≈ 450 K (MnCoGe) to Tstr ≈ 420 K (MnCoGe0.97Al0.03). The maxima of the DSC signals were used to determine the transition temperature values. These values coincided with the magnetization measurements, which agreed well with the DSC measurements. This behaviour shows that the MnCoGe-based compounds underwent a structural transition driven by replacing the Ge with Al, hence changing the temperature when cooled to a lower temperature.

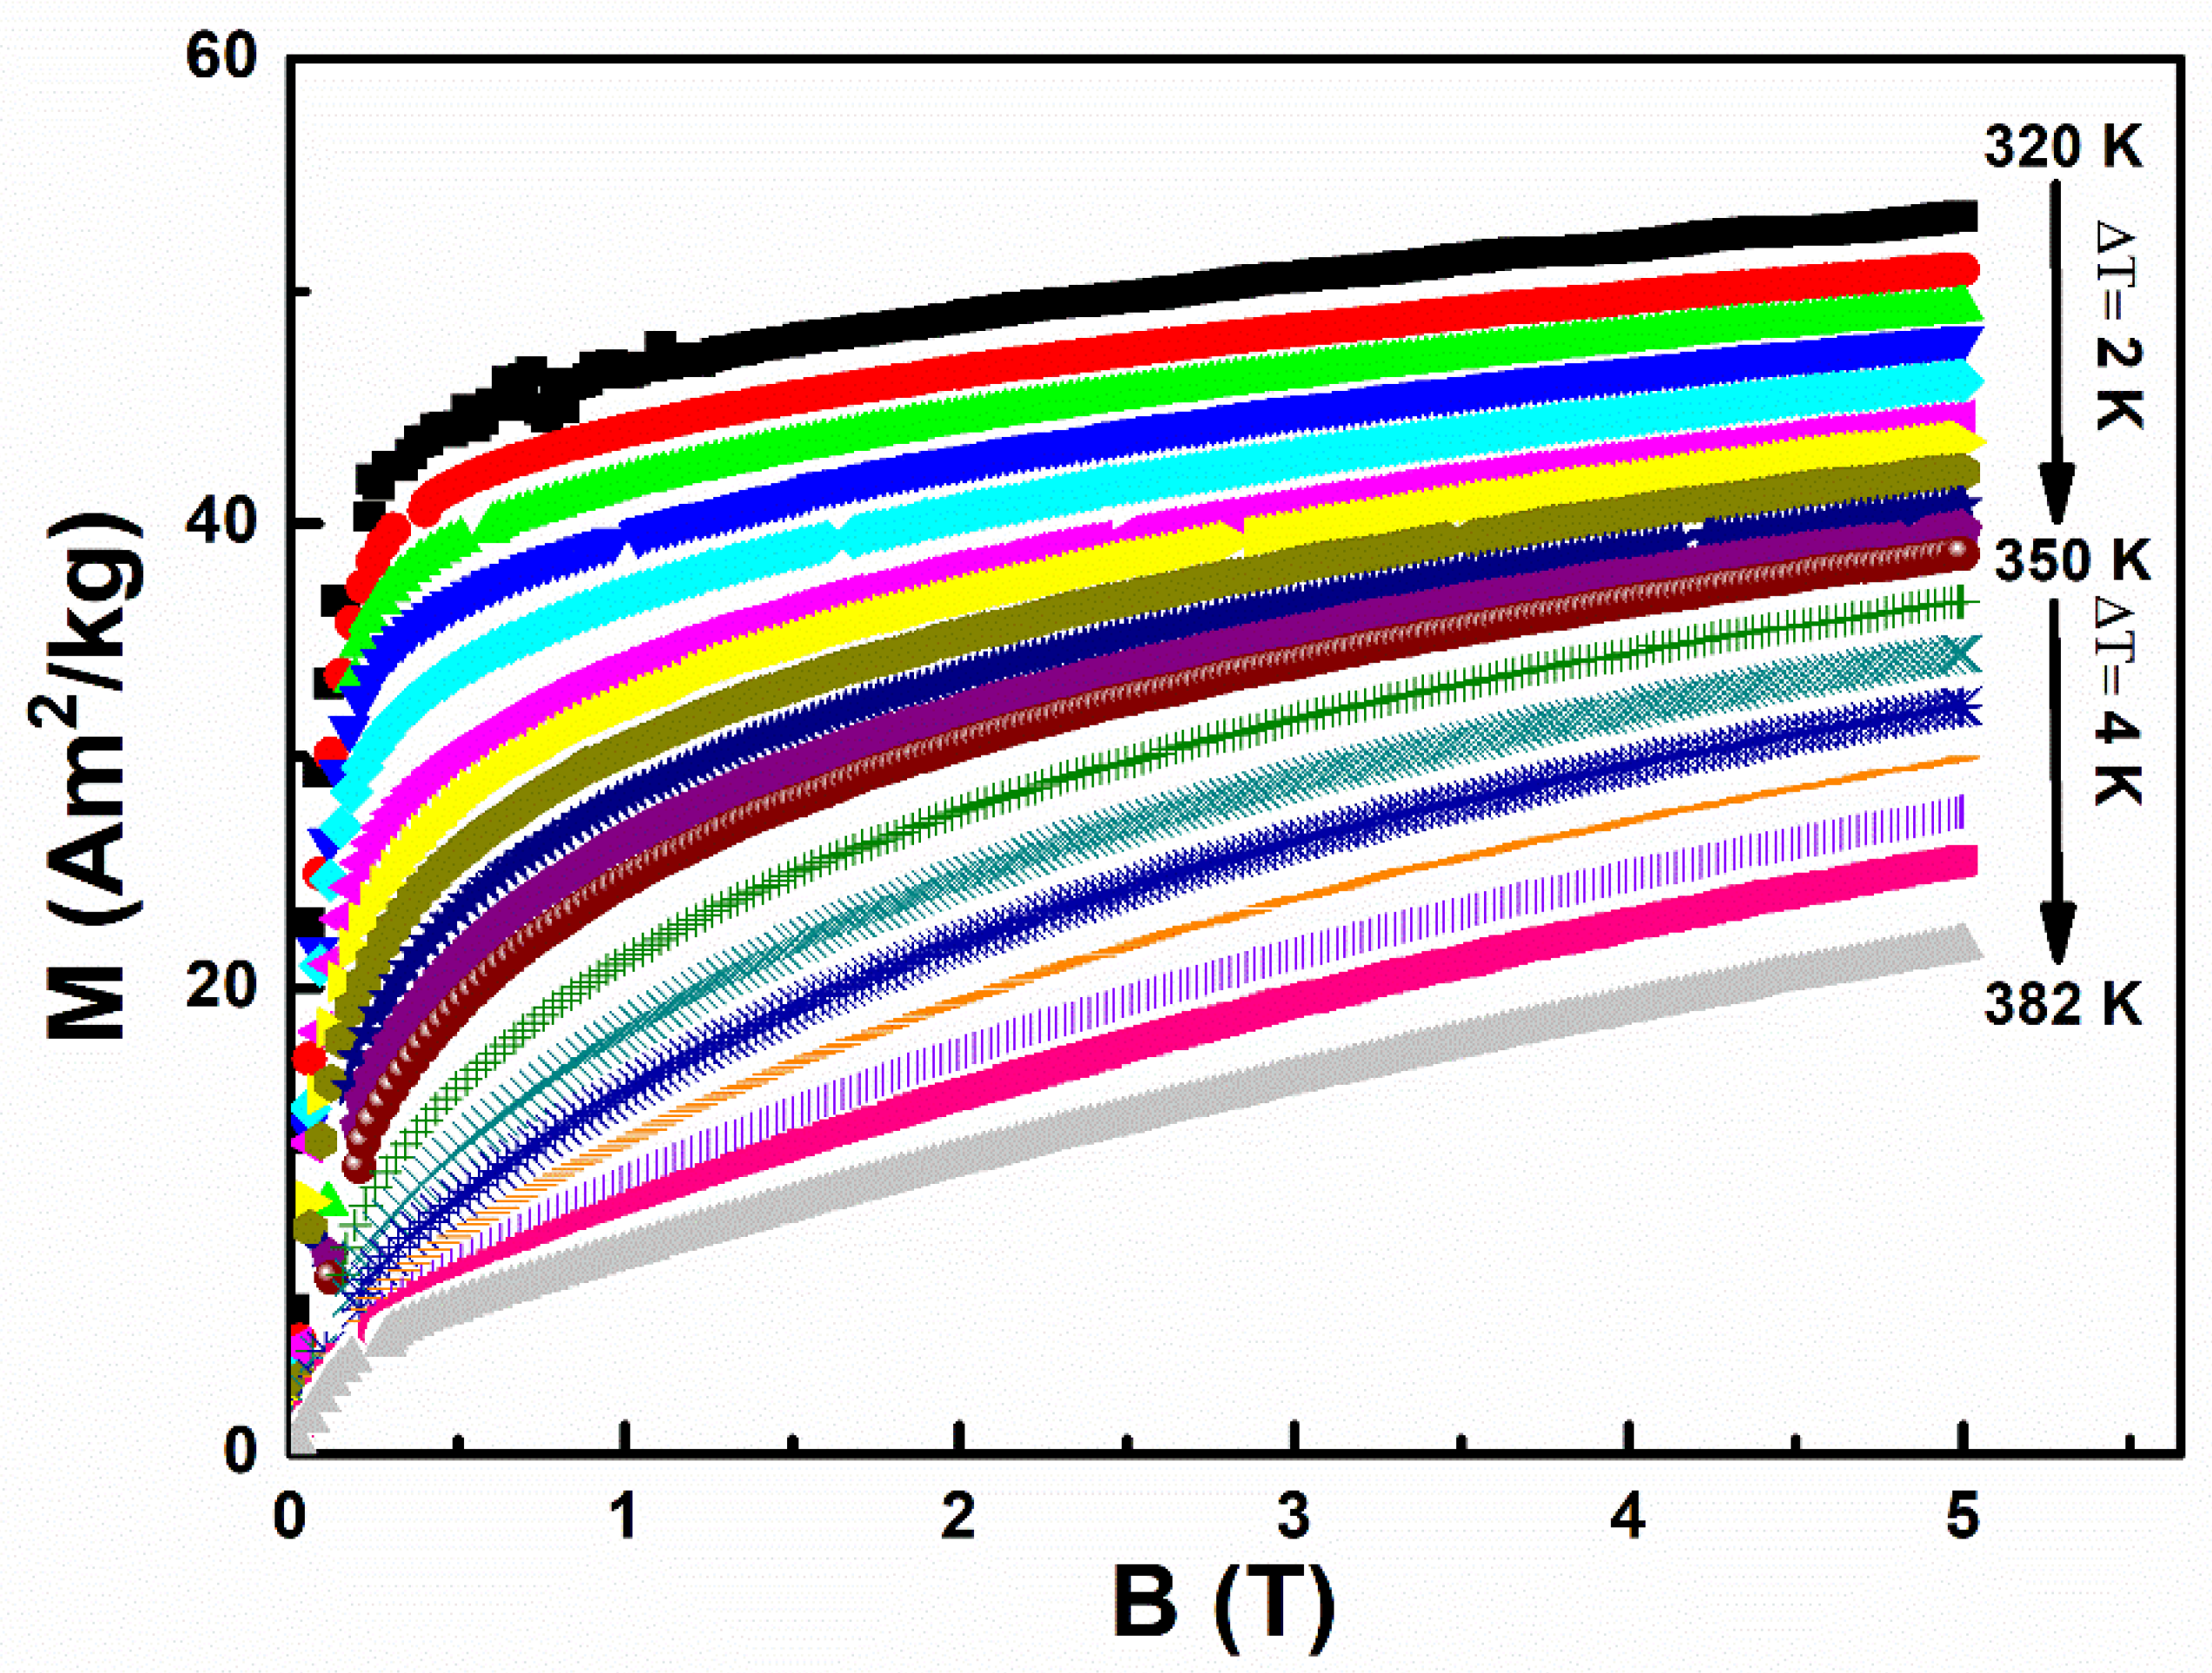
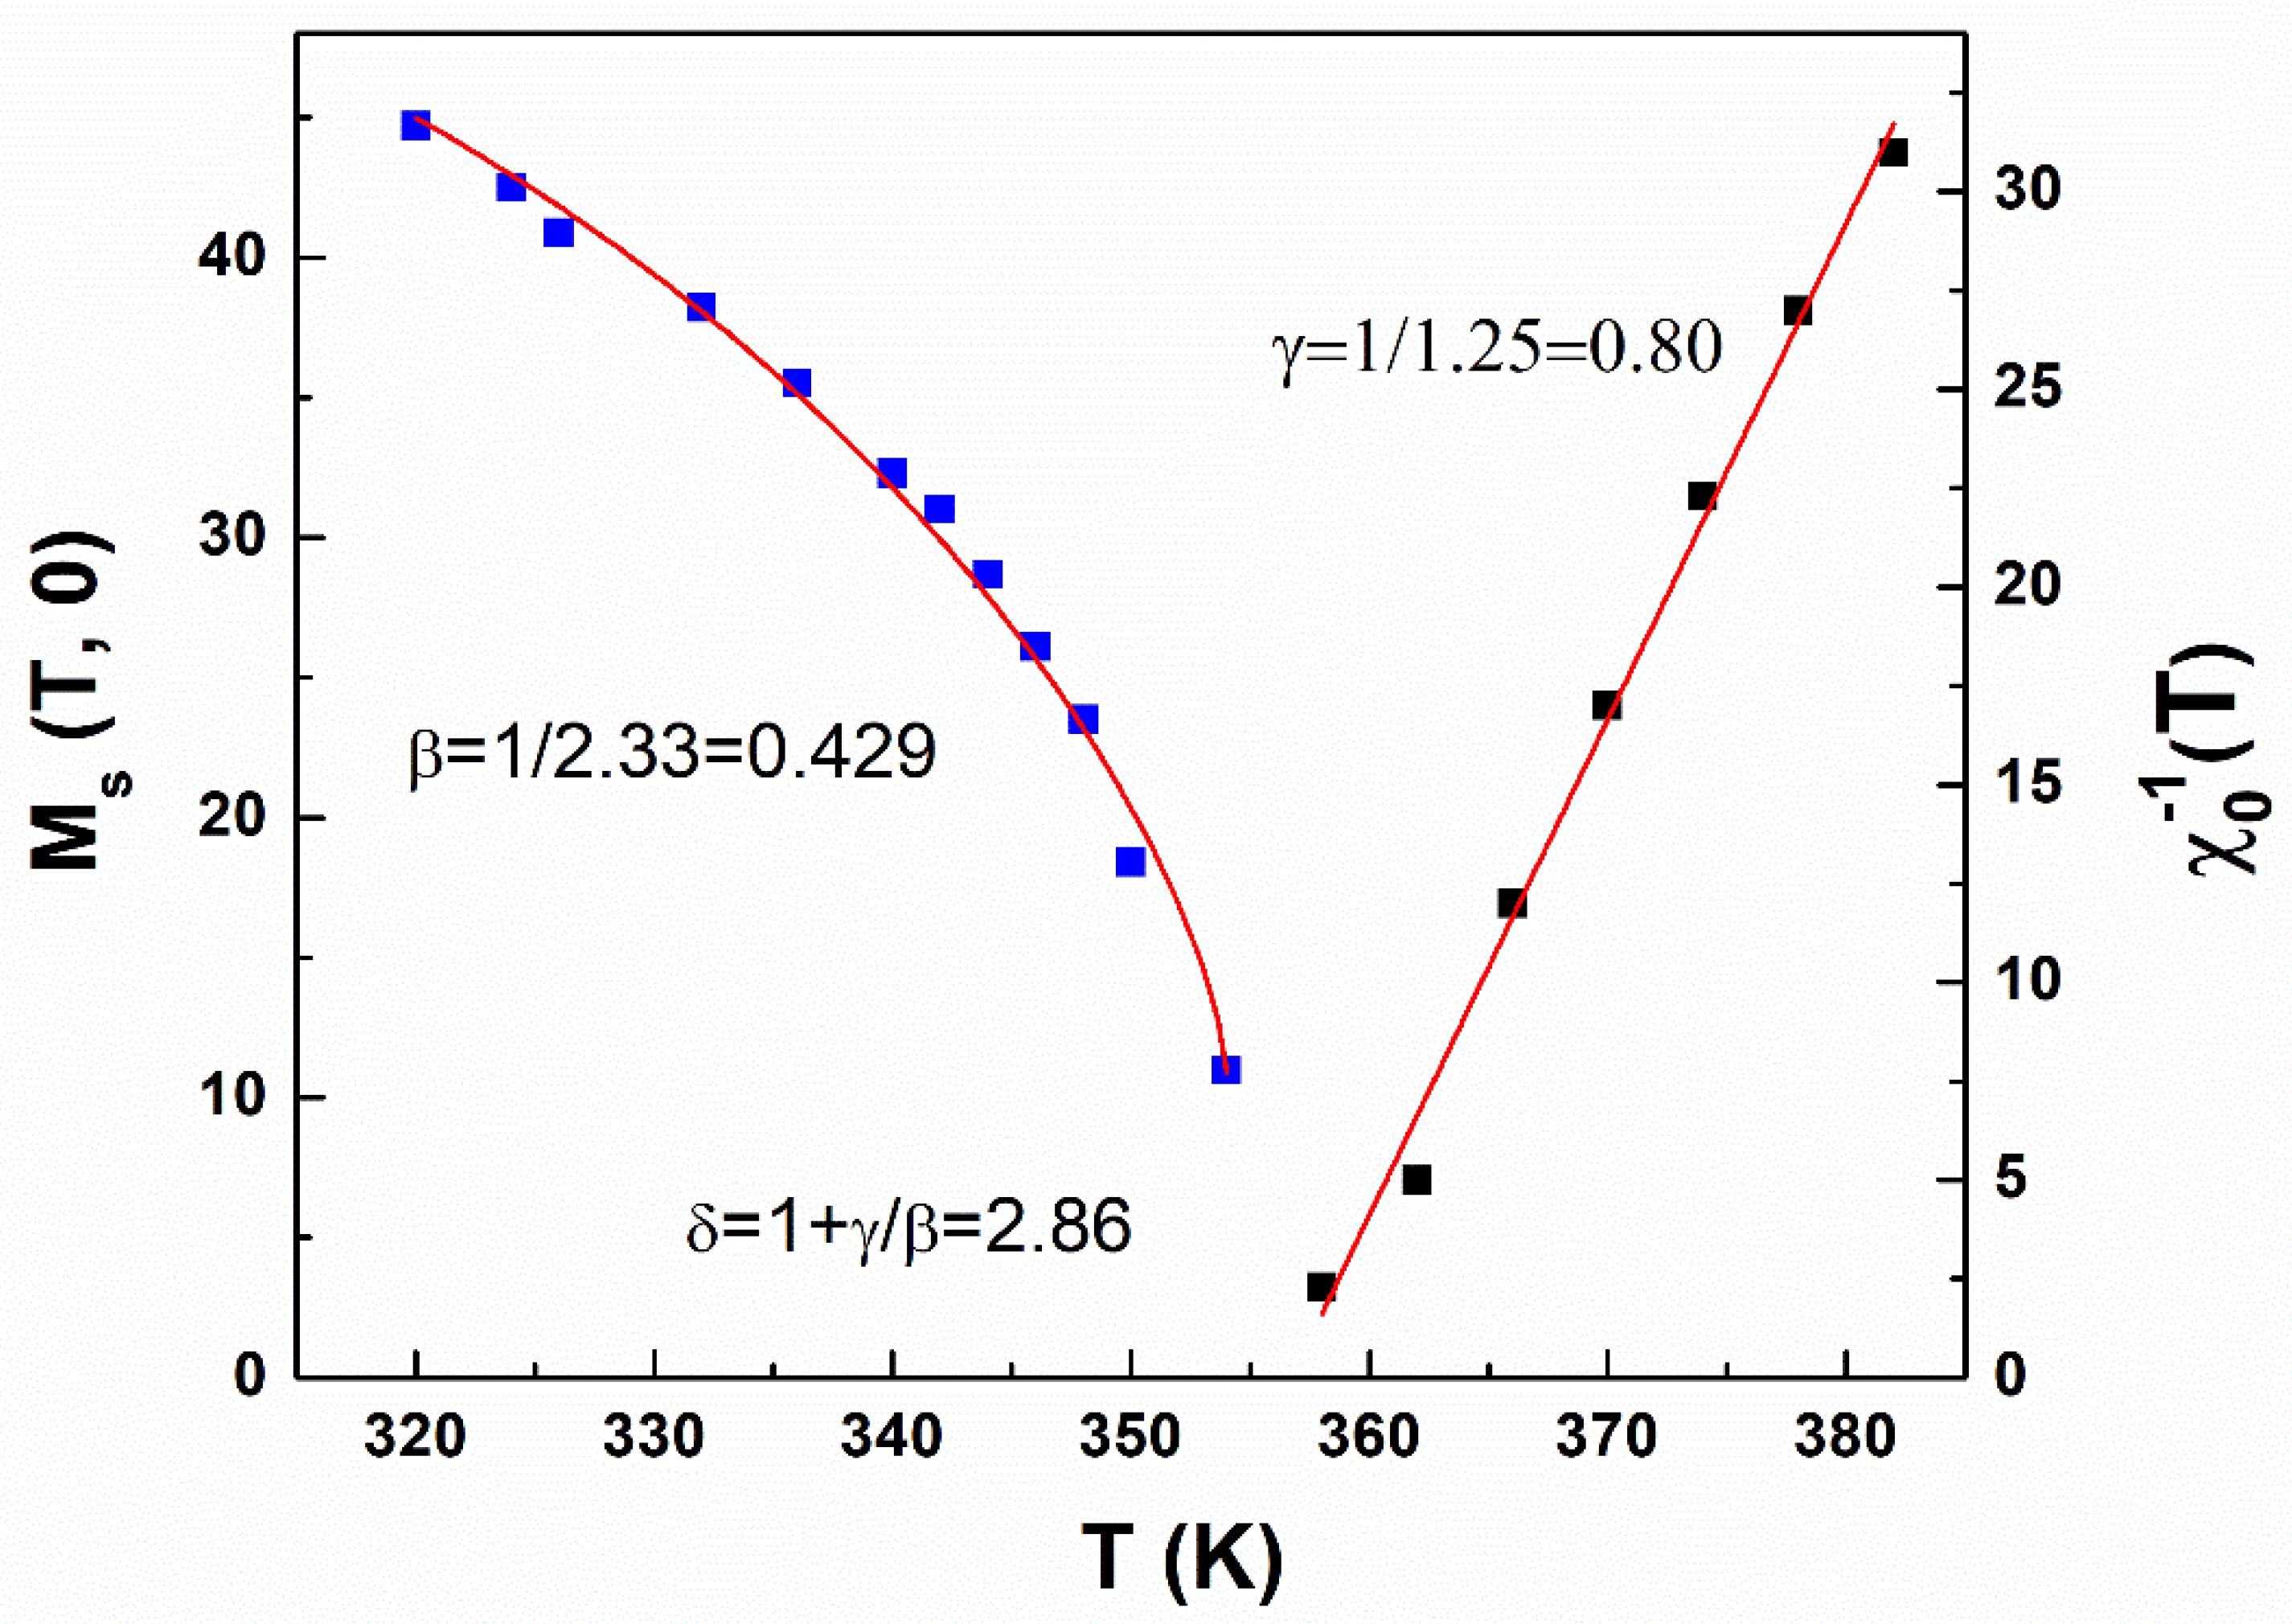
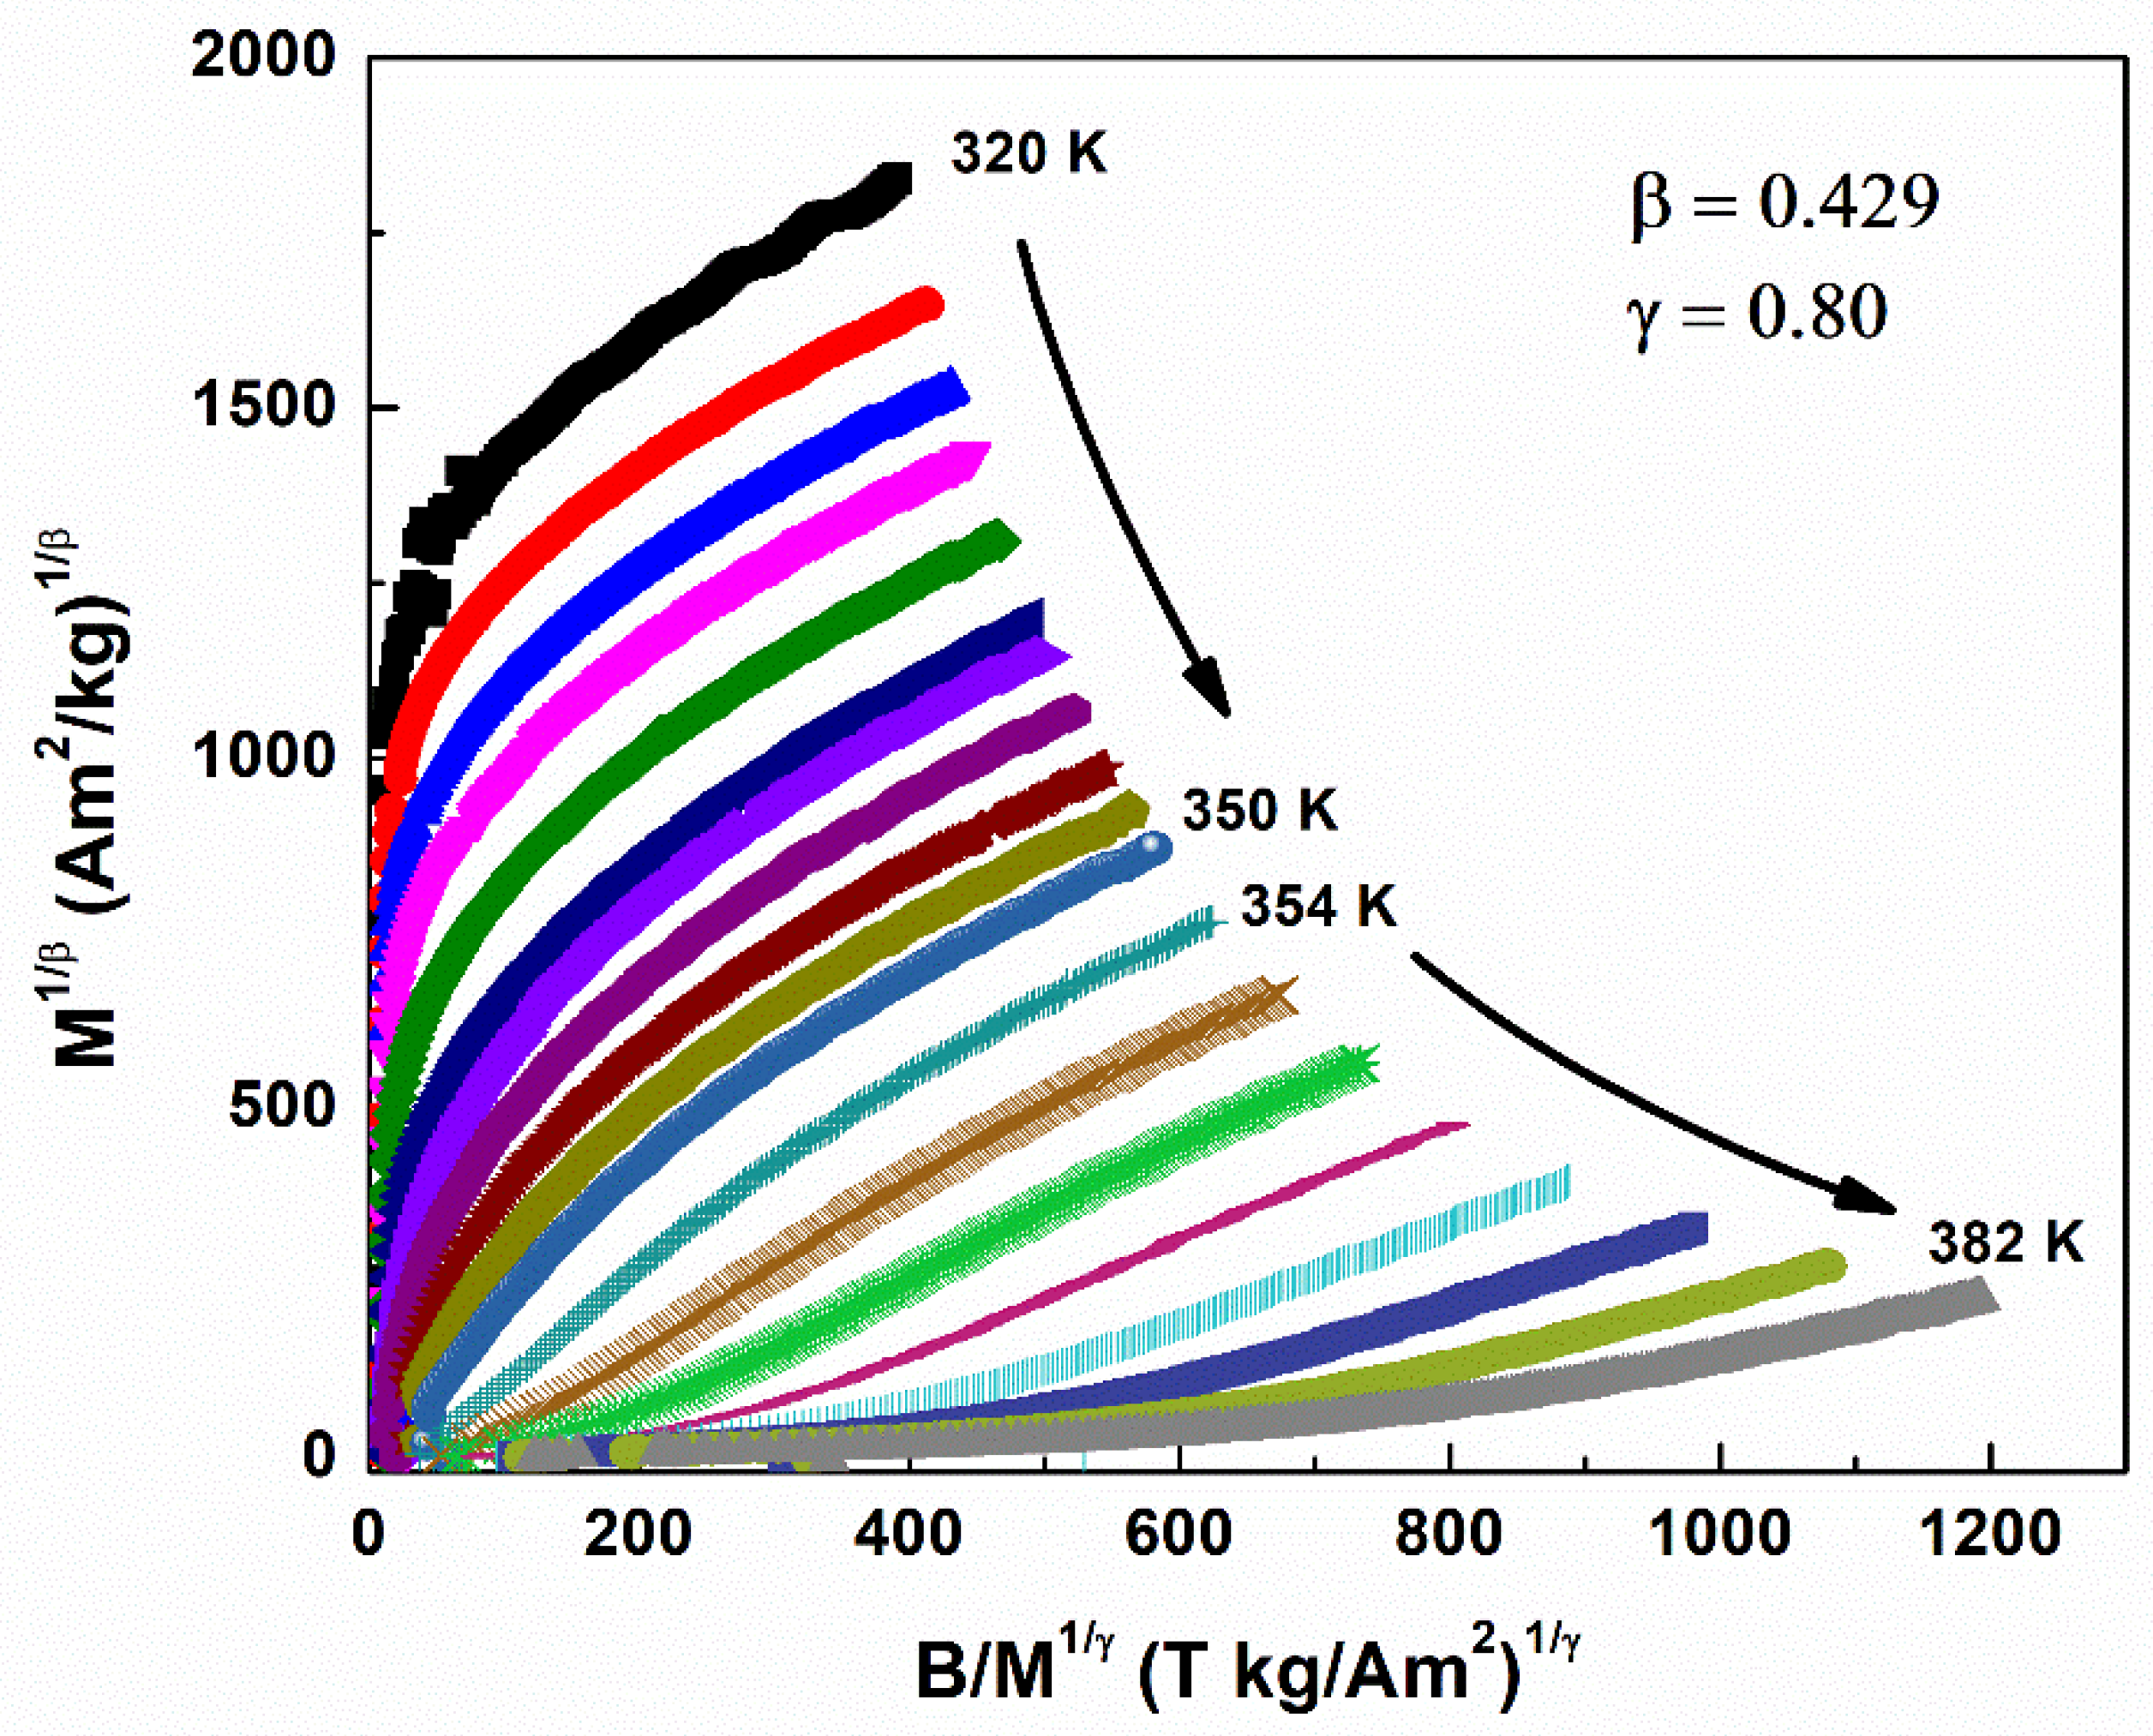
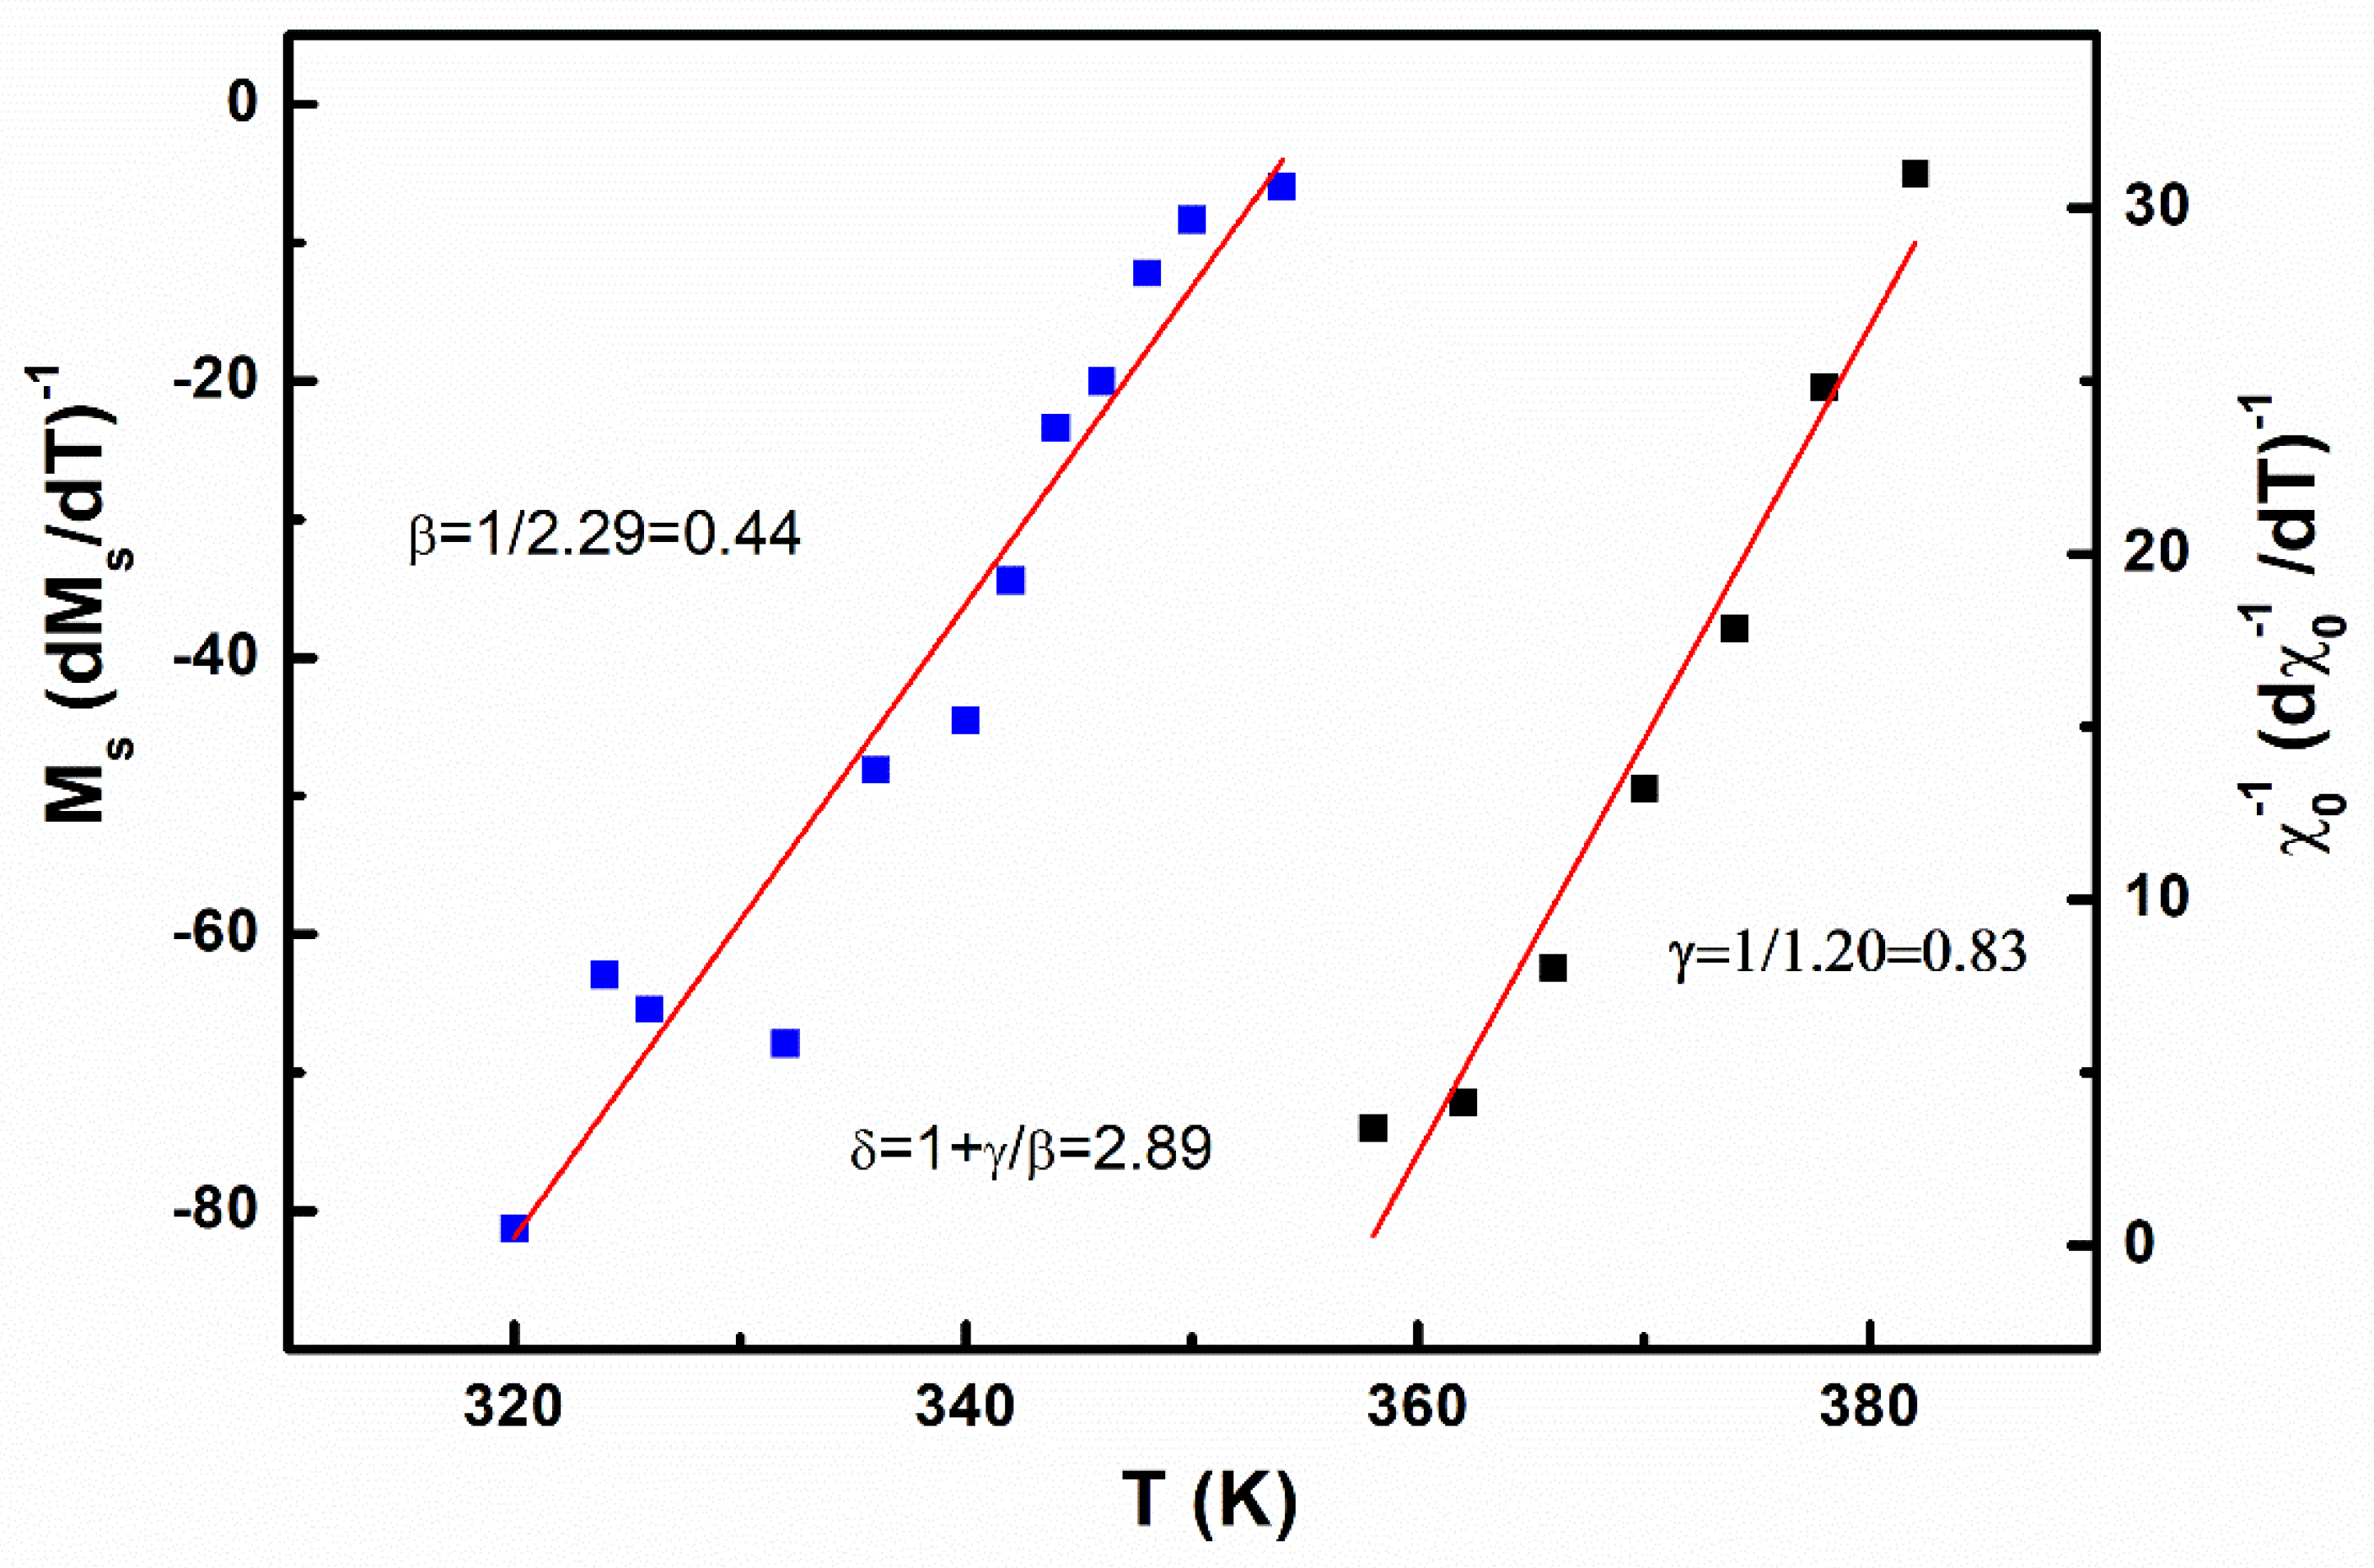
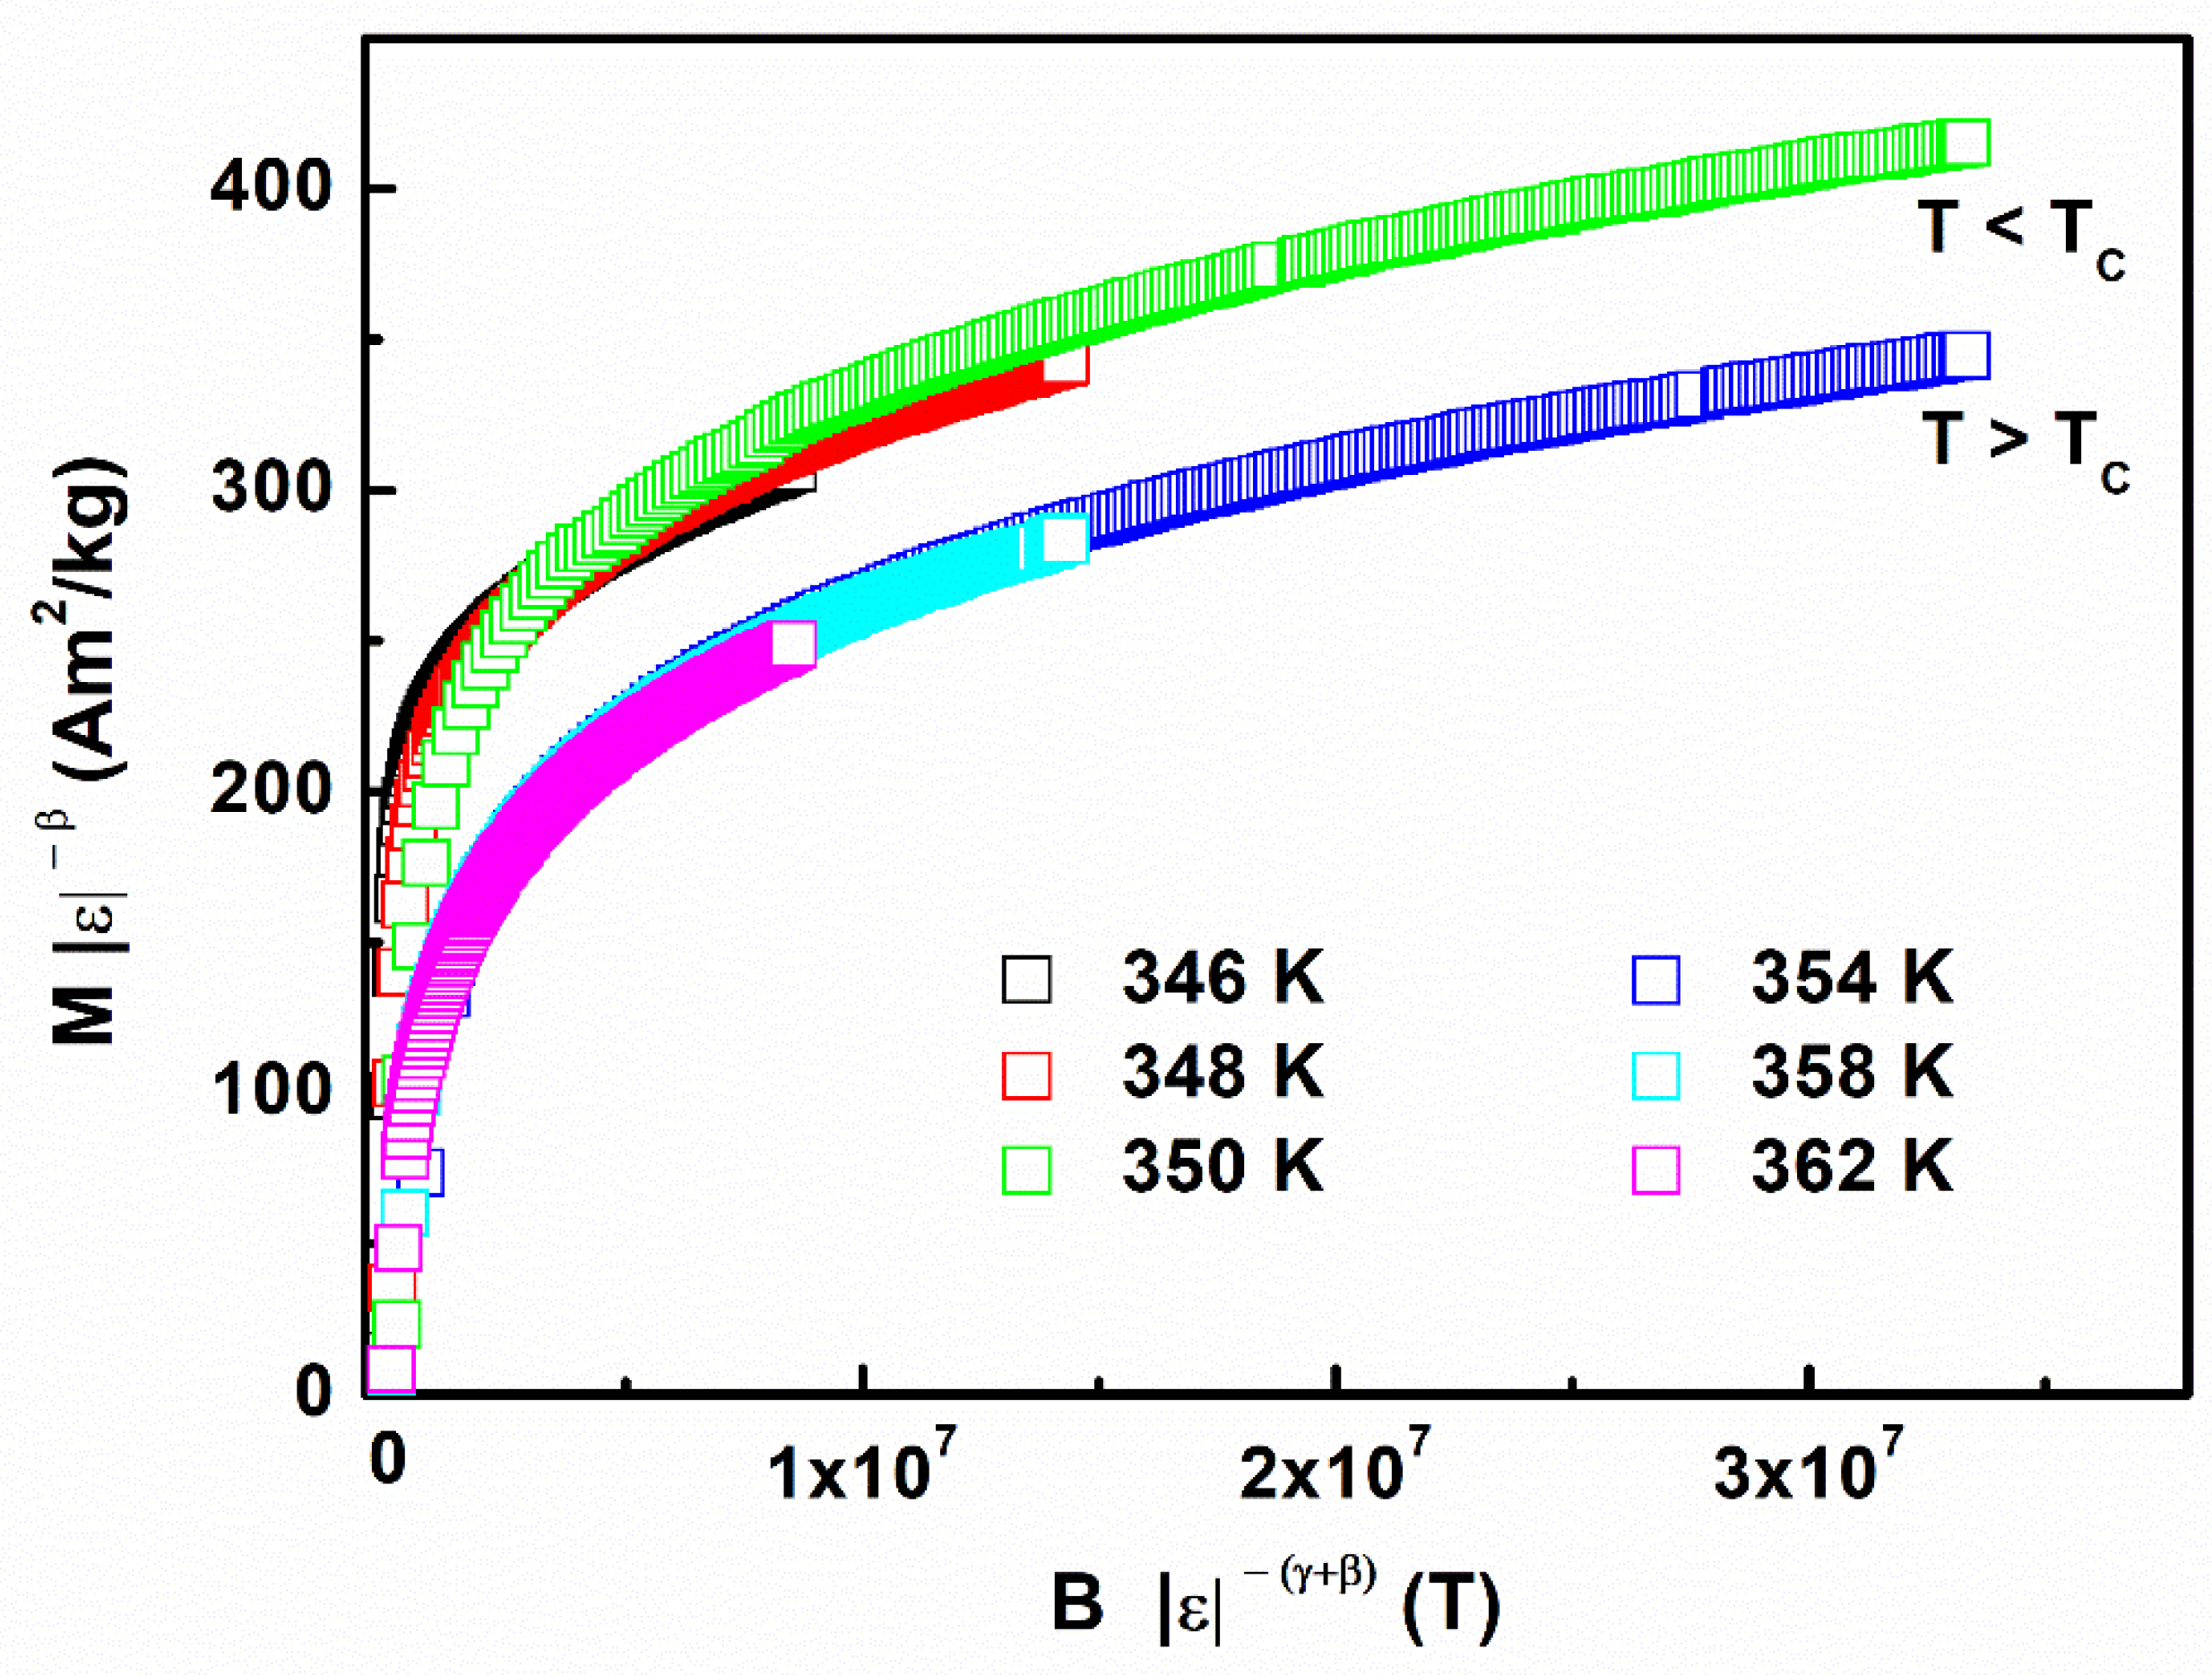
3.3. Critical Exponent Analysis

The critical behaviour was analyzed near the TC value for the MnCoGe0.97Al0.03 compound to further define the transition behaviour of the FM-PM phase. Figure 3 shows the measured isothermal magnetization against the applied field around TC at 4 K and 2 K intervals. The isotherm plot determines the magnetic transition order according to the proposed criterion outlined by Banerjee [25]. Figure 4 shows the standard Arrott plot of B/M versus M2 at temperatures close to TC. A negative slope of the B/M versus M2 curves indicates a first-order transition, while a positive slope shows a second-order transition. Second-order phase transition is observed during the transition temperature range when there is a constant positive slope of the B/M for the MnCoGe0.97Al0.03 compound. The consistency with the magnetic and thermal hysteresis near the PM of the results is confirmed by the second-order transition’s nature. A second-order magnetic phase transition near TC that is described by critical exponents such as β, γ, and δ was suggested by the scaling hypothesis [23].
Several methods were employed to study the critical behaviour of the MnCoGe0.97Al0.03 compound, such as the modified Arrott plots (MAPs), critical isotherm analysis, Widom scaling relation, and the Kouvel–Fisher method. The MAPs method was the first to compute the critical components derived by the Arrott–Noakes state equation [23]. The following equations were used to make quantitative fits to the Arrott plots [26].
M S ( T ) = lim ( H 0 ) ( M ) = M 0 ( ε ) β , ε < 0
χ 0 1   ( T ) = lim ( H 0 ) ( H M ) = ( h 0 M 0 ) ε γ , ε > 0
In the equations, the reduced temperature (=(TTC)/TC) is given by ε while M0 and h0 parameters are constant. β and γ initial values were chosen before the plot of M1/β versus (B/M)1/γ where the linearly extrapolated curve intersection with the M1/β axis is then obtained. This was done to determine the spontaneous magnetization, MS. The mutually misaligned magnetic domains tend to cause linearity deviation of the MAPS at low fields. Thus, it should be critical that only the linear region of the high field is used [27].
Next, the MS (T, 0) against temperature χ 0 1   ( T ,   0 ) was plotted and fitted using Equations (1) and (2), as shown in Figure 5. New MAPs were then constructed using the new critical exponent values. Critical parameters of γ = 0.80 and β = 0.429 were yielded by the MAPs shown in Figure 6 using Equations (1) and (2).
The critical exponents β and γ can be determined more accurately by using the Kouvel–Fisher (KF) method [27] using Equations (3) and (4) as depicted below:
M S ( T ) d M S ( T ) d T = T T C β
χ 0 1 ( T ) d χ 0 1 ( T ) d T = T T C γ
As can be seen in Figure 7 and according to Equations (3) and (4), slopes of 1/β and 1/γ can be achieved by plotting M S ( T ) [ d M S d T ] 1 and χ 0 1 ( T ) [ d χ 0 1 d T ] 1 against temperature. The interception of the lines on the x-axis was used to obtain the TC value. The Kouvel–Fisher method was used to obtain the following parameters of critical exponents and TC: β = 0.44; γ = 0.83; δ = 2.89; and TC = 352 K. The MAPs were utilized to calculate the β and γ: critical exponents. The values from the KF method match well with the values obtained using the MAPs method when a comparison is made. The critical isotherm M (TC, H) can directly determine the critical component δ value based on Equation (5):
M T C = D H 1 δ ,   ε = 0 , T = T C
The Widom scaling relation is an alternative in obtaining the critical exponent δ. This can be seen in Equation (6):
δ = 1 + γ / β
The MAPs and Kouvel–Fisher methods were employed to obtain the critical parameters β and γ. By combining the critical parameters with Equation (5), the δ values were deduced to be 2.89 and 2.86, separately. Hence, the experimental data that were used to deduce the critical exponent confirmed its reliability using the Widom scaling relation. The scaling theory can be used to confirm the reliability of the exponents β and γ that were calculated. According to the scaling theory in the critical region, the state magnetic equation can be expressed as:
M   ( H ,   ε ) = ε β f ±   ( H ε β + γ )
where the reduced temperature is given by ε and the typical critical functions above and below TC are given by (TTC)/TC and f+ and f. The M/εβ versus H/ε(β+γ) plots that can be seen in Figure 8 produced two universal curves from the β and γ values that were obtained by using the Kouvel–Fisher method: one curve for temperatures above and the other below the TC, which agrees with the scaling theory. Hence, the acquired critical exponents and TC values were confirmed to be reliable and agreed with the scaling hypothesis.
It is generally known that the phase transition’s order parameter within the magnetic transition temperature fluctuates on all available length scales. The correlation in the continuous phase transition system’s microscopic details is spread over by these fluctuations [28]. The critical behaviour of the MnCoGe0.97Al0.03 compound around TC is dominated by long-range interactions in this compound, indicated by the closeness of the derived δ, β, and γ values to the mean-field values [29]. In the MnCoGe-based compound, the distance of Mn-Mn plays an important role in the magnetic transition. Thus, the competition between the localized Mn-Mn magnetic interactions should be responsible for the critical behaviour in the MnCoGe0.97Al0.03 compound as Al is diluted and does not contribute to the enhancement of the magnetic moment.
The isothermal magnetization near TC determined the MnCoGe0.97Al0.03 compound’s critical exponents. The critical isotherm analysis, Kouvel–Fisher method, and modified Arrott plots were among the various techniques this determination was based on. Additionally, all the critical exponents fulfilled the Widom scaling law criteria. The scaling Equation validates the calculated critical exponents with the acquired field, magnetization, and temperature data below and above TC, showing two different curves’ collapse. Hence, the calculated exponents were confirmed to be unambiguous and intrinsic. This was due to the magnetization data above and below TC scaling acquired by different methods using their specific critical exponents’ behaviour and the consistency in their values.

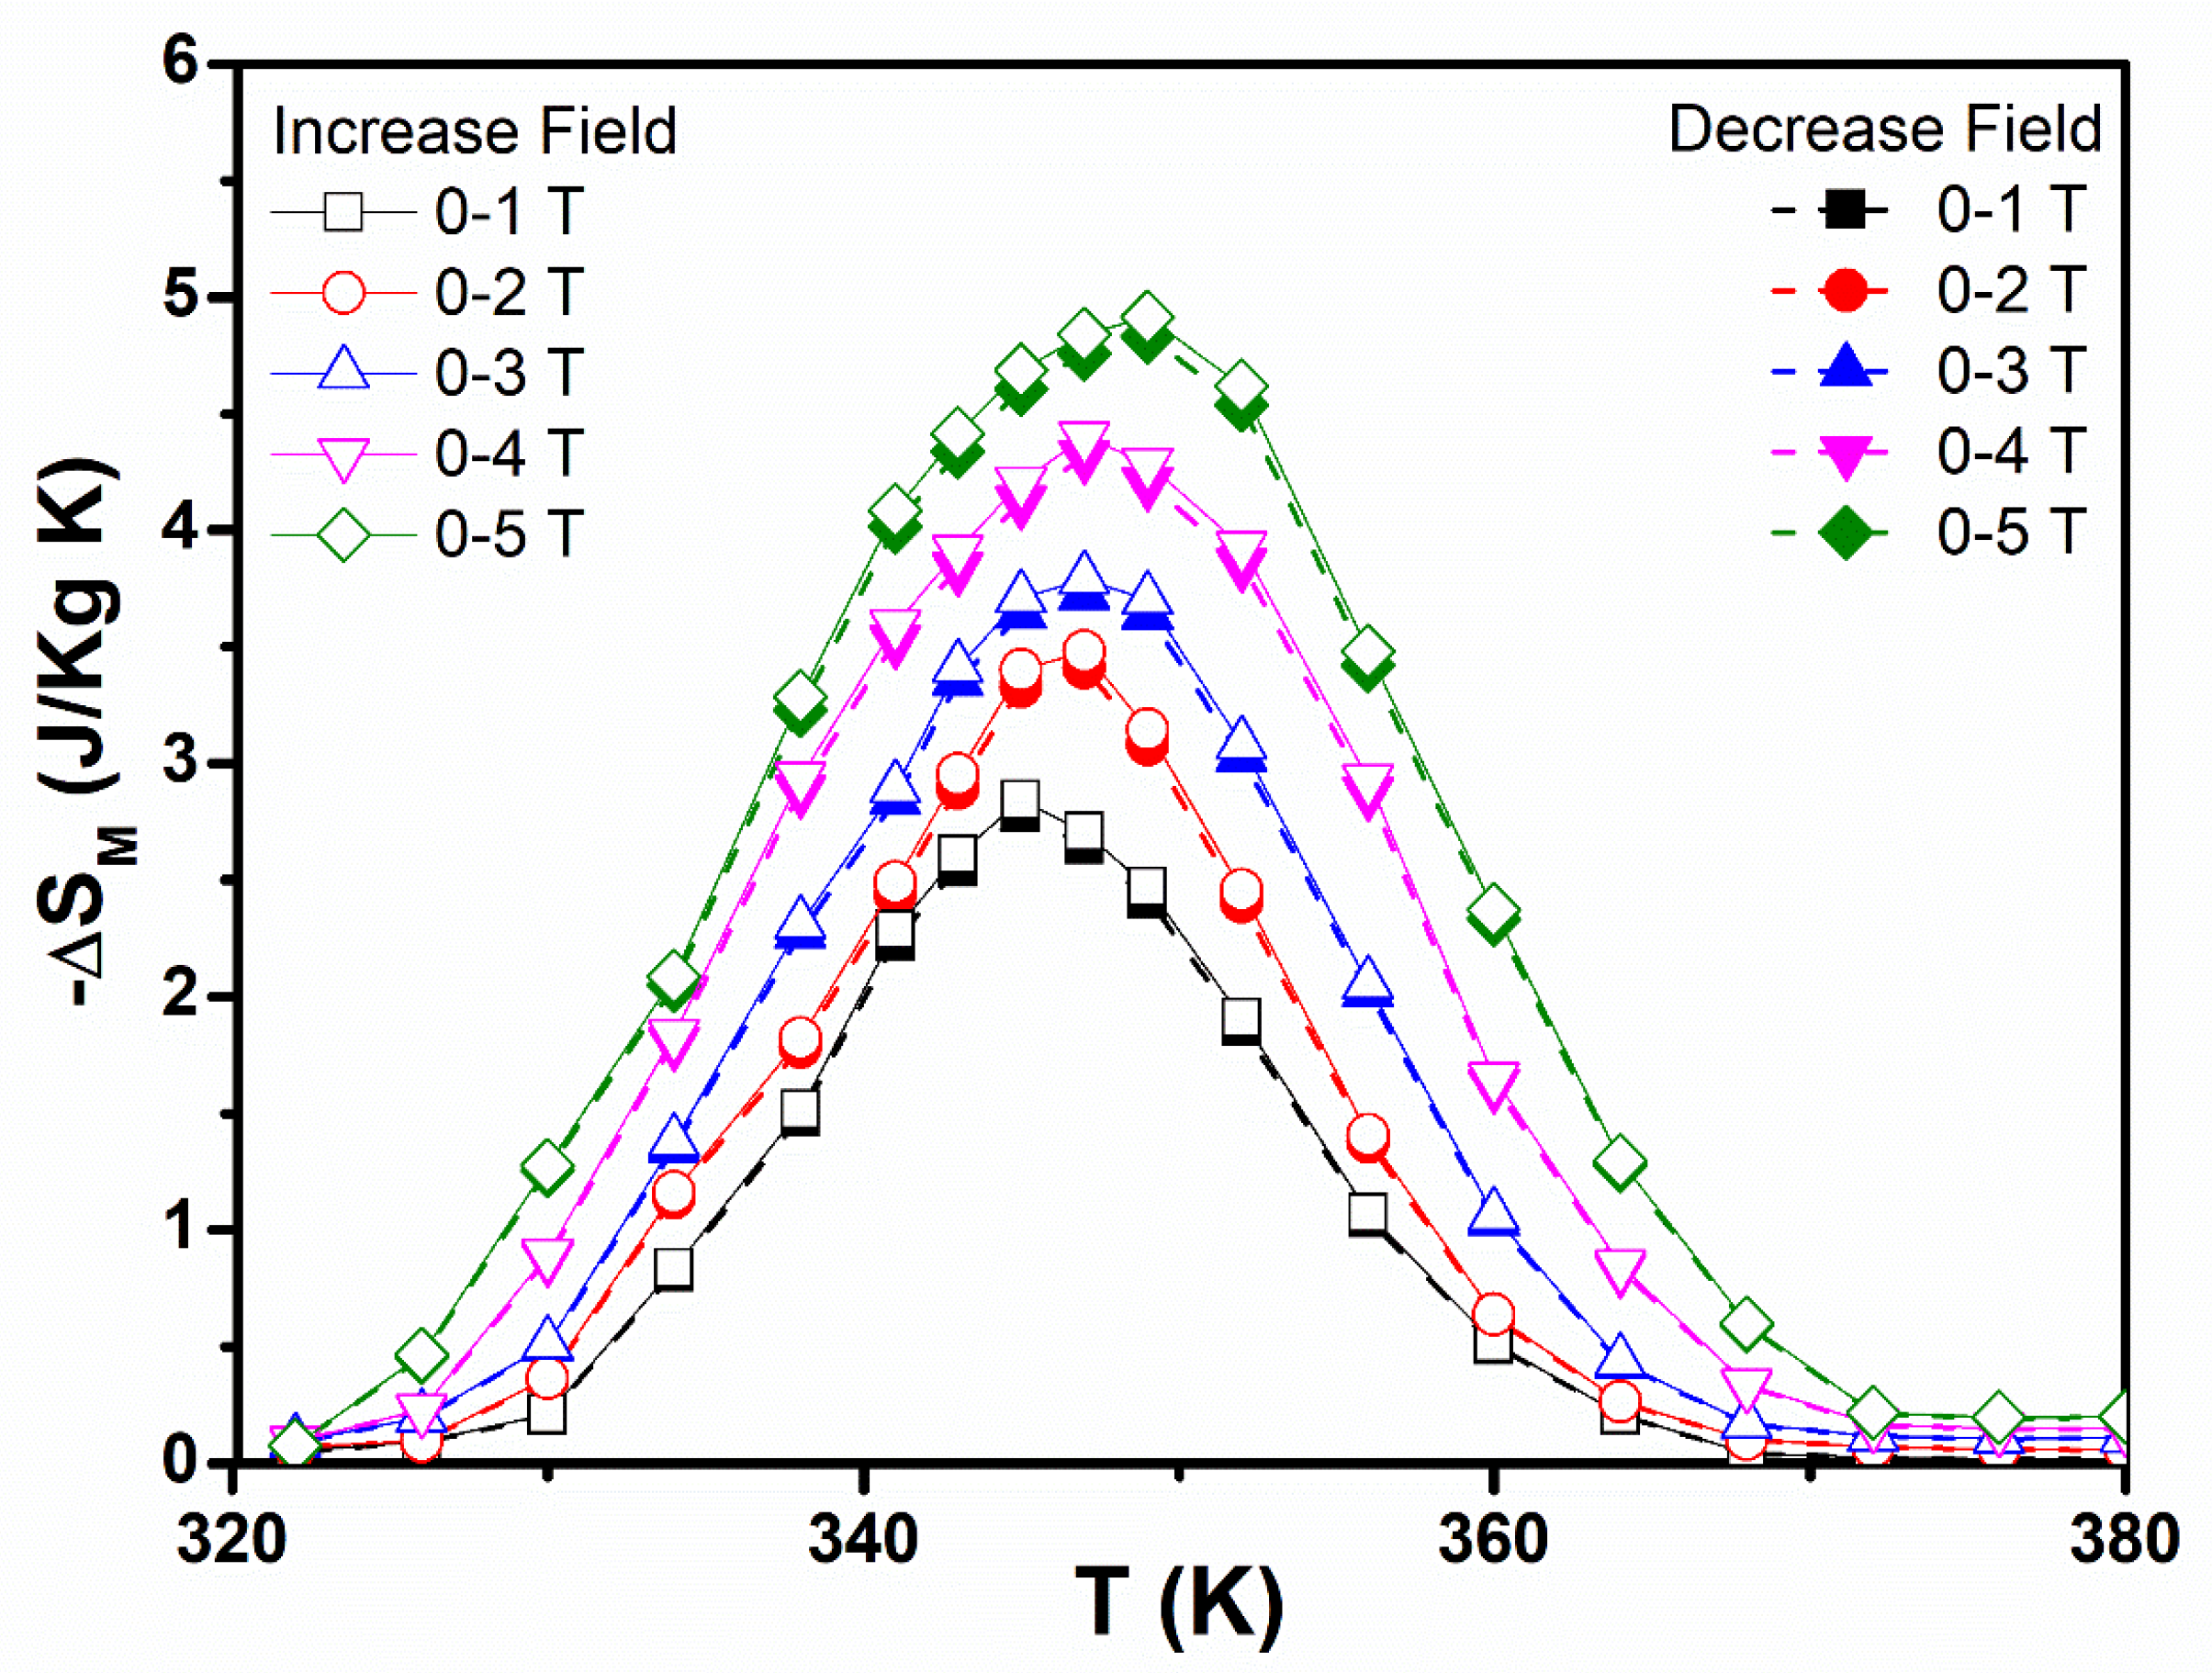
3.4. The Magnetocaloric Effect

The magnetization curves obtained for MnCoGe0.97Al0.03 (B = 0–5 T fields range) from the FM to the PM ordering temperatures are depicted in Figure 3. The decreasing and increasing fields’ data at 2 K and 4 K intervals that span at the TC range were obtained; as a result, evidence supporting the absence of magnetic hysteresis loss effects in second-order magnetic transitions was provided. Moreover, Figure 4 shows the corresponding Arrott plot (M2 versus B/M), which displays second-order transition features. This was particularly confirmed by the lack of S-shaped Arrott plots close to the TC and a positive sign of the coefficient c2 (T) in the magnetic free energy Landau expansion [15].
The magnetic entropy change, −∆SM, was determined for the MnCoGe0.97Al0.03 compound. This was performed by evaluating its magnetization curves for the increment and decrement field values within ΔB = 0–5 T field range. The standard Maxwell relation was applied to derive the magnetic entropy change [30]:
S M ( T , H ) = 0 H ( M T ) H ( d H )
With the uncertainty of using the first-order systems by Maxwell’s relation, a method to define the first-order system’s magnetic entropy change was achieved by Caron et al. using a decreasing field [31]. This case study used the decreasing field mode to evaluate the −∆SM magnetic entropy change. Figure 9 shows this by the closed symbol curves. There was no difference between the calculated −∆SM values of the increasing and decreasing fields when a comparison was made. Thus, no hysteresis that occurs close to the magnetic transition is confirmed to be lost. The magnetic entropy change maximal value is around 4.93 J·kg−1K−1 for MnCoGe0.97Al0.03 at 0–5 T field change.

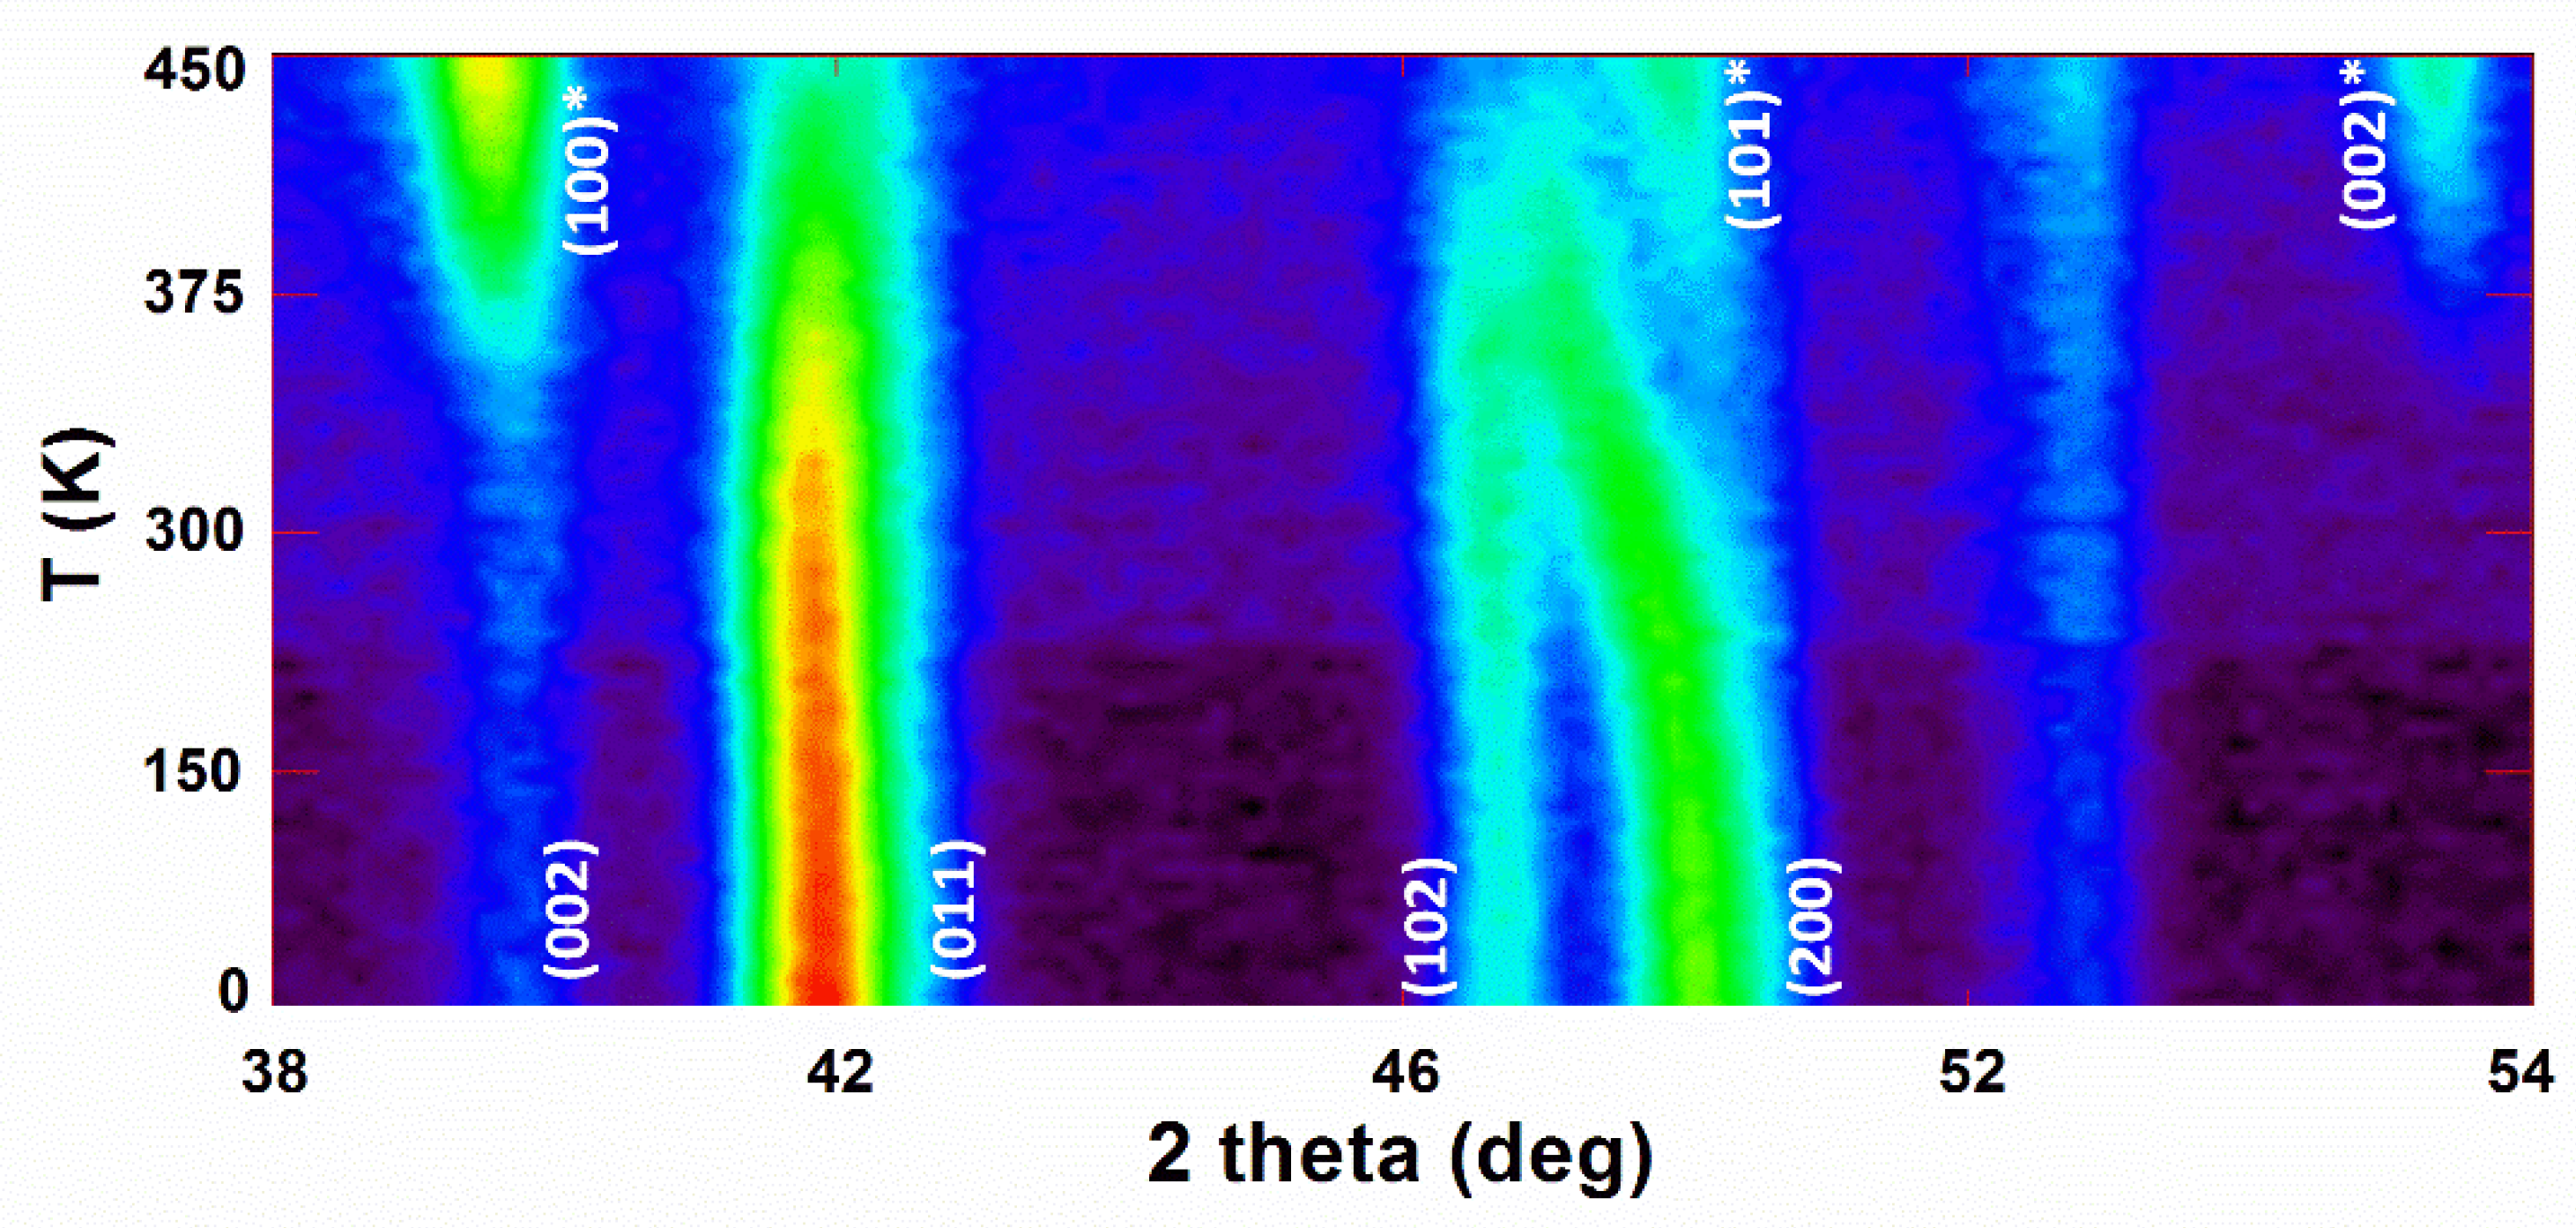
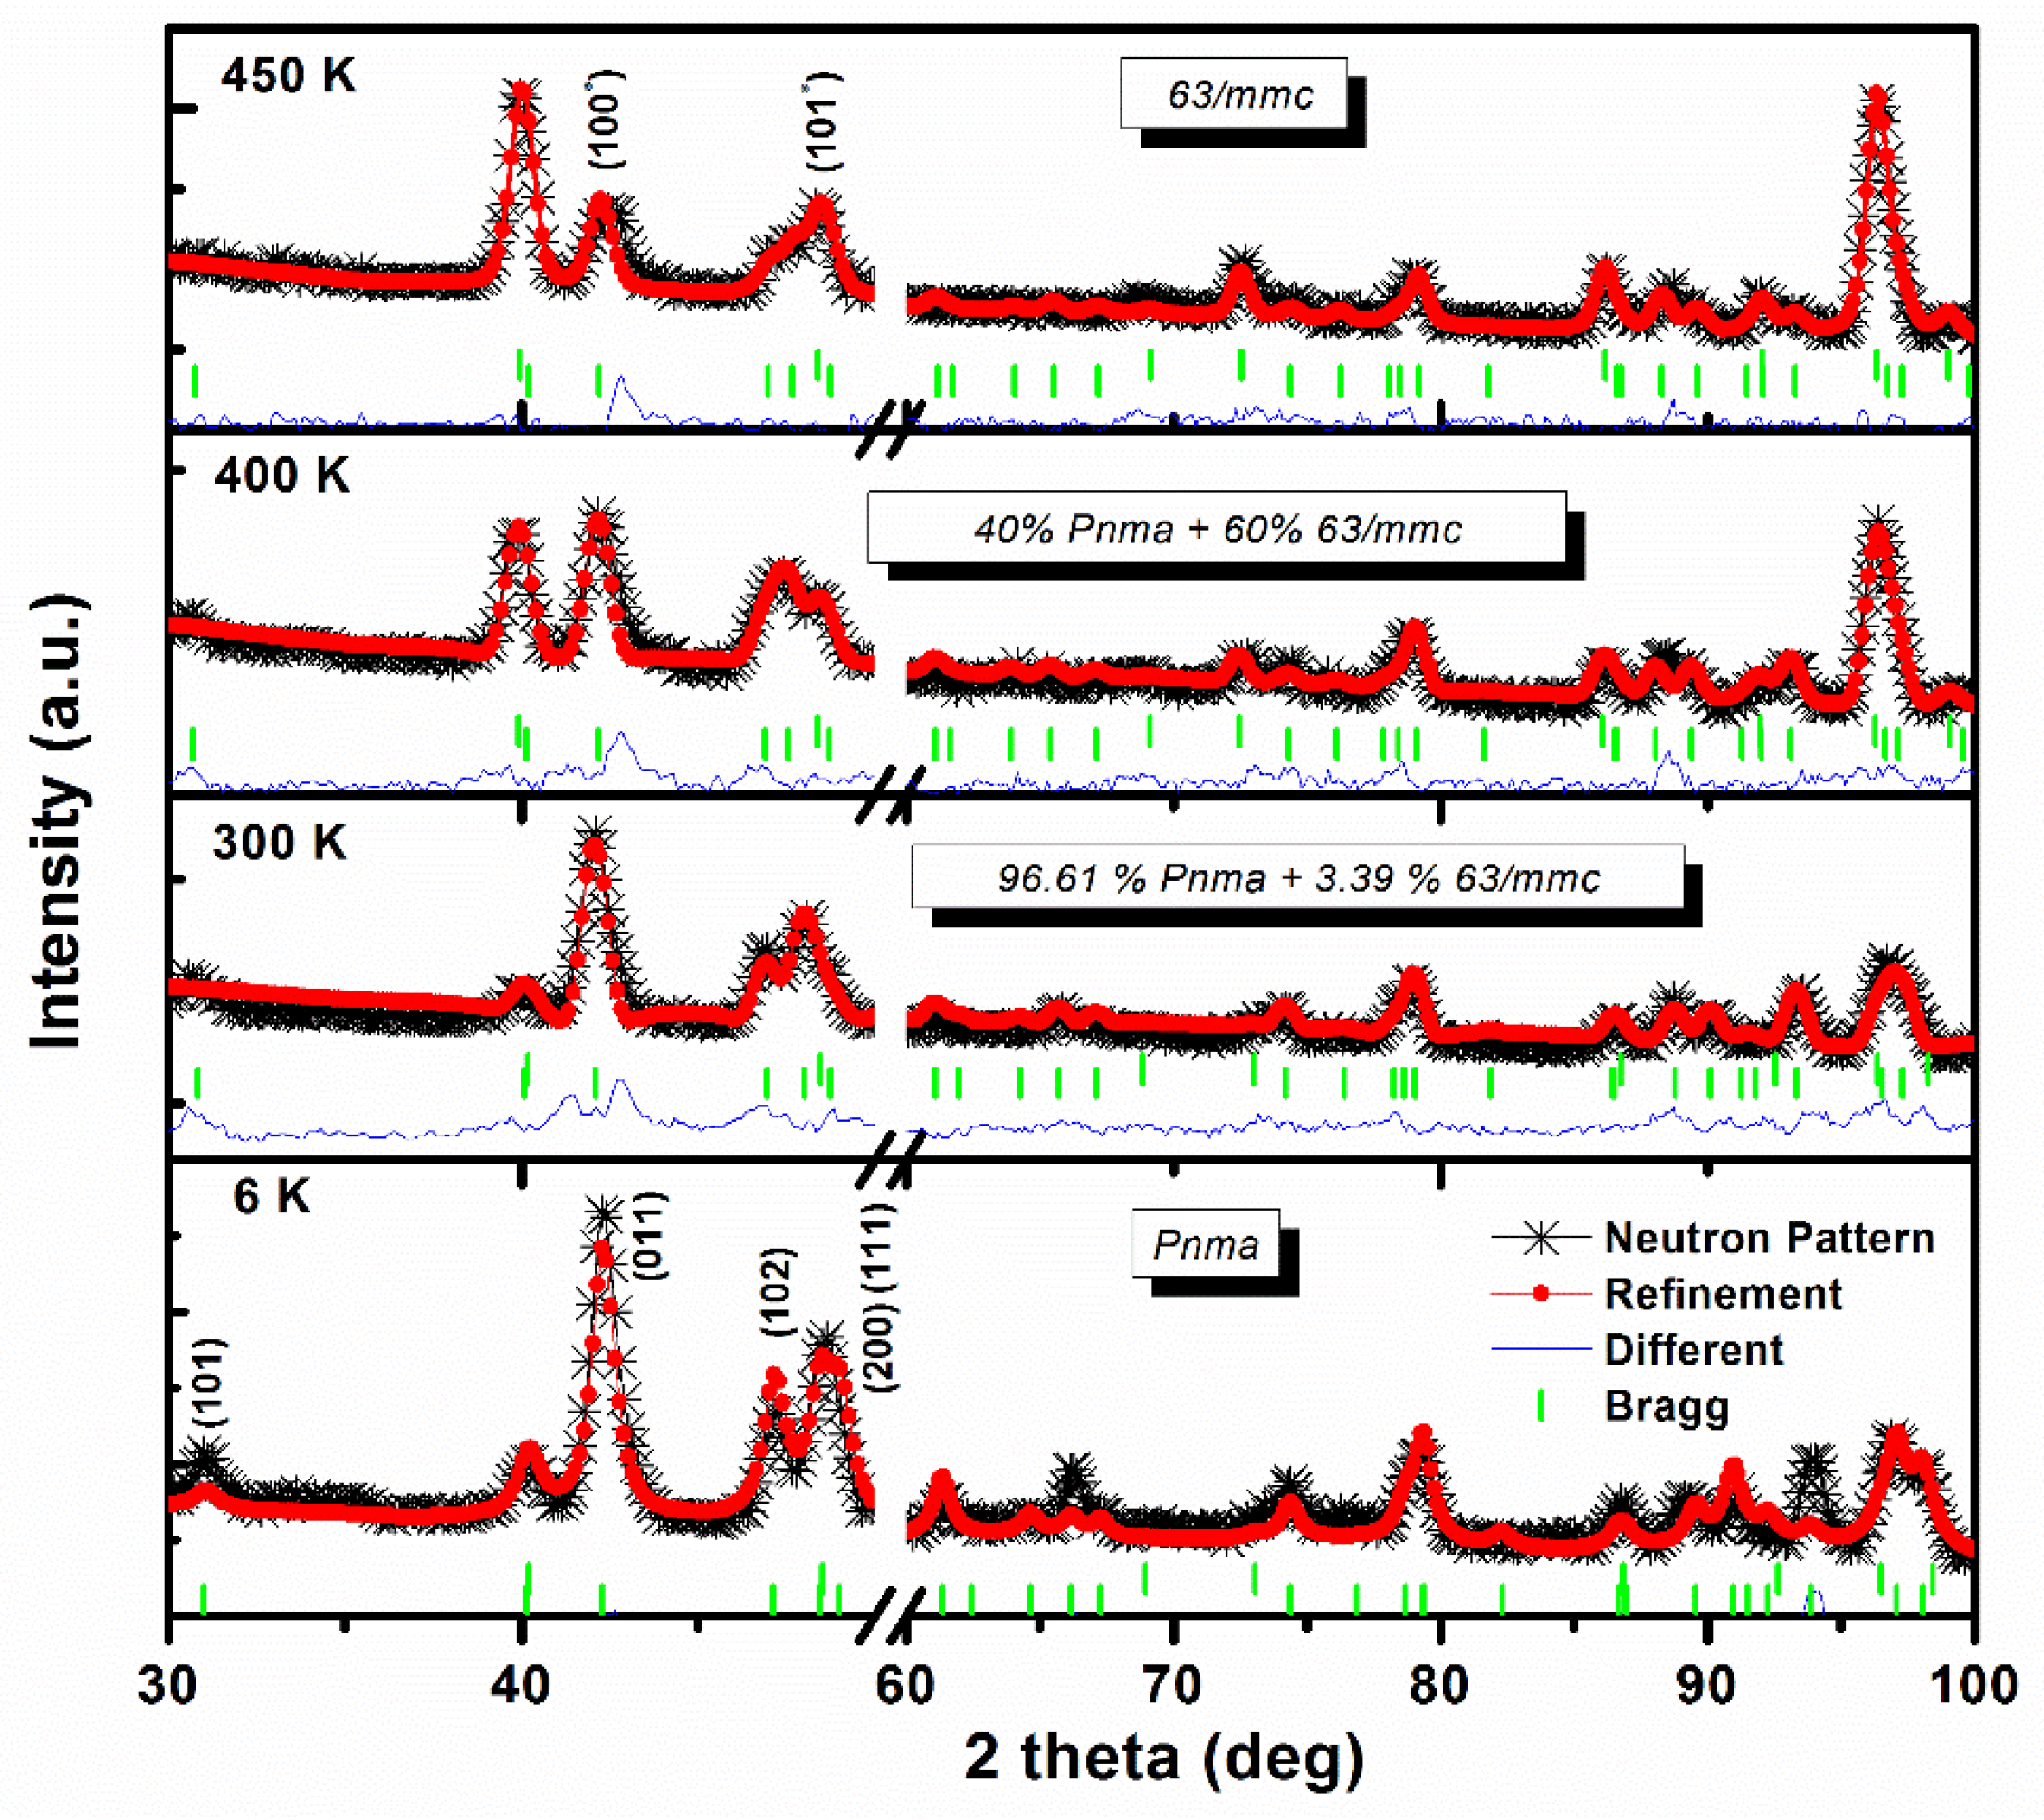
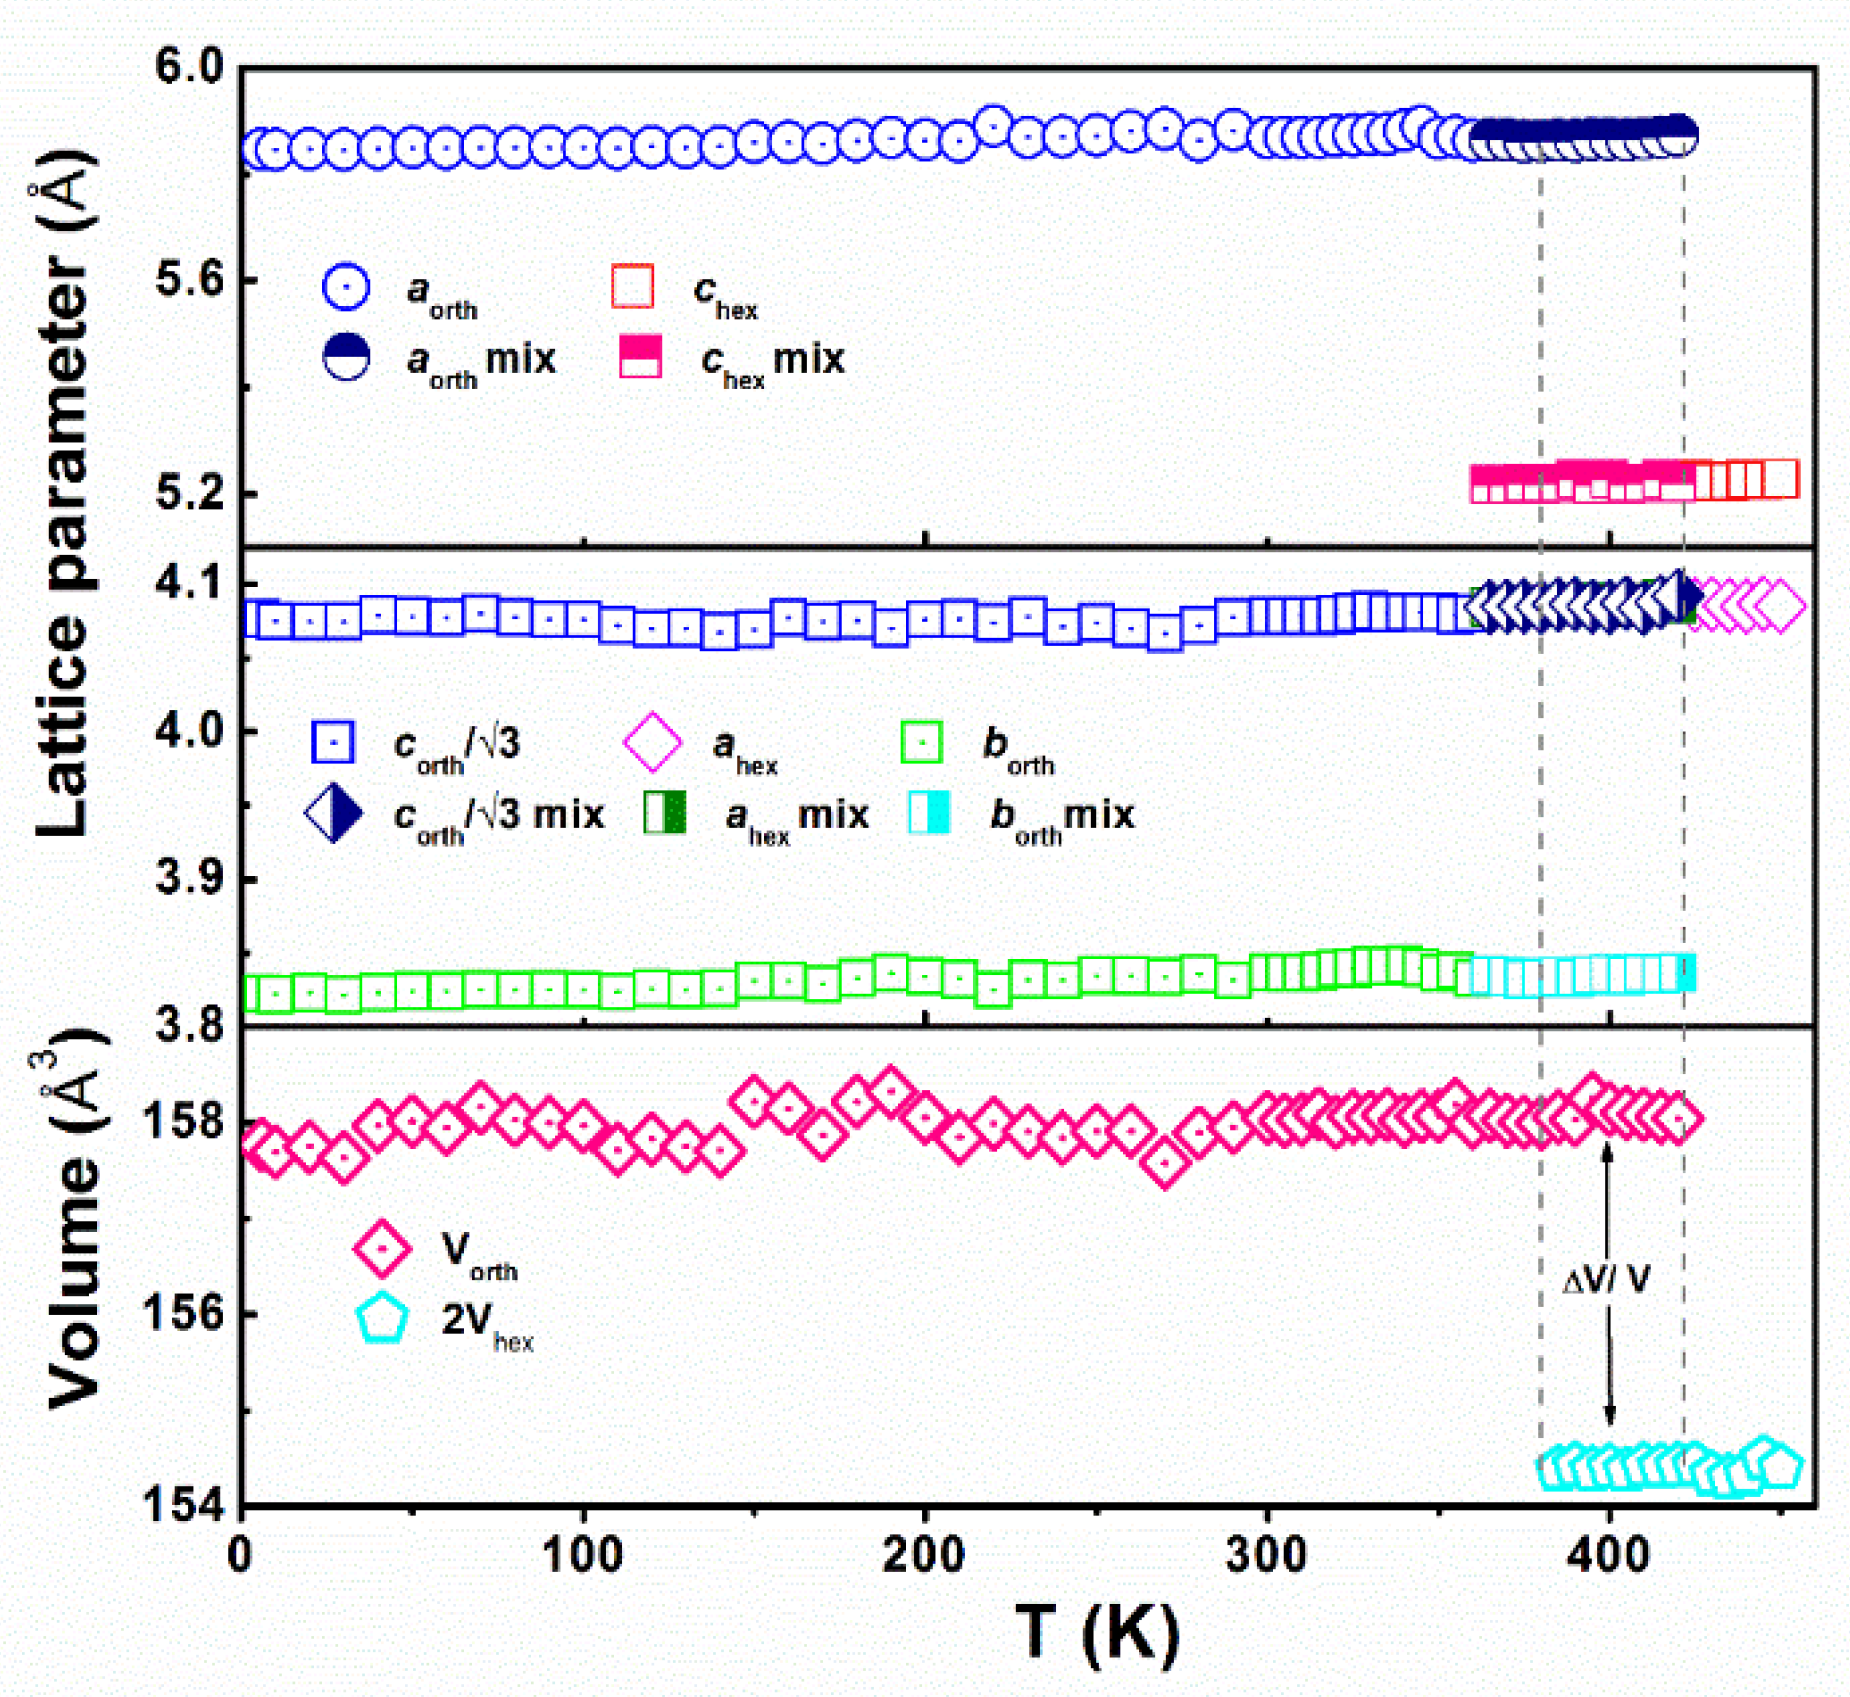
3.5. Neutron Diffraction

The neutron diffraction measurement contour plot of the MnCoGe0.97Al0.03 compound from 6 to 450 K is presented in Figure 10. The orthorhombic phase (space group Pnma) Miller indices (hkl) are not marked with the * symbol. The hexagonal-phase (space group P63/mmc) Miller indices (hkl) are marked with the * symbol. The decrease in temperature initiated a structural transition that started at a temperature of 430 K and ended at 350 K. The DSC and magnetic measurements coincided well. In addition, at around 420 K, a phase transition was revealed.
Tstr was slightly reduced to ~420 K when Mn was substituted for a small amount of Al (3 wt %). This is different compared to its parent compound, MnCoGe, that had its structural change at Tstr ≈ 450 K. To investigate the crystallographic behaviour of the MnCoGe0.97Al0.03 compound, the patterns of neutron diffraction were obtained at the chosen temperatures of T = 6 K, 300 K, 400 K, and 450 K, as in Figure 11. The neutron diffraction refinement patterns indicate that the compound crystallized into a hexagonal Ni2In-type structure (space group P63/mmc) at 450 K. At a minimum temperature of 6 K, there was a total crystal structure change to TiNiSi-type orthorhombic structure (Pnma). At the temperatures of 400 K (40(2.86) % Pnma + 60(3.65) % P63/mmc) and 300 K (96.61(0.66) % Pnma + 3.39(13.98) % P63/mmc), both phases existed at once, validating the magnetic measurement expectations. Hence, based on the results, the stability of the hexagonal P63/mmc phase was improved by replacing Al for Ge.
The neutron diffraction data were analyzed even further using the Rietveld refining method. This gave the output of the lattice parameters and the volume phase fractions: hexagonal and orthorhombic. Figure 12 shows the temperature against peak intensities of the reflections: (002)* (for P63/mmc); and (011) (for Pnma). The (011) reflection peak intensity decreased its value with temperature increase. The Pnma phase fraction decrement corresponds to this change. At the same time, the peak intensity of the (002)* value increased with temperature, which corresponds to the P63/mmc phase fraction increase with temperature. The structural parameters of the MnCoGe0.97Al0.03 compound that were refined from the neutron diffraction data are represented as a function of temperature in Figure 13. The denotations a = aortho = chex, b = bortho = ahex, c = cortho = √3ahex, and V = Vortho = 2Vhex [32] represent the unit cell volume and lattice parameters of the two structures. The Mn-Mn moments are seen to have exchanges in interaction along the axis, indicated by the lattice parameter b. A change strongly influenced the Curie temperature in this parameter.
A large change of volume (ΔV = ½VorthVhex = 2.02 Å3, so ΔV/V ≈ 2.35%) was detected at about the temperature of structural transition Tstr ≈ 420 K during the change of symmetry from hexagonal to orthorhombic. The MnCoGe compound was approximated based on its difference from Kanomata et al. [33] in the unit cell volume (ΔV ≈ 3 Å3 at Tstr) for comparison purposes. For magnetic phase transitions of the first order, the total field-induced magnetic entropy change, ∆Stot, is defined as the total between the typical second-order magnetic entropy change (∆SM) and the two different crystallographic polymorphs’ (∆Sst) entropy difference, i.e., ∆Stot = ∆SM + ∆Sst. The volume disparities between the transitional phases are proportional to the structural entropies. The volume difference around Tstr for the MnCoGe0.97Al0.03 compound caused structural entropy change, which resulted in total magnetic entropy change. The MCE around the Tstr value (approximately 9 J kg−1 K−1 for ∆B = 5 T) is larger than at TC (4.92 J kg−1 K−1 for ∆B = 5 T) in the MnCoGe0.97Al0.03 compound. This observation can be associated with the combined effect of a sudden magnetization change and the change in unit cell volume in the proximity of structural entropy change (structural transition).

4. Conclusions

The Al replacement for Ge atoms has changed structural transformation at room temperature. The Al doping decreased the Tstr at 450 to 420 K. The Mn-Mn covalent bonding strengthened with the decrease in Tstr. Meanwhile, the Al doping reduced the c/a ratio. The magnetic transition found that with the Al doping, the Tc value slightly increased from 342 K to 352 K.
The analysis performed using the isothermal magnetization in the proximity of TC agreed well with the critical exponents of the MnCoGe0.97Al0.03 compound. The Kouvel–Fisher method, critical isotherm analysis, and modified Arrott plots were among the different techniques on which the analysis was based. All the critical exponents fulfilled the Widom scaling law. The critical exponent that was evaluated had values that were near the mean values of the field theory with interactions that were long in range.
For MnCoGe0.97Al0.03, a change in the moderate magnetic entropy, −∆SM, was identified to represent second-order magnetic transition behaviour. Magnetic refrigeration applications were favourable for temperature regions of 320 to 350 K. The Ge that Al substituted in the MnCoGe0.97Al0.03 compound caused the magnetic and structural transition separation.
Neutron diffraction signified that structural transition occurred with decreasing temperature around 430 K to 350 K. The substitution of Al for Ge enhanced the stability of the P63/mmc hexagonal phase. The Rietveld refining method analysis showed that the lattice parameters and the volume phase fraction change (ΔV = 1/2VorthVhex = 2.02 Å3, so ΔV/V ≈ 2.35%) were detected at about the temperature of structural transition Tstr ≈ 420 K during the change of symmetry from hexagonal to orthorhombic. The structural entropies were proportional to the volume differences of the transition’s phase, which resulted in total magnetic entropy change. Hence, it showed the combined effect of sudden magnetization changes and unit cell volume changes in the structural entropy change.

Author Contributions

A.R.A.R.: Writing—Original Draft, Visualization. M.F.M.D.: Writing—Review and Editing, Data Curation. J.W.: Conceptualization, Supervision. N.S.S.: Visualization. N.K.O.: Project administration. N.F.M.S.: Resources, data curation. S.X.D.: Resources, data curation. N.F.M.: Validation, Funding acquisition. All authors have read and agreed to the published version of the manuscript.

Funding

This work is supported in part by the Fundamental Research Grant Scheme (FRGS/1/2019/STG07/UPNM/02/7) from the Ministry of Higher Education Malaysia and National Defence University of Malaysia Grant Scheme (UPNM/2021/GPJP/TK/4).

Data Availability Statement

Not applicable.

Acknowledgments

The authors thank the National Defence University of Malaysia for the financial support of this research.

Conflicts of Interest

The authors declare no conflict of interest.

References

  1. Gschneidner, K.A., Jr.; Pecharsky, V.K. Magnetocaloric materials. Annu. Rev. Mater. Sci. 2000, 30, 387–429. [Google Scholar] [CrossRef] [Green Version]
  2. Weiss, P.; Piccard, A. Le phénomène magnétocalorique. J. Phys. Theor. Appl. 1917, 7, 103–109. [Google Scholar] [CrossRef]
  3. Smith, A. Who discovered the magnetocaloric effect? Eur. Phys. J. H 2013, 38, 507–517. [Google Scholar] [CrossRef]
  4. Zimm, C.; Jastrab, A.; Sternberg, A.; Pecharsky, V.; Gschneidner, K.; Osborne, M.; Anderson, I. Description and performance of a near-room temperature magnetic refrigerator. In Advances in Cryogenic Engineering; Springer: New York, NY, USA, 1998; pp. 1759–1766. [Google Scholar]
  5. Brown, G.V. Magnetic heat pumping near room temperature. J. Appl. Phys. 1976, 47, 3673–3680. [Google Scholar] [CrossRef] [Green Version]
  6. Nikitin, S.A.; Tishin, A.M.; Leontiev, P.I. Magnetocaloric effect and pressure influence on dysprosium single crystal magnetization in the range of magnetic phase transition. J. Magn. Magn. Mater. 1991, 92, 405–416. [Google Scholar] [CrossRef]
  7. Dan’kov, S.Y.; Spichkin, Y.I.; Tishin, A.M. Magnetic entropy and phase transitions in Gd, Tb, Dy and Ho. J. Magn. Magn. Mater. 1996, 152, 208–212. [Google Scholar] [CrossRef]
  8. Coey, J.M.D.; Skumryev, V.; Gallagher, K. Is gadolinium really ferromagnetic? Nature 1999, 401, 35–36. [Google Scholar] [CrossRef]
  9. Rahman, A.R.A.; Din, M.F.M.D.; Hairudin, N.A.; Suhaimi, N.S.; Wang, J.; Tawil, S.N.M.; Ismail, M.; Idris, N.H. Effect of Ball Milling Methods on Structural and Electrical Properties of La (FeSi) 13 Alloys. Des. Eng. 2021, 7, 12984–12989. [Google Scholar]
  10. Phan, M.-H.H.; Yu, S.-C.C. Review of the magnetocaloric effect in manganite materials. J. Magn. Magn. Mater. 2007, 308, 325–340. [Google Scholar] [CrossRef]
  11. Bingham, N.S.; Phan, M.H.; Srikanth, H.; Torija, M.A.; Leighton, C. Magnetocaloric effect and refrigerant capacity in charge-ordered manganites. J. Appl. Phys. 2009, 106, 23909. [Google Scholar] [CrossRef]
  12. Moya, X.; Hueso, L.E.; Maccherozzi, F.; Tovstolytkin, A.I.; Podyalovskii, D.I.; Ducati, C.; Phillips, L.C.; Ghidini, M.; Hovorka, O.; Berger, A. Giant and reversible extrinsic magnetocaloric effects in La0.7Ca0.3MnO3 films due to strain. Nat. Mater. 2013, 12, 52–58. [Google Scholar] [CrossRef] [PubMed]
  13. Zeng, R.; Dou, S.X.; Wang, J.L.; Campbell, S.J. Large magnetocaloric effect in re-entrant ferromagnet PrMn1.4Fe0.6Ge2. J. Alloys Compd. 2011, 509, L119–L123. [Google Scholar] [CrossRef]
  14. Wang, J.L.; Campbell, S.J.; Md Din, M.F.; Kennedy, S.J.; Hofmann, M. Magnetic transitions and the magnetocaloric effect in the Pr1−xYxMn2Ge2 system. Phys. Status Solidi 2014, 211, 1092–1100. [Google Scholar] [CrossRef]
  15. Dou, S.X.; Wang, J.; Zeng, R.; Poh, C.-K.; Campbell, S.J.; Kennedy, S.J. Re-entrant ferromagnet PrMn2Ge0.8Si1.2: Magnetocaloric effect. J. Appl. Phys. 2009, 105, 07A909. [Google Scholar]
  16. Wang, J.L.; Caron, L.; Campbell, S.J.; Kennedy, S.J.; Hofmann, M.; Cheng, Z.X.; Din, M.F.M.; Studer, A.J.; Brück, E.; Dou, S.X. Driving magnetostructural transitions in layered intermetallic compounds. Phys. Rev. Lett. 2013, 110, 217211. [Google Scholar] [CrossRef] [Green Version]
  17. Devarajan, U.; Nair, S. Investigations on Cu induced couple-decoupled magneto-structural transition in MnCoGe alloys. Mater. Res. Express 2019, 6, 106117. [Google Scholar] [CrossRef]
  18. Liu, J.; You, Y.; Batashev, I.; Gong, Y.; You, X.; Huang, B.; Zhang, F.; Miao, X.; Xu, F.; van Dijk, N.; et al. Design of Reversible Low-Field Magnetocaloric Effect at Room Temperature in Hexagonal MnMX Ferromagnets. Phys. Rev. Appl. 2020, 13, 054003. [Google Scholar] [CrossRef]
  19. Si, X.; Zhou, K.; Zhang, R.; Qi, J.; Liu, Y. Room-temperature magnetocaloric properties and universal curve of MnCo1−xSnxGe. Phys. Lett. Sect. A Gen. At. Solid State Phys. 2017, 381, 2850–2855. [Google Scholar] [CrossRef]
  20. Gao, T.; Wu, M.; Qi, N.; Zhou, T.; Luo, X.; Liu, Y.; Xu, K.; Marchenkov, V.V.; Dong, H.; Chen, Z.; et al. Giant low field magnetocaloric effect and magnetostructural coupling in MnCoGe1−xInx around room temperature. J. Alloys Compd. 2018, 753, 149–154. [Google Scholar] [CrossRef]
  21. Rahman, A.R.A.; Md Din, M.F.; Wang, J.; Suhaimi, N.S.; Idris, N.H.; Dou, S.X.; Ismail, M.; Hassan, M.Z.; Jusoh, M.T. Magnetism and Thermomechanical Properties in Si Substituted MnCoGe Compounds. Crystals 2021, 11, 694. [Google Scholar] [CrossRef]
  22. Bao, L.F.; Hu, F.X.; Wu, R.R.; Wang, J.; Chen, L.; Sun, J.R.; Shen, B.G.; Li, L.; Zhang, B.; Zhang, X.X. Evolution of magnetostructural transition and magnetocaloric effect with Al doping in MnCoGe1−xAlx compounds. J. Phys. D Appl. Phys. 2014, 47, 055003. [Google Scholar] [CrossRef]
  23. Arrott, A.; Noakes, J.E. Approximate equation of state for nickel near its critical temperature. Phys. Rev. Lett. 1967, 19, 786. [Google Scholar] [CrossRef]
  24. Ren, Q.Y.; Hutchison, W.D.; Wang, J.L.; Pérez, S.M.; Cadogan, J.M.; Campbell, S.J. Magnetism and magnetocaloric effect of Mn0.98Fe0.02CoGe. Phys. Status Solidi Appl. Mater. Sci. 2014, 211, 1101–1105. [Google Scholar] [CrossRef]
  25. Banerjee, B.K. On a generalised approach to first and second order magnetic transitions. Phys. Lett. 1964, 12, 16–17. [Google Scholar] [CrossRef]
  26. Sahana, M.; Rössler, U.K.; Ghosh, N.; Elizabeth, S.; Bhat, H.L.; Dörr, K.; Eckert, D.; Wolf, M.; Müller, K.-H. Critical properties of the double-exchange ferromagnet Nd0.6Pb0.4MnO3. Phys. Rev. B 2003, 68, 144408. [Google Scholar] [CrossRef] [Green Version]
  27. Kouvel, J.S.; Fisher, M.E. Detailed Magnetic Behavior of Nickel Near its Curie Point. Phys. Rev. 1964, 136, A1626–A1632. [Google Scholar] [CrossRef]
  28. Ahlberg, M.; Korelis, P.; Andersson, G.; Hjörvarsson, B. Effect of ferromagnetic proximity on critical behavior. Phys. Rev. B 2012, 85, 224425. [Google Scholar] [CrossRef] [Green Version]
  29. Franco, V.; Conde, A.; Romero-Enrique, J.M.; Blázquez, J.S. A universal curve for the magnetocaloric effect: An analysis based on scaling relations. J. Phys. Condens. Matter 2008, 20, 285207. [Google Scholar] [CrossRef]
  30. Md Din, M.F.; Wang, J.L.; Campbell, S.J.; Studer, A.J.; Avdeev, M.; Kennedy, S.J.; Gu, Q.F.; Zeng, R.; Dou, S.X. Magnetic phase transitions and entropy change in layered NdMn1.7Cr0.3Si2. Appl. Phys. Lett. 2014, 104, 42401. [Google Scholar] [CrossRef] [Green Version]
  31. Caron, L.; Ou, Z.Q.; Nguyen, T.T.; Thanh, D.T.C.; Tegus, O.; Brück, E.; Cam Thanh, D.T.; Tegus, O.; Brück, E. On the determination of the magnetic entropy change in materials with first-order transitions. J. Magn. Magn. Mater. 2009, 321, 3559–3566. [Google Scholar] [CrossRef]
  32. Wang, J.-T.; Wang, D.-S.; Chen, C.; Nashima, O.; Kanomata, T.; Mizuseki, H.; Kawazoe, Y. Vacancy induced structural and magnetic transition in MnCo1−xGe. Appl. Phys. Lett. 2006, 89, 262504. [Google Scholar] [CrossRef]
  33. Kanomata, T.; Ishigaki, H.; Suzuki, T.; Yoshida, H.; Abe, S.; Kaneko, T. Magneto-volume effect of MnCo1−xGe(0⩽x⩽0.2). J. Magn. Magn. Mater. 1995, 140–144, 131–132. [Google Scholar] [CrossRef]
Figure 1. Measured MnCoGe and MnCoGe0.97Al0.03 powder XRD patterns at room temperature. The typical hexagonal Ni2In-type (top) and orthorhombic TiNiSi-type (bottom) structures are denoted by the Miller indices (hkl).
Crystals 12 00205 g001
Figure 2. (a) M-T curves for MnCoGe0.97Al0.03 measured with a 0.01 T magnetic field. (b) DSC curves measured within the range of 200–500 K. The arrows indicate the Curie temperature and the structural transition of the compounds.
Crystals 12 00205 g002
Figure 3. MnCoGe0.97Al0.03 compound isothermal magnetization curves in the TC vicinity.
Crystals 12 00205 g003
Figure 4. MnCoGe0.97Al0.03 compound Arrott plots (M2 vs. B/M) at temperatures within the TC area.
Crystals 12 00205 g004
Figure 5. Temperature dependence of the spontaneous magnetization MS (T, 0) and the inverse initial susceptibility χ 0 1   ( T ,   0 ) .
Crystals 12 00205 g005
Figure 6. Modified Arrott plot: isotherms of M1/β vs. (B/M)1/γ with the calculated exponents β = 0.429 and γ = 0.80.
Crystals 12 00205 g006
Figure 7. Kouvel-Fisher plot for the spontaneous magnetization M S ( T ) and the inverse initial susceptibility χ 0 1 (T). Solid lines are fitted to Equations (3) and (4).
Crystals 12 00205 g007
Figure 8. Universal curves by the scaling plots below and above TC values for the MnCoGe0.97Al0.03 compound.
Crystals 12 00205 g008
Figure 9. The isothermal magnetic entropy change, −∆SM (T, H) temperature dependence for MnCoGe0.97Al0.03 compounds calculated from magnetization isotherms with an applied field change of 0–5 T. Increasing fields are represented by open symbols while the decreasing fields are represented by closed symbols.
Crystals 12 00205 g009
Figure 10. Neutron diffraction image for MnCoGe0.97Al0.03 collected at 6–450 K temperature range at 5 K steps over.
Crystals 12 00205 g010
Figure 11. Neutron diffraction patterns for the MnCoGe0.97Al0.03 compound measured at 6 K, 300 K, 400 K, and 450 K. The pattern with symbols represents the experimental data, while the calculated refinement data are expressed by the solid lines.
Crystals 12 00205 g011
Figure 12. Temperature against the peak intensity for the (002)* and (011) peaks of the MnCoGe0.97Al0.03 compound.
Crystals 12 00205 g012
Figure 13. Temperature function in terms of lattice parameters and unit cell volume of MnCoGe0.97Al0.03. Open symbols with dots on the centre denote the orthorhombic phase, open symbols denote the hexagonal phase, and half-filled symbols denote the corresponding phases in the mixed phase region.
Crystals 12 00205 g013
Publisher’s Note: MDPI stays neutral with regard to jurisdictional claims in published maps and institutional affiliations.

