Article

Nucleation Behaviors of Adipic Acid in Different Polarity Solvent Based on Metastable Zone Width

1
Tianjin Key Laboratory of Brine Chemical Engineering and Ecological Utilization of Resources, Tianjin Engineering Center of Marine Chemical Engineering & Technology, College of Chemical Engineering and Materials Science, Tianjin University of Science and Technology, Tianjin 300457, China
2
Appraisal Center for Environment and Engineering, Ministry of Ecology and Environment, Beijing 100006, China
*
Authors to whom correspondence should be addressed.
Crystals 2022, 12(2), 202; https://doi.org/10.3390/cryst12020202
Submission received: 25 December 2021 / Revised: 18 January 2022 / Accepted: 24 January 2022 / Published: 29 January 2022

Abstract

:
In this contribution, we experimentally determined the metastable zone width (MSZW) of adipic acid (AA) in different polar solvents to reveal the nucleation behavior. We performed analyses for different cooling rates, saturation temperatures and polar solvents. The findings showed that the MSZW increased as the cooling rate increased, or saturation temperature or polarity decreased. Here, we suggest that the hydrogen bond donor capacity decreases as the polarity of the solvent decreases, which weakens the solute and solvent interaction and makes the desolvation process more difficult during nucleation. Furthermore, we found that the MSZW is mainly determined by the cooling rate, when the cooling rate is large enough. On account of the classical nucleation theory, it was found that the sizes of the critical nucleus and Gibbs nucleation energy do not increase monotonously with increasing driving force. Moreover, this study confirms that solid–liquid interface tension is associated with crystallization driving force.

1. Introduction

Crystallization plays a vital role in addressing the issue of the separation and purification of crystallization products [1]. From salt production to silicon wafer production, crystallization techniques are widely applied in the pharmaceutical, petrochemical and food industries. This is especially true for the pharmaceutical industry, where more than 80% of pharmaceutical active ingredients are used to improve the purity of the product by crystallization [2]. From a mechanistic standpoint, crystallization is a two-step process consisting of nucleation and the growth of the crystal [3]. Nucleation, as the first step of crystallization, has a pivotal role in the crystallization process [4]. Nucleation is a key step in crystallization, which directly or indirectly affects the number, size, shape and structure of crystals [5]. Over the last several decades, nucleation from solution was a subject of extensive study [6,7,8,9]. Crystallization begins with the formation of three-dimensional crystal nuclei, and finally forms macroscopically visible crystals [10]. Due to the randomness and spontaneity of the initial nucleation process, the crystallization process always enters an uncontrollable state [11]. Therefore, comprehending and observing nucleation behavior during the crystallization process is vital for controlling the crystal shape, crystal size distribution and polymorphism.
The classical nucleation theory (CNT) can still be quantitatively described as the theoretical framework of nucleation kinetics [12]. The MSZW of a solution or melt system represents the nucleation point of crystallization, which describes the nucleation behavior and obtains the optimal operating area for the crystallization process [13]. Extensive research has shown that the MSZW increases with an increasing cooling rate [14,15,16,17,18,19]. Additionally, the MSZW hinges on the rate of agitation force, solution volume, solvents, additives and ultrasound [13,20,21,22,23,24,25]. A promising way to keep in touch with nucleation is to study the dependence of solute–solvent interactions from solution to nucleation [2]. Khamar [26] reported that the nucleation of salicylic acid depends on the binding strength of the molecules in the solution. He believed that the more solvents that bind to the salicylic acid molecules in the solution, the slower the nucleation. Similarly, in a study by Sullivan [27], there is also recent evidence to suggest that desolvation plays a crucial role in regulating nucleation rates. Maley et al. [28] highlights the restricted influence of stronger binding between a variety of solvents and risperidone molecules on crystal phase formation. Recently, many investigators have been focusing on the nature of the interaction between solutes and solvents, such as the hydrogen bonding capacity of solvents [29,30].
In this study, adipic acid, an important dicarboxylic acid, is chosen as a research object to explore the relationship between different polar solvents and nucleation kinetics. AA is a white-like crystalline powder, and its molecular structure is shown in Figure 1. AA is not only an important kind of monomer for the production of nylon-66 [31], but also for the manufacturing of fibers, intermediates of medicine, adhesives, insecticides and dyestuffs, and also an additive for the food industry [32,33]. However, there are some problems in the industrial production of AA, for instance, unpredictable polymorphs, impurity inclusion and maldistribution [34]. By employing crystallization technology, it can effectively control the quality of crystal products, for instance, crystal size distribution (CSD), crystal shape and polymorphism. Furthermore, this study on the nucleation process of adipic acid provides important guidance and reference for the mechanism and control of the crystallization process.
The principal objective of this study is to reveal the influence of different solvents, cooling rates and saturation temperatures on the nuclear dynamics of adipic acid by determining the MSZW in cooling crystallization. Firstly, the nucleation of the AA polymorphism at different cooling rates was confirmed. Secondly, the dependence of MSZW on the solvent polarity, saturation temperature and cooling rate was researched by using the modified Sangwal model [13]. Furthermore, the relationship between the critical nucleation parameters and the three crucial parameters was explored.

2. Theory

The study of CNT originated from Gibbs’ work in 1878 [12]. In 1985, Nývlt [35] put forward a semi-empirical model to explain nucleation dynamics, based on the assumption that the initial nucleation rate is in accordance with the supersaturation rate over a period of time. In this model, the natural logarithm of R is linearly related to the natural logarithm of the MSZW. In the past few decades, many related papers have used this method to present the impact of cooling rate on the MSZW, but the main disadvantages of this method are as follows: 1. It cannot reveal the influence of temperature on the MSZW; 2. The nucleation rate is given on a mass basis; 3. The coefficient of solubility may not refer to the saturation temperature, which is another way to say the solubility changes linearly with the temperature. In fact, many systems do not meet this assumption; 4. The nucleation parameters (k and m) have no physical meaning, so they cannot predict the MSZW from the beginning or obtain physical nucleation parameters from the metastable region data [36]. Kubota et al. [37] established a new model in 2008 to make the influence of the different detection technologies on the MSZW clear. However, the inherent shortcomings of the Nývlt theory cannot be avoided in the Kubota model. Whereafter, on account of a regular solution, Sangwal [36] presumed that the nucleation rate J corresponded with the change rate (Δc/c0) of supersaturation of the solution. The relationship between the maximum supercooling rate (ΔTmax/T0) and the cooling rate (R) was predicted, which is clearly expressed by Equation (1) [15], as follows:
ln Δ T max T 0 = 1 m * m *   ln Δ H s R g T lim + 1 m * ln f K 1 m * ln 1 T 0 + 1 m * ln R
In the end, the three-dimensional nucleation model was defined as follows:
( T 0 Δ T max ) 2 = F 1 ( X + ln T 0 ln R ) = F F 1 ln R
The constant F equals to F 1 ( X + ln T 0 ) . F1 and X can be expressed as follows:
F 1 = 3 16 π γ 3 V s 2 k b 3 T lim 3 ( Δ H s R g T lim ) 2
X = ln ( A R g T lim f Δ H s )
where the constant A refers to the pre-exponential factor, γ refers to solid–liquid interfacial tension, Vs represents molecular volume, kb means Boltzmann constant and f stands for the ratio constant. Thermodynamic and kinetic parameters, solvation and the migration processes of molecules have a significant effect on F and F1. Therefore, Sangwal’s model cannot accurately describe how the saturation temperature and cooling rate influence the MSZW, nor can it extract relevant nucleation parameters from the slope and intercept values.
According to Sangwal’s model, Xu [13] proposed the following equation to directly describe the role of saturation temperature in nucleation kinetics:
( T 0 Δ T max ) 2 T 0 Δ T max = M + N   ln ( R T 0 ( T 0 Δ T max ) )  
M = N ln ( f Δ H s A R g )
N = 3 16 π k b 3 γ 3 V s 2 ( Δ H s R g ) 2
In Equation (5), at a given cooling rate, (T0Tmax)2/(T0 − ΔTmax) decreases linearly with ln(R/T0/(T0 − ΔTmax)), and the solid–liquid interfacial tension ( γ ) and nucleation parameter could be estimated by Equations (6)–(7). It is worth noting that once the interfacial tension has been calculated, the critical nuclei size (rcrit) and critical Gibbs free energy (ΔGcrit) can be obtained through Equations (8)–(9), as follows:
Δ G crit = 4 π γ r crit 2 3 = 16 π γ 3 V s 2 3 Δ μ 2
r crit = 2 γ V s Δ μ = 2 γ R g V s T 0 k b Δ H s Δ T max = 2 γ V s k b T ln S
Moreover, the nucleation rate (J) can be expressed based on the CNT, as follows:
J = A   exp ( 16 π γ 3 V s 2 3 k 3 T 1 3 1 ln 2   S )
By the regular solution theory, c1 and c0 delegate the relationship between the solute concentration at nucleation temperature T1 and saturation temperature T0 and supersaturation, which can be represented as follows:
ln S = ln c 0 c 1 = Δ H S R g T 1 Δ T T 0
In a solution system, the crystallization driving force (Δμ) is the difference value of the chemical potentials in the solid phase (μs) and the liquid phase (μl), which can be represented as Equation (12), as follows:
Δ μ = μ l μ s = k T ln S
Hence, Equation (10) can be rewritten as follows:
J = A exp [ ( 16 π γ 3 V s 2 3 k 3 ) ( R g Δ H S ) 2 ( T 0 Δ T ) 2 T 0 Δ T ]
where the nucleation temperature T1 and saturation temperature T0 were measured from experimental data. The metastable zone width (ΔT) is equal to the saturation temperature minus the nucleation temperature. The pre-exponential factor, solid–liquid interfacial tension, critical Gibbs free energy and critical nuclei size were calculated from experimental data.

3. Experimental Section
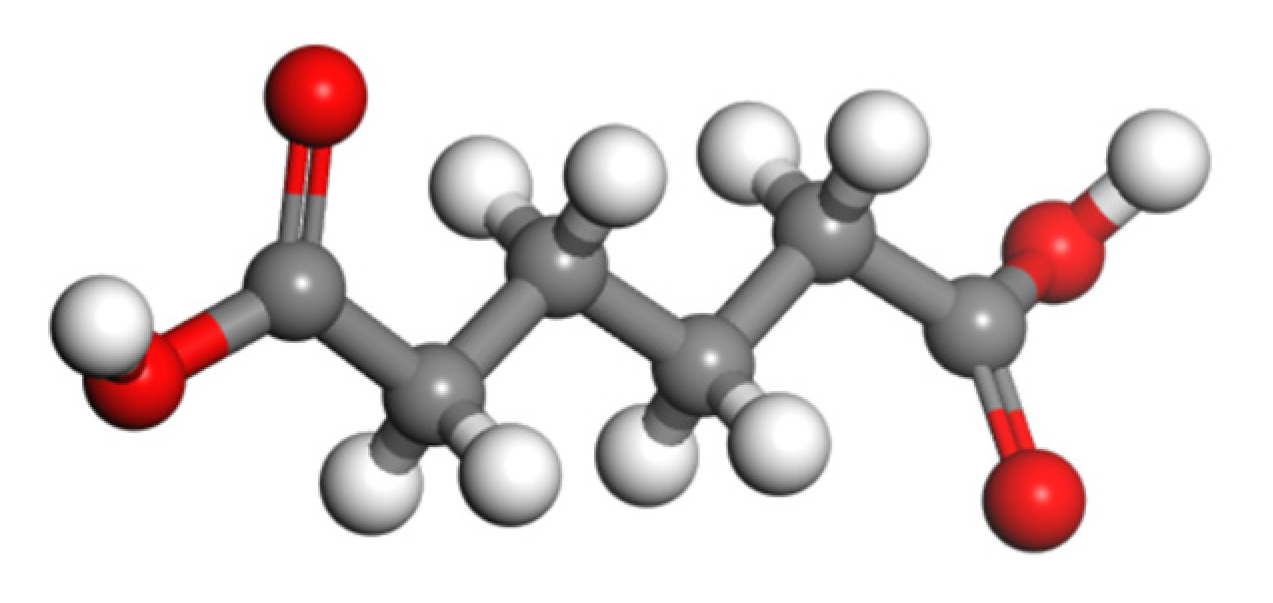
3.1. Materials

Adipic acid is provided by China Shanghai Aladdin Industry Co., Ltd. (Shanghai, China), with a purity of ≥99%. All organic solvents were used in the experiment; water (self-made deionized water), methanol, and n-butanol of analytical grade were provided by China Tianjin Jiangtian Chemical Co., Ltd. (Tianjin, China). All organic solvents were applied directly without any additional treatment. Table 1 contains all the materials and sources for all experiments.

3.2. Metastable Zone Width (MSZW) Measurements

According to the solubility data of adipic acid in water, methanol and n-butanol [38], a saturated solution at different saturation temperatures was prepared in a 100 mL jacketed glass vessel. Ensuring that all the solutes were dissolved, the solution temperature was set above the saturation temperature of 5 K by the thermostatic bath (with accuracy of ±0.01 K, Huber Company, Berching, Germany) for at least 30 min. Next, the solution was cooled down at a constant cooling rate of 9.5 K/h, 17.5 K/h, 25.5 K/h and 38.5 K/h until the nucleation was detected by laser monitoring equipment (Focused Beam Reflectance Measurement, D600L, METTLER, Zurich, Switzerland) [15]. The solution temperature was measured by a precise mercury thermometer with accuracy of ±0.01 K, and was stirred using a magnetic stirring system at 400 rpm. In order to avoid the evaporation of solvents during the experiment, the crystallizer was sealed with PTFE tape and a rubber plug. The laser monitoring system was combined with the eye to record the temperature at which the first nucleus appeared. The experimental MSZW (ΔTmax) was the difference between saturation temperature T0 and nucleation temperature T1, ΔTmax = T0T1. The polymorphic form of the freshly precipitated crystal was characterized by X-ray diffraction (XRD, XD-2 model X-ray diffractometer, Beijing Purse General Instrument Co., Ltd., Beijing, China). All experiments were repeated at least three times and a new saturated solution was prepared in each experiment.

4. Results and Discussion
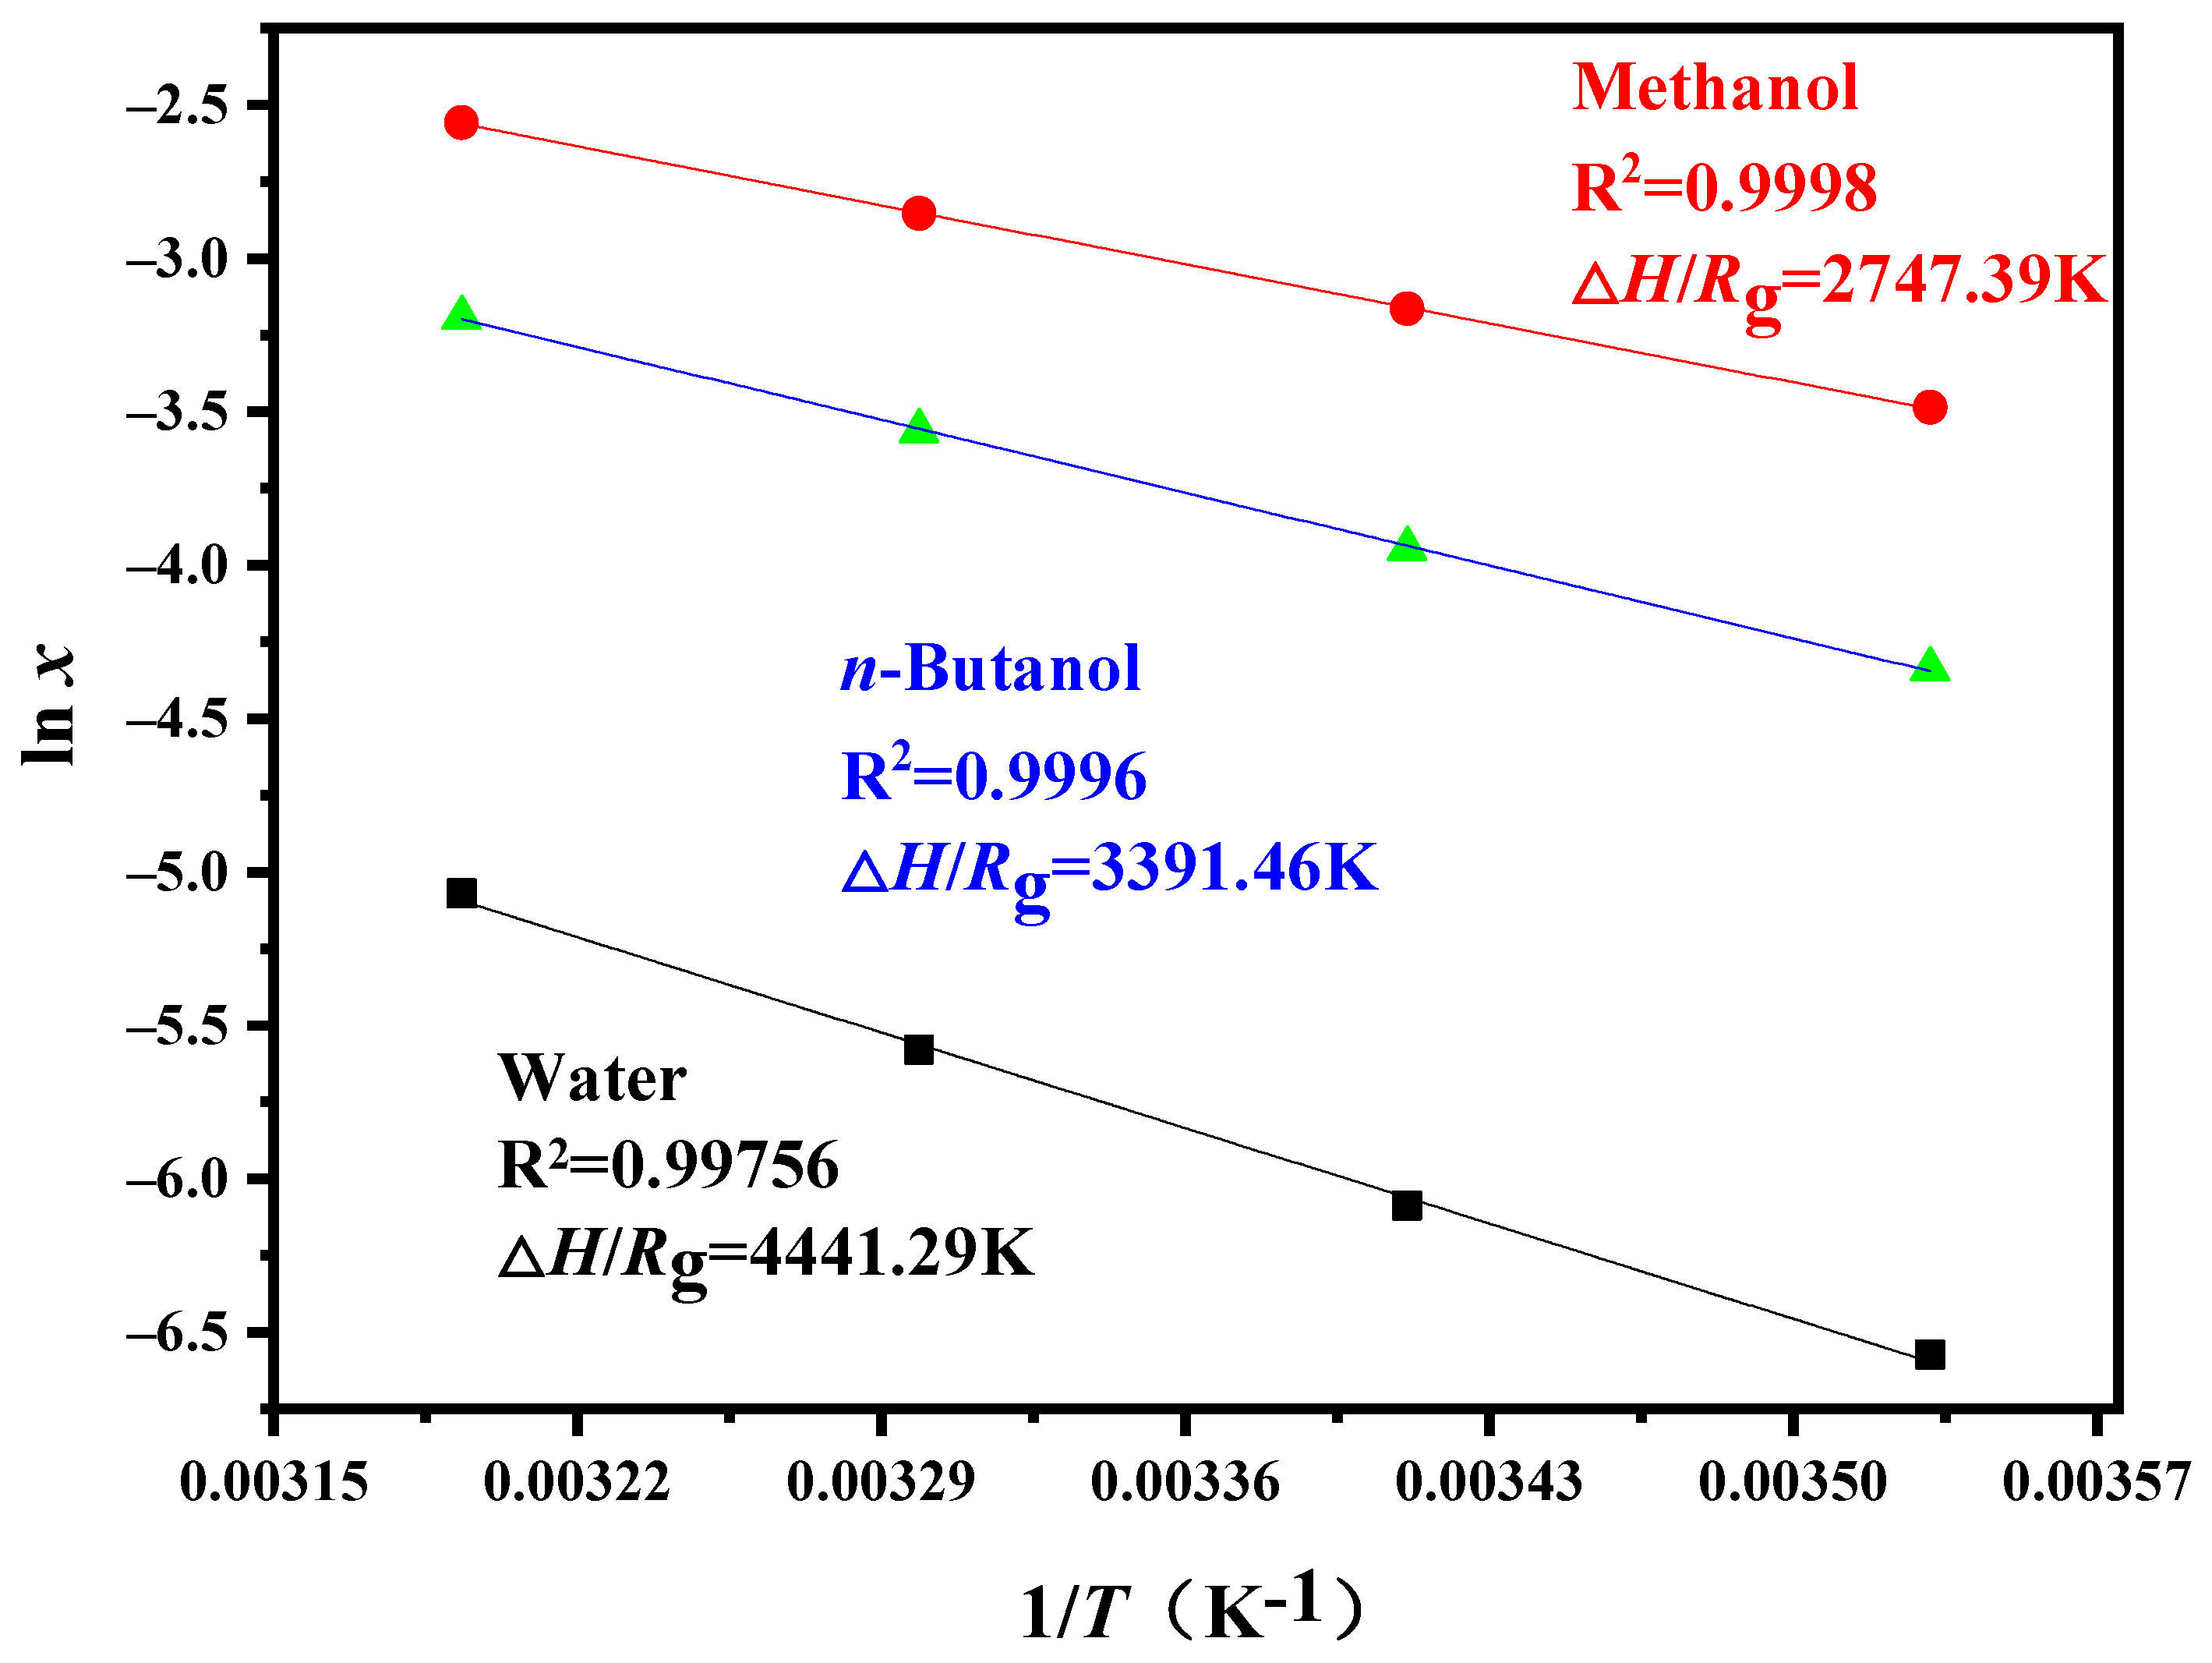
4.1. Solubility

In this research, the saturated solution was prepared based on the solubility of adipic acid in water, methanol and n-butanol, measured by A.N. Gaivoronskii [38]. The Van’t Hoff equation [39] was adopted to correlate the experimental solubility data, and can be described as Equation (14), as follows:
ln x = a R g T + b R g = Δ H s R g T + Δ S R g
where x means mole fraction, T stands for absolute temperature, ΔHs refers to dissolution enthalpy, ΔS is dissolve entropy and R refers to gas constant, 8.314 J/(mol K). In Figure 2, the lnx is linearly correlated with the inverse of temperature, according to Equation (14). With successive increases in saturated temperature, the solubility of adipic acid increased.
At the same saturation temperature, we can observe that the solubility data for methanol are much higher than water and n-butanol. In Figure 2 and Table 2, the ΔHs/Rg values were in the order of methanol < n-butanol < water, which was not in accordance with the polarity order of the solvent, water > methanol > n-butanol. Therefore, the order of solubility may have little relationship with the polar solvent, hydrogen bond donor capacity and hydrogen bond acceptor capacity. Dissolution enthalpy can also be viewed as the difference in the solvent strength of solutes in different solvents. Due to ΔHs/Rg > 0, we found that the dissolution process is endothermic.

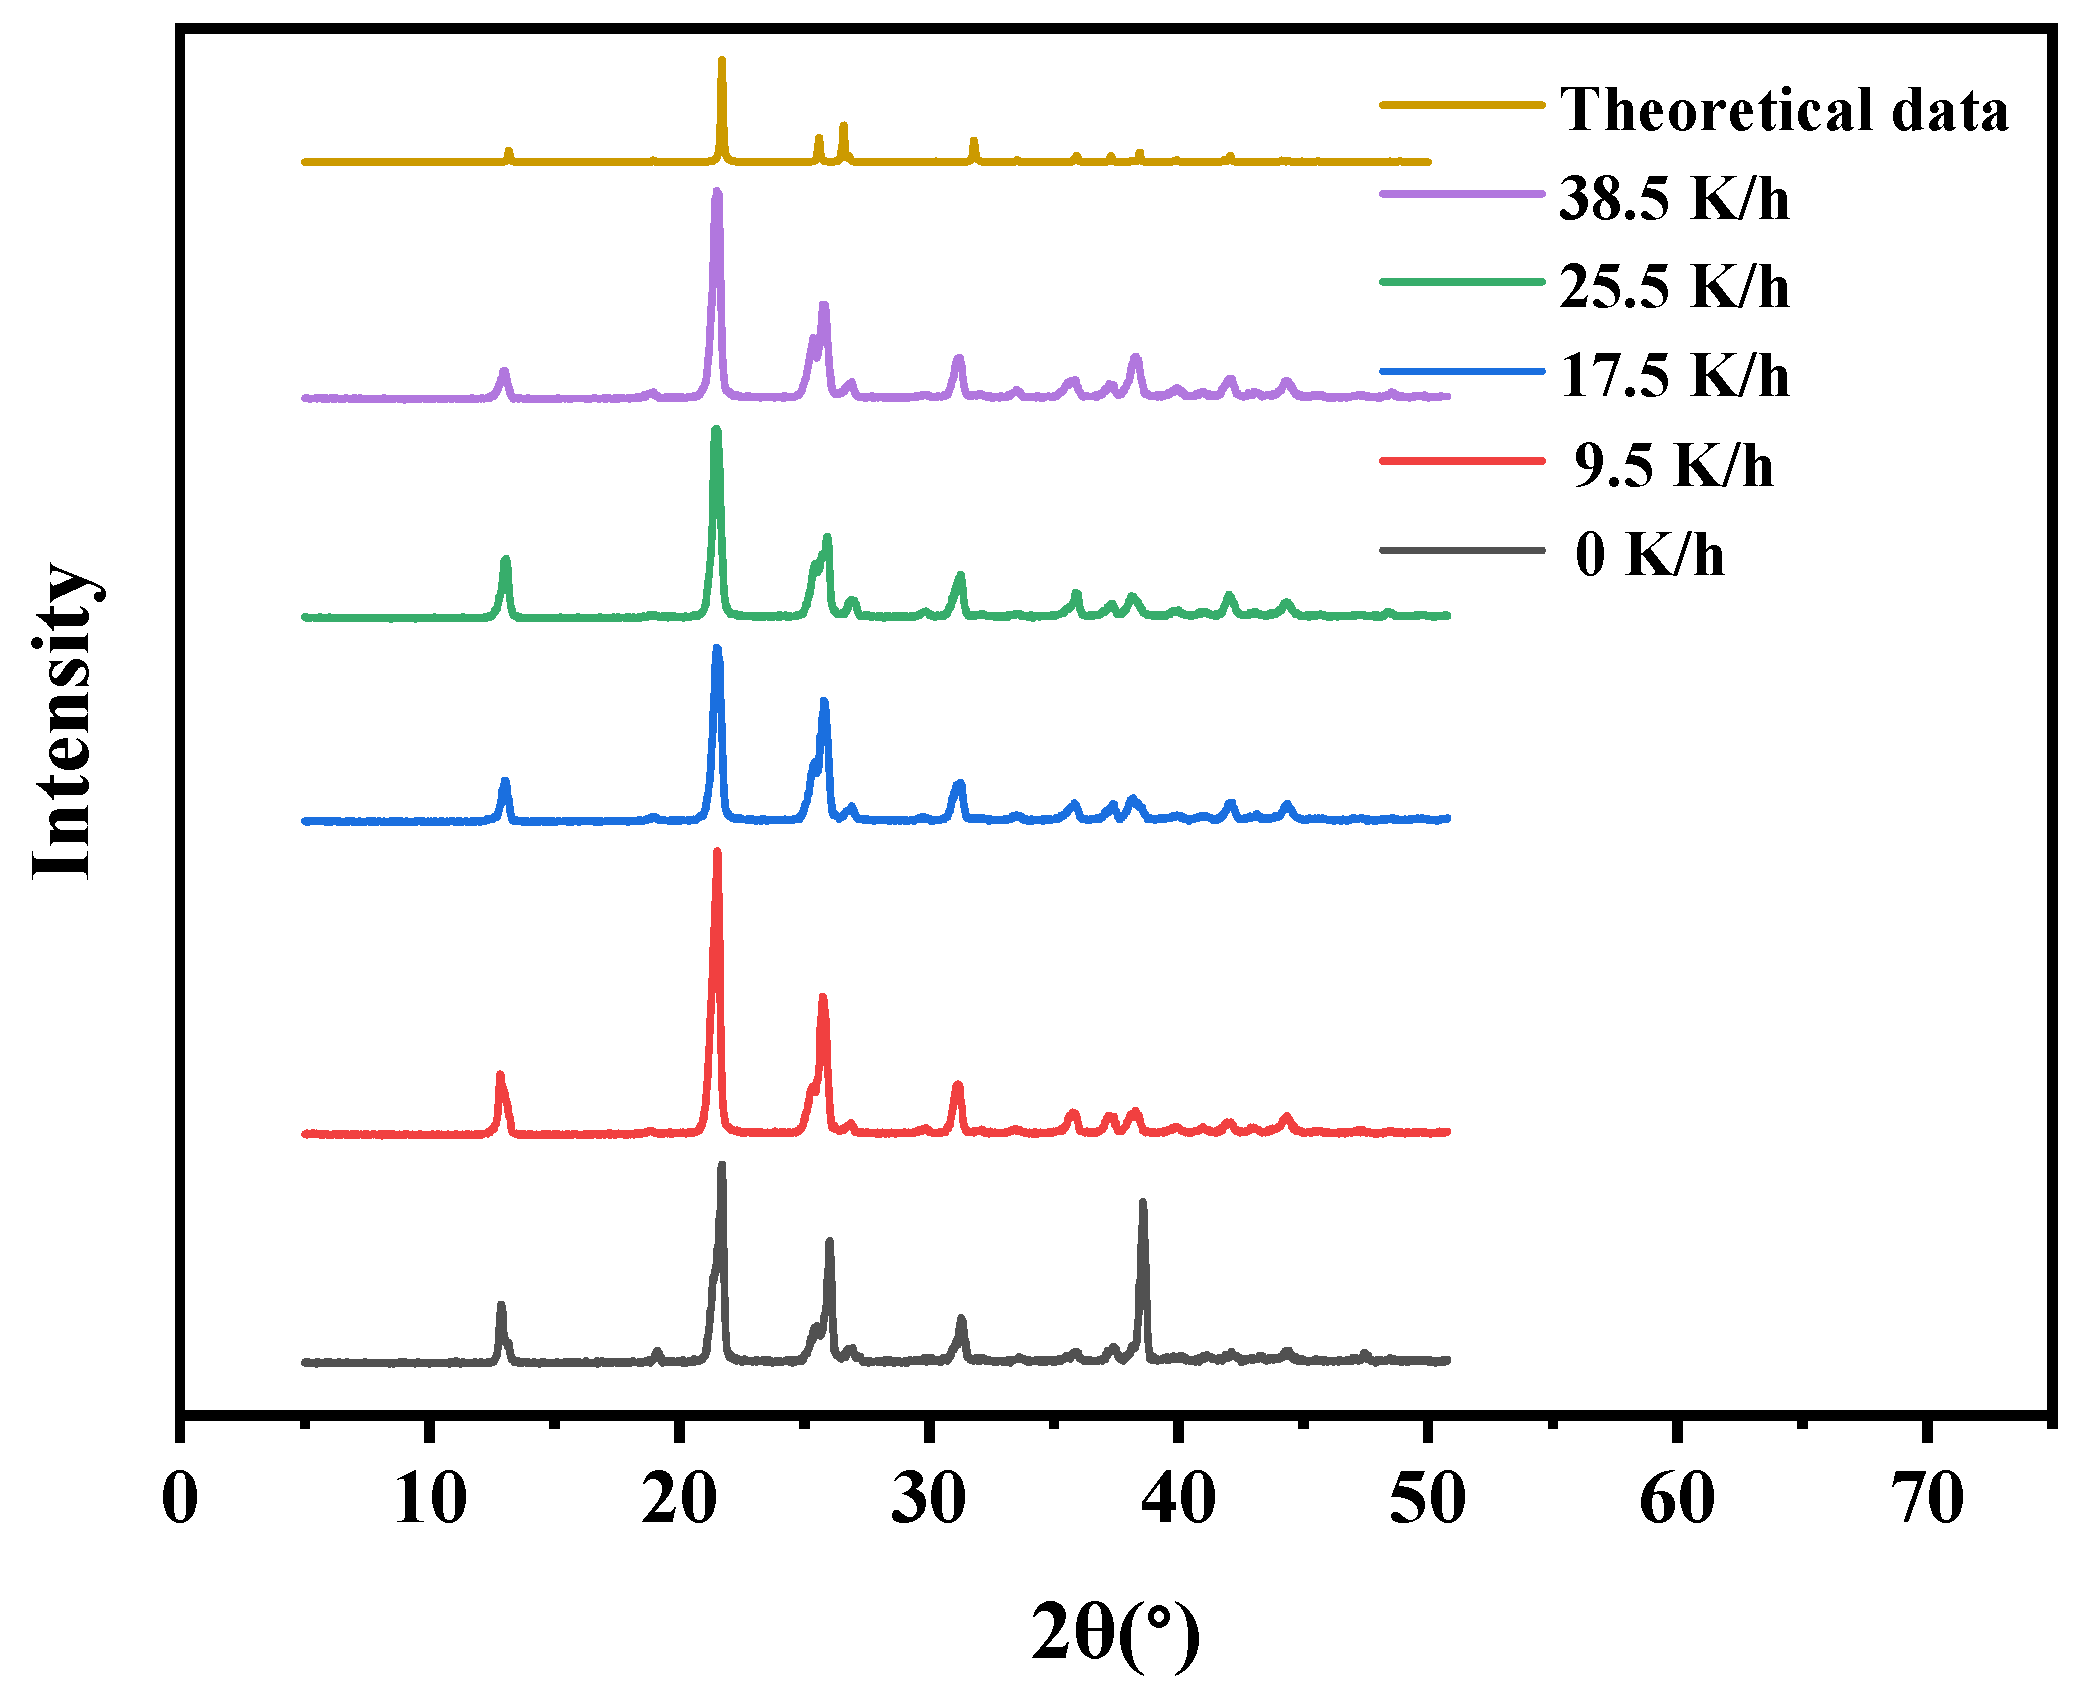
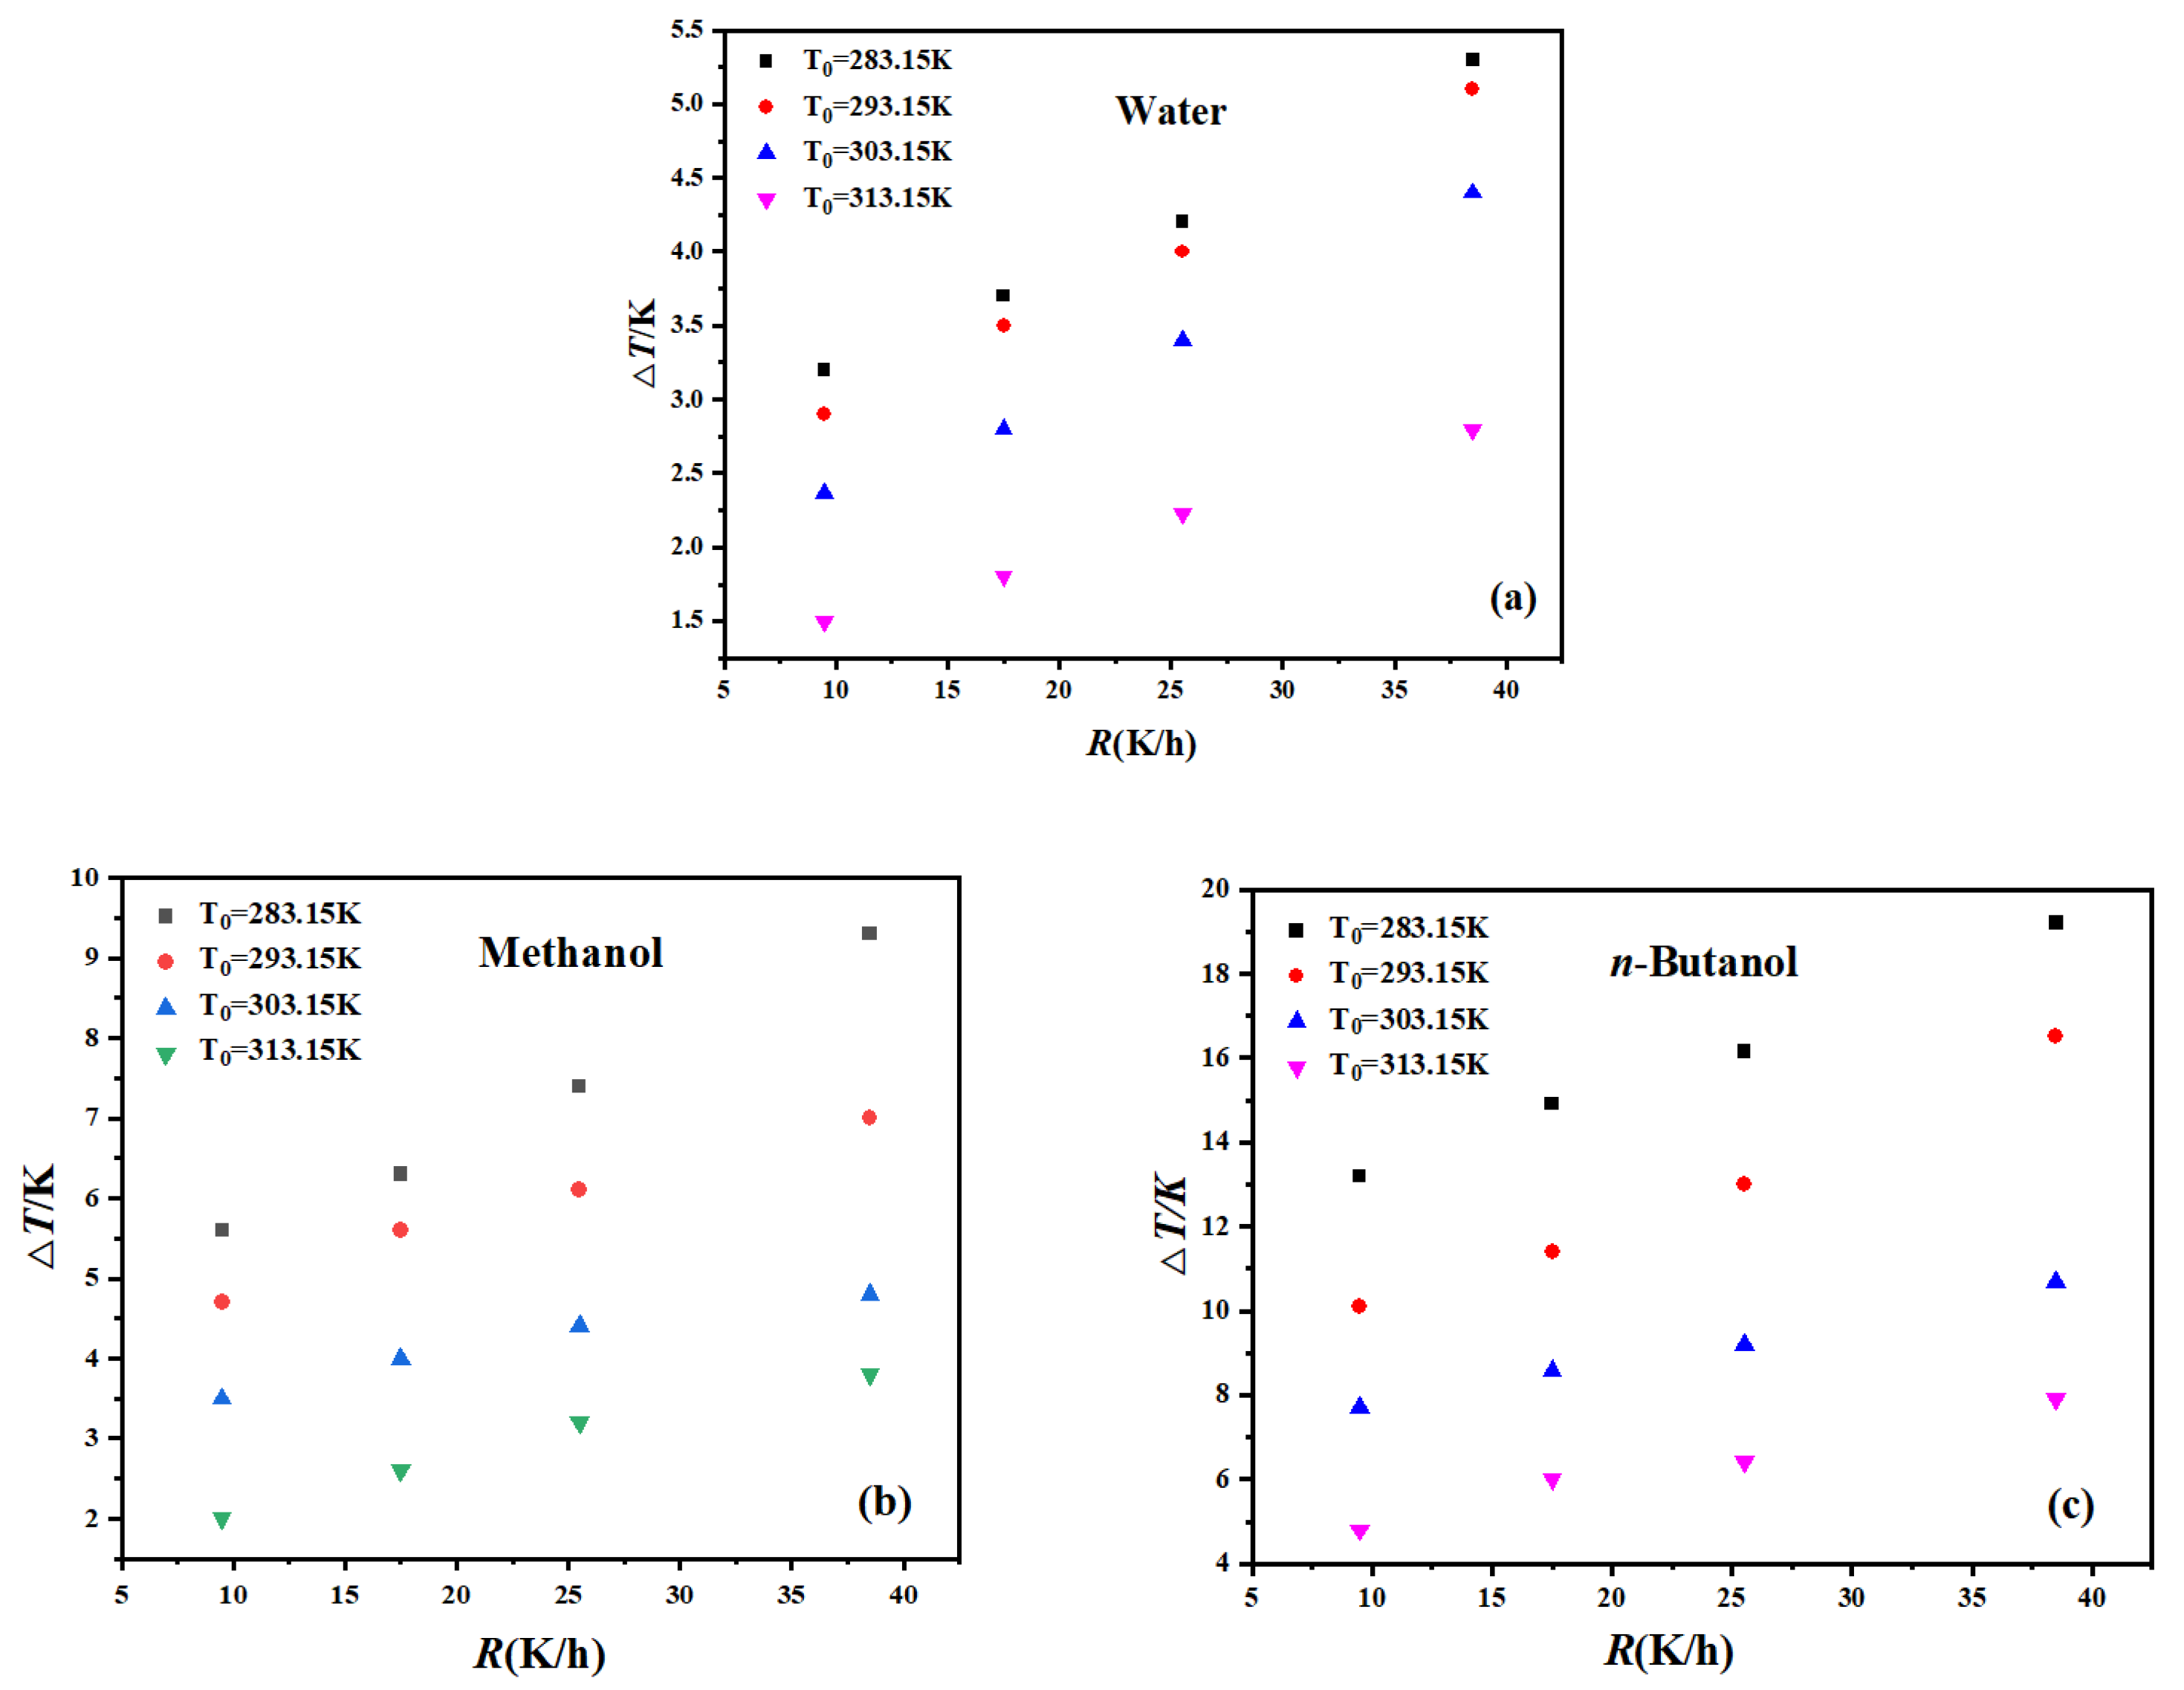
4.2. Effect of Different Cooling Rates, Saturation Temperatures and Polar Solvents on MSZW

In this experiment, the MSZW of adipic acid was measured in water, methanol and n-butanol at different cooling rates in the range from 9.5 to 38.5 K/h and the range of saturation temperatures from 283.15 K to 313.15 K, which are set out in Table 3. There are two crystal forms of adipic acid; the most common crystal form belongs to form II [42]. The cell parameters of form II are a = 7.4282(2) Å, b = 14.9925(1) Å, c = 10.1000(3) Å, α = 90°, β = 111.45(1)° and γ = 90° [43]. As shown in Figure 3, the experimental data were compared with the theoretical diffraction patterns. In all the experiments, adipic acid only precipitated as form II, which belongs to a monoclinic system of centrosymmetric space group P21/n. Moreover, no crystalline transformation appeared. However, form I belongs to the non-centrosymmetric space group.
The results are given in Table 3 and shown graphically in Figure 4. It is evident that at lower saturation temperatures and faster cooling speeds, a wider MSZW can be obtained, which is consistent with a large number of previous studies [15]. Among different solvents, the MSZW in methanol is larger than that in water. This may be related to the interaction between the solvent and solute. The solubility of adipic acid in methanol is greater than that in water, which indicates that the solute and solvent interact more strongly in methanol. Hence, we speculate that there are relatively weak solute and solvent interactions between the water molecules and adipic acid molecules, so the desolvation of adipic acid becomes easier. Thus, nucleation in water is easier than that in methanol, resulting in a smaller metastable zone. Our results indicate that the solvent is a principal determining factor of the solute nucleation rate. In contrast, the MSZW is the widest in n-butanol, which may be ascribed to the smaller collision frequency, which we will demonstrate in the next section.
In order to describe how the cooling rate © affects the nucleation kinetics of AA in different solvents at different saturation temperatures, the modified Sangwal model [13] is used to analyze the change in maximum overcooling, ΔTmax, with the cooling rate. At a given cooling rate, the values of (T0T)2/(T0 − ΔT) and ln[R/(T0 ∗ (T0 − ΔT))] show a linear relationship. From the slope and intercept in Figure 5, we can separately obtain the solid–liquid interfacial tension and the nucleation kinetic factor A in the nucleation process. Therefore, we can obtain the relationship between the cooling rate and nucleation parameters. Figure 5 presents a significant influence of different cooling rates on the MSZW in the nucleation process at a constant saturation temperature, and shows the corresponding slope and intercept. As shown in Figure 5, the higher the saturation temperature is, the smaller the slope will be. The findings from these studies suggest that R can have a greater impact on the MSZW.
In addition, we can also find that in the modified equation, the straight lines may intersect at a certain point at different temperatures. In this case, we can assume that the MSZW is governed by the cooling rate. In order to verify our assumption, using the slope and intercept in Figure 5, we then calculated the point of intersection in Table 4. When the cooling rate becomes larger, it is clear that the influence of saturation temperature on the MSZW of adipic acid can be ignored. In other words, the cooling rate has a major influence on the nucleation process at this time.

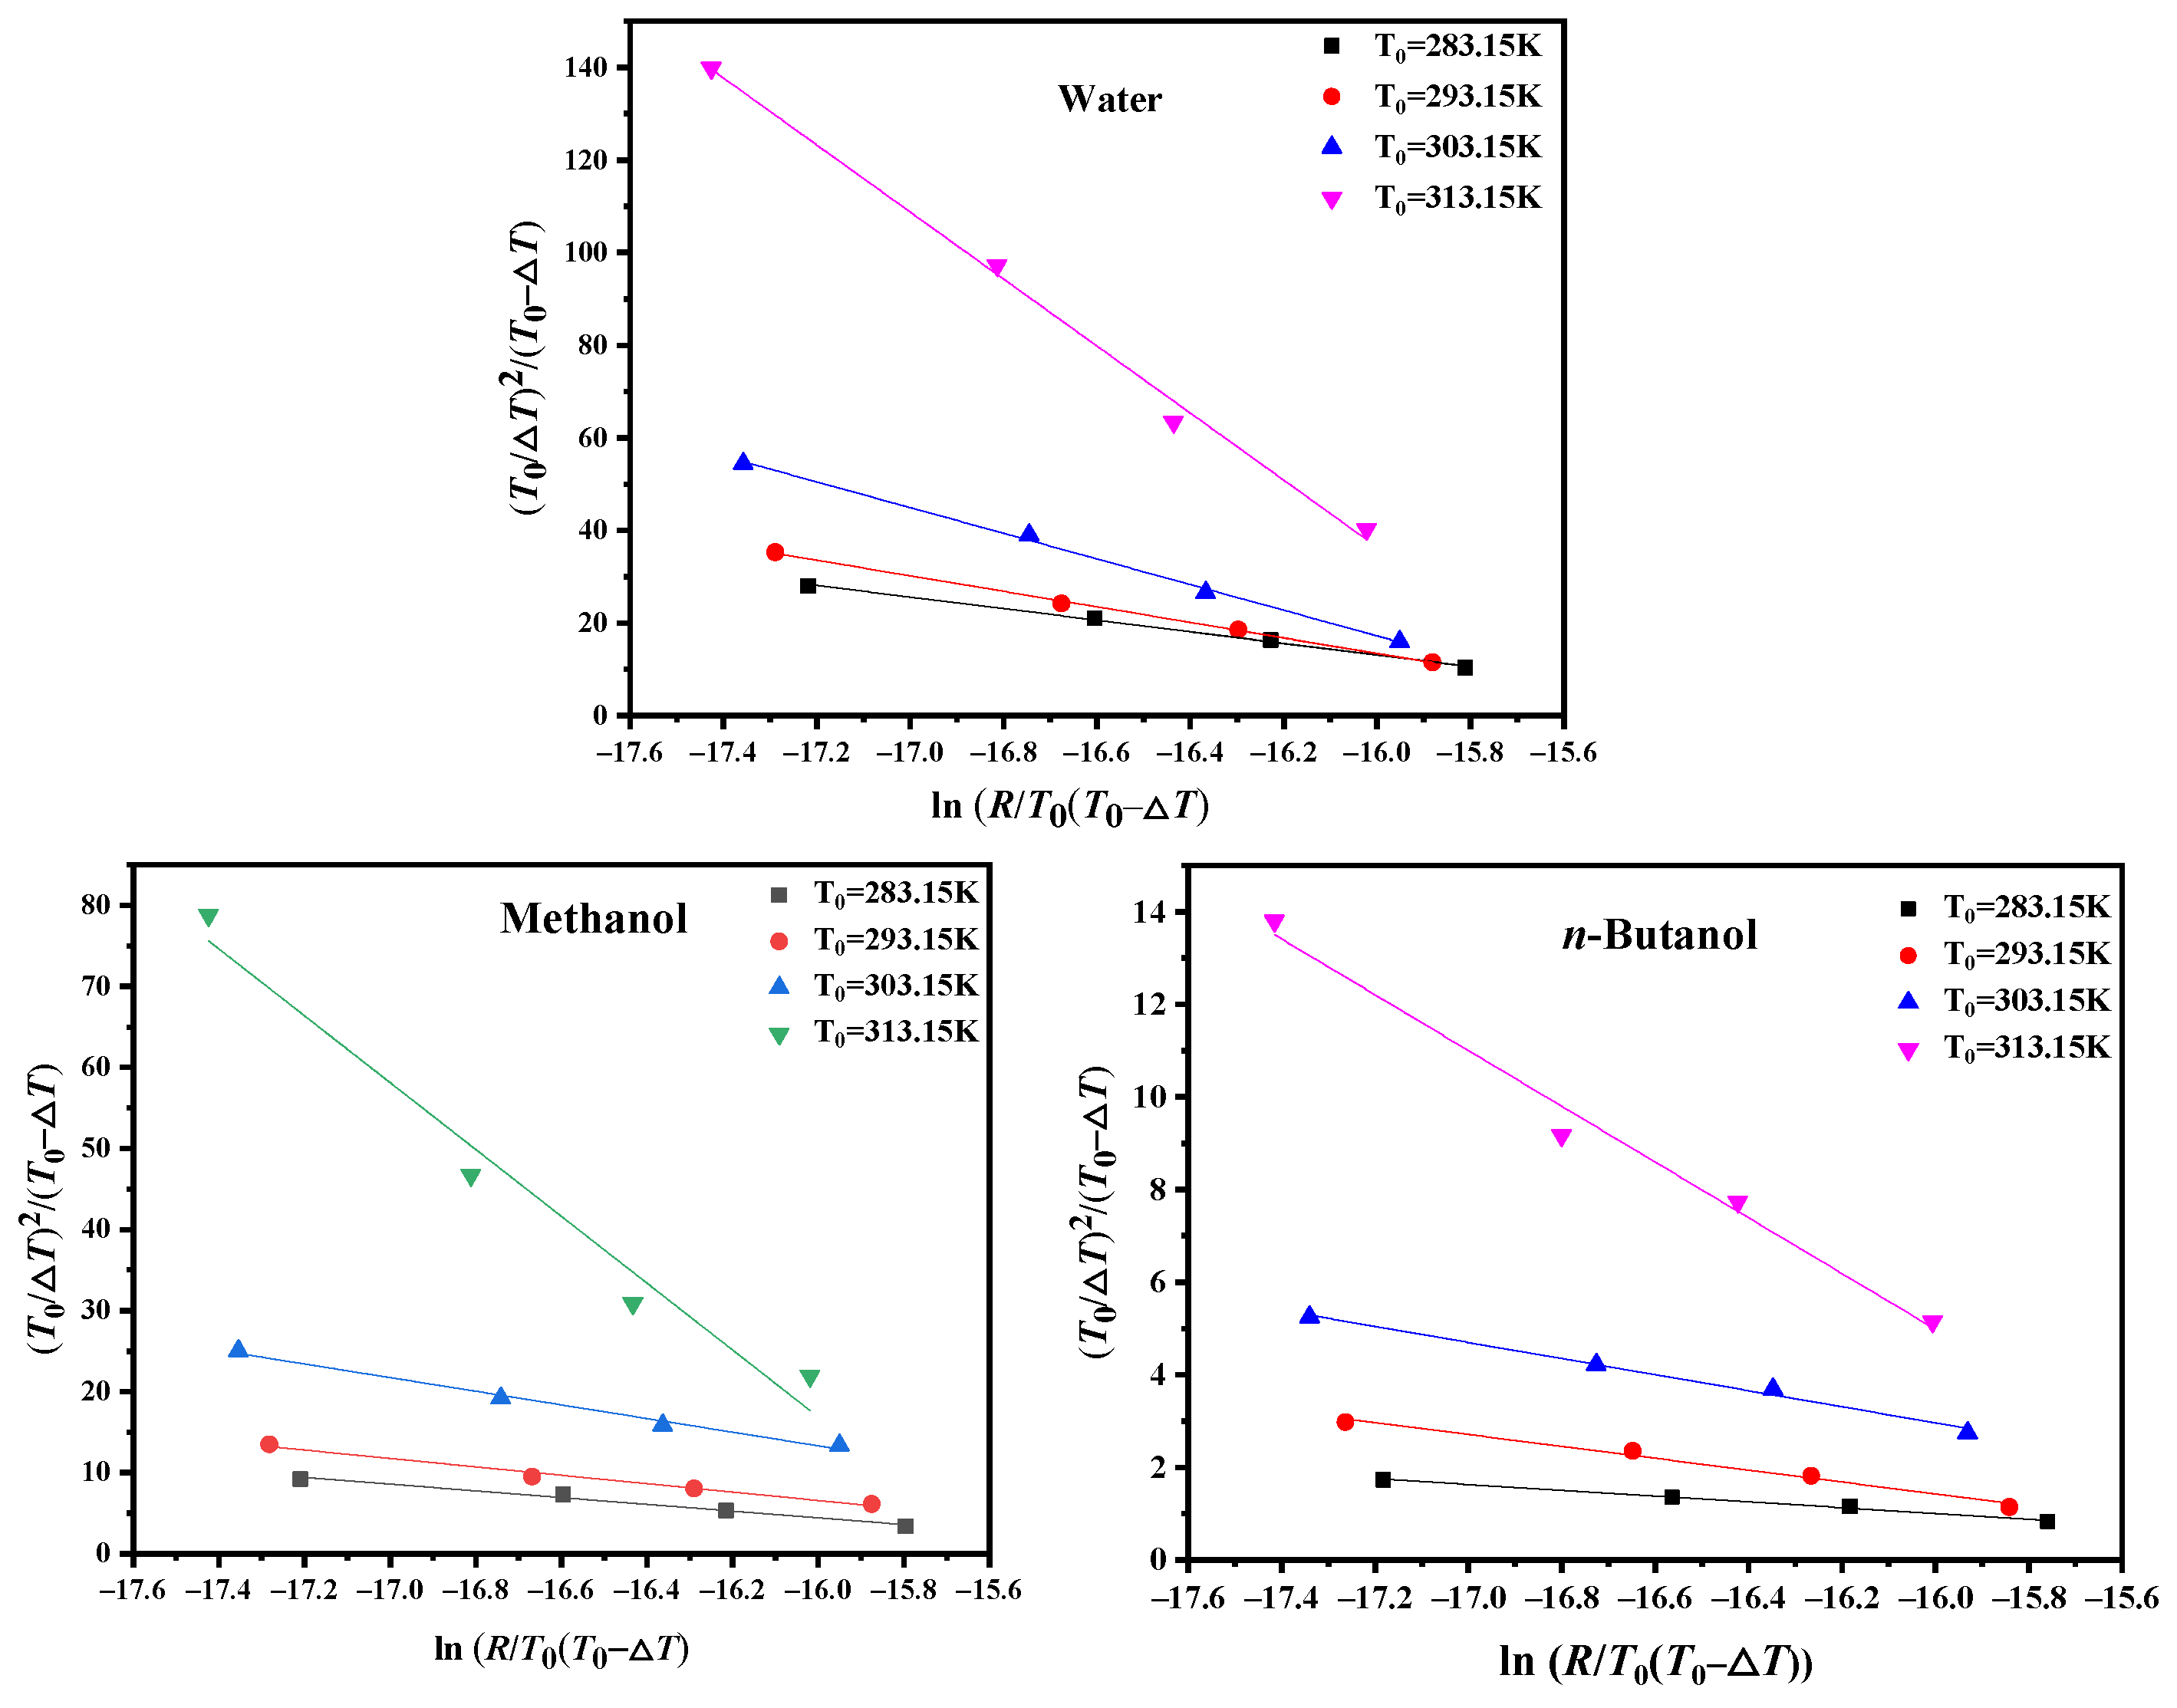
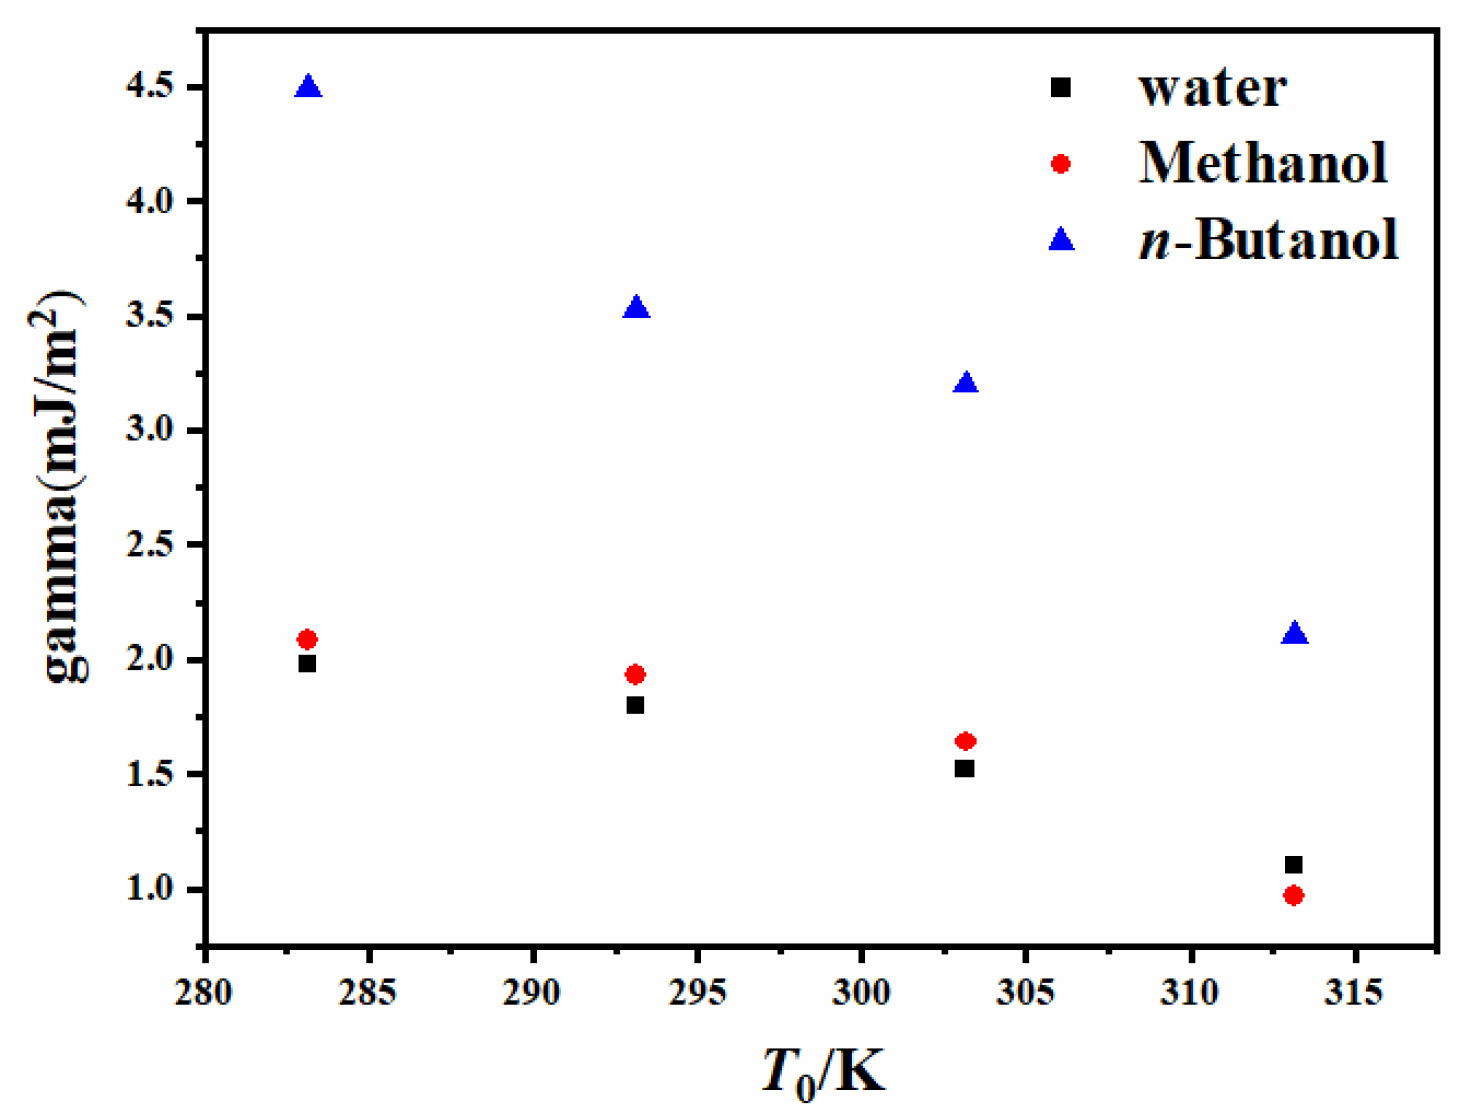
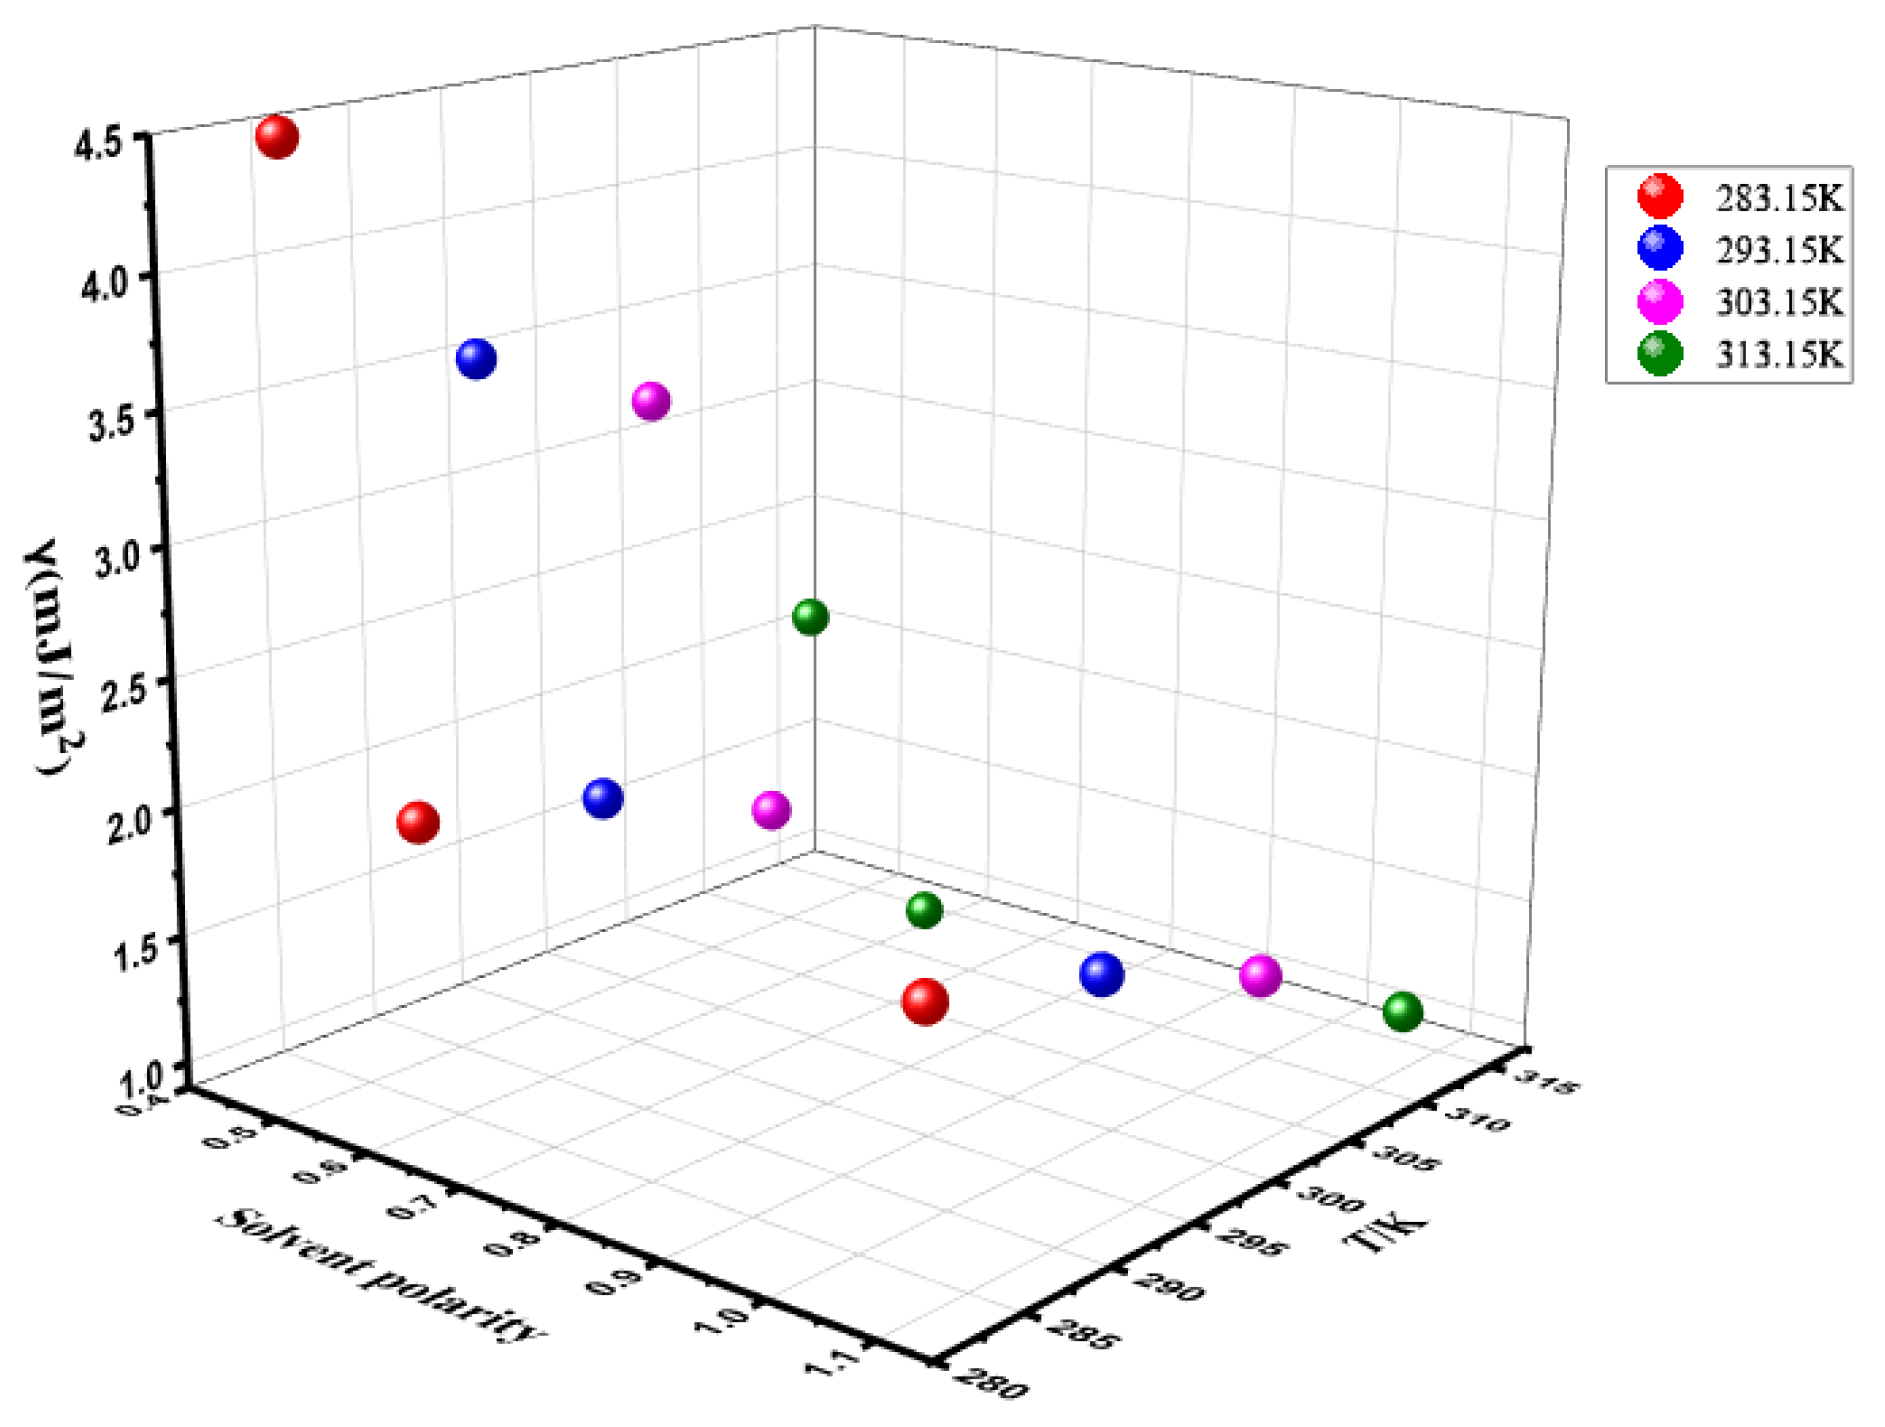
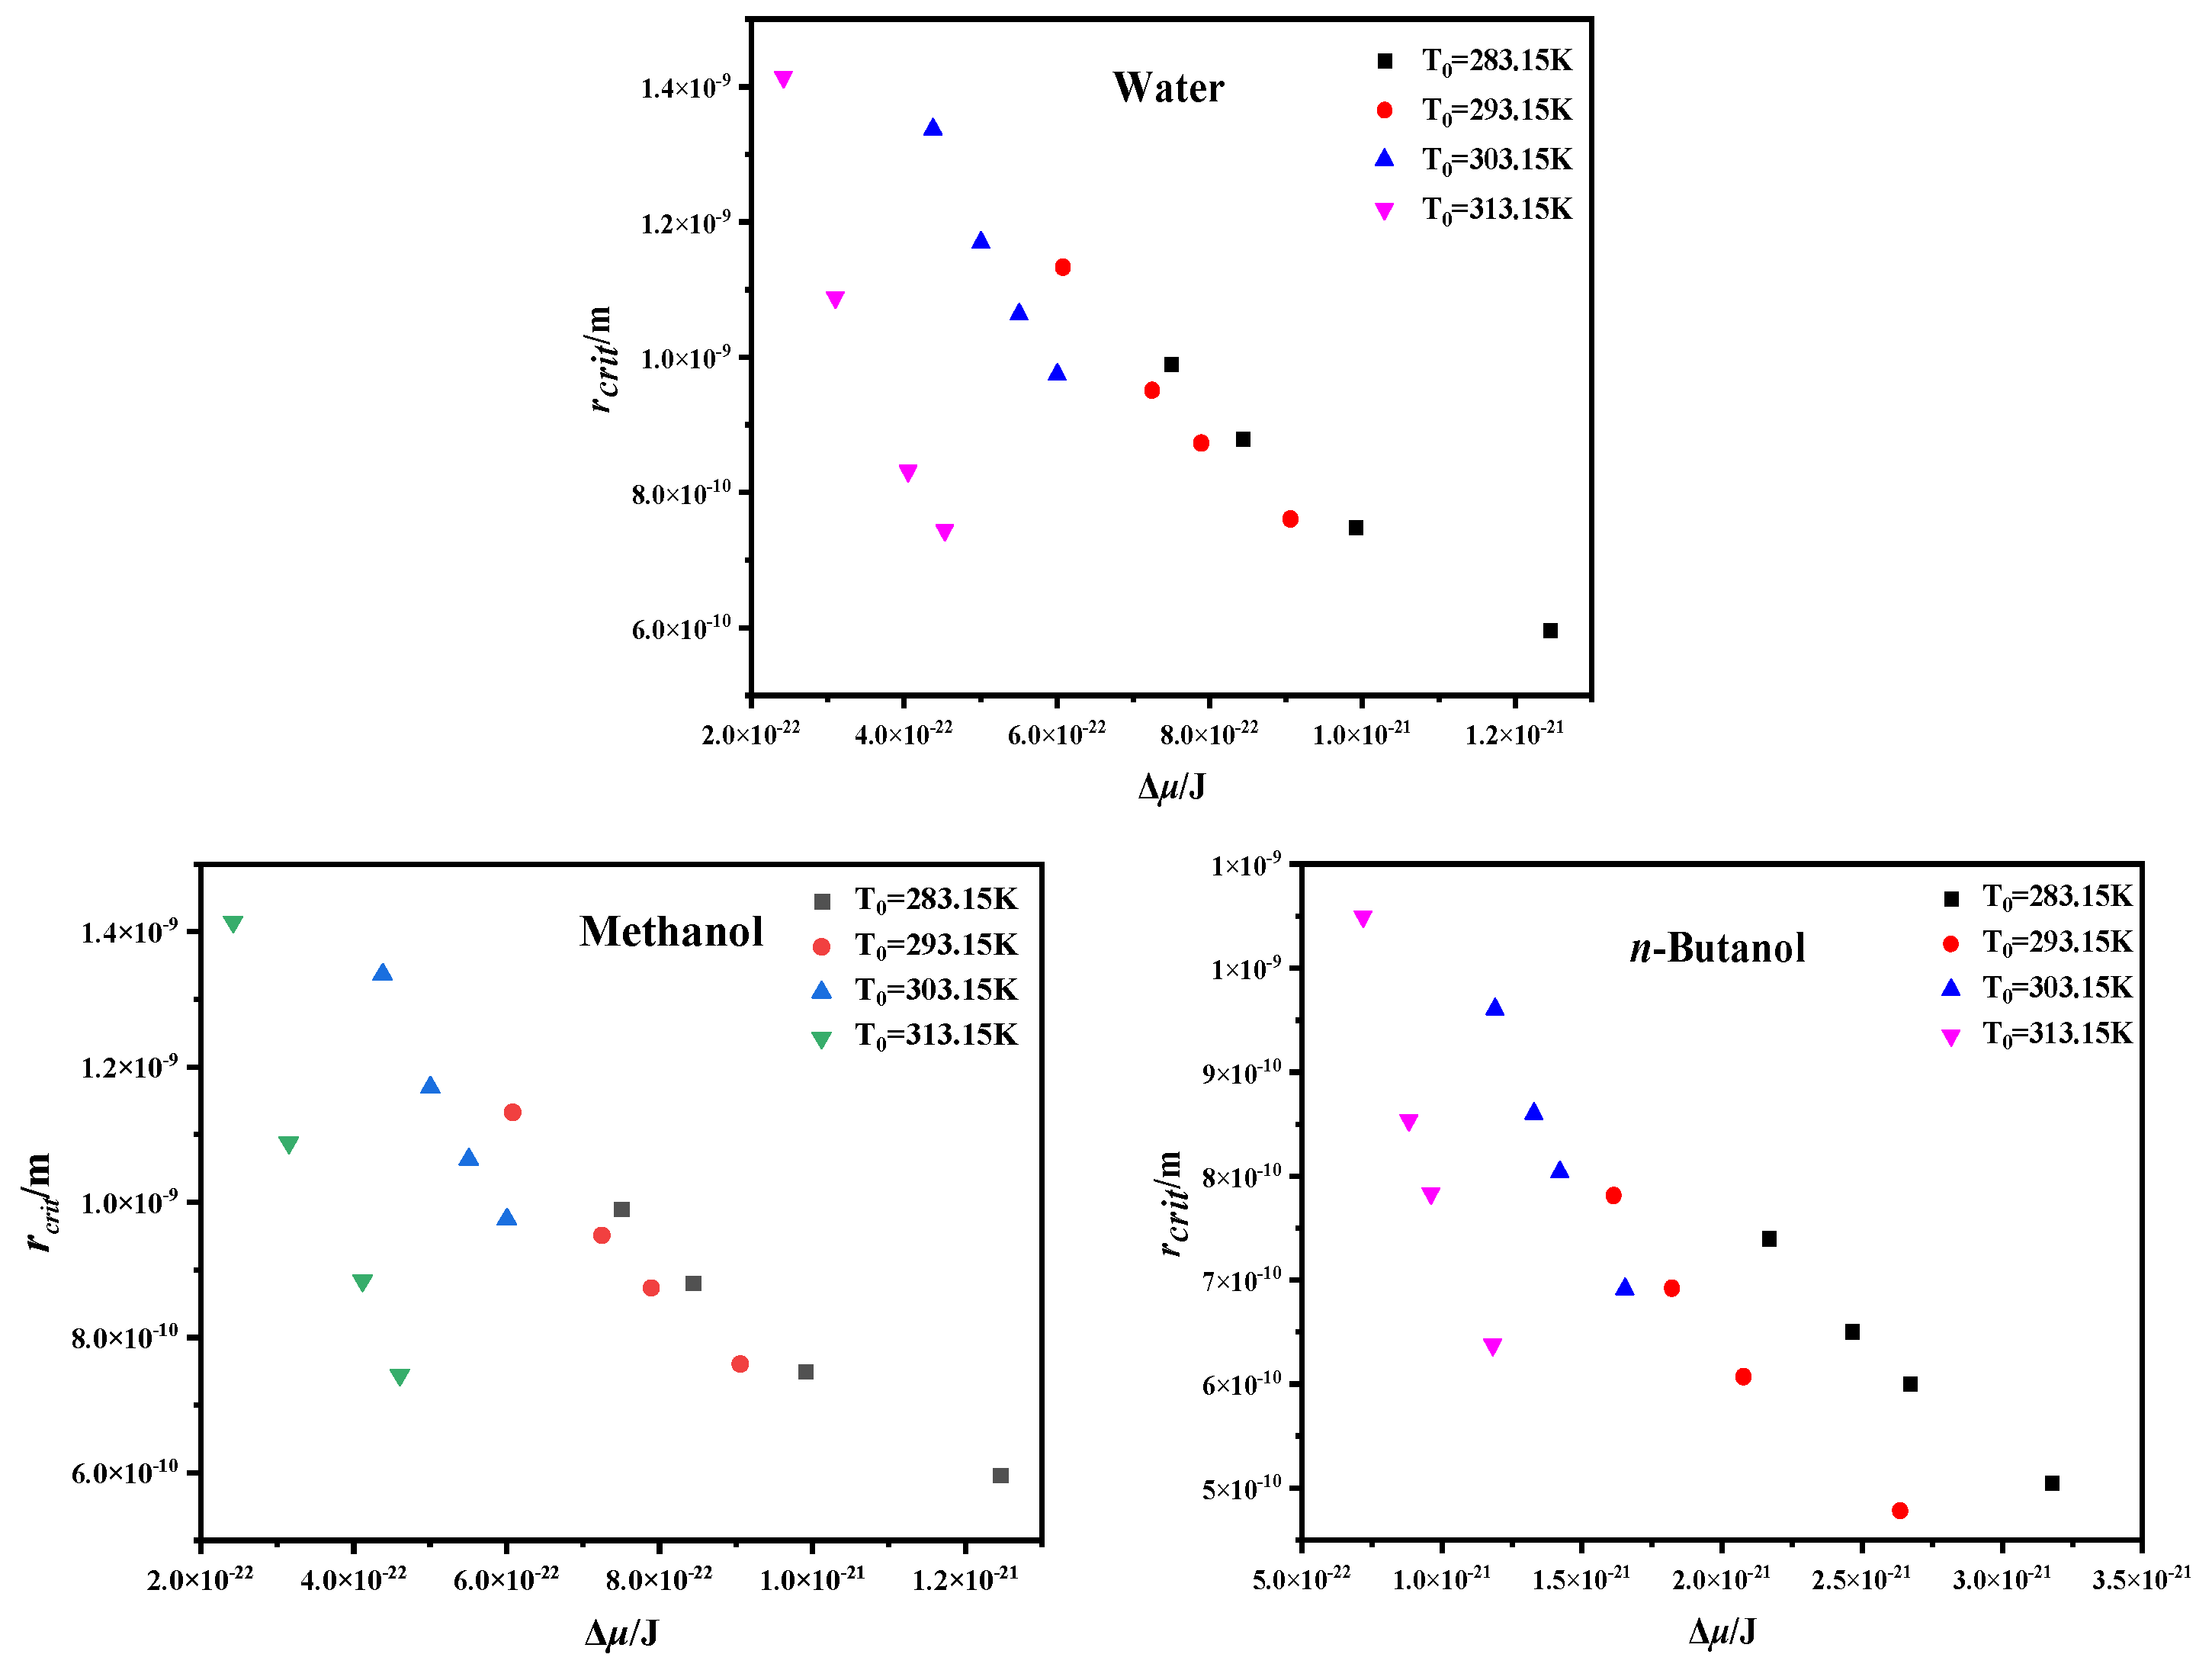
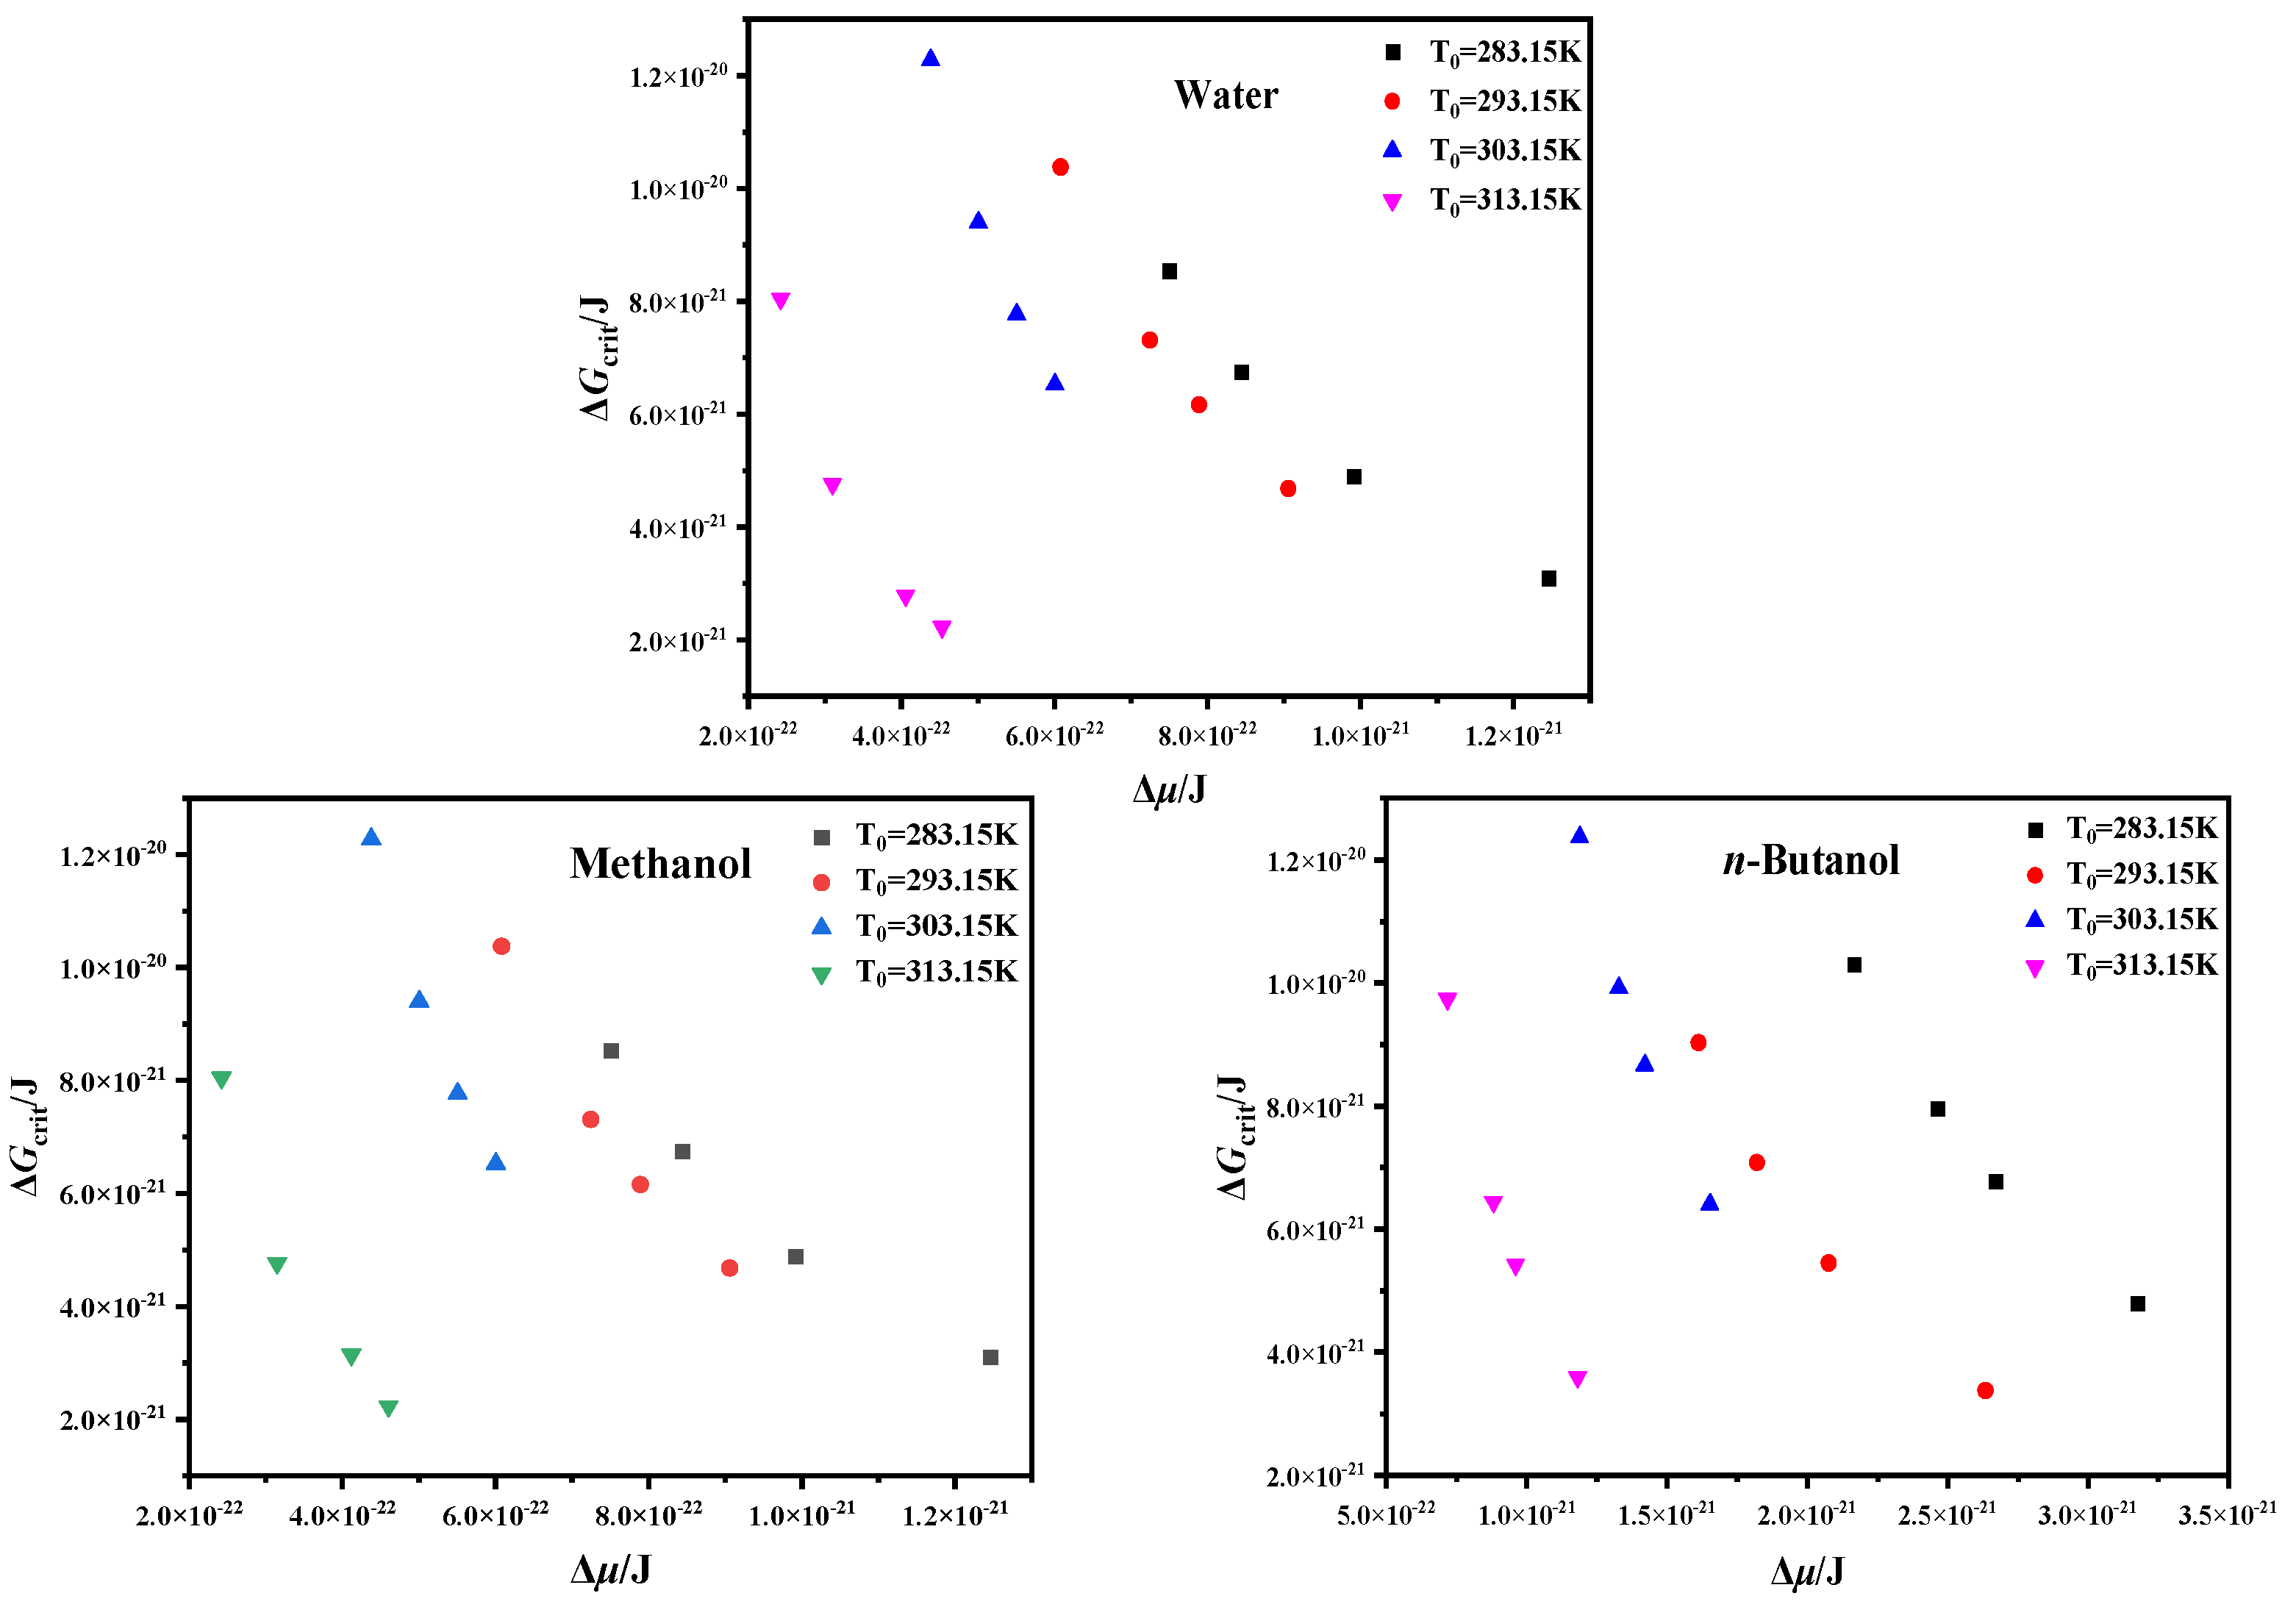
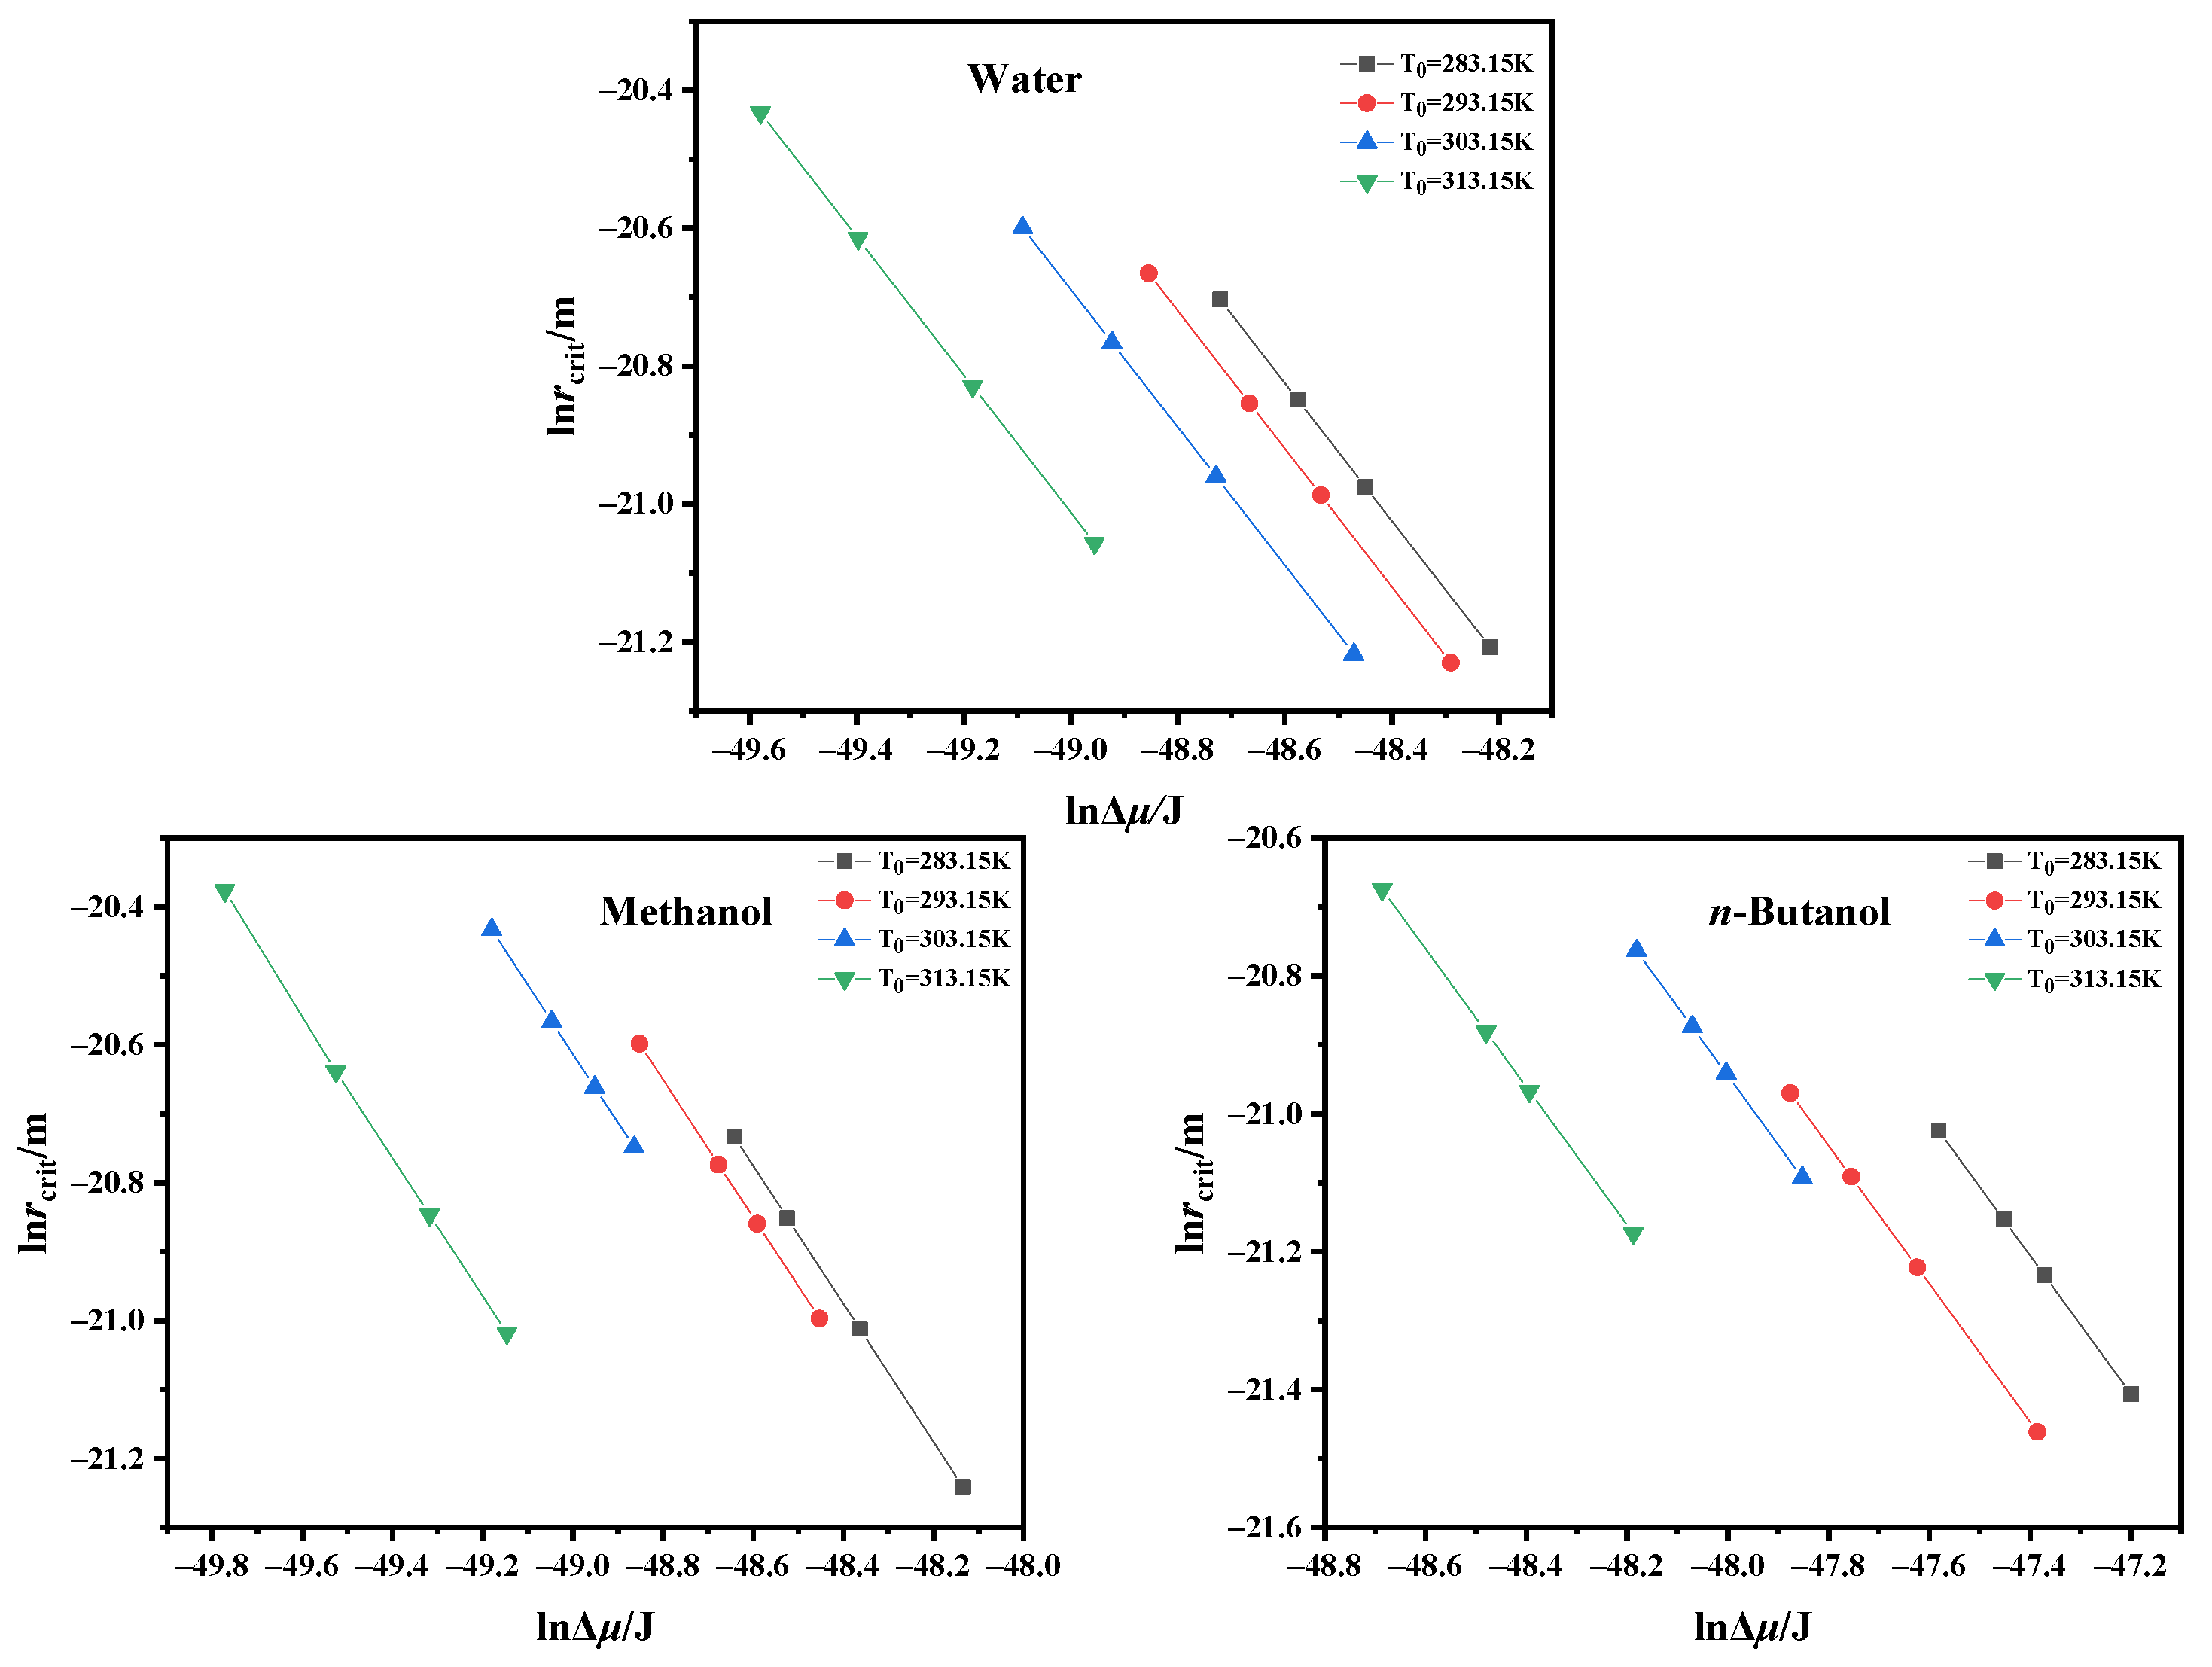
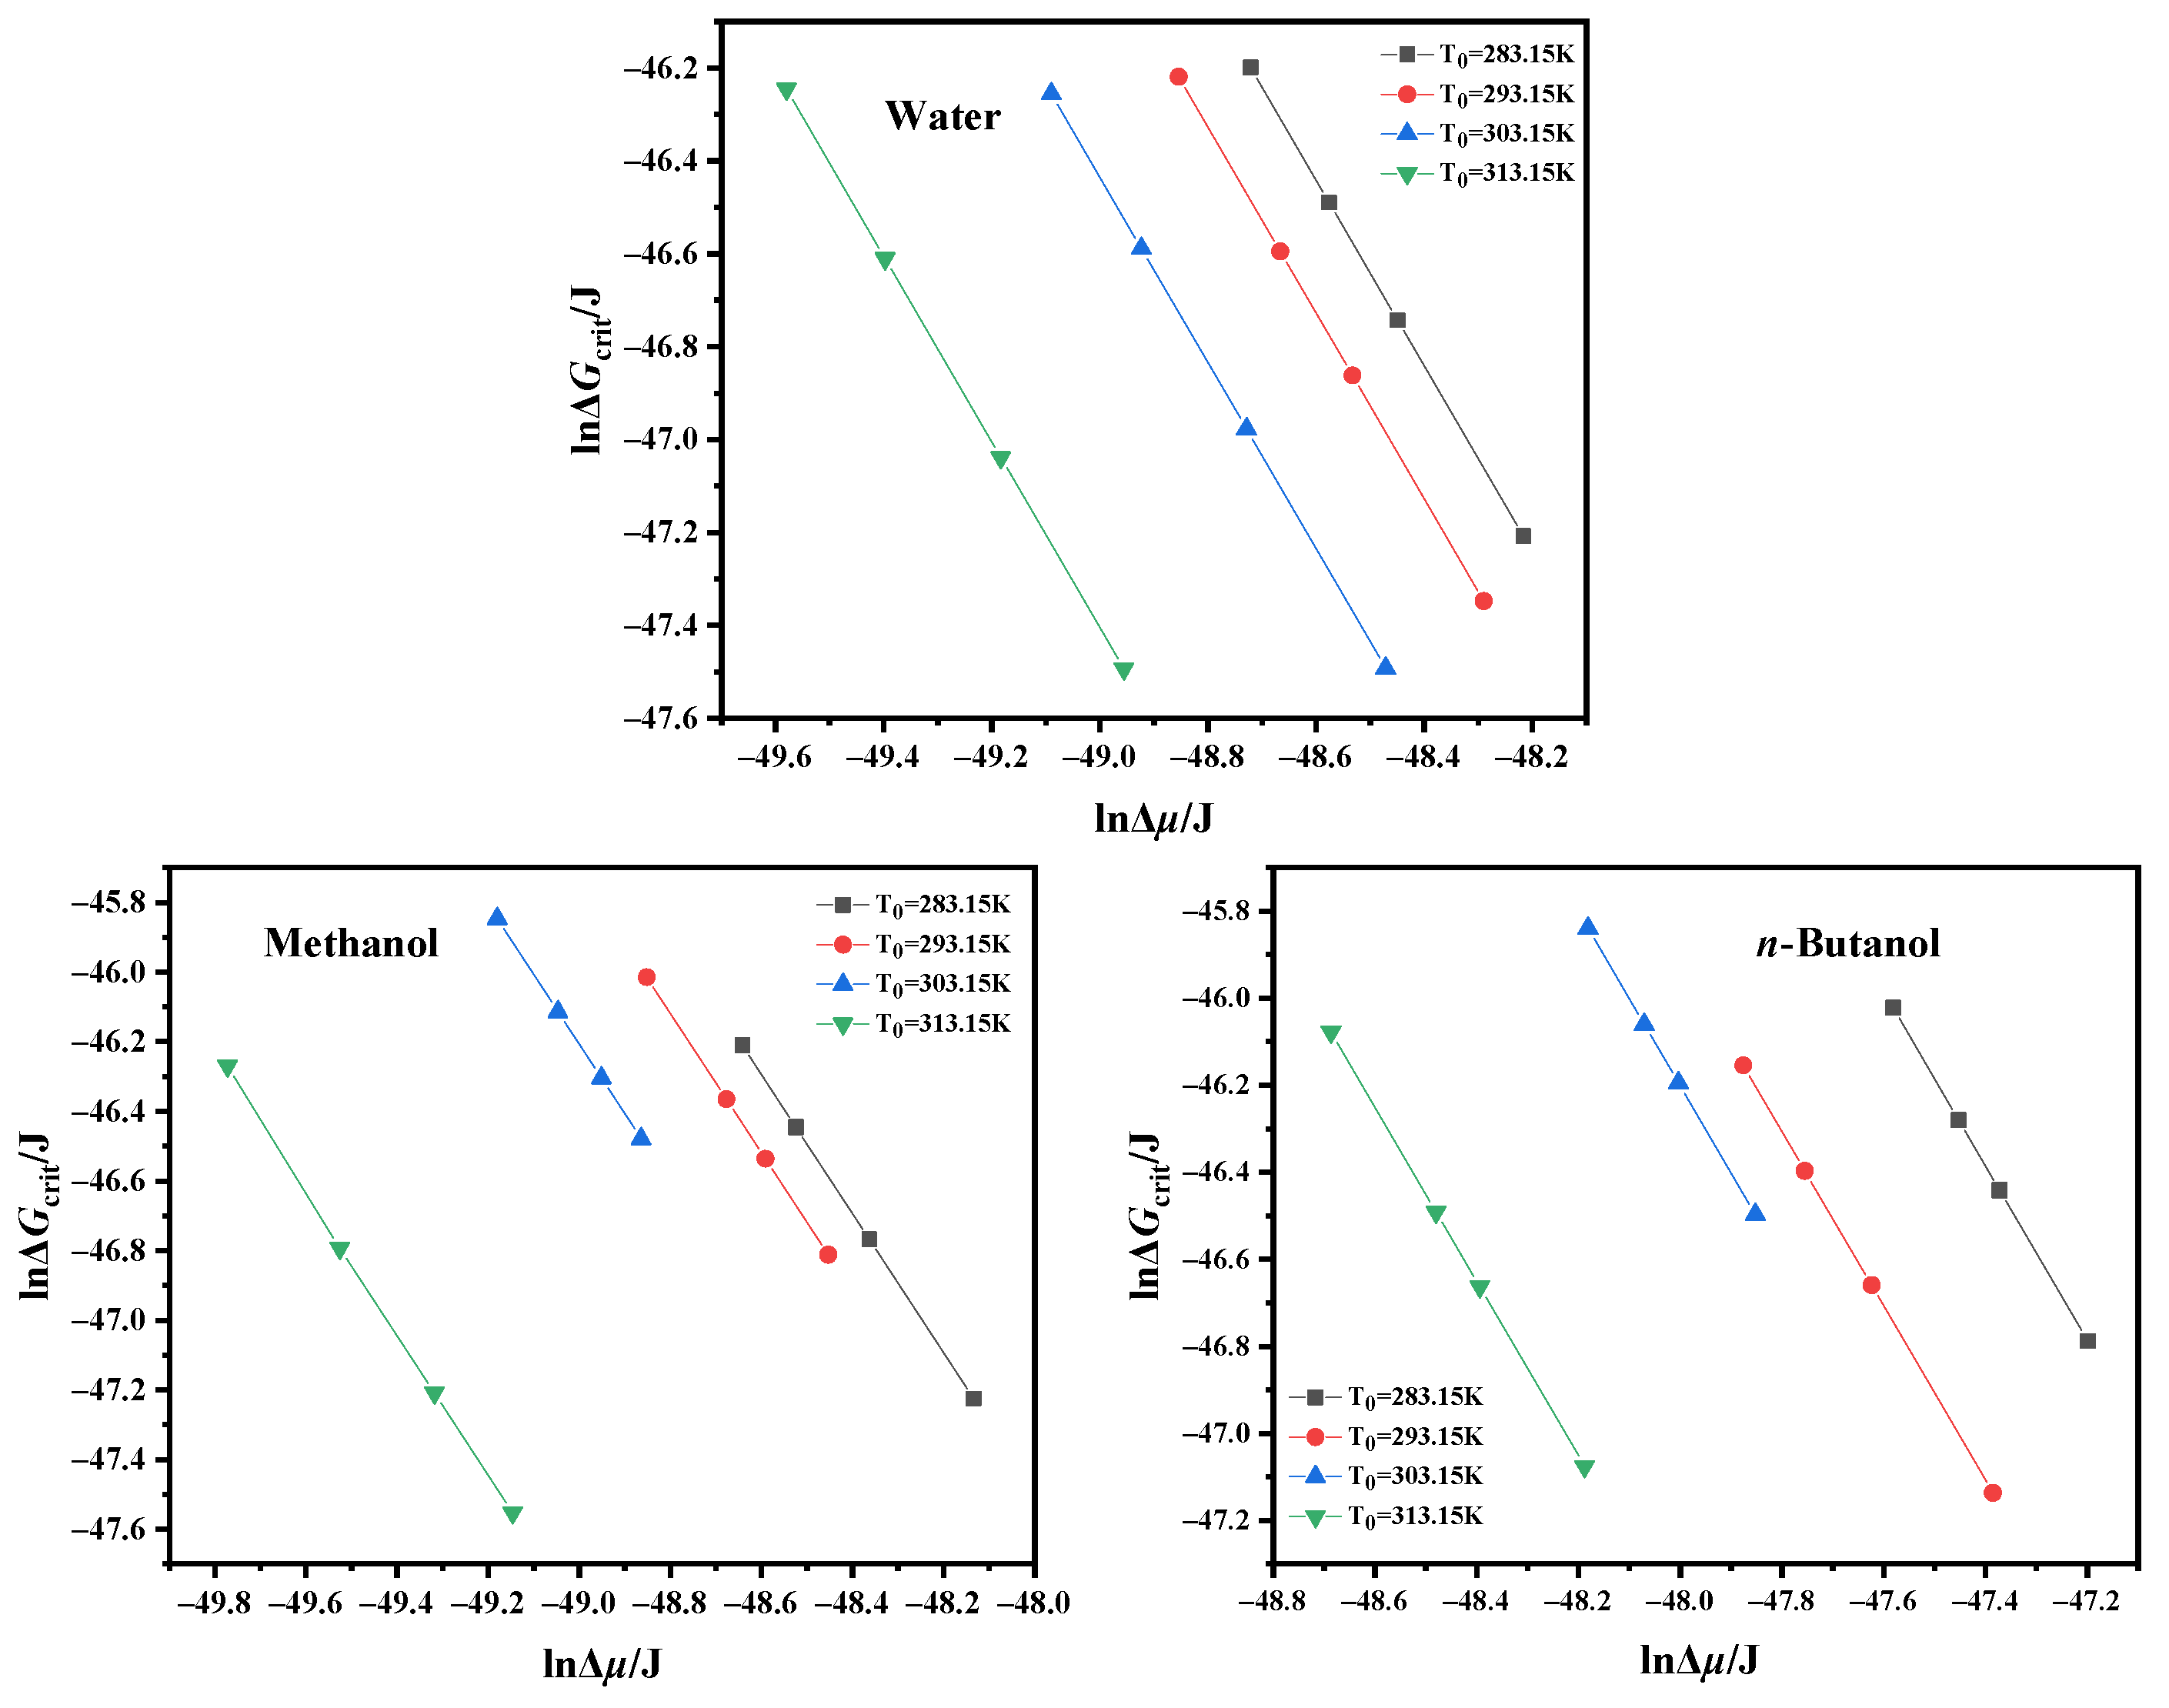
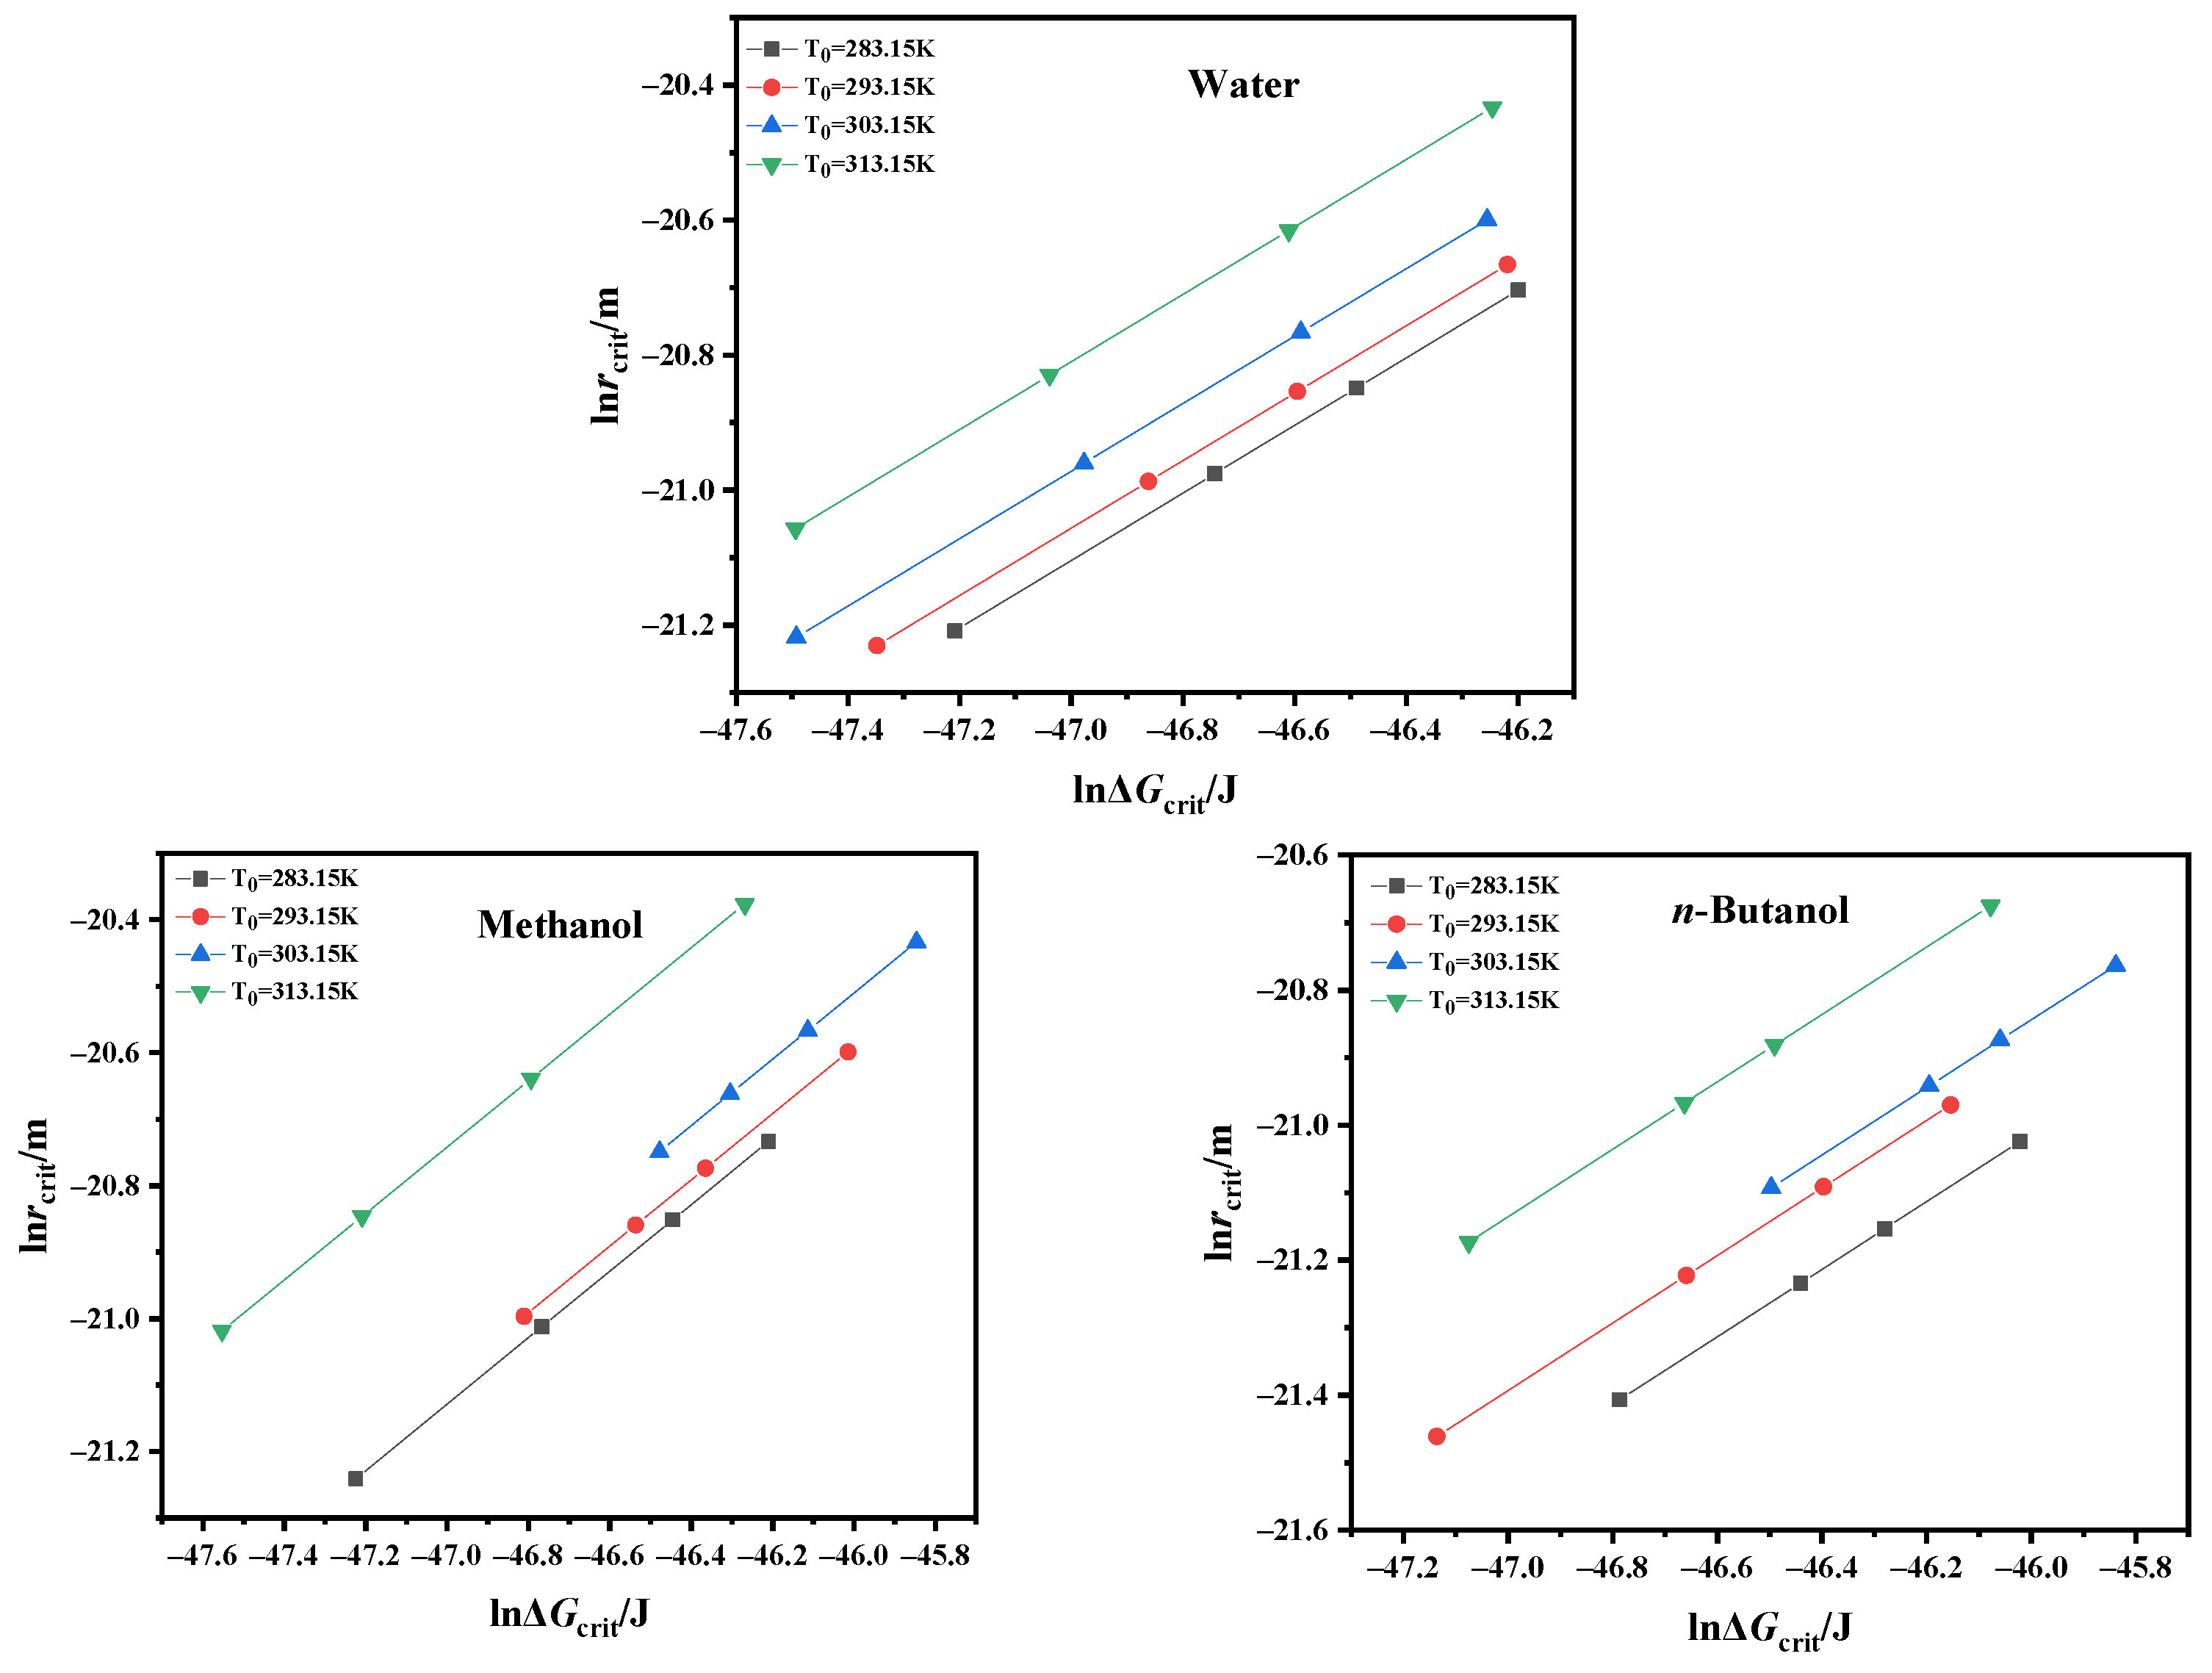
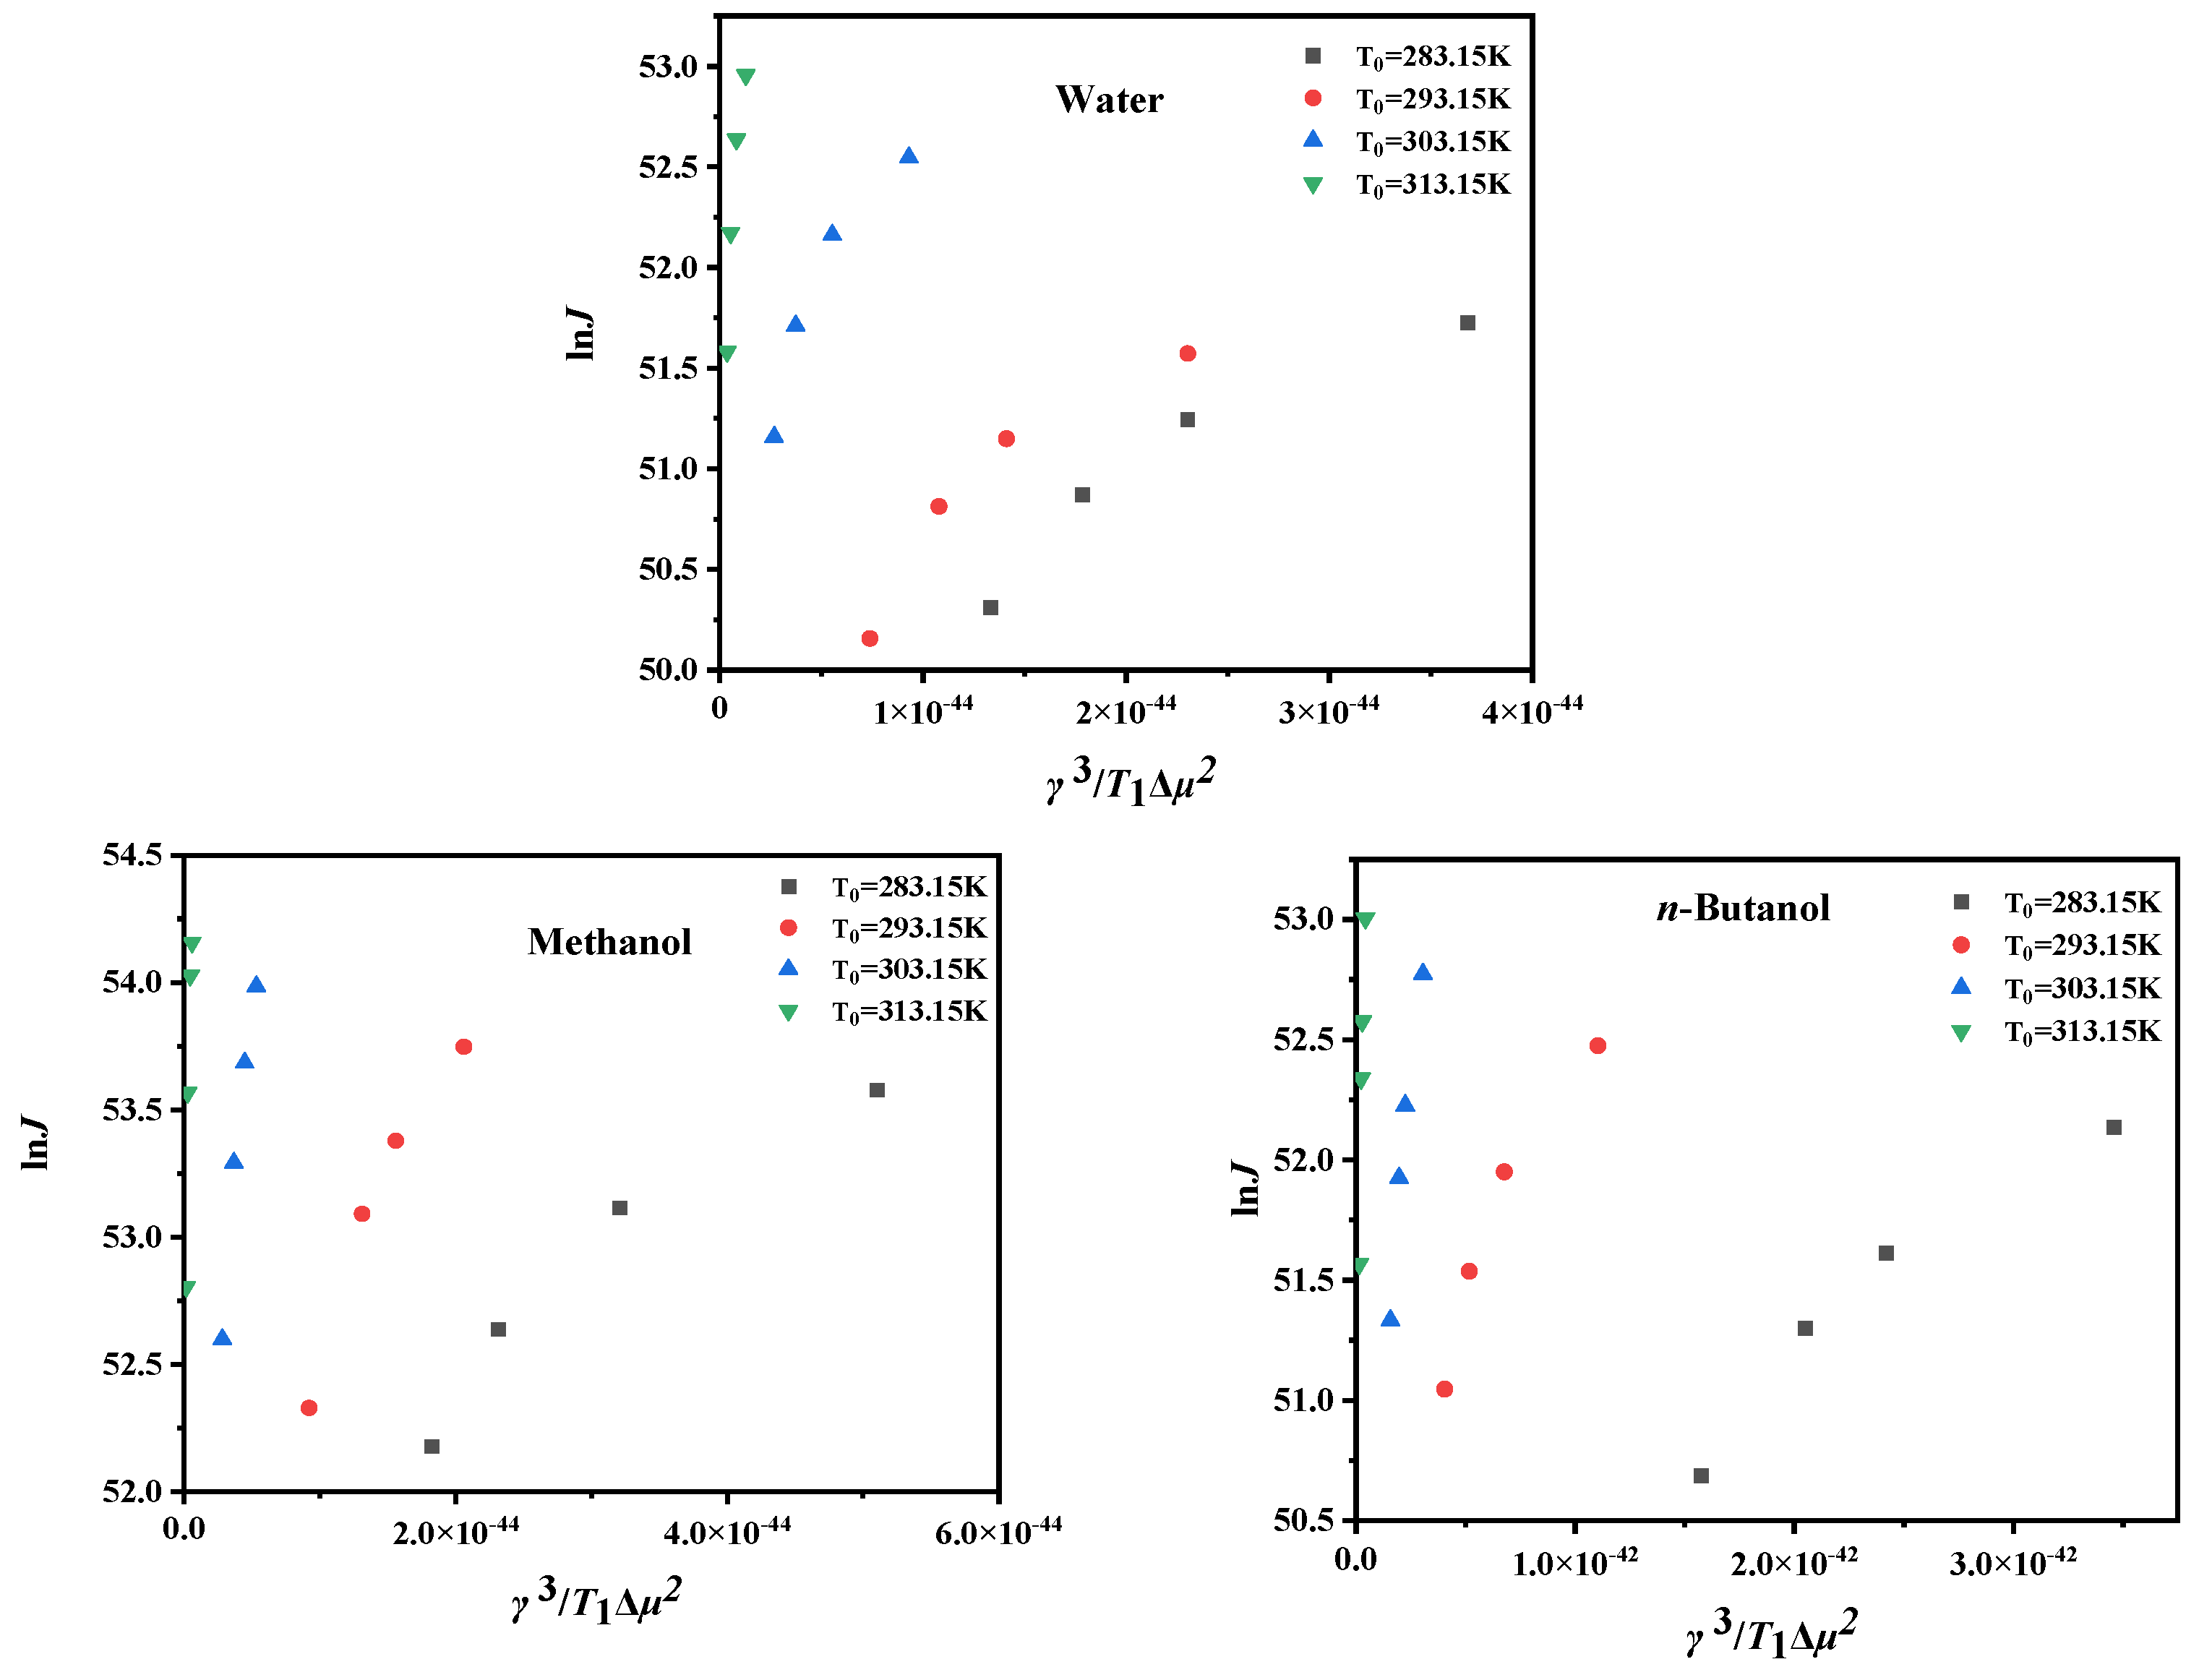
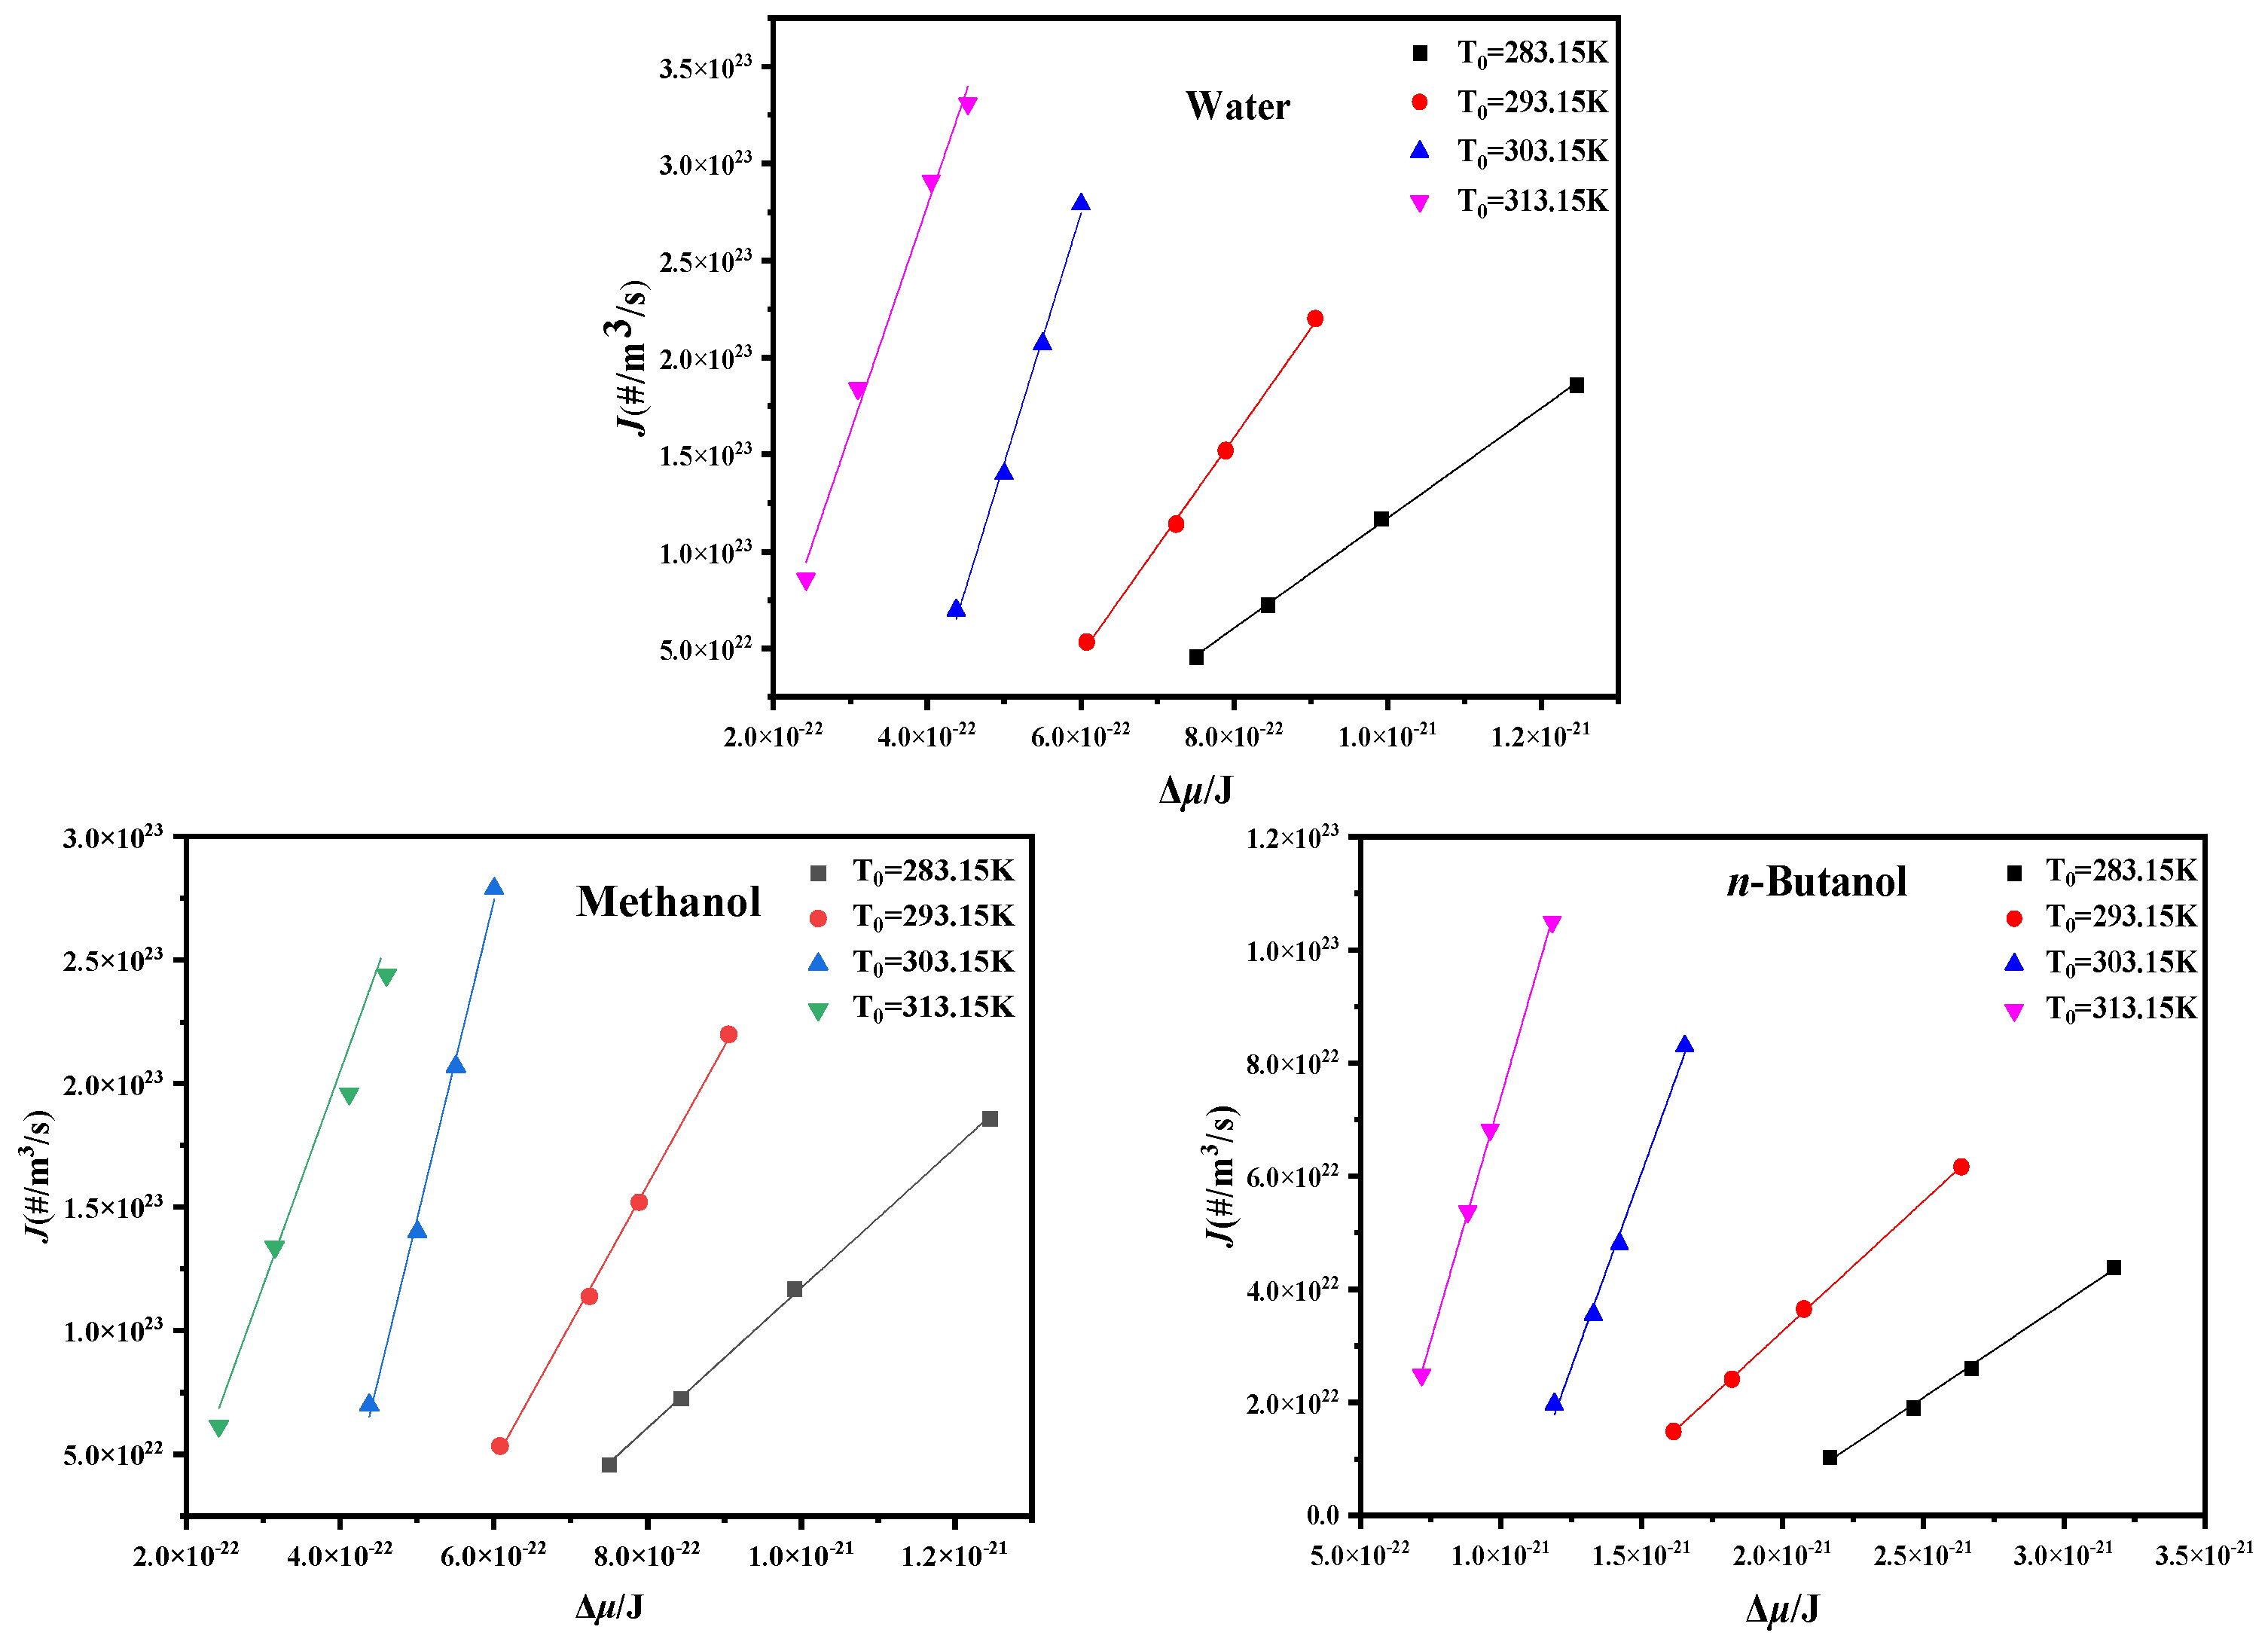
4.3. Critical Nucleation Parameter and Nucleation Kinetic Behavior

In order to explore more detailed information about the nucleation behaviors of adipic acid in different polar solvents in greater depth, the MSZW experimental data of AA are fitted with the modified Sangwal theory. Based on Equations (6)–(7), the solid–liquid interfacial tension and pre-exponential factor can be calculated. As shown in Table 5, at the lowest saturation temperature, the value of A was the maximum in water and minimum in n-butanol. A stands for the attachment rate of the solute molecule. It can be observed that the adipic acid adhesion rate in water and methanol is almost as fast, but is the slowest in n-butanol. This means that nucleation in n-butanol is more difficult. The lowest value of solid–liquid interfacial tension appears in methanol, indicating that it is less difficult for adipic acid to form a solid–liquid interface in methanol. In general, γ decreases with the increment in saturation temperature, which is in accordance with the general rule. The lower the temperature, the greater the tension of the corresponding solid–liquid interface. In Figure 6, the value of solid–liquid interface tension intensively depends on the polar solvent and saturation temperature. When the temperature is certain, the value of solid–liquid interface tension is greater when the solvent polarity is minimal. When the saturation temperature is higher, the solid–liquid interface tension is lower and the connection is not linear. As can be observed in Figure 7, at a constant saturation temperature, the surface tension decreases as the solvent polarity increases. In a given solvent, the surface tension decreases as the temperature increases. This is consistent with the measured data of MSZW, indicating that it is easier to nucleate at higher temperatures. The effect was more pronounced in the dependence of solid–liquid interfacial tension, probably owing to the higher temperature.
Based on Equations (8) and (9), the values of rcrit and ΔGcrit decrease monotonically as the driving force increases if the interface tension is constant. As shown in Figure 8 and Figure 9, as the saturation temperature decreases, it substantially increases the driving force, whereas it decreases the value of rcrit, but the value change in ΔGcrit did not monotonously decrease. Therefore, according to Equations (8) and (12), we believe that ΔGcrit is related to γ. It can be further explored that there is a dependency between γ and T. Similarly, Yang [18] reported the nucleation of ethyl vanillin in different solvents, which showed that ΔGcrit not only changes with the driving force, but there is also a strong connection to solid–liquid interface tension.
Based on Equations (8) and (9), lnΔμ and lnr, and lnΔμ and lnΔGcrit will follow a linear relationship if γ is independent Δμ. In Figure 10 and Figure 11, the driving force, which changes with the cooling rate, has a negative linear correlation with lnrcrit and lnΔGcrit at a constant saturation temperature, respectively. Nevertheless, at different saturation temperatures, the linear relationship between lnrcrit and lnΔGcrit will be destroyed, which should mainly be attributed to the dependence of the solid–liquid interfacial tension on the driving force. It is worthwhile to further study the relationship between γ and Δμ until a solid theoretical foundation has been laid for nucleation control.
Furthermore, the relationship between lnrcrit and lnΔGcrit was calculated, as shown in Figure 12. A good linear correlation between rcrit and ΔGcrit at the same saturation temperature was obtained. At different saturation temperatures, the relationship between lnrcrit and lnΔG is nonlinear. This nonlinear relationship may also be due to an important influence of temperature on the tension of the solid–liquid interface.
Because of Formulas (10) and (12), the relationship between nucleation rate and Δμ can be calculated. If the pre-exponential factor and solid–liquid interface tension were constants, and were not affected by temperature, cooling rate and solvent, lnJ should be linearly related to γ3/T1 ∗ Δμ2. As shown in Figure 13, the value change in nucleation rate with driving force does not follow a linear correlation. In addition, in Figure 14, at a given saturation temperature, J and Δμ are in a straight line relationship. Perhaps this formula does not apply to this system; the reason for this needs to be further studied. When the saturation temperature increases, it is beneficial to increase the rate of nucleation, and it is more beneficial to the nucleation process of adipic acid. When the saturation temperature remains constant, the nucleation rate increases, with successive increases in the cooling rate. We found that the crystallization driving force increased as the saturation temperature decreased. In practice, we find that the nucleation rate does not always increase with the increasing driving force of crystallization, but also depends on the saturation temperature.

5. Conclusions

The purpose of the current study was to mensurate the MSZW of adipic acid in water, methanol and n-butanol at different cooling rates and saturation temperatures. This study has identified that the MSZW of adipic acid is associated with different polar solvents and the hydrogen bond donor ability. The investigation of the MSZW of adipic acid in different polar solvents has shown that the order of the MSZW is n-butanol > methanol > water. As a solvent with an insufficient number of hydrogen bond donors, n-butanol is not conducive to self-assembly of the solute, which leads to difficulty in nucleation. Furthermore, we find that the MSZW is mainly determined by the cooling rate if the cooling rate is large enough. The research has also shown the decrease in solid–liquid interfacial tension with an increase in the saturation temperature and polar solvent. The ΔGcrit and the rcrit do not increase monotonously with the increase in the crystallization driving force, which means that the interface tension is associated with the crystallization driving force. Markedly, one of the more significant findings is that R and T1 will impact gamma and A values together, resulting in J not being linear with the driving force. In practice, at a given saturation temperature, J and Δμ have a linear relationship. Our research provides a solid theoretical basis for the nucleation behavior of adipic acid.

Author Contributions

Conceptualization, X.C. and S.X.; methodology, X.C.; validation, Y.W. and Z.L.; formal analysis, X.C.; investigation, Y.W., X.C. and Z.L.; data curation, X.C., Y.L. and J.G.; writing—original draft preparation, X.C.; writing—review and editing, J.Y. and S.X.; supervision, S.X.; project administration, S.X.; funding acquisition, S.X. All authors have read and agreed to the published version of the manuscript.

Funding

This research was funded by the National Natural Science Foundation of China (Nos. NNSFC 22108204 and NNSFC 22178272); Training Program for Changjiang Scholars and Innovative Research Team in University ([2013]373); Innovative Research Team of Tianjin Municipal Education Commission (TD13-5008); Yangtze Scholars and Innovative Research Team in Chinese University (IRT-17R81).

Institutional Review Board Statement

Not applicable.

Informed Consent Statement

Informed consent was obtained from all subjects involved in the study.

Data Availability Statement

Not applicable.

Acknowledgments

The authors are grateful to the financial support of the National Natural Science Foundation of China (Nos. NNSFC 22108204 and NNSFC 22178272); Training Program for Changjiang Scholars and Innovative Research Team in University ([2013]373); Innovative Research Team of Tianjin Municipal Education Commission (TD13-5008); Yangtze Scholars and Innovative Research Team in Chinese University (IRT-17R81).

Conflicts of Interest

The authors declare no competing financial interest.

References

  1. Wu, H.; Wang, J.; Liu, Q.; Zong, S.; Tian, B.; Huang, X.; Wang, T.; Yin, Q.; Hao, H. Influences and the Mechanism of Additives on Intensifying Nucleation and Growth of p-Methylacetanilide. Cryst. Growth Des. 2020, 20, 973–983. [Google Scholar] [CrossRef]
  2. Zeglinski, J.; Kuhs, M.; Devi, K.R.; Khamar, D.; Hegarty, A.C.; Thompson, D.; Rasmuson, Å.C. Probing Crystal Nucleation of Fenoxycarb from Solution through the effect of Solvent. Cryst. Growth Des. 2019, 19, 2037–2049. [Google Scholar] [CrossRef]
  3. Soto, R.; Rasmuson, Å.C. Crystal growth kinetics of Piracetam polymorphs in ethanol and isopropanol. Cryst. Growth Des. 2019, 19, 4273–4286. [Google Scholar] [CrossRef]
  4. Vekilov, P.G. Nonclassical Nucleation. In Crystallization via Nonclassical Pathways Volume 1: Nucleation, Assembly, Observation & Application; American Chemical Society: Washington, DC, USA, 2020; Volume 1358, pp. 19–46. [Google Scholar]
  5. Kitamura, M.; Hara, T.; Takimoto-Kamimura, M. Solvent Effect on Polymorphism in Crystallization of BPT Propyl Ester. Cryst. Growth Des. 2006, 6, 381–386. [Google Scholar] [CrossRef]
  6. Kashchiev, D.; van Rosmalen, G.M. Review: Nucleation in solutions revisited. Cryst. Res. Technol. 2003, 38, 555–574. [Google Scholar] [CrossRef]
  7. Xu, S.; Zhang, H.; Qiao, B.; Wang, Y. Review of Liquid–Liquid Phase Separation in Crystallization: From Fundamentals to Application. Cryst. Growth Des. 2021, 21, 7306–7325. [Google Scholar] [CrossRef]
  8. Xu, S.; Hou, Z.; Chuai, X.; Wang, Y. Overview of Secondary Nucleation: From Fundamentals to Application. Ind. Eng. Chem. Res. 2020, 59, 18335–18356. [Google Scholar] [CrossRef]
  9. Davey, R.J.; Schroeder, S.L.M.; ter Horst, J.H. Nucleation of Organic CrystalsA Molecular Perspective. Angew. Chem. Int. Ed. 2013, 52, 2166–2179. [Google Scholar] [CrossRef]
  10. Davey, R.J. Crystallization—How come you look so good? Nature 2004, 428, 374–375. [Google Scholar] [CrossRef]
  11. Turnbull, D. Kinetics of Solidification of Supercooled Liquid Mercury Droplets. J. Chem. Phys. 1952, 20, 1824. [Google Scholar] [CrossRef]
  12. Gibbs, J.W. On the Equilibrium of Heterogeneous Substances. Trans. Conn. Acad. Arts Sci. 1878, s3-16, 441–458. [Google Scholar] [CrossRef]
  13. Xu, S.; Wang, J.; Zhang, K.; Wu, S.; Liu, S.; Li, K.; Yu, B.; Gong, J. Nucleation behavior of eszopiclone-butyl acetate solutions from metastable zone widths. Chem. Eng. Sci. 2016, 155, 248–257. [Google Scholar] [CrossRef]
  14. Kobari, M.; Kubota, N.; Hirasawa, I. Computer simulation of metastable zone width for unseeded potassium sulfate aqueous solution. J. Cryst. Growth 2011, 317, 64–69. [Google Scholar] [CrossRef]
  15. Xu, S.; Bu, Y.; Jiang, S.; Yang, P.; Wang, Y. Insights into the Role of Solvents in Nucleation Kinetics of Glutaric Acid from Metastable Zone Widths. Ind. Eng. Chem. Res. 2021, 60, 3073–3082. [Google Scholar] [CrossRef]
  16. Peters, B. Supersaturation rates and schedules: Nucleation kinetics from isothermal metastable zone widths. J. Cryst. Growth 2011, 317, 79–83. [Google Scholar] [CrossRef]
  17. Svard, M.; Rasmuson, A.C. m-Hydroxybenzoic Acid: Quantifying Thermodynamic Stability and Influence of Solvent on the Nucleation of a Polymorphic System. Cryst. Growth Des. 2013, 13, 1140–1152. [Google Scholar] [CrossRef] [Green Version]
  18. Yang, J.; Xu, S.; Wang, J.; Gong, J. Nucleation behavior of ethyl vanillin: Balance between chemical potential difference and saturation temperature. J. Mol. Liq. 2020, 303, 112609. [Google Scholar] [CrossRef]
  19. Yuan, Y.; Leng, Y.; Huang, C.; Yue, M.; Tan, Q. Effects of cooling rate, saturation temperature, and agitation on the metastable zone width of DL-malic acid-water system. Russ. J. Phys. Chem. A 2015, 89, 1567–1571. [Google Scholar] [CrossRef]
  20. Kubota, N. Effect of sample volume on metastable zone width and induction time. J. Cryst. Growth 2012, 345, 27–33. [Google Scholar] [CrossRef]
  21. Rajesh, N.P.; Perumal, C.K.L.; Raghavan, P.S.; Ramasamy, P. Effect of urea on metastable zone width, induction time and nucleation parameters of ammonium dihydrogen orthophosphate. Cryst. Res. Technol. 2001, 36, 55–63. [Google Scholar] [CrossRef]
  22. Quan, Y.; Yang, Y.; Xu, S.; Zhu, P.; Liu, S.; Jia, L.; Gong, J. Insight into the role of piperazine in the thermodynamics and nucleation kinetics of the triethylenediamine–methyl tertiary butyl ether system. Crystengcomm 2019, 21, 948–956. [Google Scholar] [CrossRef]
  23. Marciniak, B. Density and ultrasonic velocity of undersaturated and supersaturated solutions of fluoranthene in trichloroethylene, and study of their metastable zone width. J. Cryst. Growth 2002, 236, 347–356. [Google Scholar] [CrossRef]
  24. Lyczko, N.; Espitalier, F.; Louisnard, O.; Schwartzentruber, J. Effect of ultrasound on the induction time and the metastable zone widths of potassium sulphate. Chem. Eng. J. 2002, 86, 233–241. [Google Scholar] [CrossRef] [Green Version]
  25. Guerbuez, H.; Oezdemir, B. Experimental determination of the metastable zone width of borax decahydrate by ultrasonic velocity measurement. J. Cryst. Growth 2003, 252, 343–349. [Google Scholar] [CrossRef]
  26. Khamar, D.; Zeglinski, J.; Mealey, D.; Rasmuson, A.C. Investigating the Role of Solvent-Solute Interaction in Crystal Nucleation of Salicylic Acid from Organic Solvents. J. Am. Chem. Soc. 2014, 136, 11664–11673. [Google Scholar] [CrossRef]
  27. Sullivan, R.A.; Davey, R.J.; Sadiq, G.; Dent, G.; Back, K.R.; ter Horst, J.H.; Toroz, D.; Hammond, R.B. Revealing the Roles of Desolvation and Molecular Self-Assembly in Crystal Nucleation from Solution: Benzoic and p-Aminobenzoic Acids. Cryst. Growth Des. 2014, 14, 2689–2696. [Google Scholar] [CrossRef] [Green Version]
  28. Mealey, D.; Zeglinski, J.; Khamar, D.; Rasmuson, A.C. Influence of solvent on crystal nucleation of risperidone. Faraday Discuss 2015, 179, 309–328. [Google Scholar] [CrossRef] [Green Version]
  29. Kulkarni, S.A.; McGarrity, E.; Meekes, H.; ter Horst, J.H. Isonicotinamide self-association: The link between solvent and polymorph nucleation. Chem. Commun. 2012, 48, 4983–4985. [Google Scholar] [CrossRef] [Green Version]
  30. Du, W.; Yin, Q.; Gong, J.; Bao, Y.; Zhang, X.; Sun, X.; Ding, S.; Xie, C.; Zhang, M.; Hao, H. Effects of Solvent on Polymorph Formation and Nucleation of Prasugrel Hydrochloride. Cryst. Growth Des. 2014, 14, 4519–4525. [Google Scholar] [CrossRef]
  31. Cui, Y.; Xu, S.; Wu, S.; Du, S.; Cao, Y.; Chen, Y.; Liu, L.; Dong, W.; Gong, J. Temperature and solvent dependent thermodynamic behavior of tetrabromobisphenol A. J. Mol. Liq. 2017, 241, 150–162. [Google Scholar] [CrossRef]
  32. Azhagan, S.; Marianandhakumar, V. Crystallization of pure adipic acid from methanol solvent and their characterization studies: Intense NLO activity from Centrosymmetric crystal. Opt. Int. J. Light Electron Opt. 2021, 227, 166002. [Google Scholar] [CrossRef]
  33. Fan, L.; Peisheng, M.A.; Xiang, Z. Measurement and Correlation for Solubility of Adipic Acid in Several Solvents. Chin. J. Chem. Eng. 2007, 15, 110–114. [Google Scholar]
  34. Rodríguez-Hornedo, N.; Murphy, D. Significance of controlling crystallization mechanisms and kinetics in pharmaceutical systems. J. Pharm. Sci. 1999, 88, 651–660. [Google Scholar] [CrossRef]
  35. Nývlt, J.; Söhnel, O.; Matuchová, M.; Broul, M. The Kinetics of Industrial Crystallization; Elsevier: Amsterdam, The Netherlands, 1985. [Google Scholar]
  36. Sangwal, K. A novel self-consistent Nyvlt-like equation for metastable zone width determined by the polythermal method. Cryst. Res. Technol. 2009, 44, 231–247. [Google Scholar] [CrossRef]
  37. Kubota, N. A new interpretation of metastable zone widths measured for unseeded solutions. J. Cryst. Growth 2008, 310, 629–634. [Google Scholar] [CrossRef]
  38. Gaivoronskii, A.N.; Granzhan, V.A. Solubility of Adipic Acid in Organic Solvents and Water. Russ. J. Appl. Chem. 2005, 78, 404–408. [Google Scholar] [CrossRef]
  39. Chen, G.; Chen, J.; Cheng, C.; Cong, Y.; Du, C.; Zhao, H. Solubility and preferential solvation of econazole nitrate in binary solvent mixtures of methanol, ethanol and 1,4-dioxane in water. J. Chem. Thermodyn. 2017, 111, 228–237. [Google Scholar] [CrossRef]
  40. Welton, T.; Reichardt, C. Solvents and Solvent Effects in Organic Chemistry, 4th ed.; Wiley-VCH: Weinheim, Germany, 2010; pp. 175–198. [Google Scholar] [CrossRef]
  41. Gu, C.H.; Li, H.; Gandhi, R.B.; Raghavan, K. Grouping solvents by statistical analysis of solvent property parameters: Implication to polymorph screening. Int. J. Pharm. 2004, 283, 117–125. [Google Scholar] [CrossRef]
  42. Bhattacharya, S.; Saraswatula, V.G.; Saha, B.K. Thermal Expansion in Alkane Diacids Another Property Showing Alternation in an Odd–Even Series. Cryst. Growth Des. 2013, 13, 3651–3656. [Google Scholar] [CrossRef]
  43. Gopalan, R.S.; Kumaradhas, P.; Kulkarni, G.U. Structural Phase Transition in Adipic Acid. J. Solid State Chem. 1999, 148, 129–134. [Google Scholar] [CrossRef]
Figure 1. Molecular structure of adipic acid.
Crystals 12 00202 g001
Figure 2. The experimental solubility of AA in water, methanol and n-butanol.
Crystals 12 00202 g002
Figure 3. PXRD pattern of adipic acid.
Crystals 12 00202 g003
Figure 4. Relationship between MSZW and cooling rate from 283.15 K to 313.15 K (a) Water, (b) Methanol, (c) n-Butanol.
Crystals 12 00202 g004
Figure 5. Relationship between MSZW and R at the given saturation temperature based on Equation (5).
Crystals 12 00202 g005
Figure 6. Relationship between the solid–liquid interfacial tension (γ) and saturation temperature.
Crystals 12 00202 g006
Figure 7. Relationship between γ and saturation temperature and different polar solvents.
Crystals 12 00202 g007
Figure 8. Relationships between driving force and critical nuclei size.
Crystals 12 00202 g008
Figure 9. Relationships between driving force and nucleation Gibbs free energy.
Crystals 12 00202 g009
Figure 10. Relationships between driving force and critical nuclei size.
Crystals 12 00202 g010
Figure 11. Relationships between driving force and nucleation Gibbs free energy.
Crystals 12 00202 g011
Figure 12. Relationship between lnΔGcrit and lnrcrit.
Crystals 12 00202 g012
Figure 13. Relationship between γ3/T1 ∗ Δμ2 and lnJ.
Crystals 12 00202 g013
Figure 14. Relationship between the instantaneous driving force and nucleation rate.
Crystals 12 00202 g014
Table 1. Sources and mass fraction purity of materials.
MaterialsSourcesMass Fraction Purity
Adipic acidShanghai Aladdin Co., Ltd.≥0.99
WaterSelf-made deionized water
MethanolTianjin Jiangtian Chemical Technology Co., Ltd.≥0.99
n-ButanolTianjin Jiangtian Chemical Technology Co., Ltd.≥0.99
Table 2. Solvent polarity, hydrogen bond donor ability, hydrogen bond acceptor ability and dissolution enthalpy values.
Solvent NamePolarity of SolventαaβbΔS/Rg (K)ΔHs/Rg (K)
water1.00 [40]1.170.479.088484441.29
Methanol0.60 [41]0.430.476.211822747.39
n-Butanol0.47 [41]0.370.487.631633391.46
a Hydrogen bonding donor capacity. b Hydrogen bond acceptor capacity.
Table 3. Experimental MSZW of adipic acid from 283.15 K to 313.15 K.
SolventT0 = 283.15 KT0 = 293.15 KT0 = 303.15 KT0 = 313.15 K
R (K/h)ΔT/KR (K/h)ΔT/KR (K/h)ΔT/KR (K/h)ΔT/K
Water9.53.29.52.99.52.49.51.5
17.53.717.53.517.52.817.51.8
25.54.225.54.025.53.425.52.2
38.55.338.55.138.54.438.52.8
Methanol9.55.69.54.79.53.59.52.0
17.56.317.55.617.54.017.52.6
25.57.425.56.125.54.425.53.2
38.59.338.57.038.54.838.53.8
n-Butanol9.513.19.510.19.57.79.54.8
17.514.917.511.417.58.617.55.9
25.516.225.513.025.59.225.56.4
38.519.238.516.538.510.738.57.9
Table 4. Adipic acid intersects at a certain point at different temperatures.
Solventln(R/T0(T0Tmax))(T0Tmax)2/(T0 − ΔTmax)
Water−15.9212.06
Methanol−13.91−4.27
n-Butanol−15.370.60
Table 5. Value of nucleation kinetic parameters calculated by Equation (5).
SolventT0/KSlopeInterceptγ (mJ/m2])f/AfA
(m3]/s)
Water283.15−12.49−186.821.987.03 × 1024.67 × 10256.64 × 1022
293.15−16.77−263.801.801.53 × 1037.60 × 10254.95 × 1022
303.15−27.73−426.571.521.08 × 1031.26 × 10261.17 × 1023
313.15−72.45−1122.321.101.21 × 1032.10 × 10261.74 × 1023
Methanol283.15−4.17−62.172.081.12 × 1034.70 × 10264.19 × 1023
293.15−5.19−76.451.939.15 × 1026.56 × 10267.17 × 1023
303.15−8.42−121.411.646.66 × 1029.10 × 10261.37 × 1024
313.15−41.24−656.910.973.01 × 1031.25 × 10274.15 × 1023
n-Butanol283.15−0.63−9.014.495.31 × 1028.70 × 10251.64 × 1023
293.15−1.28−19.133.538.66 × 1021.30 × 10261.50 × 1023
303.15−1.75−24.823.204.77 × 1021.92 × 10264.03 × 1023
313.15−6.02−91.392.111.15 × 1032.82 × 10262.46 × 1023
Publisher’s Note: MDPI stays neutral with regard to jurisdictional claims in published maps and institutional affiliations.

