Article

Microstructure-Based Fatigue Modeling with Residual Stresses: Effect of Inclusion Shape on Very High Cycle Fatigue Life

1
State Key Laboratory of Advanced Metallurgy, University of Science and Technology Beijing, Beijing 100083, China
2
Department of Mechanical Engineering, Aalto University, Puumiehenkuja 3, 02150 Espoo, Finland
*
Authors to whom correspondence should be addressed.
Crystals 2022, 12(2), 200; https://doi.org/10.3390/cryst12020200
Submission received: 31 December 2021 / Revised: 23 January 2022 / Accepted: 27 January 2022 / Published: 29 January 2022
(This article belongs to the Special Issue Micromechanical Modelling and Its Applications to Polycrystals)

Abstract

:
When considering the effect of inclusions on fatigue life, the size effect of inclusions is well recognized. However, many of these studies overlooked or decoupled the size effect from the shape features. Therefore, in this study, the influence of the shape characteristics of inclusions with 3 equivalent sizes of 26.6 μm, 13.3 μm, and 4.2 μm on the very high cycle fatigue life of high-strength steels is investigated based on a microstructure-sensitive modeling approach, considering residual stresses. A shape parameter, unifying the aspect ratio and tilting angle of inclusion, is introduced. Based on this parameter, a new formulation of fatigue life with respect to inclusions is also proposed, extending the former one to consider the shape effect of inclusions. It is concluded that the general trend that the fatigue life increases with the decrease in inclusion size is still valid, while the shape features in terms of aspect ratio and tilting angle complicate the quantitative influence of inclusions size significantly. Even for a constant inclusion size, the combination of shape factor and tilting angle could change the fatigue life with one order of magnitude compared with the commonly assumed round shape. These findings would enhance the precision for the fatigue life estimation based on pre-inclusion analysis and also eventually provide new dimensions for inclusion engineering to improve fatigue resistance, as size will not be the only design parameter for fatigue life.

1. Introduction

Fatigue property is an important mechanical property for many kinds of materials. With the improvement of material quality, more focuses are moving from low cycle fatigue to high cycle fatigue (HCF) and very high cycle fatigue (VHCF). With the increase in the circle number before fatigue failure, the main influencing factors on fatigue behavior tend to change. When the circle number is not that large, the most evident factor influencing the fatigue property is the surface quality. Rough surfaces always lead to bad fatigue behavior; meanwhile, for VHCF, the most evident factor turns to internal defects, such as inclusions. Li et al. [1,2] claimed that the inclusion-induced fatigue cracks are in the majority in their research on VHCF.
To reveal the effect of inclusions on fatigue properties, many studies were conducted via experiments and simulations [3,4,5,6]. A majority of them focused on the effect of inclusion size on fatigue life and it is proven that inclusion size indeed plays a significant role in determining the fatigue life of metals [7,8,9,10]. However, recent research also shows that the effect of other features of the inclusions also cannot be neglected, such as the type and shape of inclusions. Fu et al. [11] studied the fatigue behavior under the influence of different types of inclusions and suggested that early fatigue of bearings is governed by SiO2 fragmentation and late fatigue by TiN inclusions. Gu et al. [12] found that the fatigue properties of bearing steels with different amounts of inclusions are dramatically different and the critical sizes of inclusions with different types that trigger fatigue cracks are distinct. Ulrike et al. [13] claimed that different 18Ni maraging steels containing different inclusions also show different fatigue properties and the effect of inclusions on fatigue behavior is related to the combined states between the inclusions and the matrix. Some advanced experimental methods were also adopted in the analysis of fatigue failure and inclusions. Naragani et al. [14] studied the crack initiation mechanism in a Ni-based superalloy specimen with high energy synchrotron X-rays and in situ mechanical testing and found that crack nucleation was easily created due to the inclusion, specifically the residual stress state and local bonding state at the inclusion–matrix interface.
Although the fatigue mechanism, concerning inclusions, has been studied rather thoroughly, it is still challenging to analyze the quantitative effect of inclusions on fatigue life due to the complex features of inclusions and the uncertainty of the inclusion distribution in the matrix materials. To solve this problem, microstructure-based models with inclusions were developed. This type of study for fatigue property was initially introduced by Dunne et al. [15] and McDowell and Dunne [16], and most of them were focusing on the microstructural features of the matrix materials, as they mainly studied the HCF properties. Concerning the VHCF simulation, the investigation team has been continuously developing microstructure-based models by including various inclusions as well as residual stresses between the inclusions and matrix [5,6]. The predicted fatigue life shows a good agreement with the experiment data in terms of the calcium aluminate inclusions and also reflects a clear effect of the inclusion size on the fatigue life.
As mentioned before, in addition to size, inclusions in steels have multiple features, including shape and mechanical/physical properties (Young’s modulus, Poisson’s ratio, thermal expansion coefficient, etc.). The mechanical properties of inclusions are governed by their compositions, which are connected to the generation process of inclusions [17,18,19,20]. The size and shape features belong to geometrical characteristics of inclusions. Except for the size effect, the quantitative correlation between the other features of inclusions and fatigue life is still missing. Therefore, the aim of the current study is to develop a modeling approach, correlating the shape characteristics of inclusions with fatigue life, and eventually establishing a quantitative relation between them for a comprehensive and accurate evaluation of the fatigue life of engineering materials.
The effect of shape features of inclusions on fatigue life is actually not decoupled from the size analysis. There are a few methods of these two features. The simplest one is to adopt the projected area of the inclusion perpendicular to the fatigue loading direction or calculate the equivalent diameter with the projected area. Concerning the inclusion shape, some researchers [21] use eccentricity, defined in Equation (1), to describe the features.
ε = a 0 2 b 0 2 a 0 ,
where a0 is the distance of the intersection of the radius of the two centers of the ellipse where both have the same length; b0 is the trace that is perpendicular to the intersection and the trace between the two centers. The range of ε is from 0 to 1. When a0 equals b0, the ellipse has the shape of a circle. With an eccentricity of ε = 1, the ellipse would transform into a straight line. In this case, the inclusion size can be calculated with Equation (2), as follows:
a r e a = π × a × b .
With these methods, some of the inclusion features can be described well when the shape of inclusions is not complicated. When the local shapes of the inclusion are distinctly different, these methods will lose details during the description. Gu et al. [22] offered a method to recreate the inclusion shape based on the coordinates of inclusion edges. The method can reproduce details of the local inclusion shape well. However, this method is designed for digitalization of existing inclusions in the microstructure model and shows obvious weakness on the analytical assistant of the total effect of a single inclusion on fatigue life due to its complexity. To solve this problem, a new method to describe the inclusion shape is offered in the present study. Using this method, the shape factors, such as aspect ratio and rotation angle, are unified in one single parameter. With the assistance of the new shape parameter, the quantitative relationship between inclusion and the corresponding fatigue life is clarified based on the simulation results of microstructure-sensitive modeling.

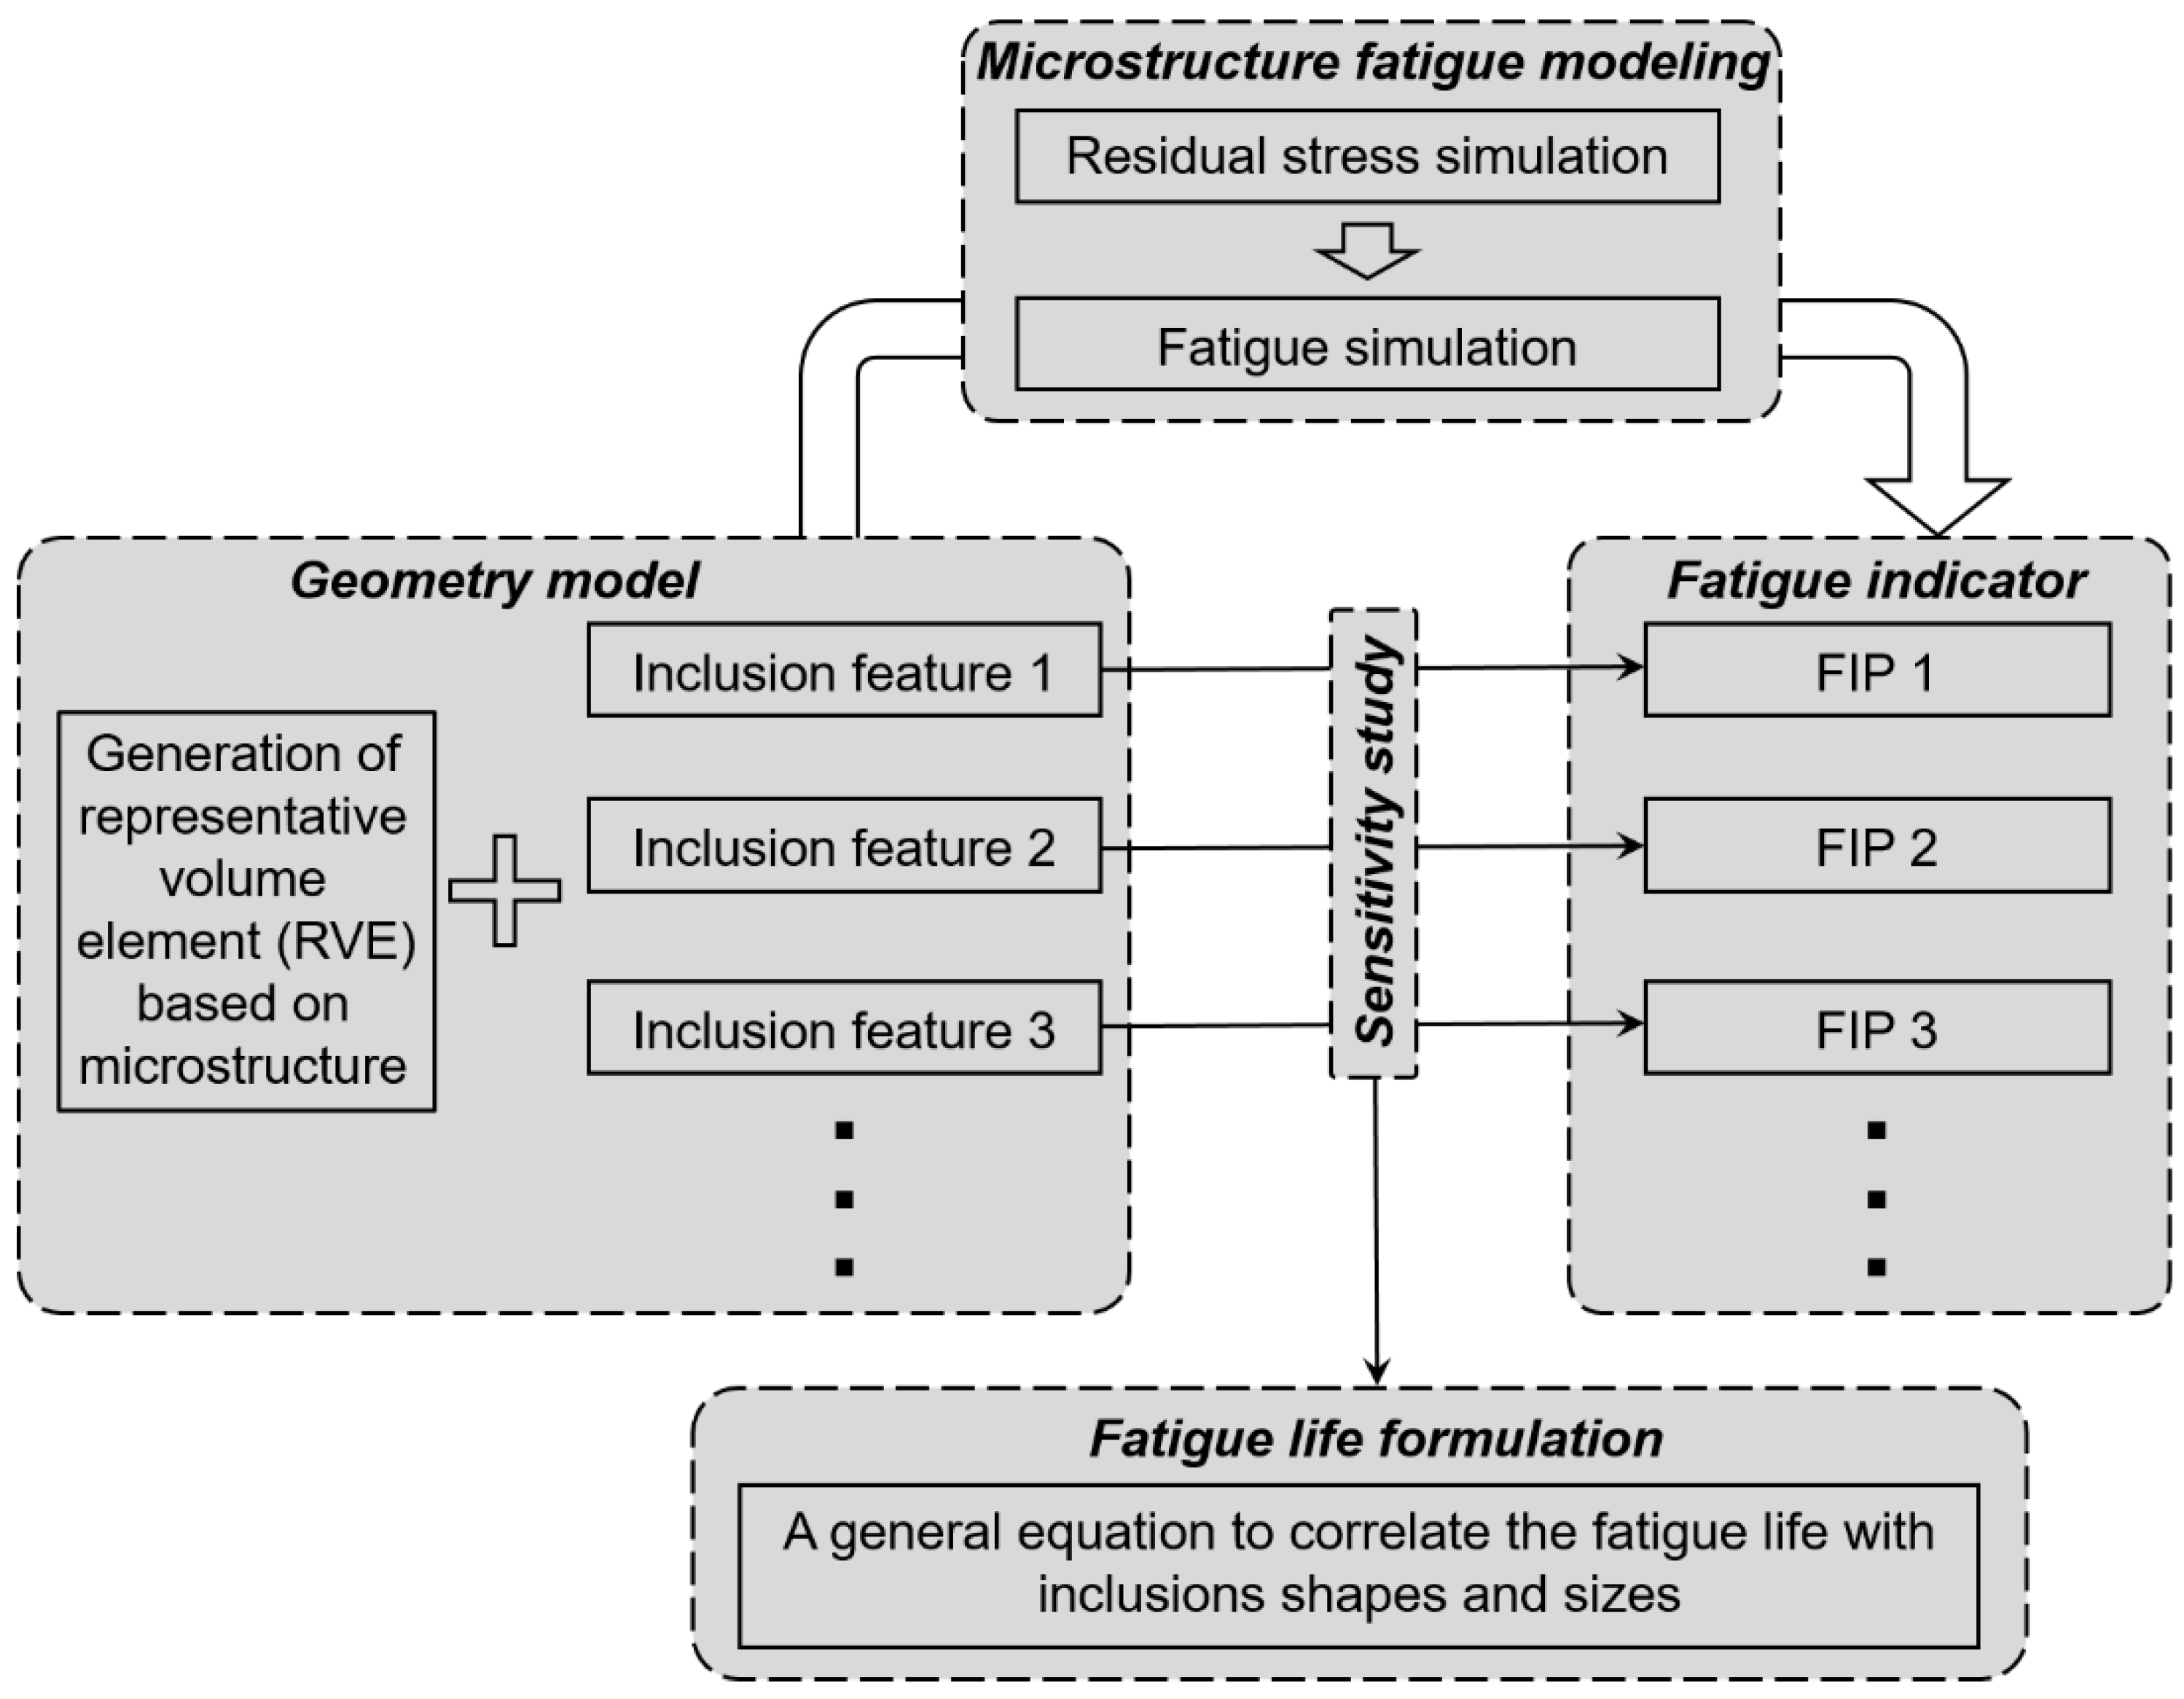
2. Modeling Strategy

The modeling strategy of the microstructure-based fatigue life prediction model with residual stresses can be divided into five steps, as follow: (a) generation of inclusions with various features in representative volume element model; (b) simulation of residual stress and fatigue process; (c) extraction of fatigue indicator parameter (FIP) data to derive the fatigue life for each configuration; (d) conduction of sensitivity study about the shape influence on fatigue life; (e) formulating a general equation to correlate the fatigue life with inclusions shapes. The flow chart of the modeling strategy is shown in Figure 1.

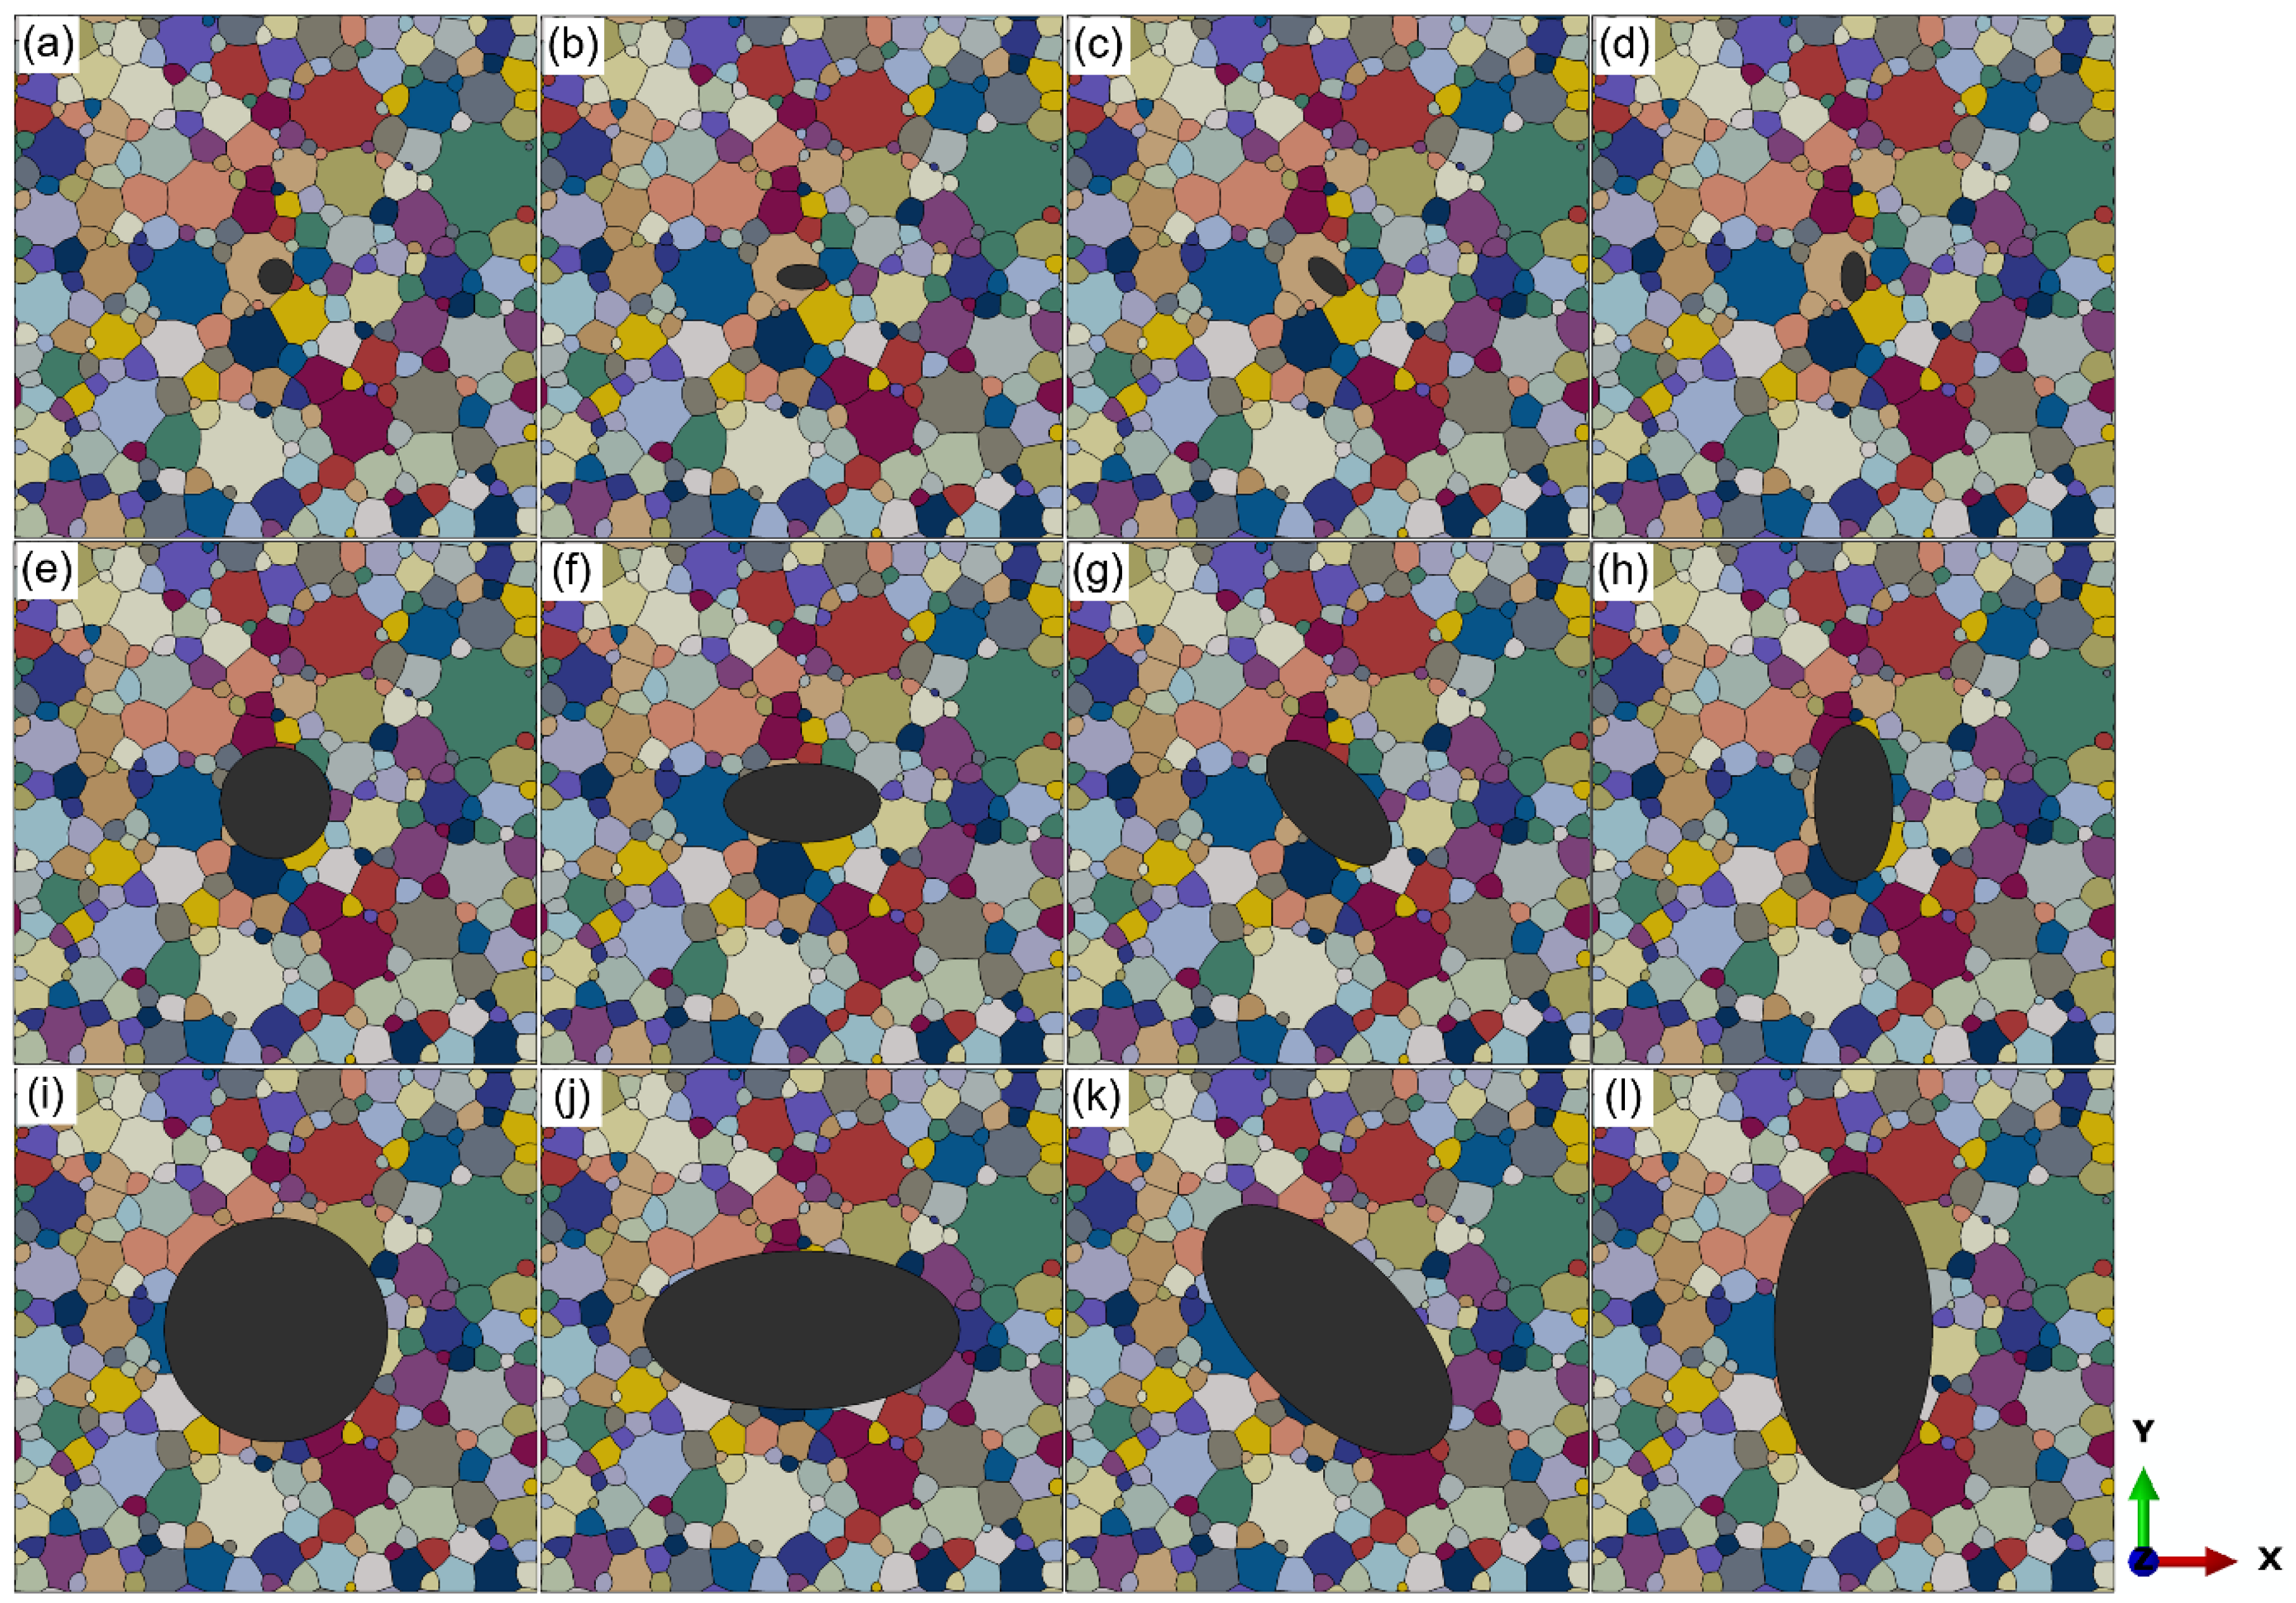
2.1. Reconstruction of Microstructure

The reconstruction of the geometry model of the steel matrix was based on the results from electron backscatter diffraction (EBSD) tests with the assistance of representative volume element (RVE). Instead of direct digitalization of the microstructure graphs, the statistical method was applied during the reconstruction [23]. The characteristic parameters of the virtual microstructure were obtained through the grain size distribution. Further information on grain distribution and a detailed method of RVE generation can be referred to in our previous study [5]. Based on this method, 10 different RVEs were generated to avoid the unreasonable results led by the occasionality of the microstructure in the previous study.

2.2. Digitalization of Inclusions

To describe the inclusion shape accurately, the inclusions were concreted with coordinates of their edges. With the assistance of coordinates, the inclusions were all inserted in the center of the RVEs. In this study, three features of the inclusions were considered: size, aspect ratio, and the rotation angle relative to the loading direction. The inclusion sizes, which were expressed with the square roots of the inclusion area, a r e a , were determined as 26.6 μm, 13.3 μm, and 4.2 μm. For each inclusion shape, the variations of two features, aspect ratio A and the tilting angle θ, are shown in Table 1, as well as their geometry sketches. All the changes of inclusion geometries in Table 1 were based on circle and ellipse. None of the inclusions with sharp edges were considered in this study. In Table 1, aspect ratios are expressed with A (A ≥ 1). When A = 1, the shape of the inclusion is a perfect circle. The tilting angle, θ, as a representation of inclusion orientation, is the angle between the major axis and the loading direction (0° ≤ θ ≤ 180°). Due to the symmetry of 0° ≤ θ ≤ 90° and 90° ≤ θ ≤ 180°, only the case with 0° ≤ θ ≤ 90° are discussed in the present study. For a better understanding of these two parameters, a diagram of an example inclusion is shown in Figure 2. All the 12 cases of inclusions with different   a r e a , A, and θ are inserted in different RVEs constructed in Section 2.1. Figure 3 gives an example of one RVE with different inclusions in the center (the dark grey part represents the inclusion). All the edges of the inclusions were assumed to be tightly bonded with the steel matrix in this study.

2.3. Residual Stress Simulation

During the heat treatment process of quenching, the temperature of the steel decreases sharply, which introduces residual stresses between the inclusion and steel matrix due to different thermal expansion properties and mechanical properties. The residual stress has been proven to affect the fatigue process significantly [24,25]. In this study, the residual stress distribution was simulated and set as the initial condition for fatigue loading, element by element. The simulation was conducted with Abaqus/standard. The inclusions type was chosen as calcium aluminate, which is one of the most common inclusion types existing in steels. The properties of calcium aluminate inclusions are obtained from references and shown in Table 2. For the inclusions, only the elastic properties were considered; while for the steel matrix, elastic and plastic properties were both considered. The mechanical properties of the steel matrix and detailed numerical study on the effect of inclusions with different shapes and types on residual stress distribution were investigated in the previous study [22]. The temperature variation in this study is from 835 °C to 20 °C, which is consistent with the quenching process.

2.4. Crystal Plasticity Model and Parameter Calibration

In the microstructure-based fatigue simulation, the response behavior of the steel matrix to fatigue loading is described by the CP model. The formulation of the model is based on the well-established phenomenological description of slip, which can be found in detail in the review paper by Roters et al. [27]. The model has shown great predictive capabilities in correlating the deformation anisotropy [28], damage [29], and residual stresses [30] with microstructure features. The model was extended to include the kinematic hardening in our previous study [31]. The main equations in this model are shown in Table 3.
In Table 3, the calibration parameters are τ i , τ s , h0, a, γ ˙ 0 , m, G1, and G2, and the elastic parameters are C11, C12, and C44. The calibration was based on the hysteresis loops from low cycle fatigue tests with a fixed strain. The calibration process was iterative with the trial-and-error method. The calibration results for the steel matrix are reported in our previous studies [5,6], which is also shown in Table 4.

2.5. Fatigue Indicator Parameter and Fatigue Simulation

A fully reversed tension–compression (R = −1) fatigue loading in the y-direction (Figure 2) was applied in this simulation. The stress amplitude is predefined, which is 1200 MPa in this study. Six cycles of fatigue loading were acted on the model since the saturated plastic slip per cycle can be generally reached after two cycles, according to multiple studies [32,33]. The local accumulated dislocation slip was recognized as fatigue indicator parameter (FIP) according to the studies of Mughrabi et al. [34,35,36], Dunne et al. [15], Manonukul and Dunne [37], and Cheong and Busso [38]. To obtain the information of FIP accurately and clear the effect of meshing, the maximum grain-level-averaged value was calculated. The local accumulated dislocation slip pacc and the maximum grain-level-averaged value Pmax are calculated with Equations (7) and (8) [31].
p acc = 0 t 2 3 L p : L p d t ,
P max = max ( 1 i = 1 N E Gr V i Gr i = 1 N E Gr p i V i Gr ) ,
where the parameter i is the identifier of the finite element of the involved grain, N E Gr is the number of elements within the grain, and V i Gr is the volume of the element i of the grain. The position of Pmax is identified as the fatigue crack initiation site.
Researchers also studied the relation between Pmax distribution and the cycles for fatigue crack. Gillner et al. [21,31] proposed a method to calculate fatigue life with Pmax and other fitting parameters (Equations (9) and (10)), as follow:
f ( x | A m , B m ) = A m 1 exp ( x B m A m ) exp [ exp ( x B m A m ) ] ,
N f , m = α p d gr ( k P max k N c ) 2 ( 1 + i L ( A m B m ) u σ m ( A m B m ) u m L σ m ) ,
where Am and Bm are the distribution parameters of Pmax under stress amplitude indicating number m; k is the number of RVEs; Nc is the number of cycles to calculate Pmax; d gr is the mean grain size; αp and u are fitting parameters calibrated with at least two fatigue life data; σm is the stress amplitude value under m.
To adopt the method offered by Gillner et al. [21,31], over three stress amplitudes are necessary for the simulation. Besides, at least two experimental fatigue life data under different stress amplitudes are needed for curve calibration. These facts narrow the application scope of this method.
Compared with Gillner et al. [21,31], Boeff et al. [39] proposed a relatively simple method, claiming that the number of cycles to initiate a microcrack is inversely proportional to Pmax (Equation (11)), as follows:
N f = p c Δ P ,
where pc is the critical accumulated plastic slip. ΔP is the accumulated plastic slip per cycle in the stable regime. Since only one stress amplitude was adopted in this simulation, and the method of Boeff et al. [39] was chosen to analyze the relationship between Pmax and cycle Nf.

3. Results and Discussion

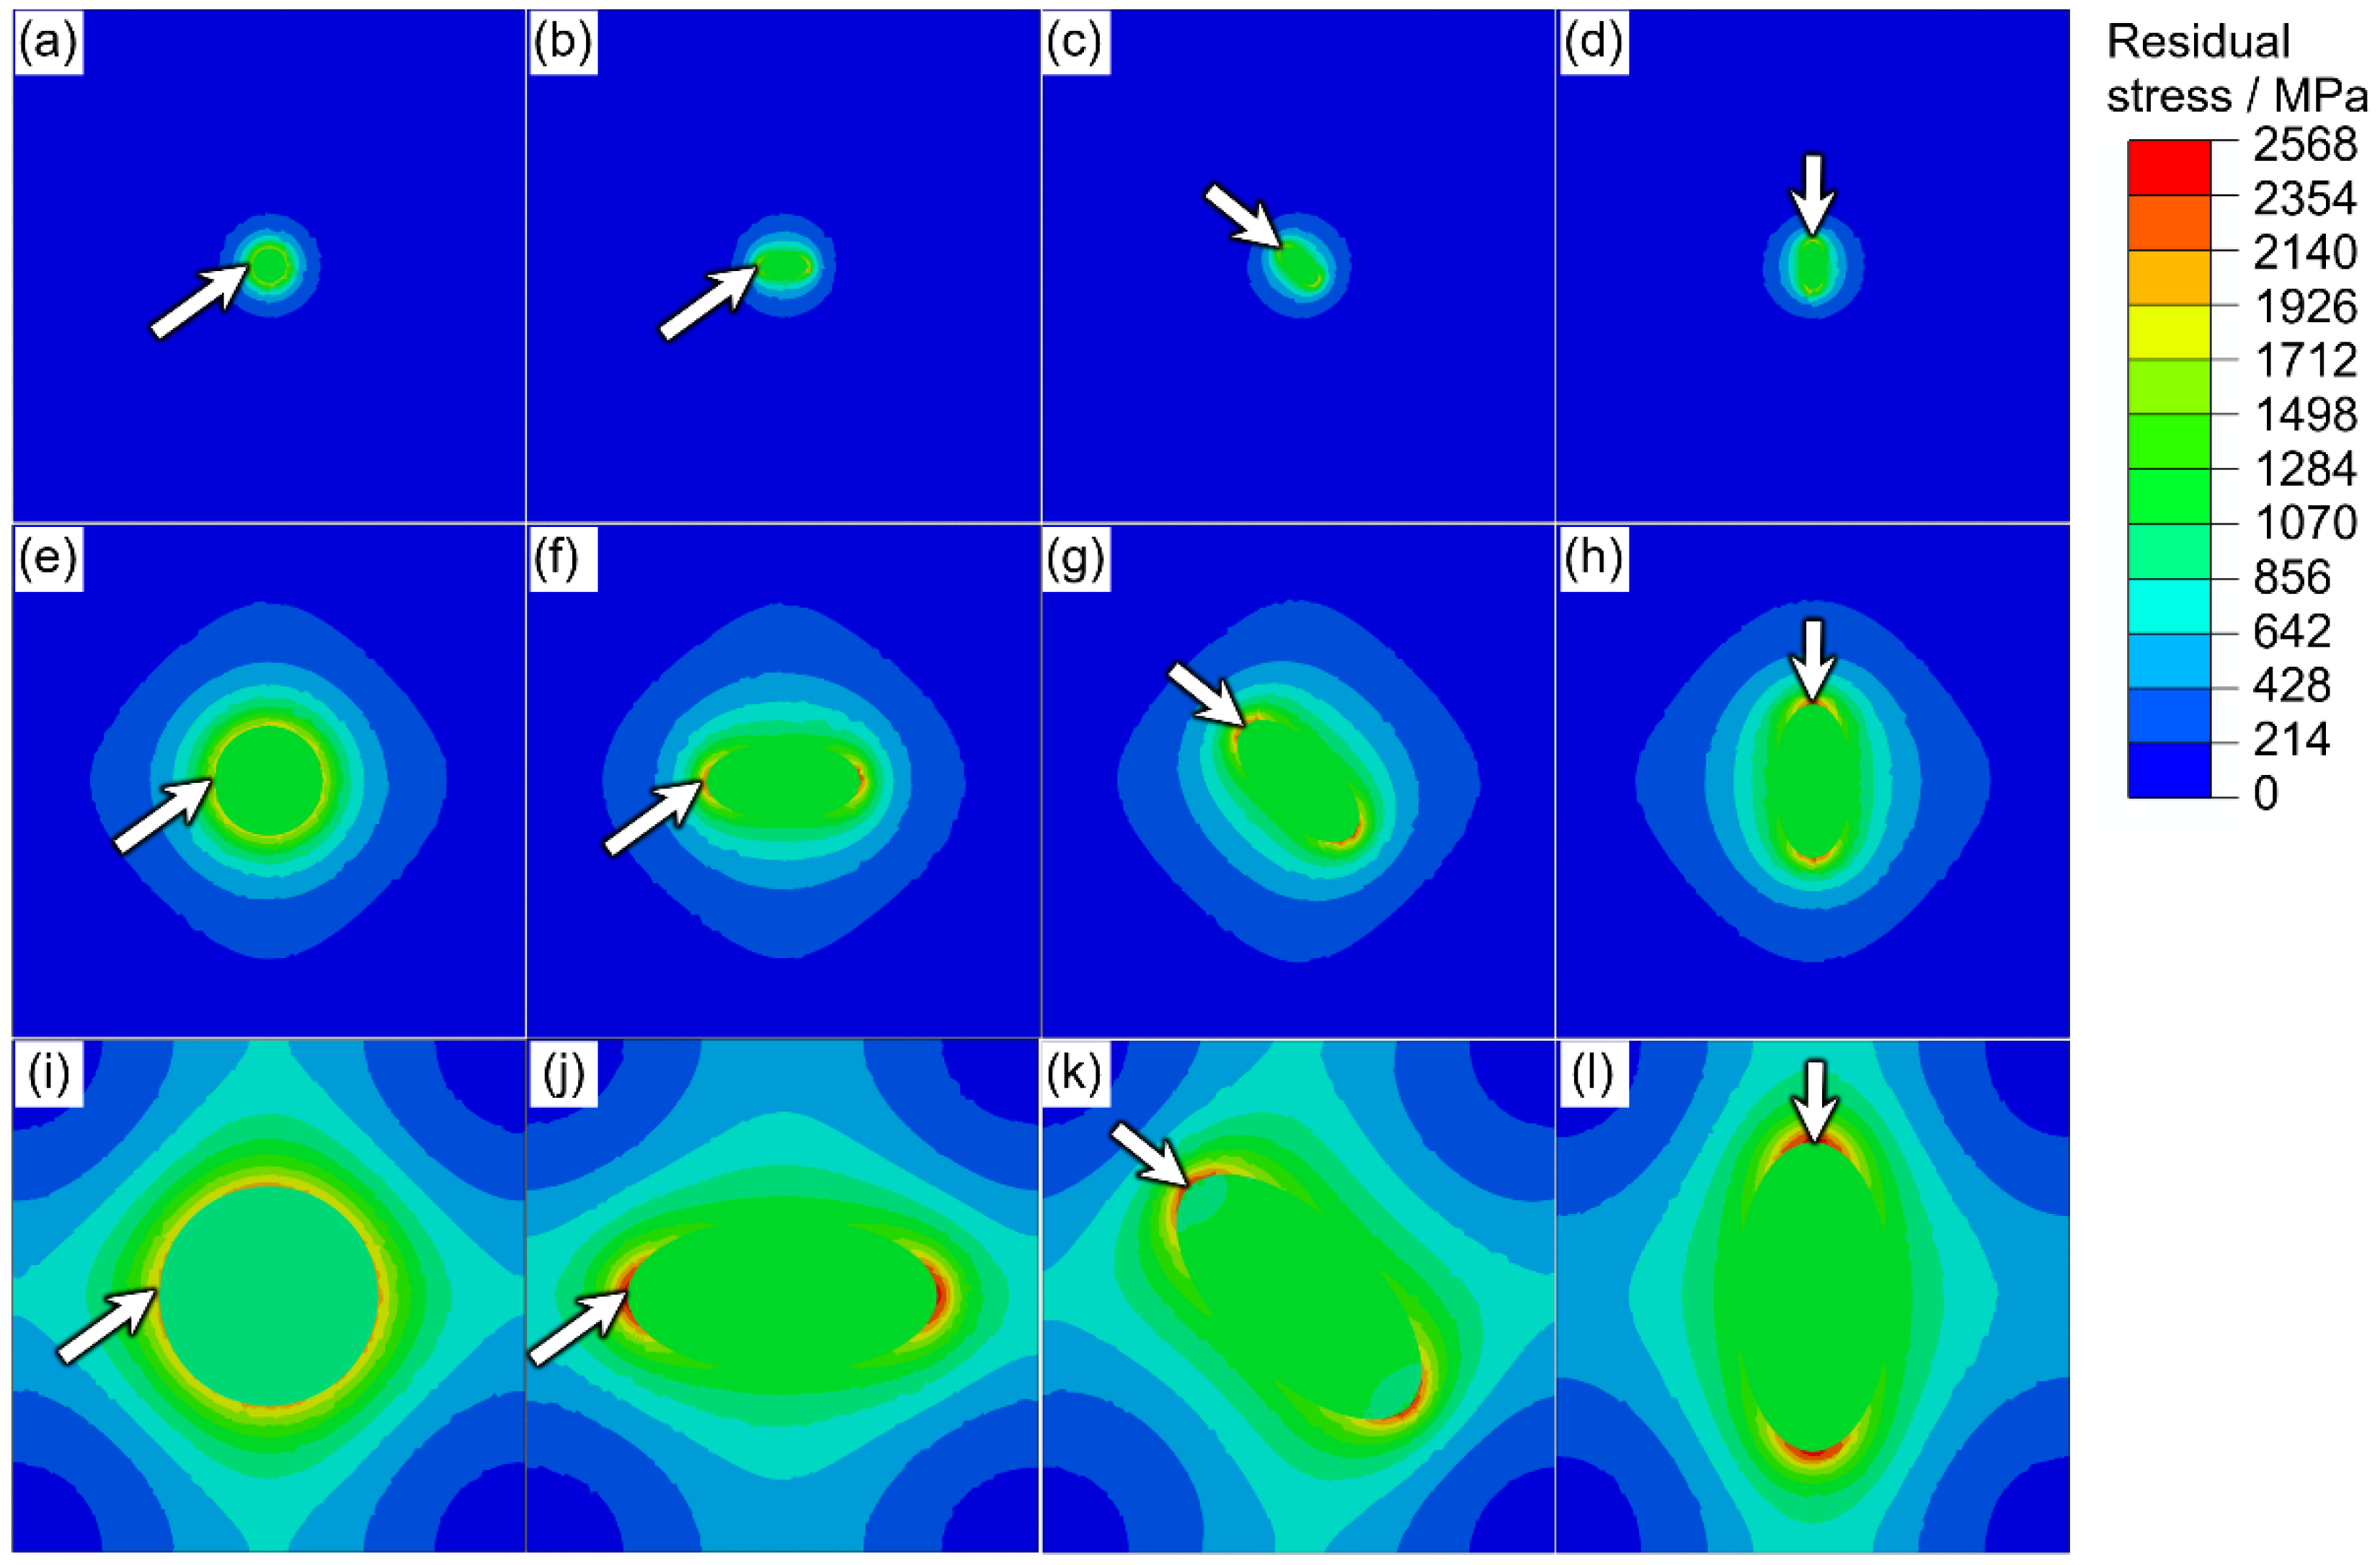
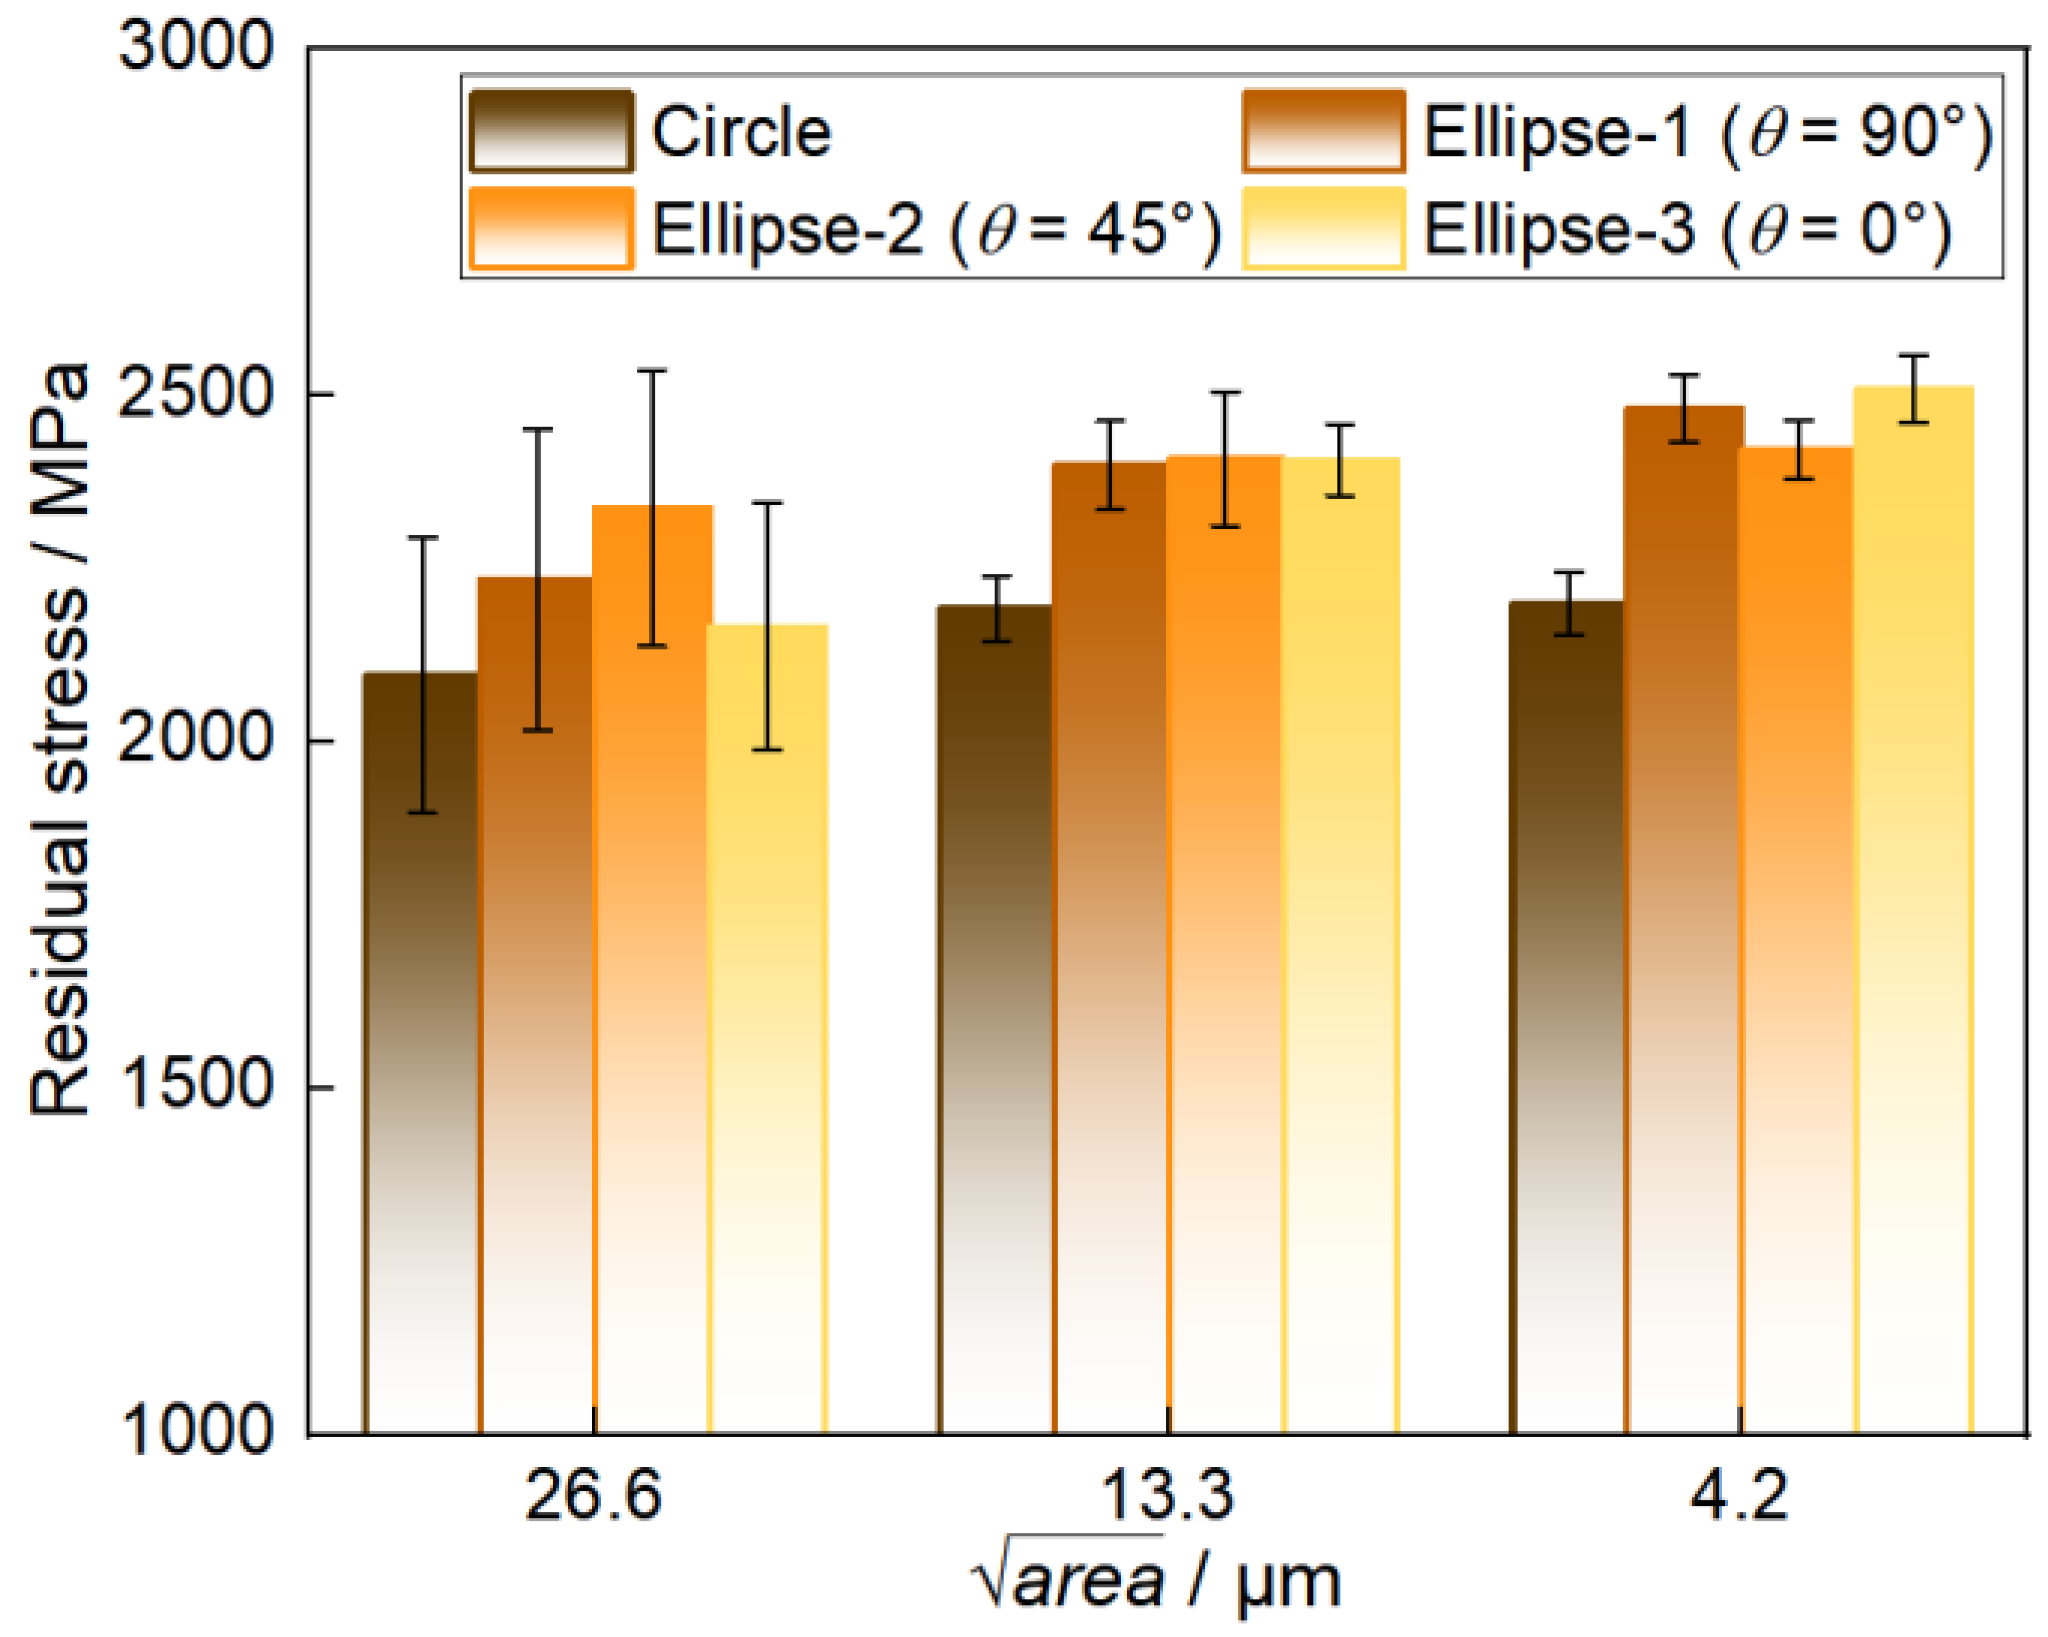
3.1. Residual Stress Distribution with Different Inclusions

Since the residual stress distribution will be the initial state before the fatigue stress loading and the residual stress will significantly affect the fatigue behavior, the residual stress state concerning inclusions with different sizes and shapes will be analyzed in this section.
Figure 4 shows typical residual stress distributions around different inclusions. The residual stress distributions are calculated with the same RVE even though the inclusion features are different. As shown in the figure, the maximum residual stress exists in the boundary between the inclusion and steel matrix. The value of residual stress decreases gradually when the position turns far away from the inclusion. It is also obvious that the residual stress is larger for inclusions with larger sizes when the shape keeps consistent. While for inclusions with the same size, the maximum residual stress around ellipse inclusions appears larger than that around circular inclusion. For elliptical inclusions, the position for maximum residual stress remains at the end of the ellipse due to the largest curvature and the stress concentration.
When the maximum residual stress with different inclusions in different RVEs are all calculated and analyzed, another interesting fact is noticed. Figure 5 shows the average maximum residual stress with different RVEs and the same inclusion and the standard deviation of these data. The standard deviations for inclusions with a r e a   = 4.3 μm are distinctly larger than the larger inclusions no matter what the inclusion shapes are. This fact indicates that for smaller inclusions, especially when the inclusion size is close to the grain size, the value of the maximum residual stress is affected by the microstructure around the inclusion more seriously, compared with the inclusion features themselves. While for larger inclusions, the fluctuation of the maximum residual stress turns smaller under different local features of the microstructure. In this case, the inclusion feature is more important in residual stress analysis.

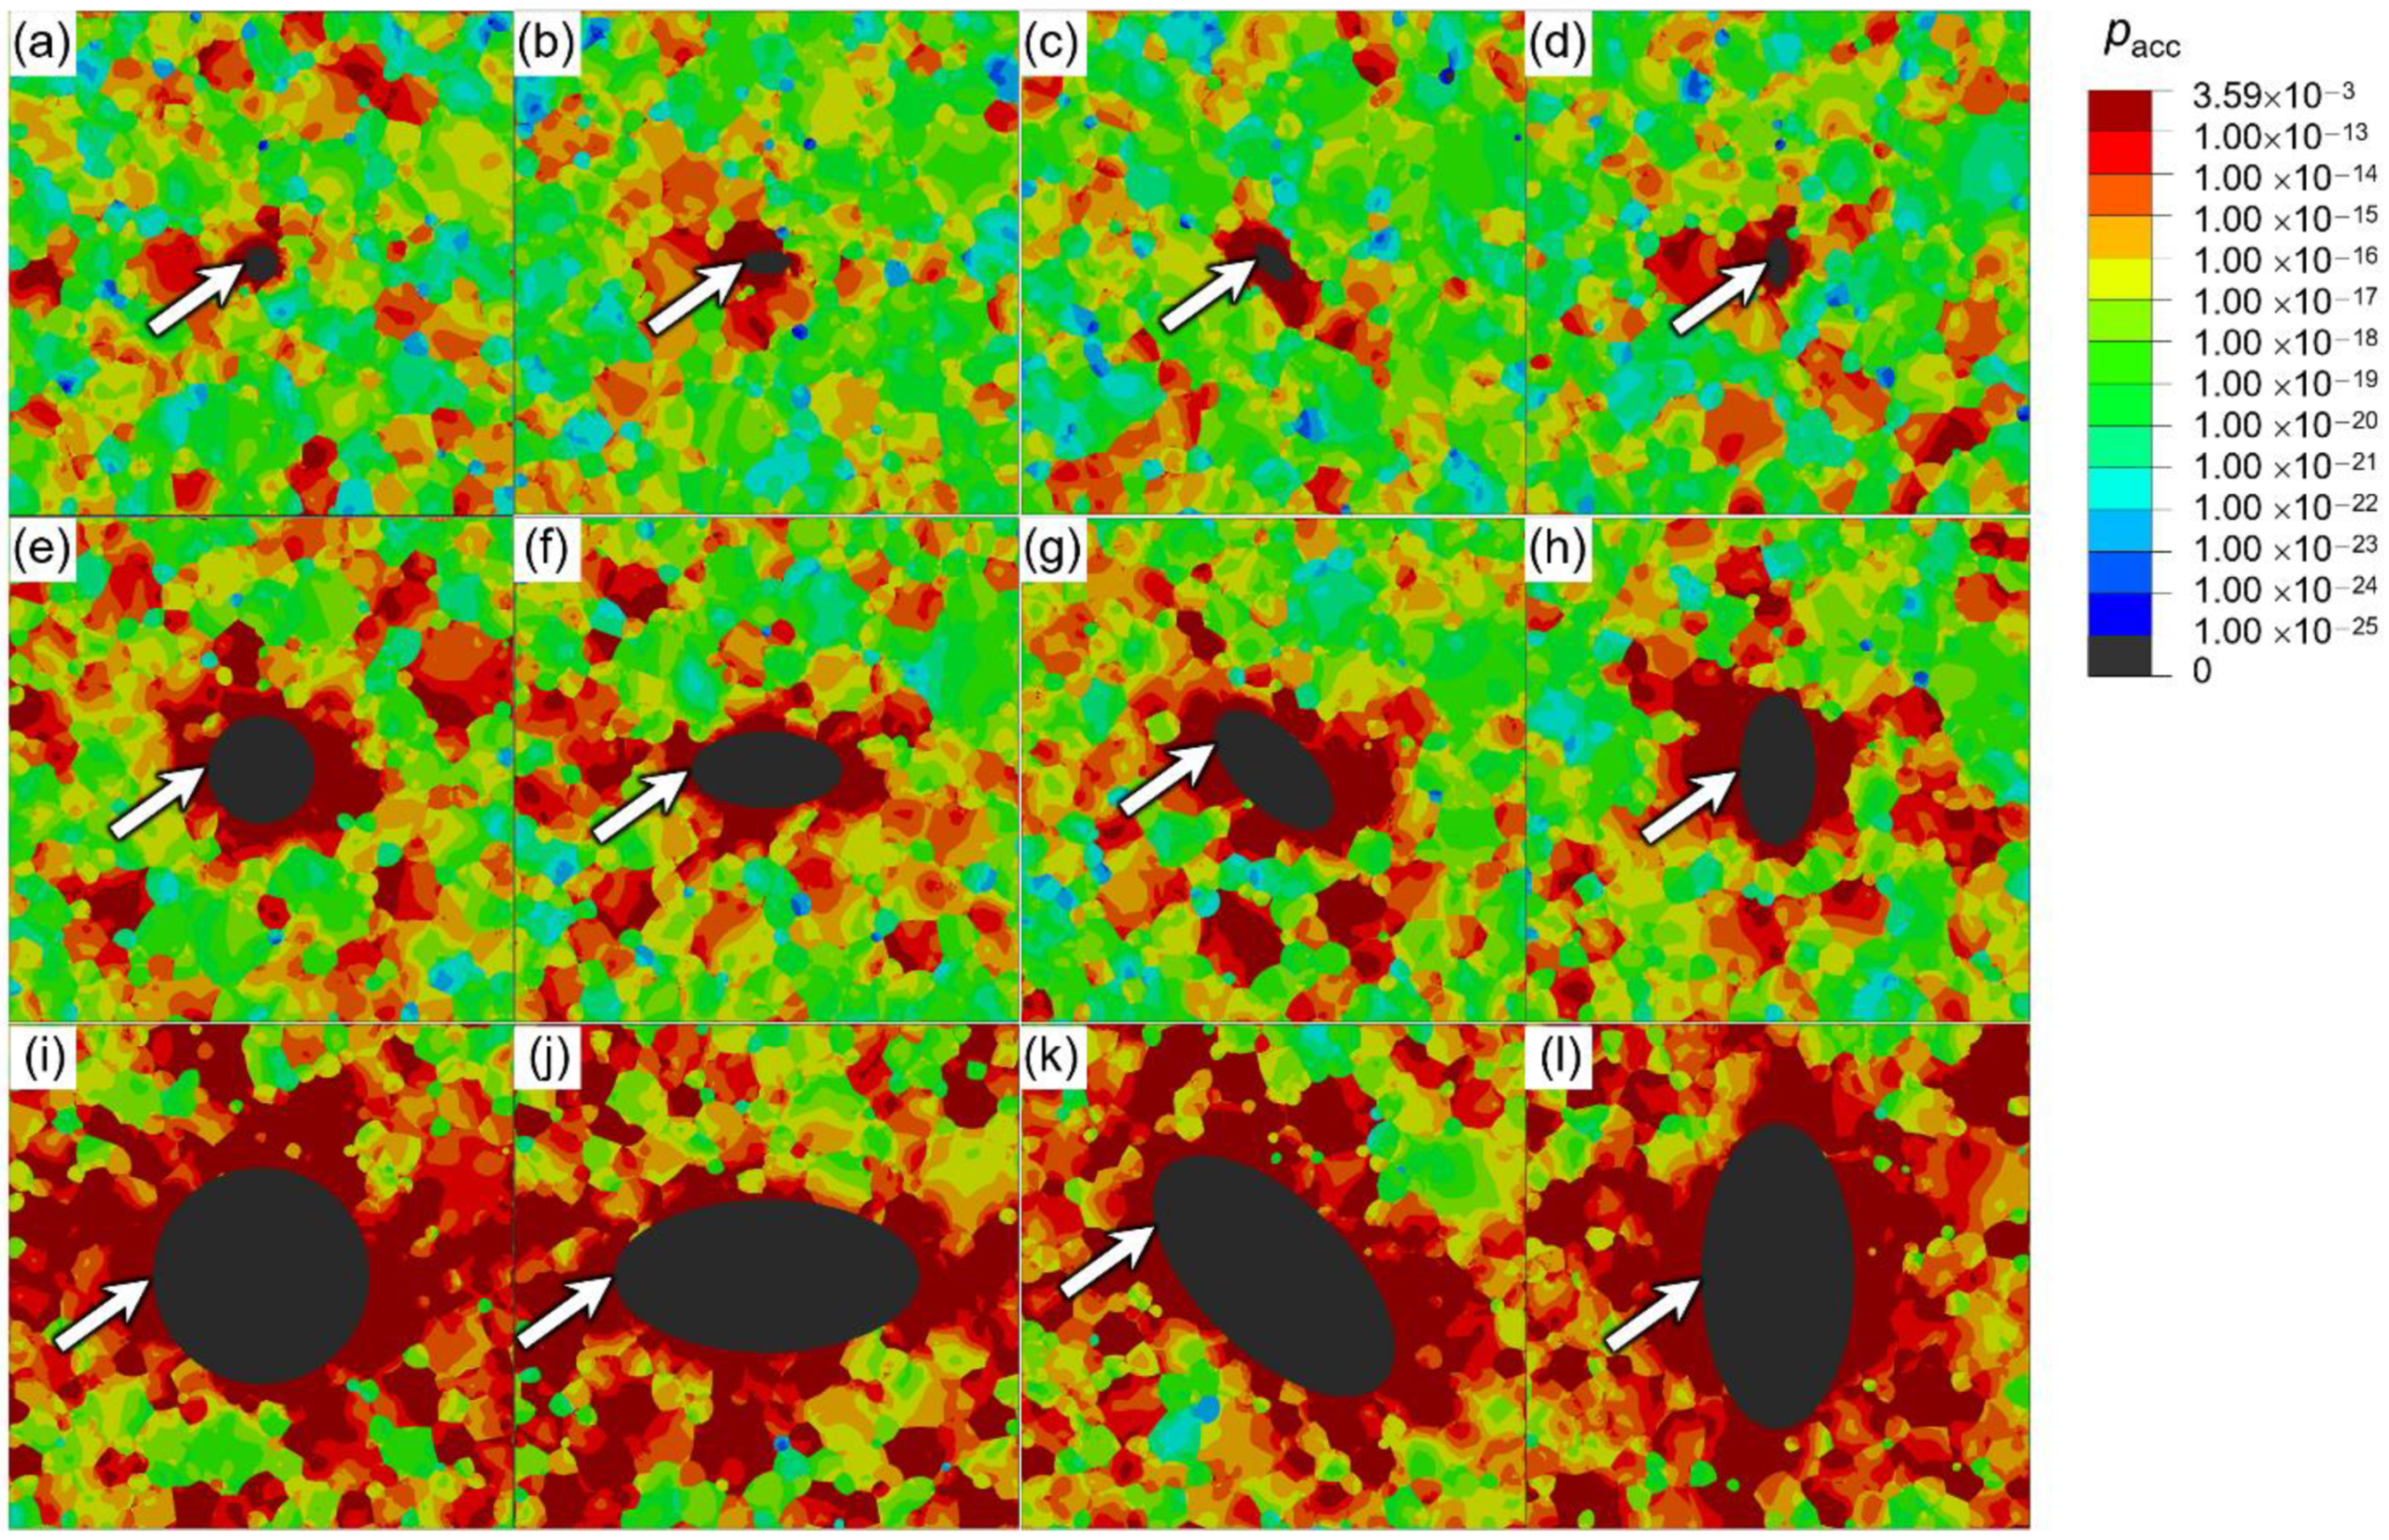
3.2. Fatigue Crack Initiation Site Prediction

To analyze the crack initiation site with inclusions of different characters, Figure 6 shows the pacc contour distributions of steel matrix in typical RVEs with different inclusions. The white arrows point at the position of Pmax. As shown in the figure, the positions of Pmax are all around the inclusions; meanwhile, the specific positions are not exactly the same as those of the maximum residual stress, which are more connected with the loading directions. This conclusion can be proven in the cases of the Ellipse-2 and Ellipse-3 inclusions. In Figure 6c,d,g,h,k,l, the positions of Pmax are not in the sites with the largest curvature of the ellipse. The positions of Pmax are all at the end of the ellipse perpendicular to the loading direction, where the stress concentration is caused by the fatigue loading peaks. In the cases of the present study, the residual stress introduced by heat treatment around inclusions can just affect the value of fatigue life, but cannot constitute a key factor of the fatigue crack initiation site.

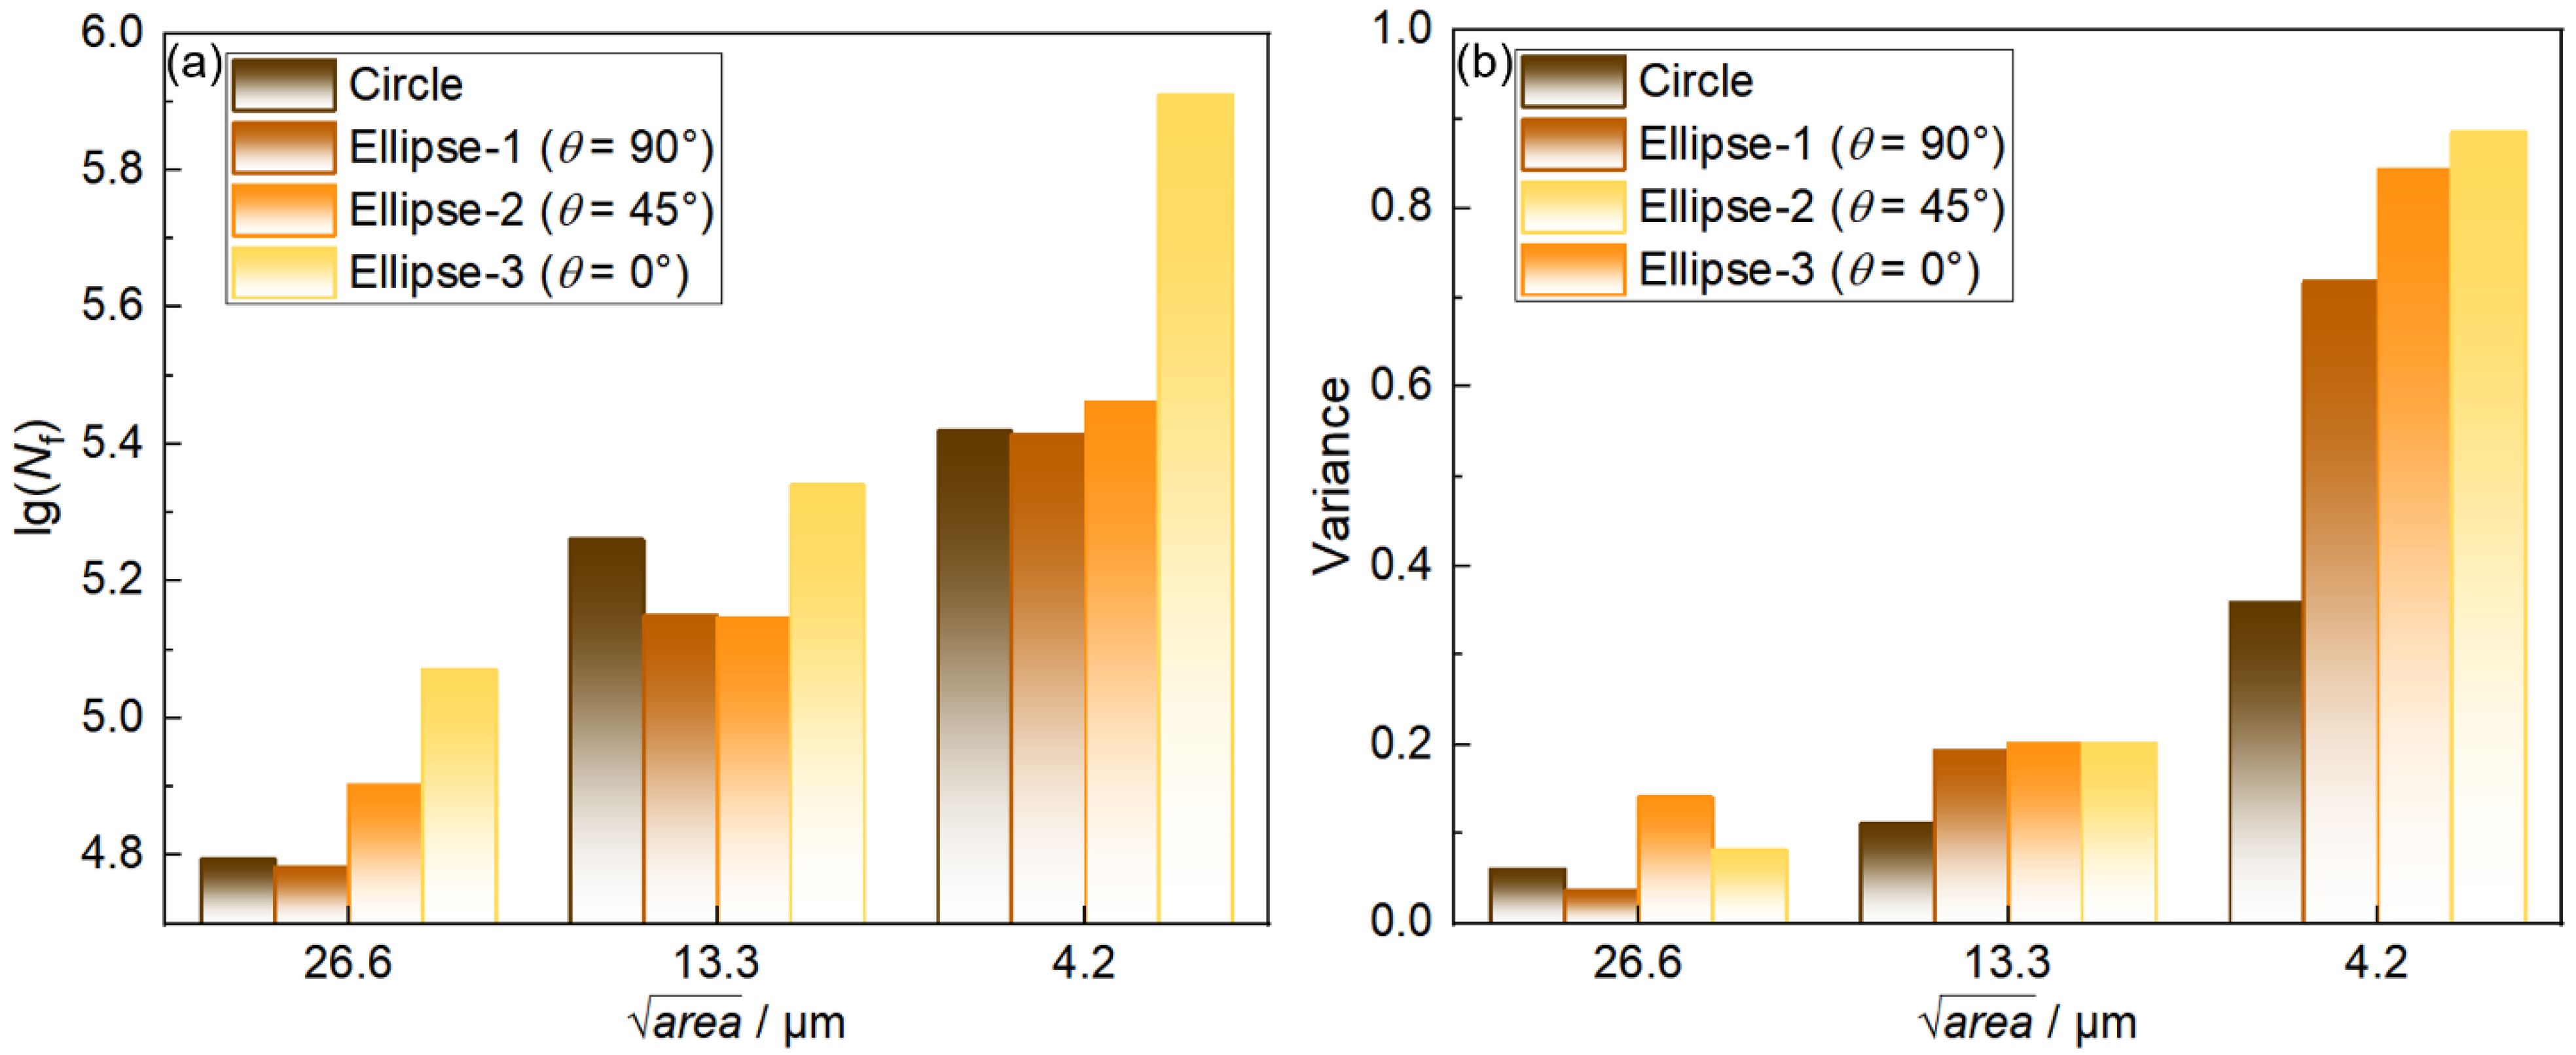
3.3. Fatigue Life Prediction

3.3.1. Results of Fatigue Life Prediction with Microstructure Modeling

To illustrate the effect of the shape features (aspect ratio and tilting angle) on the fatigue life, the material parameter of p c shall be firstly calibrated. This calibration requires one data point in the S–N curve from experimental data. In this study, the experimental results for a circular inclusion with the size of a r e a   = 13.3 μm under the stress amplitude of 1200 MPa are used. The morphology of the fatigue fracture and the composition of the inclusion inducing this fracture is shown in Figure 7. It is emphasized here that p c is considered to be a material intrinsic parameter. Therefore, with one special case of circular inclusion and one stress amplitude, it is plausible to extend it for other extrinsic applications with different inclusion staples and stress amplitudes.
During the calculation of the values of Δ P , the stable cycles in this study are decided from cycle 4 to cycle 6, according to previous studies [5,6]. The average fatigue life of different inclusions is shown in Figure 8a without unifying the shape parameter. The decreased tendencies of fatigue life with the increase in inclusion sizes are similar, but the absolute values appear obviously different with different inclusion shapes. It is also noted that the fatigue life of inclusions with different shapes shows different features when the inclusion size is the same. The fatigue life in the case of Ellipse-3 is the best, while the fatigue life in the case of Ellipse-1 is the worst. The tilting angle also plays an important role in fatigue life. When the aspect ratio is the same (Ellipse-1, Ellipse-2, and Ellipse-3), the fatigue life also varies clearly, especially for the case of Ellipse-3. Based on the simulated Δ P and the experimental fatigue life of inclusions with a r e a   = 13.3 μm, the calculated result of lg( p c ) is 3.2.
Figure 8b also gives the variation of variance values of fatigue life with different inclusions caused by different RVEs, which is the square of the standard deviation. It is noticed that the scatters of the predicted fatigue life of inclusions with a r e a   = 4.3 μm appear larger for all types of inclusion shapes. The scatters of inclusions with a r e a   = 13.3 μm are also larger than those of inclusions with a r e a   = 26.6 μm. This result is quite reasonable since the effect of smaller inclusions on fatigue life is lower and will lead to longer fatigue life and longer fatigue life often means large scatter in fatigue experiments, especially in the VHCF regime.

3.3.2. Inclusion Parameters Unifying and the Formulation of Fatigue Life concerning Inclusion Parameters

In previous studies, the shapes of inclusions were considered as total areas or the projection areas along the loading direction when their effects on fatigue behavior were analyzed, which are quite reasonable and effective under some conditions. However, these assumptions and simplifications cannot fully describe the features of the inclusions, especially for the inclusions with the same projection area but different local shapes. In this section, a new method to describe the size and shape of inclusions is offered with three parameters— a r e a , A, and θ—based on the four kinds of shapes shown in Section 2.2. In the end, an equation S shape = f( a r e a , A, θ)—is proposed, where Sshape is the equivalent area when the inclusion shape is taken into consideration.
Firstly, this method is designed from circular inclusions. For the circular inclusion, the change of θ is meaningless, as long as A = 1. To meet this characteristic, the parameter A and θ is represented with θ × (A − 1). Therefore, the entirety of θ × (A − 1) remains to be 0 no matter how θ changes. However, θ × (A − 1) cannot meet the demands from elliptical inclusions. For elliptical inclusions with θ = θ0 and θ = 180° − θ0, the effects on fatigue behavior are the same due to the symmetry effect. Therefore, the trigonometric function sinθ is introduced accordingly. θ × (A − 1) is improved to be sinθ × (A − 1). Under this circumstance, the values of sinθ × (A − 1) for circle inclusion and Ellipse-3 inclusion are both 0. However, the effects of these two inclusions on fatigue are obviously different. To solve this problem, the parameter A is recalled. Additionally, the value 0 of sinθ × (A − 1) will also cause trouble when it shows in the denominator in the function, hence the function to describe inclusion shape becomes Asinθ × (A − 1). The values of these expressions are shown in Table 5 for better understanding.
According to the data regulations, when the shapes of inclusions were considered as total areas or the projection areas along the loading direction, the increase in Asinθ × (A − 1) will lead to the increase in the inclusion effect on fatigue life. Therefore, S shape = f( a r e a , A, θ) is expressed with Equations (12) and (13), as follow:
ξ = A ( sin θ h ) × ( A 1 ) ,
S shape = a r e a ξ ,
where ξ is the inclusion shape parameter. It is noted that an extra parameter h is also inserted in this equation. This parameter is designed for adjusting the influence weight of A and θ and balancing the synergistic effects of these two parameters, which will be fitted later.
To decide the value of parameter h, multiple values of h are applied to the calibration trials. The variations of shape indicator ξ under different shapes are shown in Figure 9. For circle inclusion, the value of ξ keeps constant. While for Ellipse-1, Ellipse-2, and Ellipse-3 inclusion, the value of ξ decreases, and the decreasing rate is slightly flattened with the increase in h.
As presented in previous studies, the logarithm of fatigue life, Nf, can be expressed with a power function of stress amplitude and a r e a . In this study, the stress amplitude is not considered as a variable, thus Nf will be fitted with a power function of a single variable S shape , where S shape is a replacement of a r e a , as shown in Equation (14).
lg ( N f ) = a × ( S shape ) b ,
where a and b are the fitting parameters for power function. Combined with Equation (11), Equation (14) becomes the following:
lg ( Δ P ) = l g ( p c ) + a × ( S shape ) b ,
Based on this variation trend, Equation (15) is calibrated with data in Figure 8a and lg( p c ) = 3.2 under different values of h. Several representative calibration results are shown in Figure 10. With the increase in h, the quality of calibration improves sharply at first, which is also proved by the fitting degrees R2 (Figure 11). When the value of h exceeds 0.8, R2 begins decreasing. Therefore, the formulation of fatigue life concerning inclusion parameters can be expressed with Equation (16).
lg ( N f ) = 9.2 × ( a r e a A ( s i n θ 0.8 ) × ( A 1 ) ) 1 / 26 ,
To further express the representative meaning of inclusion shape parameter, ξ , Figure 12 shows the values of ξ under different aspect ratios, A, tilting angle, θ, and h. Based on the fact that the increase in ξ will lead to the increase in the inclusion effect on fatigue property and the decrease in fatigue life, the geometrical and physical representativeness of parameter ξ and h can be described as follows. When A equals one, the value of ξ and the inclusion effect keeps constant no matter how θ changes. When A remains constant and larger than one, the value of ξ the inclusion effect keeps growing with the increase in θ. However, when θ keeps constant, the changing trend of the value of ξ and the inclusion effect with the increase in A becomes different, which is distinguished with light grey color in Figure 12. When sinθ is larger than h, the increase in A will lead to the increase in the value of ξ and the inclusion effect; when sinθ is smaller than h, the increase in A will lead to the decrease in the value of ξ and the inclusion effect. According to the change of h, the different values of critical θ can be calculated. In the above text, the value of h has already been determined based on the calibration quality between fatigue life and a r e a ξ , which indicates that the critical value of h = arcsin(0.8) = 53°. When θ > 53°, the effect of inclusion on the fatigue property will increase when A increases; when θ < 53°, the effect of inclusion on the fatigue property will decrease when A increases.

3.3.3. Validation of the Formulation of Fatigue Life concerning Inclusion Parameters

According to the research of Murakami [10], the 107 fatigue limit for stress ratio, R = −1, depends on the square root of inclusion area to the −1/6th power, shown in Equation (17):
σ w = a ( H V + 120 ) / a r e a 1 / 6 ,
where HV is the Vickers hardness of the steel; a r e a is the square root of the inclusion area, μm; a is the position coefficient of the inclusion, a = 1.43 for surface inclusions, a= 1.41 for inclusions in contact with the sample surface, and a = 1.56 for internal inclusions. For high cycle fatigue and very high cycle fatigue properties, Furuya et al. [40] reported that the 109 fatigue limit also obeyed this −1/6th power rule for inclusions larger than 15 μm.
In our previous study, a formulation of fatigue life with respect to stress amplitude and inclusions size was also proposed based on the experimental data and microstructure-based fatigue modeling. The formulation is shown as Equation (18), as follows:
lg ( N f ) = F 1 × σ F 2 × ( a r e a ) F 3 ,
where σ represents the stress amplitude in MPa; a r e a represents the square root of the inclusion area in μm; and F1, F2, and F3 are the fitting constants, where F1 = 15,402 MPa0.98·μm1/4.7, F2 = −0.98, and F3 = −1/4.7.
The inclusions in the previous study were calcium aluminate circle inclusion. To compare the previous formulation and Equation (16). The value of ξ is calculated first with the data of circle inclusion (A = 1, (sinθh) × (A − 1) = 0). Therefore, for circle inclusion, Equation (16) becomes Equation (19).
lg ( N f ) = 9.2 × ( a r e a ) 1 / 26 ,
It is noted that the exponent changed to −1/26. With this exponent, the slope of the curve turns flatter, which means the effect of inclusion size change on fatigue life decreases in this formulation. Since the inclusions considered in Equations (18) and (19) are actual inclusions observed in the fatigue failure. The shapes of these inclusions are not that regular. The local irregularity directly leads to a stronger impact on fatigue life; meanwhile, in the present study, artificial inclusions with perfect regular shapes are inserted in the model for numerical study. The absence of the roughness in the inclusion shapes is the major cause of the smaller value of the exponent. In the following work, the surface roughness of inclusions will also be included in the simulation to extend the applicability of the formulation.

4. Conclusions

(1)
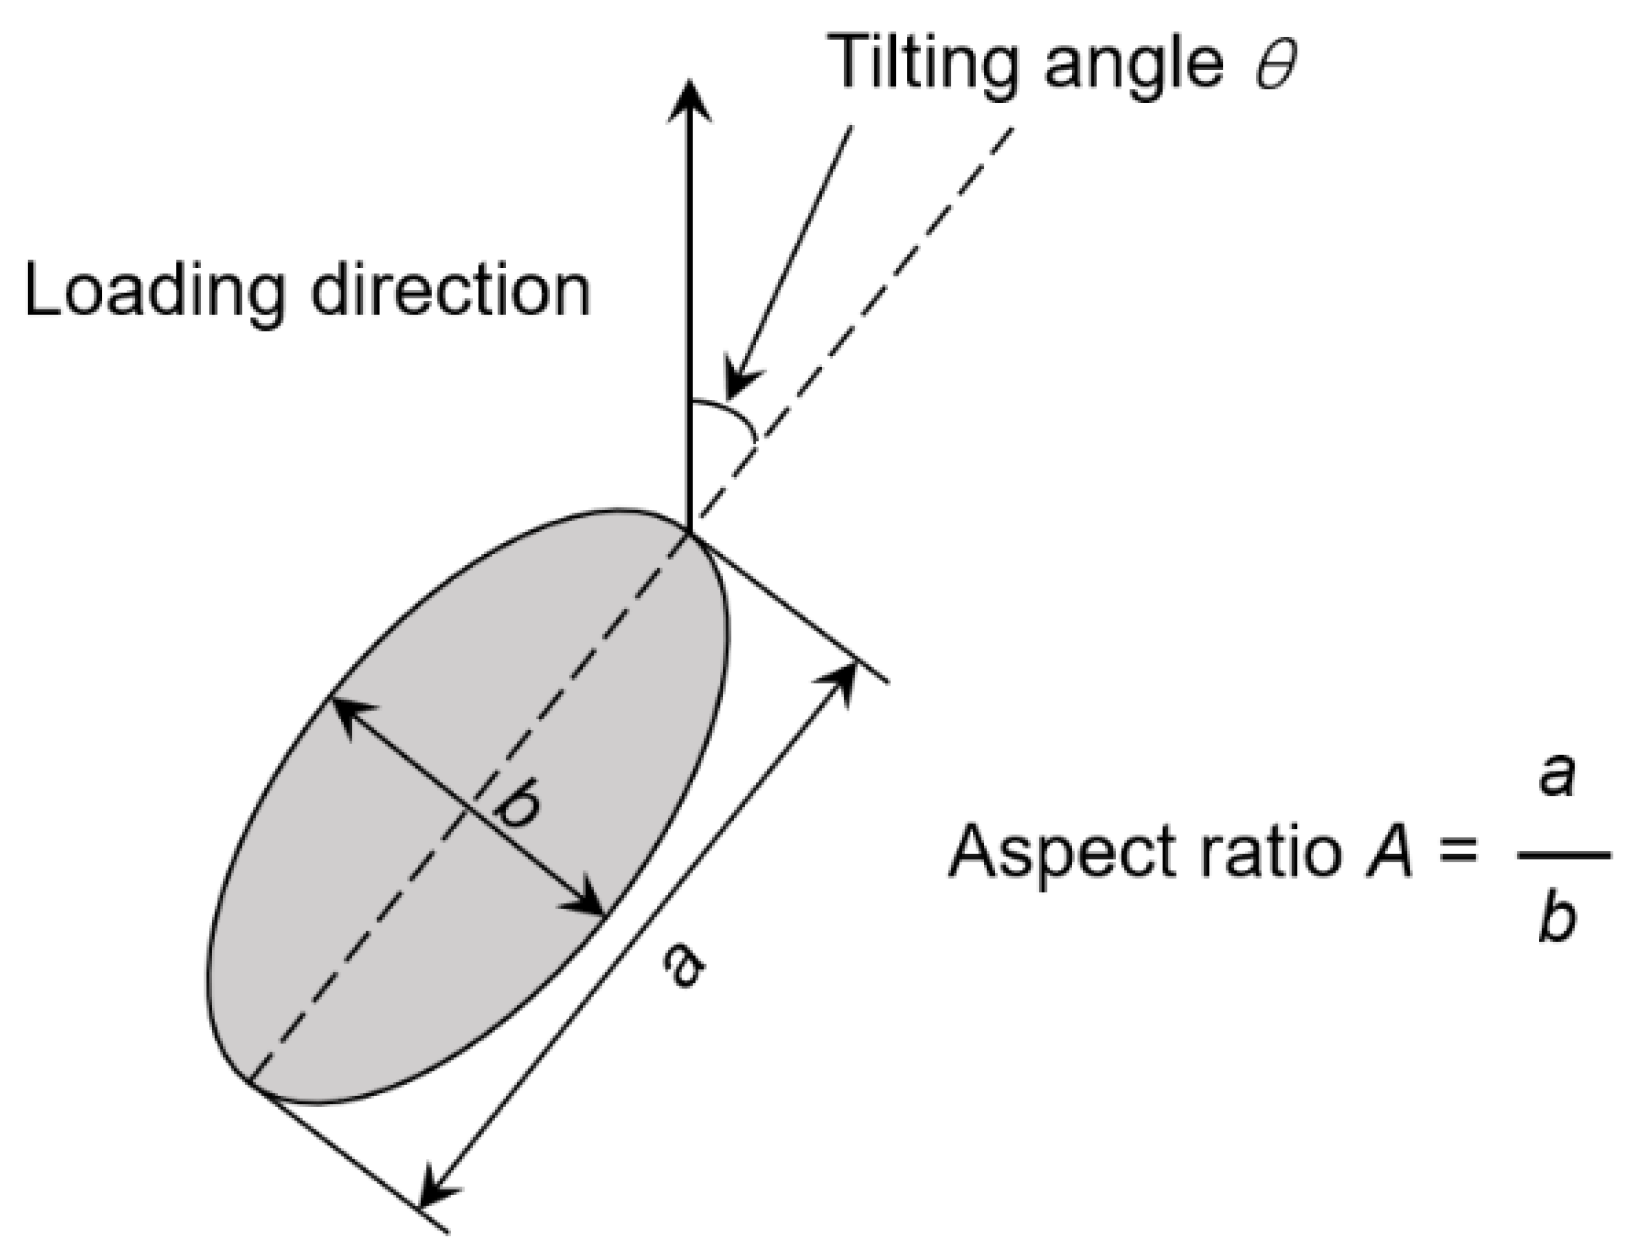
In this study, the effect of the shape features of inclusions on fatigue life is systematically investigated via a microstructure-based modeling approach. Based on the findings, an analytical formulation to correlate the fatigue life with the size and shape features of inclusions is proposed. This formulation extends the former fatigue equation to shape parameters (aspect ratio, A, and tilting angle, θ).
(2)
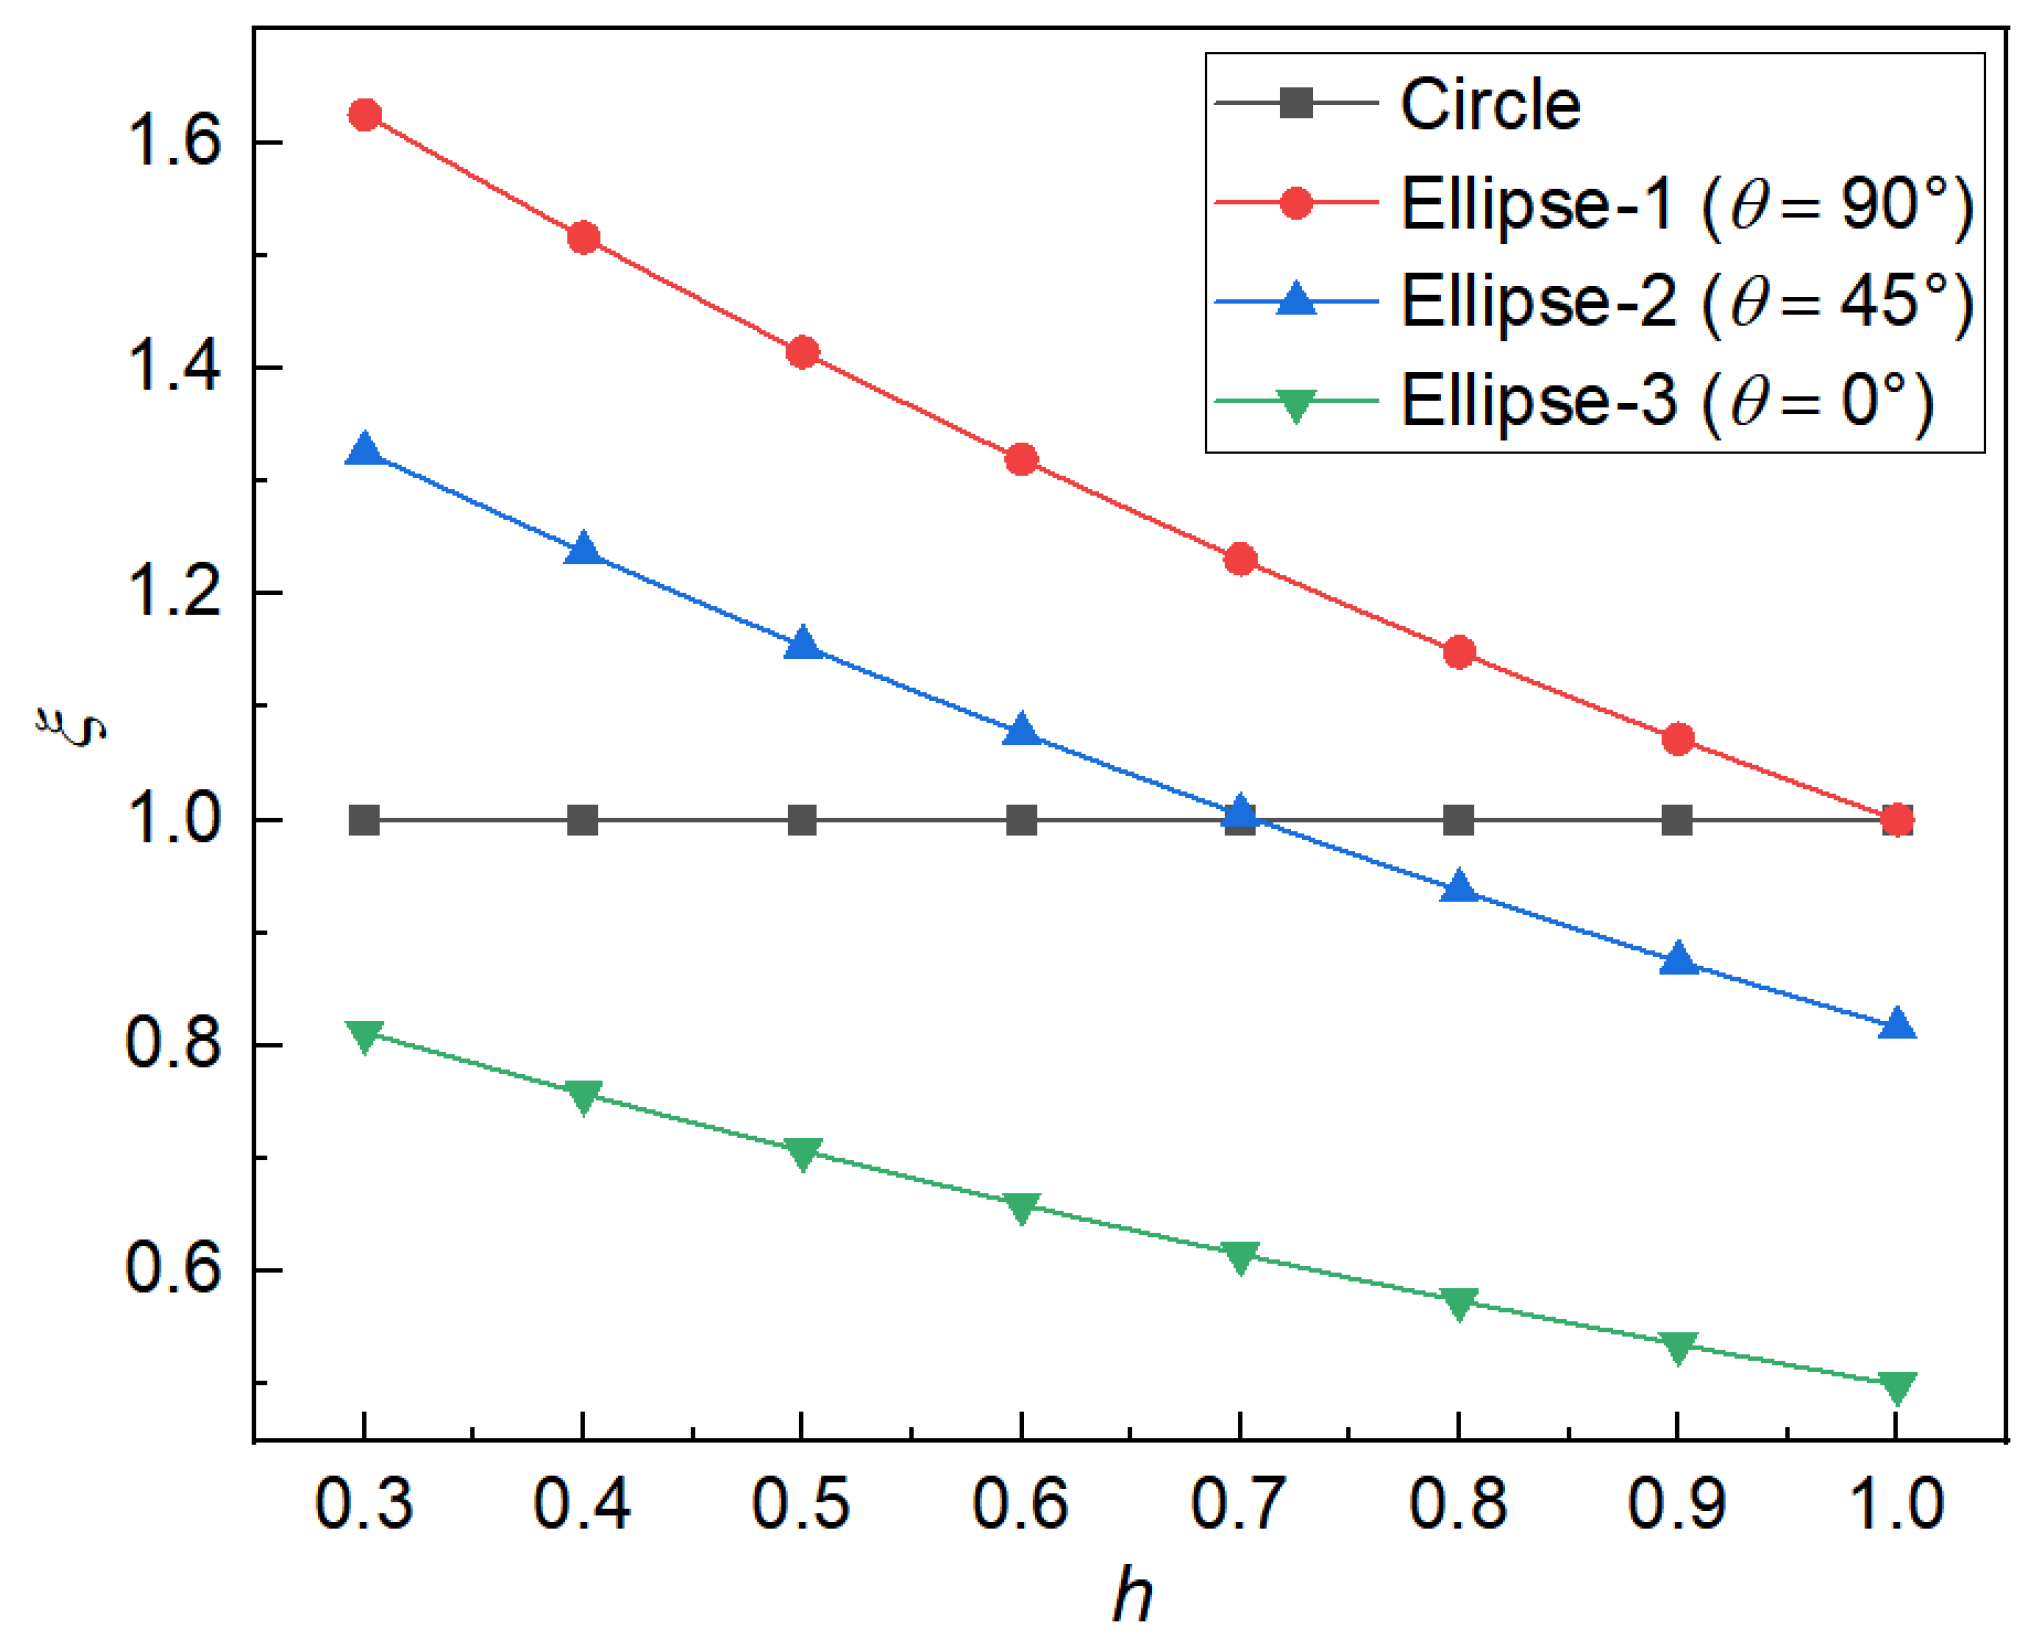
To describe the inclusion shape, a new parameter, ξ , which unifies the aspect ratio and tilting angle of the inclusion, is introduced. This parameter, ξ , shows its representativeness in both the geometrical and physical sides. This new parameter and inclusion area jointly determine the equivalent inclusion area, which was adopted in the formulation of fatigue life as a single variable.
(3)
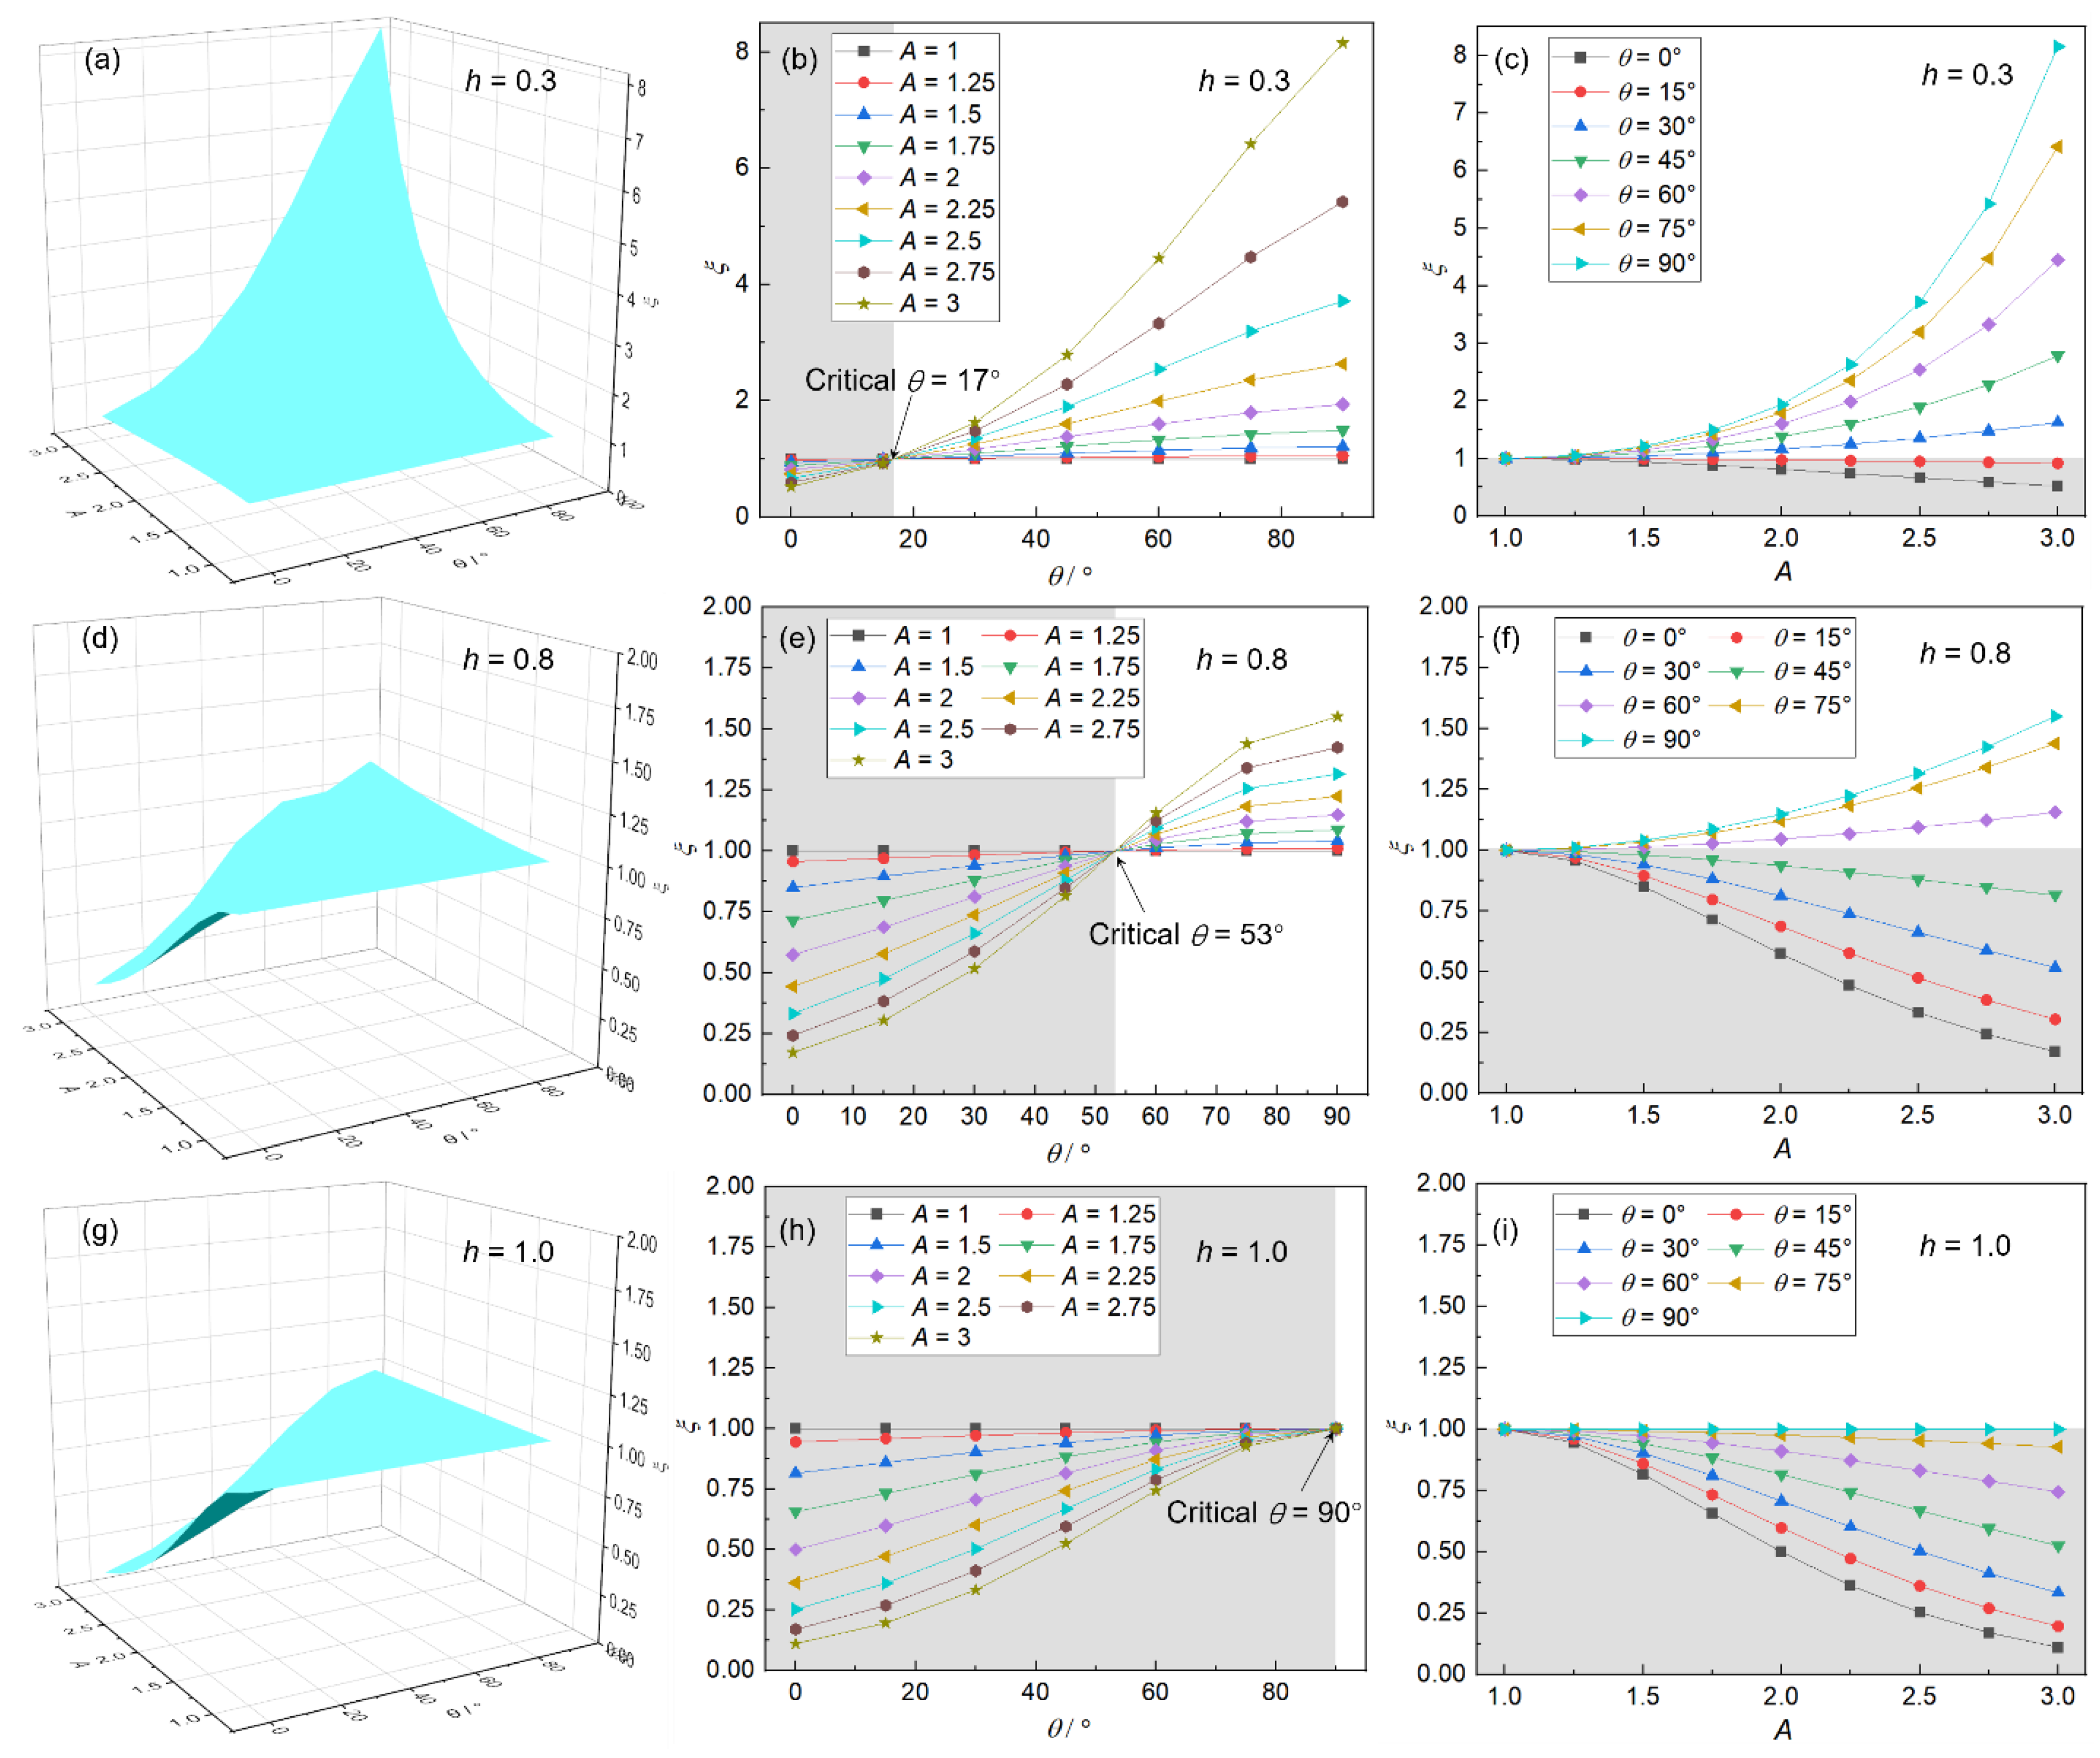
A critical θ is also offered. When θ > 53°, the effect of inclusion on the fatigue property will increase when A increases; when θ < 53°, the effect of inclusion on the fatigue property will decrease when A increases.
(4)
For smaller inclusions, the value of the maximum residual stress around the inclusion is affected by the microstructure of the steel matrix around the inclusion more seriously compared with the inclusion features itself; meanwhile, for larger inclusions, the inclusion shape is more important in residual stress analysis.
(5)
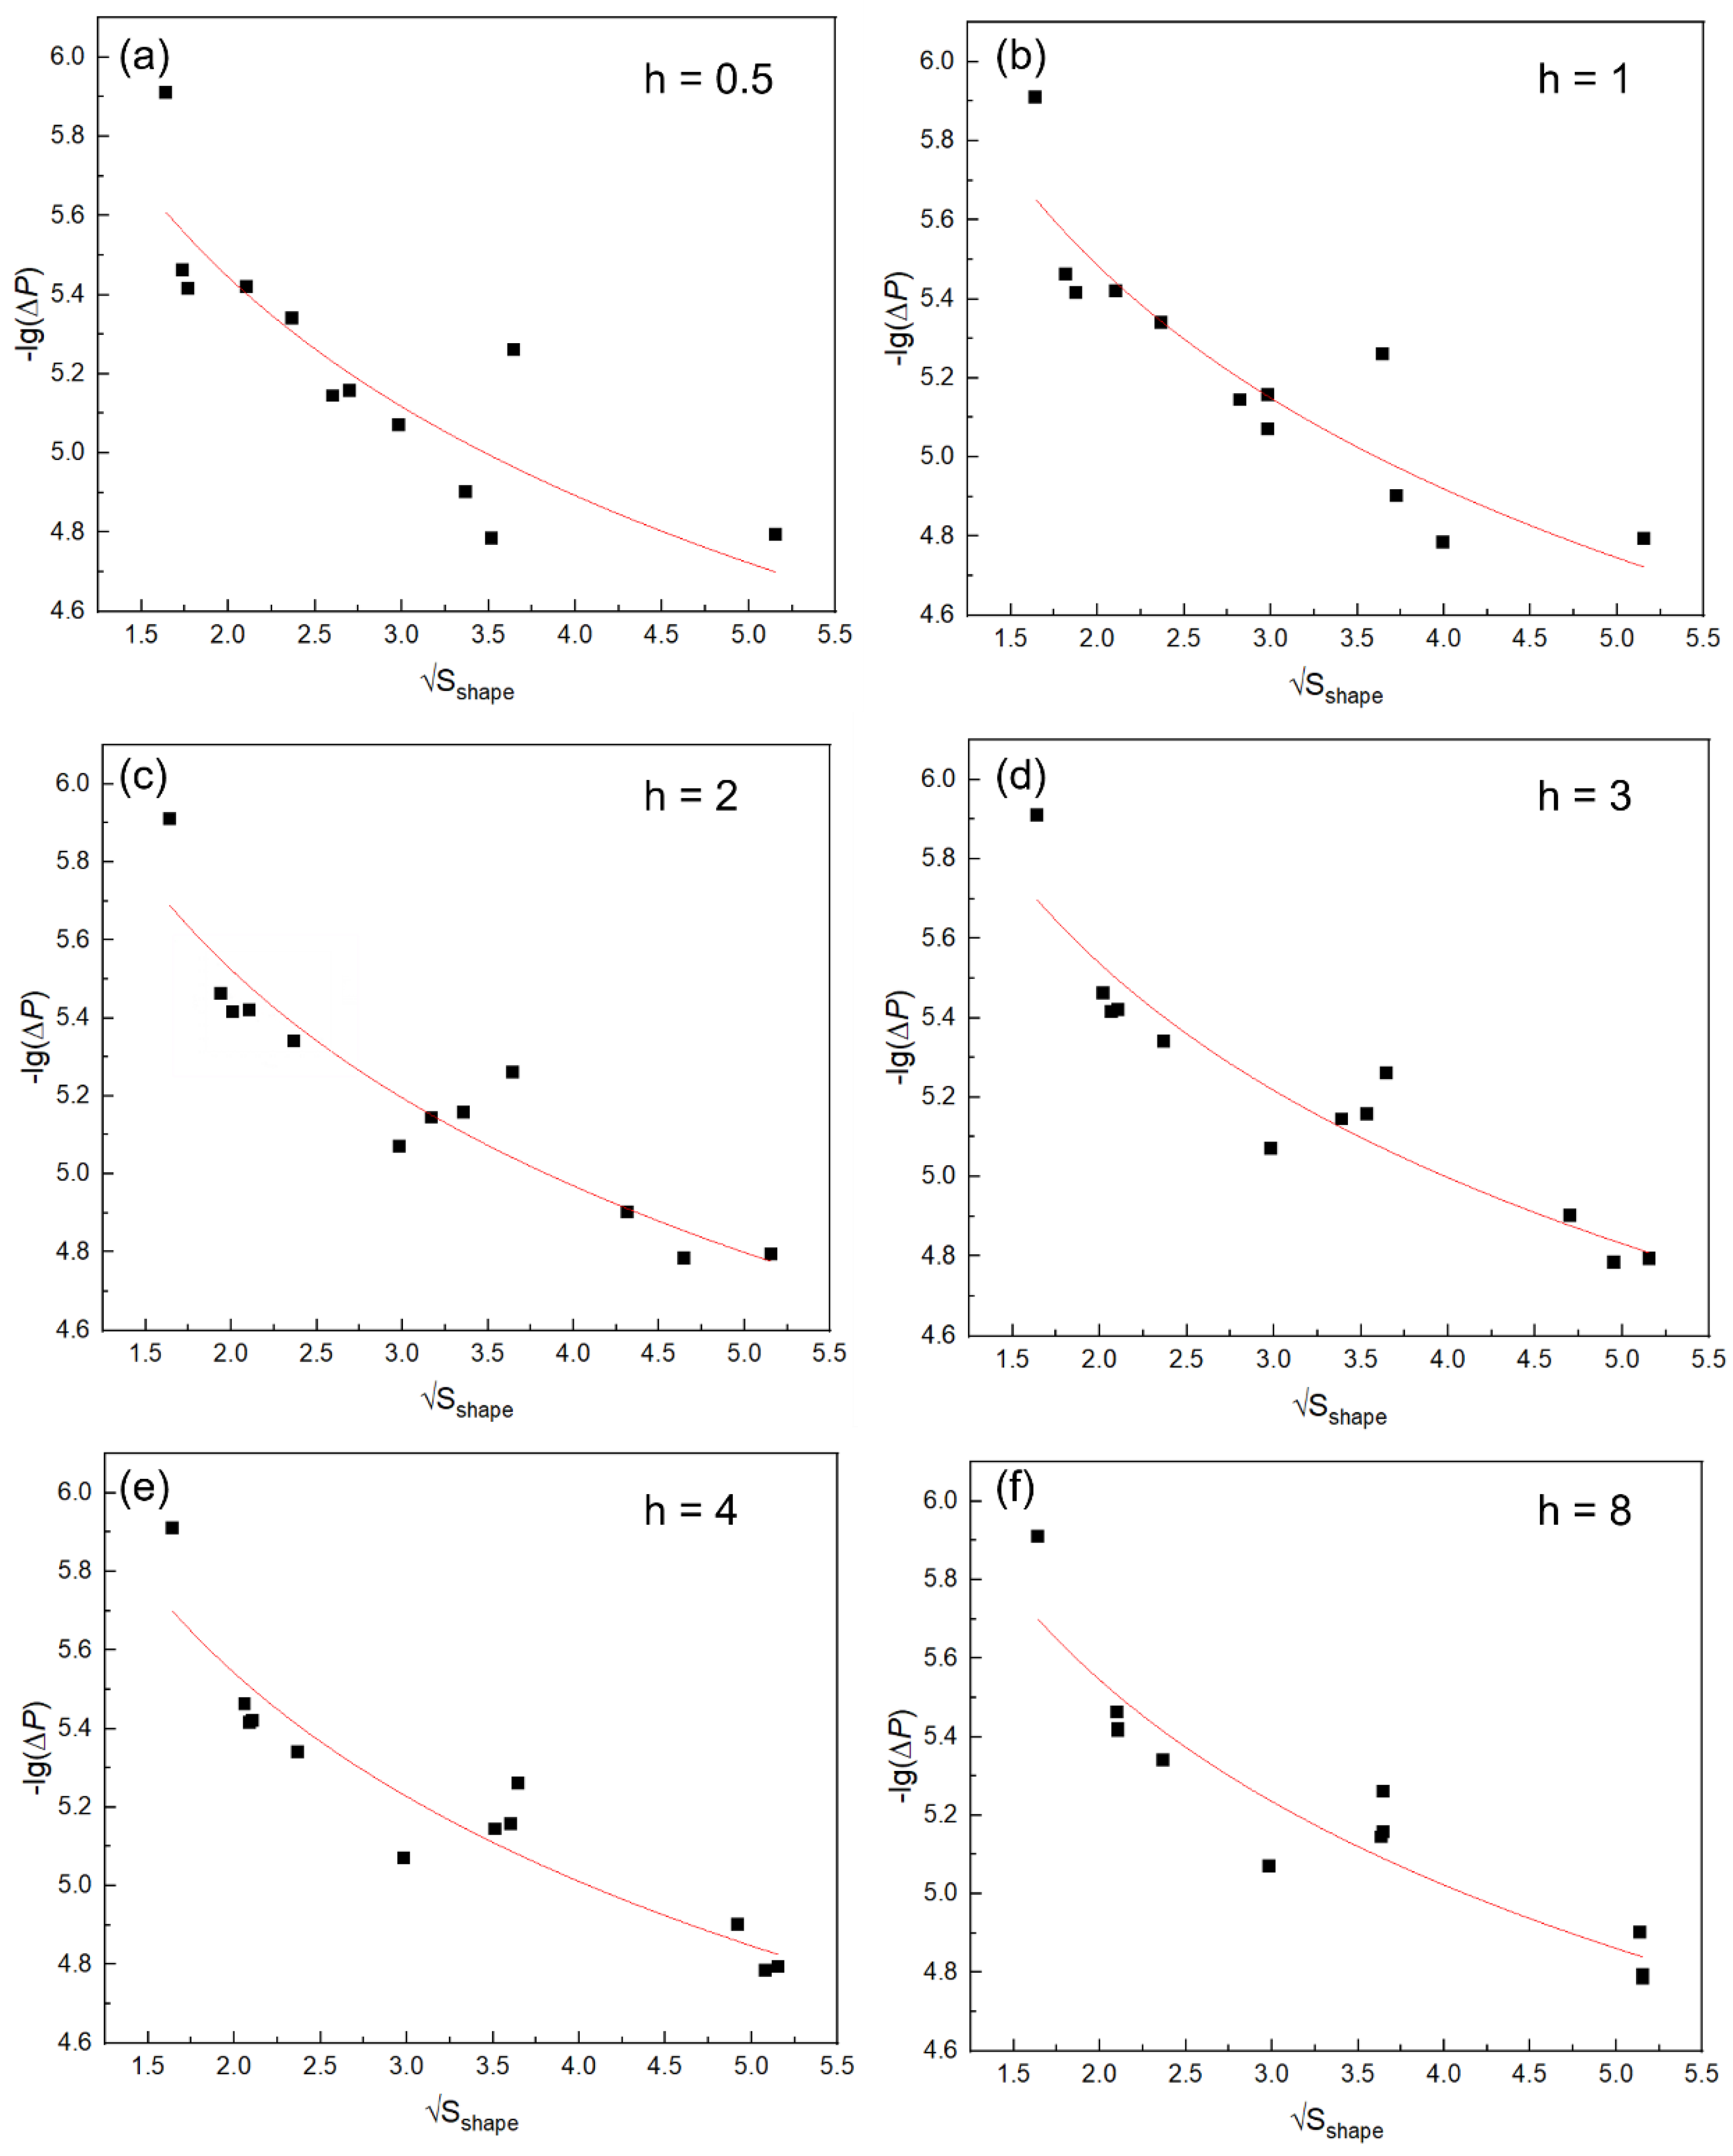
The predicted fatigue life in this study concerning the inclusion depends on the square root of the equivalent inclusion area to the −1/26th power.

Author Contributions

Investigation, C.G., Z.L. and J.L.; methodology, C.G.; data curation, C.G. and Z.L.; writing—original draft preparation, C.G.; writing—review and editing, J.L.; supervision, J.L. and Y.B.; funding acquisition, Y.B. All authors have read and agreed to the published version of the manuscript.

Funding

This work was financially supported by the Fundamental Research Funds for the Central Universities (No. FRF-TP-20-026A1), the special grade of China Postdoctoral Science Foundation (No. 2021T140050), and the State Key Laboratory of Advanced Metallurgy Foundation of China (No. 41621014).

Institutional Review Board Statement

Not applicable.

Informed Consent Statement

Not applicable.

Data Availability Statement

Not applicable.

Conflicts of Interest

The authors declare no conflict of interest. The funders had no role in the design of the study; in the collection, analyses, or interpretation of data; in the writing of the manuscript, or in the decision to publish the results.

References

  1. Li, Y.; Yang, Z.; Li, S.; Liu, Y.; Chen, S.; Hui, W.; Weng, Y. Effect of Hydrogen on Fatigue Strength of High-Strength Steels in the VHCF Regime. Adv. Eng. Mater. 2009, 11, 561–567. [Google Scholar] [CrossRef]
  2. Li, S.X.; Weng, Y.Q.; Hui, W.J.; Yang, Z.G. Very High Cycle Fatigue Properties of High Strength Steels-Effects of Nonmetallic Inclusions; Metallurgical Industry Press: Beijing, China, 2010. [Google Scholar]
  3. Gu, C.; Liu, W.-Q.; Lian, J.-h.; Bao, Y.-P. In-depth analysis of the fatigue mechanism induced by inclusions for high-strength bearing steels. Int. J. Miner. Metall. Mater. 2021, 28, 826–834. [Google Scholar] [CrossRef]
  4. Xiao, W.; Bao, Y.-p.; Gu, C.; Wang, M.; Liu, Y.; Huang, Y.-s.; Sun, G.-T. Ultrahigh cycle fatigue fracture mechanism of high-quality bearing steel obtained through different deoxidation methods. Int. J. Miner. Metall. Mater. 2021, 28, 804–815. [Google Scholar] [CrossRef]
  5. Gu, C.; Lian, J.; Bao, Y.; Münstermann, S. Microstructure-based fatigue modelling with residual stresses: Prediction of the microcrack initiation around inclusions. Mater. Sci. Eng. A 2019, 751, 133–141. [Google Scholar] [CrossRef]
  6. Gu, C.; Lian, J.; Bao, Y.; Xie, Q.; Münstermann, S. Microstructure based fatigue modelling with residual stresses: Prediction of the fatigue life for various inclusion sizes. Int. J. Fatigue 2019, 129, 105158. [Google Scholar] [CrossRef]
  7. Murakami, Y.; Yokoyama, N.; Nagata, J. Mechanism of fatigue failure in ultralong life regime. Fatigue Fract. Eng. Mater. Struct. 2002, 25, 735–746. [Google Scholar] [CrossRef]
  8. Murakami, Y.; Nomoto, T.; Ueda, T.; Murakami, Y. On the mechanism of fatigue failure in the superlong life regime (N > 107 cycles). Part II: A fractographic investigation. Fatigue Fract. Eng. Mater. Struct. 2000, 23, 903–910. [Google Scholar] [CrossRef]
  9. Murakami, Y.; Nomoto, T.; Ueda, T.; Murakami, Y. On the mechanism of fatigue failure in the superlong life regime (N > 107 cycles). Part I: Influence of hydrogen trapped by inclusions. Fatigue Fract. Eng. Mater. Struct. 2000, 23, 893–902. [Google Scholar] [CrossRef]
  10. Murakami, Y. Metal Fatigue: Effects of Small Defects and Nonmetallic Inclusions; Elsevier: London, UK, 2002. [Google Scholar]
  11. Fu, H.; Rydel, J.J.; Gola, A.M.; Yu, F.; Geng, K.; Lau, C.; Luo, H.; Rivera-Díaz-del-Castillo, P.E.J. The relationship between 100Cr6 steelmaking, inclusion microstructure and rolling contact fatigue performance. Int. J. Fatigue 2019, 129, 104899. [Google Scholar] [CrossRef]
  12. Gu, C.; Wang, M.; Bao, Y.; Wang, F.; Lian, J. Quantitative analysis of inclusion engineering on the fatigue property improvement of bearing steel. Metals 2019, 9, 476. [Google Scholar] [CrossRef] [Green Version]
  13. Karr, U.; Schuller, R.; Fitzka, M.; Schönbauer, B.; Tran, D.; Pennings, B.; Mayer, H. Influence of inclusion type on the very high cycle fatigue properties of 18Ni maraging steel. J. Mater. Sci. 2017, 52, 5954–5967. [Google Scholar] [CrossRef]
  14. Naragani, D.; Sangid, M.D.; Shade, P.A.; Schuren, J.C.; Sharma, H.; Park, J.-S.; Kenesei, P.; Bernier, J.V.; Turner, T.J.; Parr, I. Investigation of fatigue crack initiation from a non-metallic inclusion via high energy x-ray diffraction microscopy. Acta Mater. 2017, 137, 71–84. [Google Scholar] [CrossRef]
  15. Dunne, F.; Wilkinson, A.; Allen, R. Experimental and computational studies of low cycle fatigue crack nucleation in a polycrystal. Int. J. Plast. 2007, 23, 273–295. [Google Scholar] [CrossRef]
  16. McDowell, D.; Dunne, F. Microstructure-sensitive computational modeling of fatigue crack formation. Int. J. Fatigue 2010, 32, 1521–1542. [Google Scholar] [CrossRef]
  17. Lin, L.; Zeng, J.-Q. Consideration of green intelligent steel processes and narrow window stability control technology on steel quality. Int. J. Miner. Metall. Mater. 2021, 28, 1264–1273. [Google Scholar] [CrossRef]
  18. Wang, L.; Song, B.; Yang, Z.-B.; Cui, X.-K.; Liu, Z.; Cheng, W.-S.; Mao, J.-H. Effects of Mg and La on the evolution of inclusions and microstructure in Ca-Ti treated steel. Int. J. Miner. Metall. Mater. 2021, 28, 1940–1948. [Google Scholar] [CrossRef]
  19. Chu, J.; Bao, Y.; Li, X.; Gao, F.; Wang, M. Characterization of oxidation behavior of Mn fumes generated in the vacuum treatment of melting Mn steels. Steel Res. Int. 2021, 92, 2000333. [Google Scholar] [CrossRef]
  20. Xing, L.; Guo, J.; Li, X.; Zhang, Z.; Wang, M.; Bao, Y.; Zeng, F.; Chen, B. Control of TiN precipitation behavior in titanium-containing micro-alloyed steel. Mater. Today Commun. 2020, 25, 101292. [Google Scholar] [CrossRef]
  21. Gillner, K.; Henrich, M.; Münstermann, S. Numerical study of inclusion parameters and their influence on fatigue lifetime. Int. J. Fatigue 2018, 111, 70–80. [Google Scholar] [CrossRef]
  22. Gu, C.; Lian, J.; Bao, Y.; Xiao, W.; Münstermann, S. Numerical study of the effect of inclusions on the residual stress distribution in high-strength martensitic steels during cooling. Appl. Sci. 2019, 9, 455. [Google Scholar] [CrossRef] [Green Version]
  23. Lian, J.; Yang, H.; Vajragupta, N.; Münstermann, S.; Bleck, W. A method to quantitatively upscale the damage initiation of dual-phase steels under various stress states from microscale to macroscale. Comput. Mater. Sci. 2014, 94, 245–257. [Google Scholar] [CrossRef]
  24. Ma, Y.; Cui, Y. Study of the effect of sulfur contents on fracture toughness of railway wheel steels for high speed train. Acta Met. Sin 2011, 47, 978–983. [Google Scholar]
  25. Brooksbank, D.; Andrews, K.W. Tessellated stresses associated with some inclusions in steel. J. Iron Steel Inst. 1969, 207, 474–483. [Google Scholar]
  26. Brooksbank, D.; Andrews, K. Thermal expansion of some inclusions found in steels and relation to tessellated stresses. J. Iron Steel Inst. 1968, 206, 595–599. [Google Scholar]
  27. Roters, F.; Eisenlohr, P.; Hantcherli, L.; Tjahjanto, D.D.; Bieler, T.R.; Raabe, D. Overview of constitutive laws, kinematics, homogenization and multiscale methods in crystal plasticity finite-element modeling: Theory, experiments, applications. Acta Mater. 2010, 58, 1152–1211. [Google Scholar] [CrossRef]
  28. Xie, Q.; Van Bael, A.; An, Y.G.; Lian, J.; Sidor, J.J. Effects of the isotropic and anisotropic hardening within each grain on the evolution of the flow stress, the r-value and the deformation texture of tensile tests for AA6016 sheets. Mater. Sci. Eng. A 2018, 721, 154–164. [Google Scholar] [CrossRef]
  29. Xie, Q.; Lian, J.; Sidor, J.J.; Sun, F.; Yan, X.; Chen, C.; Liu, T.; Chen, W.; Yang, P.; An, K.; et al. Crystallographic orientation and spatially resolved damage in a dispersion-hardened Al alloy. Acta Mater. 2020, 193, 138–150. [Google Scholar] [CrossRef]
  30. Xie, Q.; Li, R.; Wang, Y.D.; Su, R.; Lian, J.; Ren, Y.; Zheng, W.; Zhou, X.; Wang, Y. The in-depth residual strain heterogeneities due to an indentation and a laser shock peening for Ti-6Al-4V titanium alloy. Mater. Sci. Eng. A 2018, 714, 140–145. [Google Scholar] [CrossRef]
  31. Gillner, K.; Münstermann, S. Numerically predicted high cycle fatigue properties through representative volume elements of the microstructure. Int. J. Fatigue 2017, 105, 219–234. [Google Scholar] [CrossRef]
  32. Sharaf, M.; Kucharczyk, P.; Vajragupta, N.; Münstermann, S.; Hartmaier, A.; Bleck, W. Modeling the microstructure influence on fatigue life variability in structural steels. Comput. Mater. Sci. 2014, 94, 258–272. [Google Scholar] [CrossRef]
  33. Dahl, W. Grundlagen des festigkeits- und bruchverhaltens. Materialwiss. Werkst. 1976, 7, 123–124. [Google Scholar]
  34. Mughrabi, H. Microstructural fatigue mechanisms: Cyclic slip irreversibility, crack initiation, non-linear elastic damage analysis. Int. J. Fatigue 2013, 57, 2–8. [Google Scholar] [CrossRef]
  35. Mughrabi, H. Dislocations in Fatigue. In Dislocations and Properties of Real Materials; The Institute of Metals: London, UK, 1984; pp. 244–262. [Google Scholar]
  36. Mughrabi, H. Cyclic slip irreversibility and fatigue life: A microstructure-based analysis. Acta Mater. 2013, 61, 1197–1203. [Google Scholar] [CrossRef]
  37. Manonukul, A.; Dunne, F.P.E. High- and low-cycle fatigue crack initiation using polycrystal plasticity. Proc. R. Soc. A Math. Phys. Eng. Sci. 2004, 460, 1881–1903. [Google Scholar] [CrossRef]
  38. Cheong, K.-S.; Busso, E.P. Effects of lattice misorientations on strain heterogeneities in FCC polycrystals. J. Mech. Phys. Solids 2006, 54, 671–689. [Google Scholar] [CrossRef]
  39. Boeff, M.; Hassan, H.U.; Hartmaier, A. Micromechanical modeling of fatigue crack initiation in polycrystals. J. Mater. Res. 2017, 32, 4375–4386. [Google Scholar] [CrossRef] [Green Version]
  40. Furuya, Y.; Hirukawa, H.; Kimura, T.; Hayaishi, M. Gigacycle fatigue properties of high-strength steels according to inclusion and ODA sizes. Metall. Mater. Trans. A 2007, 38, 1722–1730. [Google Scholar] [CrossRef]
Figure 1. The flow chart of the investigation strategy in this study.
Crystals 12 00200 g001
Figure 2. Schematic drawing of the aspect ratio, A, and the tilting angle, θ, of an inclusion.
Crystals 12 00200 g002
Figure 3. One RVE of virtue microstructure with different geometries of the inclusions: (ad) a r e a = 26.6 μm; (eh) a r e a = 13.3 μm; (il) a r e a = 4.2 μm.
Crystals 12 00200 g003
Figure 4. The residual stress distribution around different inclusions in one typical RVE (the white arrows point at the positions for maximum residual stresses): (ad) a r e a = 26.6 μm; (eh) a r e a = 13.3 μm; (il) a r e a = 4.2 μm.
Crystals 12 00200 g004
Figure 5. The average maximum residual stress calculated with different RVEs and the corresponding standard deviations.
Crystals 12 00200 g005
Figure 6. The pacc contour distributions of steel matrix in on typical RVEs after six-cycle simulation of tension–compression fatigue stress (white arrows pointing at the position of Pmax): (ad) a r e a = 26.6 μm; (eh) a r e a = 13.3 μm; (il) a r e a = 4.2 μm.
Crystals 12 00200 g006
Figure 7. The morphology of the fatigue fracture and the inclusion inducing the fatigue crack (σ = 1200 MPa; Nf = 2.97 × 10⁸): (a) fracture surface; (b) optically dark area (ODA) structure; (c) the inclusion in crack initiation site.
Crystals 12 00200 g007
Figure 8. (a) The average fatigue life of different inclusions without the assistance of shape parameter ξ; (b) the variation of variance values of fatigue life with different inclusions caused by different RVEs.
Crystals 12 00200 g008
Figure 9. The variations of shape indicator ξ with h under different inclusion shapes.
Crystals 12 00200 g009
Figure 10. Representative calibration results of Equation (16) with different values of h: (a) h = 0.5; (b) h = 1; (c) h = 2; (d) h = 3; (e) h = 4; (f) h = 8.
Crystals 12 00200 g010
Figure 11. The variations R2 of calibration results of Equation (16) with different values of h.
Crystals 12 00200 g011
Figure 12. The effect of aspect ratio, A, and tilting angle θ, on inclusion shape parameter, ξ: (ac) h = 0.3; (df) h = 0.8; (gi) h = 1.0 (the grey parts represent that the value of ξ decreases when A increases).
Crystals 12 00200 g012
Table 1. Geometry sketches of inclusions with different shapes in this study and the corresponding values of aspect ratio A and the rotation angle θ.
Inclusion ShapeCircleEllipse-1Ellipse-2Ellipse-3
Geometry sketches of inclusions Crystals 12 00200 i001 Crystals 12 00200 i002 Crystals 12 00200 i003 Crystals 12 00200 i004
ParametersA = 1
θ: unconstrained
A = 2
θ = 90°
A = 2
θ = 45°
A = 2
θ = 0°
Table 2. Mechanical properties and thermal expansion coefficients [25,26].
MaterialCoefficient of Linear Expansion, α (10−6·°C)Young’s Modulus, E (GPa)Poisson’s Ratio, v
Calcium Aluminate5.01130.23
Steel Matrix23.02060.30
Table 3. Main equations in the CP model.
Constitutive Equation
γ ˙ α = γ ˙ 0 | τ α χ α τ c α | 1 m s g n ( τ α χ α )  
γa—slip rate along the slip system α;
γ ˙ 0 —initial slip rate;
τ α —resolved shear stress along a slip system α;
χ α —backstress on slip system α;
τ c α —critical resolved shear stress on slip system α;
1/m—strain rate sensitivity factor.
Calculation of Shear Stress
τ α = S · ( m α n α )
na—normal to the slip plane;
ma—slip direction;
S—second Piola–Kirchhoff stress tensor.
Isotropic Hardening Law
τ c α = τ i + β = 1 N q α β [ h 0 ( 1 τ c β τ s ) a ] | Δ γ β |
τ i —initial resolved shear stress;
q α β —latent hardening parameter;
h 0 , τ s ,   a —hardening parameter;
Δ γ β —plastic slip increment of each slip system β.
Kinematic Hardening
χ α ˙ = G 1 γ ˙ α G 2 | γ ˙ α | χ α
G1, G2—kinematic hardening constant;
χ α —backstress tensor of slip system α.
Table 4. CP model fitting parameters [5].
C11: 193.9 GPaC12: 94.6 GPaC44: 92.2 GPaγ0: 0.01
1/m: 100τ0: 645 MPaG1: 100,000 MPaG2: 2000
h0: 1000 MPaa: 1.1
Table 5. Values of expressions in the function to describe inclusion shape.
CircleEllipse-1Ellipse-2Ellipse-3
Geometry sketches of inclusions Crystals 12 00200 i005 Crystals 12 00200 i006 Crystals 12 00200 i007 Crystals 12 00200 i008
A1222
θ/90°45°
A − 10111
sinθ/1 2 /20
sinθ × (A − 1)01 2 /20
Publisher’s Note: MDPI stays neutral with regard to jurisdictional claims in published maps and institutional affiliations.

