Article

Electrical and Dielectric Properties of Ca-Doped Bi-Deficient Sodium Bismuth Titanate Na0.5Bi0.49−xCaxTiO3−δ (0 ≤ x ≤ 0.08)

1
Institute of Fuel Cells, School of Mechanical Engineering, Shanghai Jiao Tong University, Shanghai 200240, China
2
School of Materials Science and Engineering, Shanghai Jiao Tong University, Shanghai 200240, China
3
Department of Materials Science & Engineering, University of Sheffield, Sheffield S1 3JD, UK
*
Author to whom correspondence should be addressed.
Crystals 2022, 12(12), 1800; https://doi.org/10.3390/cryst12121800
Submission received: 6 November 2022 / Revised: 3 December 2022 / Accepted: 5 December 2022 / Published: 10 December 2022
(This article belongs to the Special Issue Advanced Electronic Materials and Devices)

Abstract

:
Bismuth-deficient sodium bismuth titanate (nominal Na0.5Bi0.49TiO2.985, NB0.49T) presents high oxide ion conductivity, which makes it a potential electrolyte material for intermediate-temperature solid oxide fuel cells. Acceptor doping has been proven an effective approach to enhance the bulk conductivity (σb) of NB0.49T. Here, divalent Ca2+ ions were selected to partially replace Bi3+ on the A-site of NB0.49T, and the temperature and composition dependences of σb and permittivity were investigated. Results showed that Ca2+ doping was effective for enhancing σb of NB0.49T by creating oxygen vacancies. The highest σb (0.006 S·cm−1 at 500 °C) was achieved by 2% Ca2+ doping. Further increase in the doping level decreased σb, which was more pronounced at temperatures below ~350 °C. Most importantly, Ca doping increased the temperature at which the activation energy for bulk conduction changed from ~0.80 eV (at low temperatures) to ~0.40 eV (at high temperatures), and reduced the temperature dependence of permittivity of NB0.49T. Results from the average structural parameters and the local defect associates are discussed. The findings of this work are helpful for understanding the defect and conduction mechanisms for acceptor-doped NB0.49T, and are also useful for developing NBT-based dielectrics with temperature-independent permittivity.

1. Introduction

Development of intermediate-temperature solid oxide fuel cells (IT-SOFCs) raises urgent demand for novel electrolyte materials with higher oxide ion conductivity than the state-of-the-art yttria-stabilized zirconia (YSZ). In 2014, a new family of oxide ion conductors based on the ferroelectric perovskite sodium bismuth titanate (Na0.5Bi0.5TiO3, NBT) was reported [1]. Since then, numerous efforts have been devoted to enhancing the bulk conductivity (σb) of NBT by introducing A-site cation nonstoichiometry and/or acceptor doping [2,3,4,5,6,7,8,9,10,11,12,13,14,15,16,17,18,19,20,21], based on which the following cognitions have been established: (1) high oxide-ion conductivity can be obtained in Na-rich or Bi-deficient NBT, e.g., Na0.51Bi0.5TiO3.005 (N0.51BT) or Na0.5Bi0.49TiO2.985 (NB0.49T) [2]; (2) acceptor doping, either on A-site (e.g., partial replacement of Bi3+ by Sr2+ [3]) or B-site (e.g., partial substitution of Ti4+ by Mg2+ [1]), generates oxygen vacancies by an ionic compensation mechanism, and therefore is an effective approach for enhancing the σb of NBT [8]; (3) σb of acceptor-doped NB0.49T is higher than that of yttria-stabilized zirconia (YSZ) at < 600 °C, and it shows no appreciable degradation at 500 °C contrary to the rapid conductivity decay for rare-earth- stabilized δ -Bi2O3 [6], which makes NBT-based oxide ion conductors promising candidate electrolyte materials for IT-SOFCs.
Among all the acceptor-type dopants, Mg2+ is the most widely investigated B-site dopant for NBT. The initial work by Li et al. [1] employed Mg2+ to replace Ti4+ in NB0.49T, and reported an enhancement of σb by ~half order of magnitude by 2% Mg doping. Further enhancement of σb by increasing the doping level was proven undesirable due to the low solubility of Mg2+ in NB0.49T, i.e., a Ti-rich secondary phase was observed in 2% Mg-doped NB0.49T. Later work by Singh et al. [11] reported a similar effect, that the highest conductivity can be obtained in 2% Mg-doped NB0.49T prepared by a polyol-mediated synthesis route. Bhattacharyya et al. [12] incorporated Mg2+ to highly nonstoichiometric Na0.54Bi0.46TiO3-δ and obtained the highest σb by 1% Mg doping. The phenomenon that there exists an optimum doping level, above which σb decreases with increasing doping level, has been widely observed in NBT with other B-site dopants such as Ga3+, Al3+, Sc3+, and Fe3+ [8,9,10,15,16]. The limited enhancement of σb by B-site acceptor doping was first explained by He and Mo by first-principles calculations [22]. Their results showed that acceptor doping on the B-site could significantly increase the oxygen migration barriers by binding with oxygen vacancies, which suppresses the mobility of oxygen ions and therefore is detrimental to oxide ion conduction. Formation of defect association between the positively charged acceptor dopants and the negatively charged oxygen vacancies, as well as its effect on the σb of NBT, was further revealed by researchers [14,23,24], and it has been widely adopted to explain the variation of σb with doping level.
Based on the first-principles calculations [22], a novel doping strategy on the A-site was proposed as a more beneficial approach to enhance the σb of NBT because the disordered A-site sublattice can form different local atomistic configurations to accommodate the electrostatic and strain fields of the dopant ions. It was predicted that partial replacement of Bi3+ by monovalent Na+ or K+, e.g., Na0.54Bi0.46TiO2.96 or Na0.5K0.04Bi0.46TiO2.96, could induce higher σb than Mg doping given the same oxygen vacancy concentration. Inspired by the above theoretical prediction, acceptor-type dopants such as Li+, Na+, K+, Ca2+, Sr2+, and Ba2+ were selected to partially replace Bi3+ on the A-site of NBT. For example, Shih et al. [17,18] prepared Li- and K-doped NB0.50T by a modified Pechini citrate–nitrate synthesis route and achieved an enhancement of the total conductivity by ~ one order of magnitude by 4% Li or K doping. However, the highest conductivity reached by 4% Li doping was still lower than that of 2% Mg-doped NBT, which disagrees with the theoretical prediction that acceptor doping on the A-site is superior to that on the B-site. Bhattacharyya et al. [12] prepared Na0.54Bi0.46TiO2.96 (4% Na-doped NB0.50T) ceramics but Na, Ti-rich secondary phases were observed under SEM. Moreover, Li, Na, or K doping can be experimentally unfavorable because of the high volatility of these elements, which makes it difficult to control the composition of sintered ceramics.
Non-volatile elements from the IIA family, M = Ca, Sr, and Ba, were therefore considered as more promising dopants to replace Bi3+ on the A-site of NBT. Previously, we prepared 2% M2+-doped NB0.49T ceramics and investigated their electrical properties [7]. The preliminary results suggest these divalent dopants are all effective to enhance the σb of NB0.49T without changing the conduction mechanism, and Ca2+ and Sr2+ are more effective in enhancing σb than Ba2+. We discussed the dependence of σb on the type of dopant ions from the variation of average structural parameters (tolerance factor and specific free volume) induced by doping, as well as the intrinsic properties of dopant ions including ionic radius, polarizability, and bonding strength with oxygen. We proposed that, at low doping levels (thus the change of average structural parameters induced by doping is negligible), a small mismatch in the ionic radius between M2+ and Bi3+, a large polarizability and a low M–O bonding energy are beneficial for obtaining high σb. Although we casted doubt on any significant enhancement of σb by increasing the doping level because (1) the gain from an increase in the oxygen vacancy concentration may be offset by lower polarizability and higher M–O bonding strength of the dopant; (2) Na,Ti-rich secondary phases were observed in 2% M2+-doped NB0.49T (sintered at 1150 °C) under SEM; and (3) a physical upper limit of σb calculated from the oxygen vacancy diffusivity limit model in the perovskite lattice suggested optimization of σb may have been achieved [8]; experimental evidence is still required to verify this conjecture.
Here we have selected divalent Ca2+ ions to partially replace Bi3+ on the A-site of NB0.49T, and prepared a series of Ca-doped NB0.49T ceramics with the doping level varying from 2% to 8% by the conventional solid state reaction method. The composition and temperature dependencies of σb and permittivity of these ceramics were investigated primarily by impedance spectroscopy. Ca was selected for investigation due to the following reasons: (1) CaTiO3 is well known to form a solid solution with NBT with a large solubility [25,26]. It is possible that, if sintered under proper temperatures, the solubility of Ca2+ in NBT may be potentially high to create a high level of oxygen vacancies to facilitate charge carriers; and (2) Ca2+ has a smaller ionic radius than Bi3+ [7], therefore, substitution of Bi3+ by Ca2+ will decrease the tolerance factor (t) of NB0.49T from ~0.98 towards the optimum value of ~0.96 for maximum conductivity in perovskites [27]. Results show dense and clean (by XRD) Ca-doped NB0.49T ceramics can be obtained when sintered at 1100 °C. Unexpectedly but interestingly, we found Ca doping could increase the temperature at which the activation energy for bulk conduction changes from ~0.80 eV (at low temperatures) to ~0.40 eV (at high temperatures), which has not been reported in other acceptor-doped NBT ceramics. Ca doping also decreases the temperature dependence of permittivity of NB0.49T. Findings of this work are not only helpful for designing NBT-based oxide ion conductors by acceptor doping, but also useful for developing NBT-based dielectrics with temperature-independent permittivity.

2. Experimental

Ca-doped NB0.49T ceramics with nominal compositions of Na0.5Bi0.49−xCaxTiO3−δ (0.02 ≤ x ≤ 0.08) were prepared by solid-state reaction using Na2CO3 (99.5%, Fisher chemical, Loughborough, UK), Bi2O3 (99.9%, Acros Organics, Pittsburgh, USA), TiO2 (99.9%, Sigma Aldrich, Dorset, UK) and CaCO3 (99.0%, Sigma Aldrich, Dorset, UK) as starting materials. The above raw materials were dried overnight at 300 °C for Bi2O3 and Na2CO3, 180 °C for CaCO3, and 800 °C for TiO2. Appropriate amounts of each precursor were weighed and mixed thoroughly in isopropanol using yttria-stabilized zirconia grinding media for 6 h using a laboratory roller-ball milling machine. Subsequently, the mixture was transferred to a beaker, dried at 85 °C overnight, sieved, and calcined at 800 °C for 2 h. The resultant powders were subjected to a second round of ball milling (4 h), drying, sieving, and calcination, and finalized by a third round of ball milling (6 h), drying, and sieving. The final products were compacted into pellets by uni-axial cold pressing followed by isostatic pressing at 200 MPa. Pellets were embedded in sacrificial powder of the same composition to reduce sodium and/or bismuth loss at high temperature, and sintered at 1100 °C for 2 h. Undoped NB0.49T was prepared by identical procedures but sintered at 1150 °C for 2 h to obtain dense ceramics.
Phase purity was identified by X-ray diffraction on the crushed pellets using a high-resolution STOE STADI-P diffractometer (STOE & Cie GmbH, Darmstadt, Germany) operating with CuKα1 radiation with a linear position-sensitive detector. The crushed pellets were annealed at 400 °C for 4 h to eliminate any residual stress caused by crushing and grinding. Lattice parameters were determined by structural refinement for reflections in the range of 10° ≤ 2θ ≤ 100° using the Rietveld refinement program GSAS with the EXPGUI interface [28,29]. Ceramic microstructure was observed by scanning electron microscopy on thermally etched surfaces using a Philips XL 30 SEM. Compositions were examined by energy dispersive X-ray spectroscopy (EDS) on carbon-coated, polished, and thermally-etched surfaces.
Electrical properties of the pellets were obtained via AC impedance spectroscopy using an Agilent E4980A impedance analyzer (Agilent Technologies Inc., Palo-Alto, CA, USA). Before measurement, Au paste was coated onto the polished surfaces of the samples and fired at 800 °C for 2 h to serve as electrodes. For impedance measurements, an alternating voltage of 0.1 V was applied to the sample over a frequency range from 1 MHz to 2 Hz at different temperatures. Impedance measurements were also carried out in flowing nitrogen, air, and oxygen using a Solartron 1260 system (Solartron Analytical, Leicester, UK; frequency range of 1 MHz to 0.1 Hz). Equivalent circuit fittings of the impedance data were analyzed using Zview Impedance Analysis software (Scribner Associates, Inc., Southern Pines, North Carolina, USA). All impedance data were corrected for high-frequency inductance by performing a short-circuit measurement and normalized by a geometric factor α = 4 t π D 2 , where t and D denote the thickness and the diameter of the pellet, respectively. The resistance and the capacitance data were reported in units of Ω·cm and F·cm−1, respectively.

3. Results

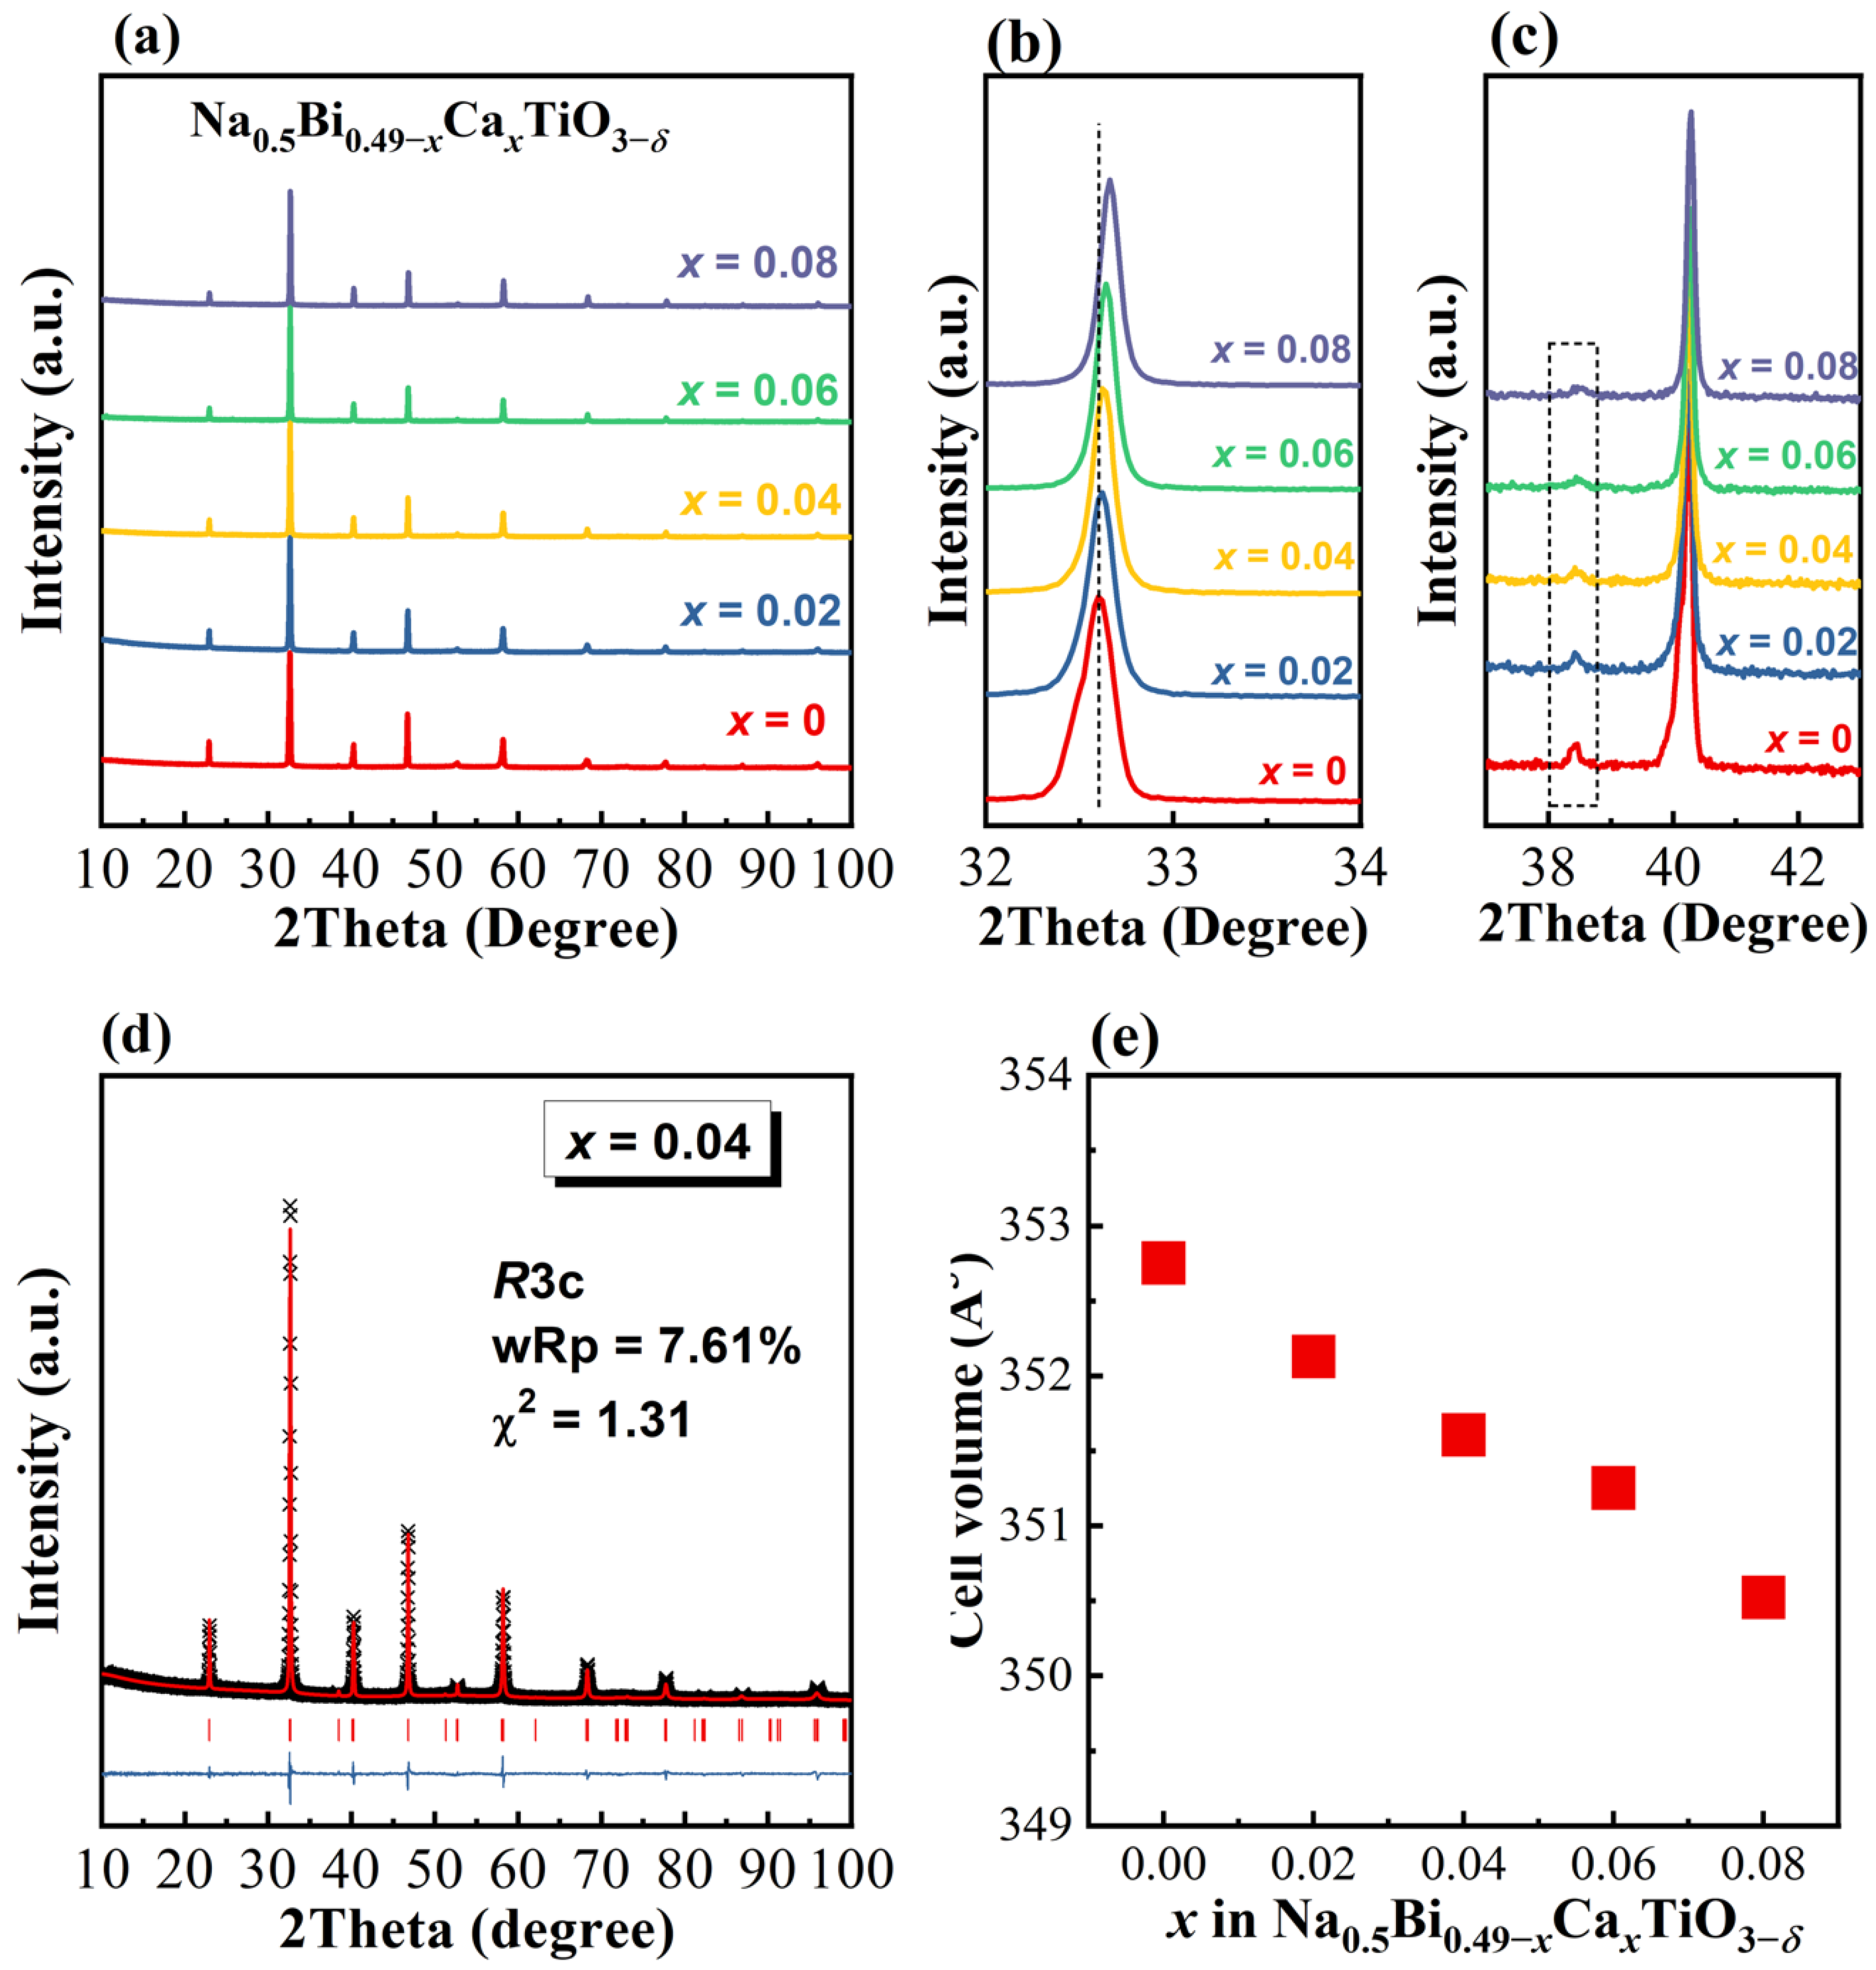
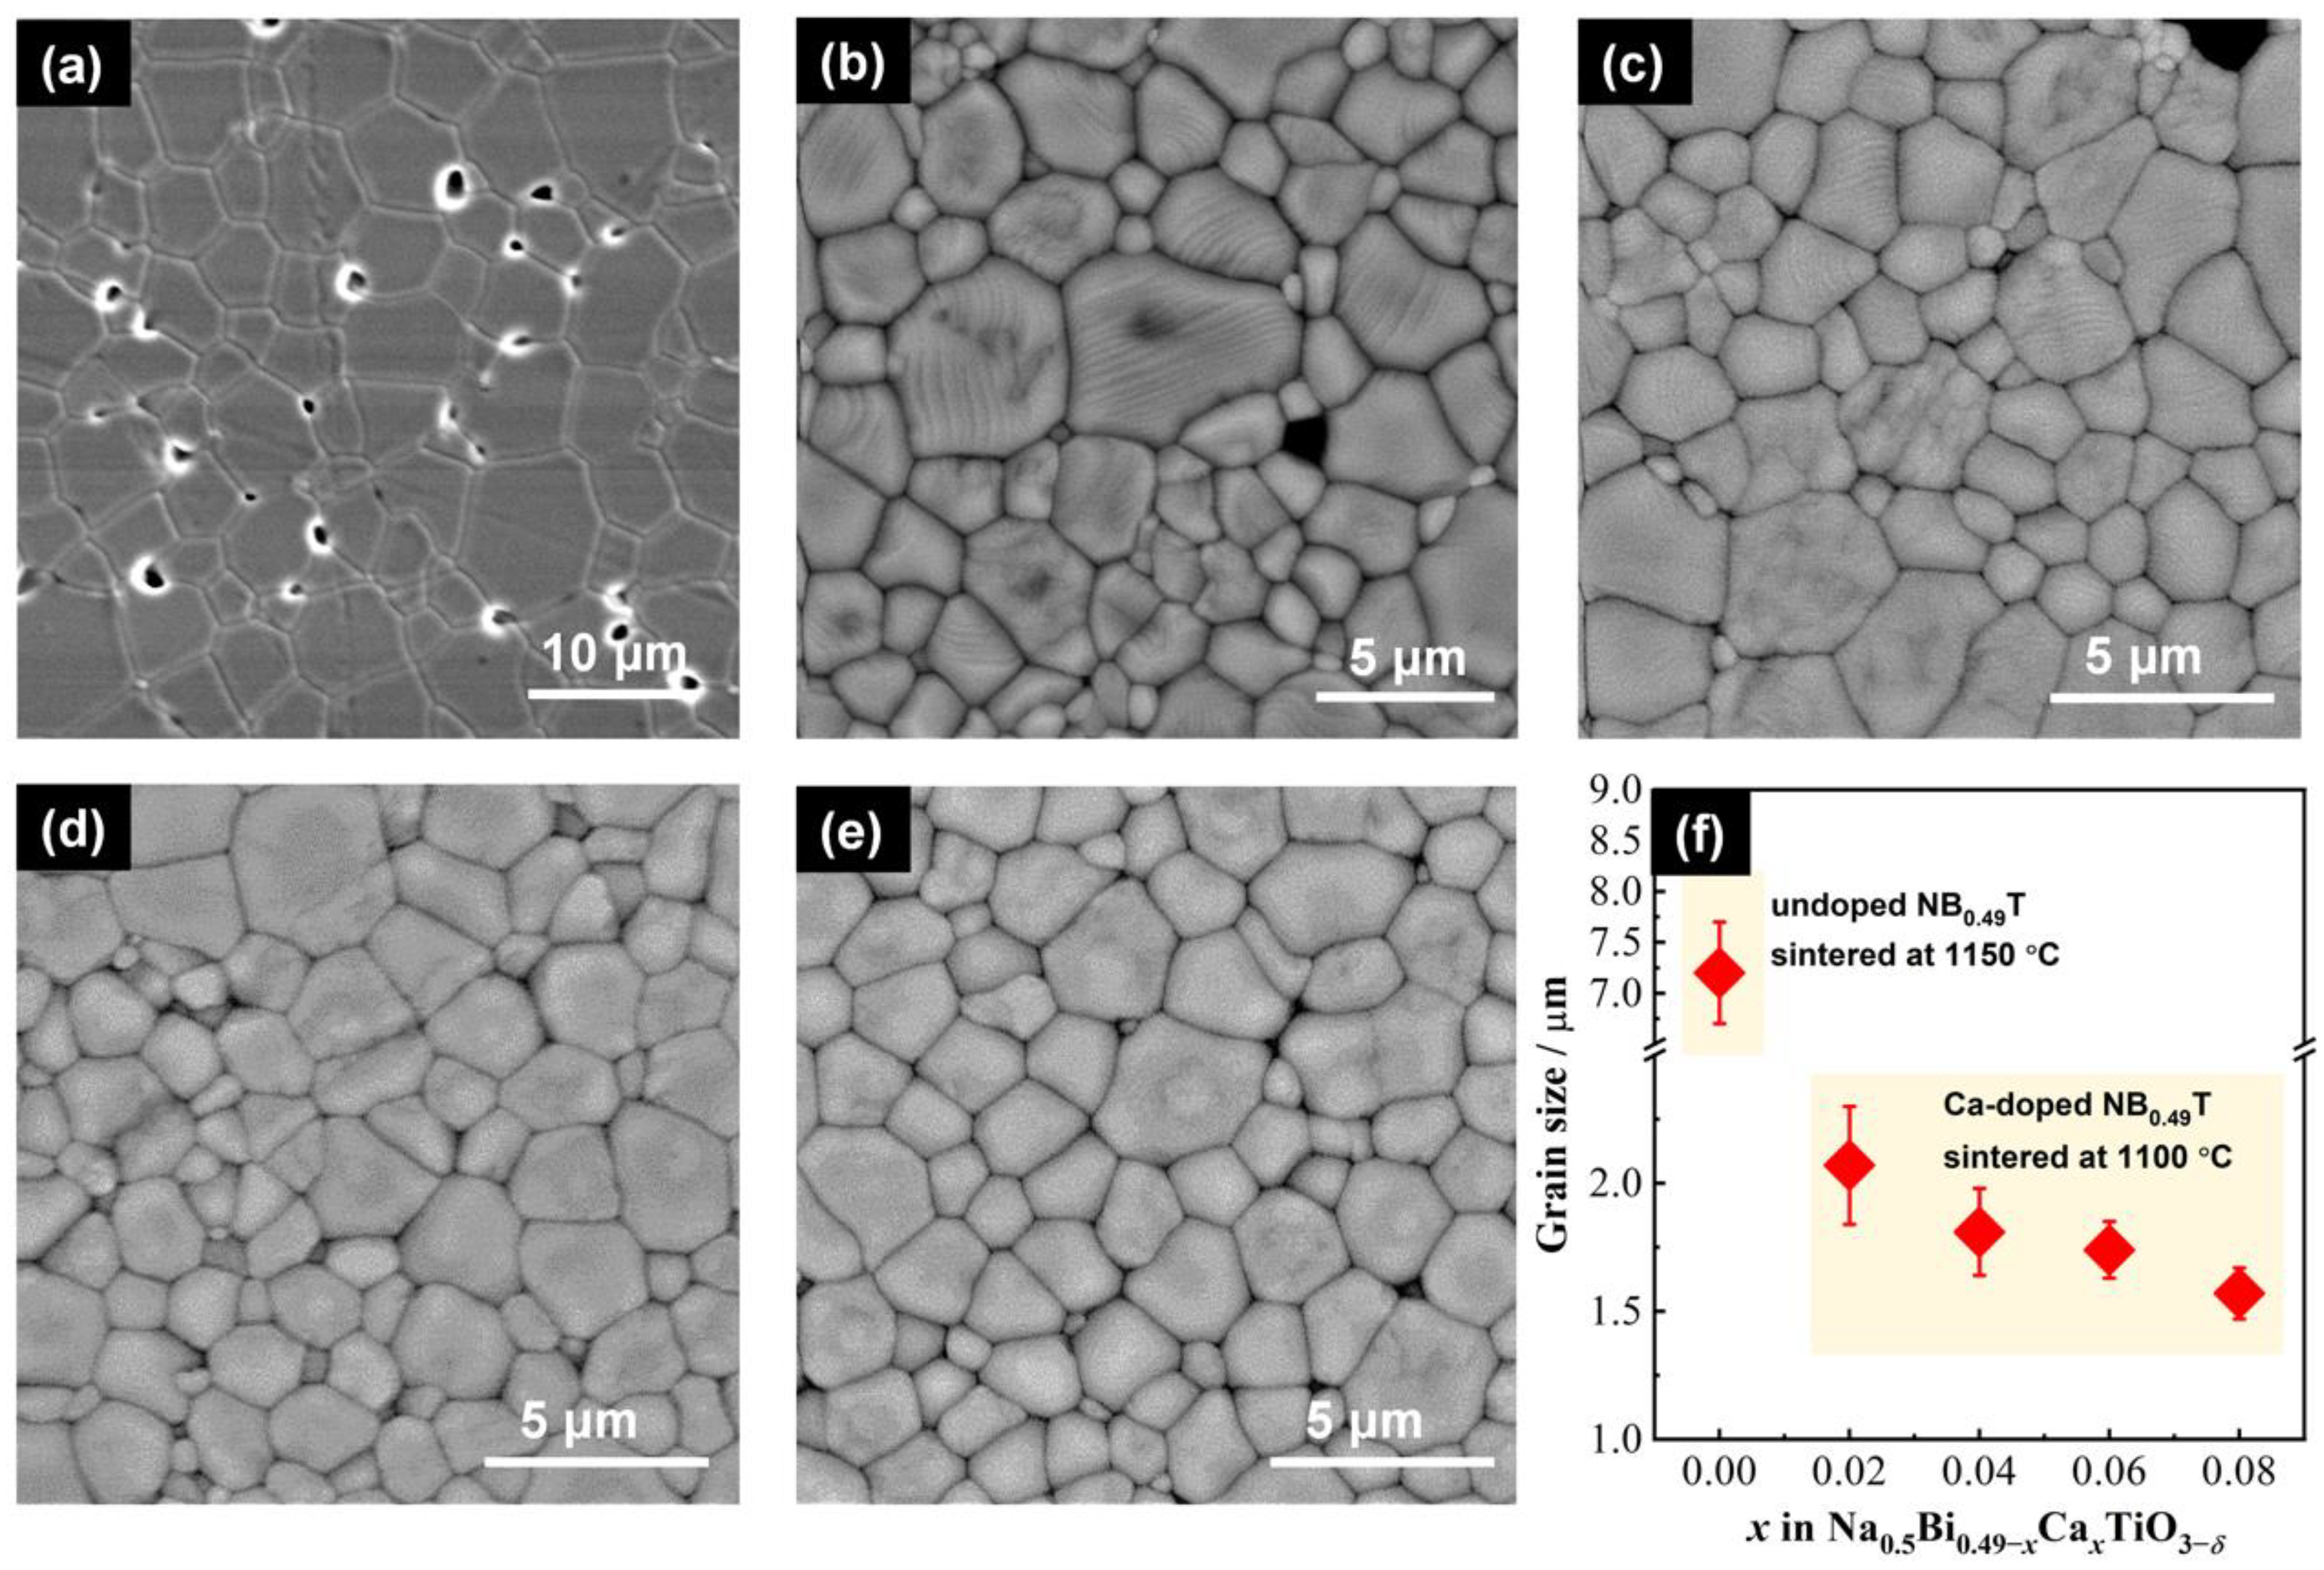
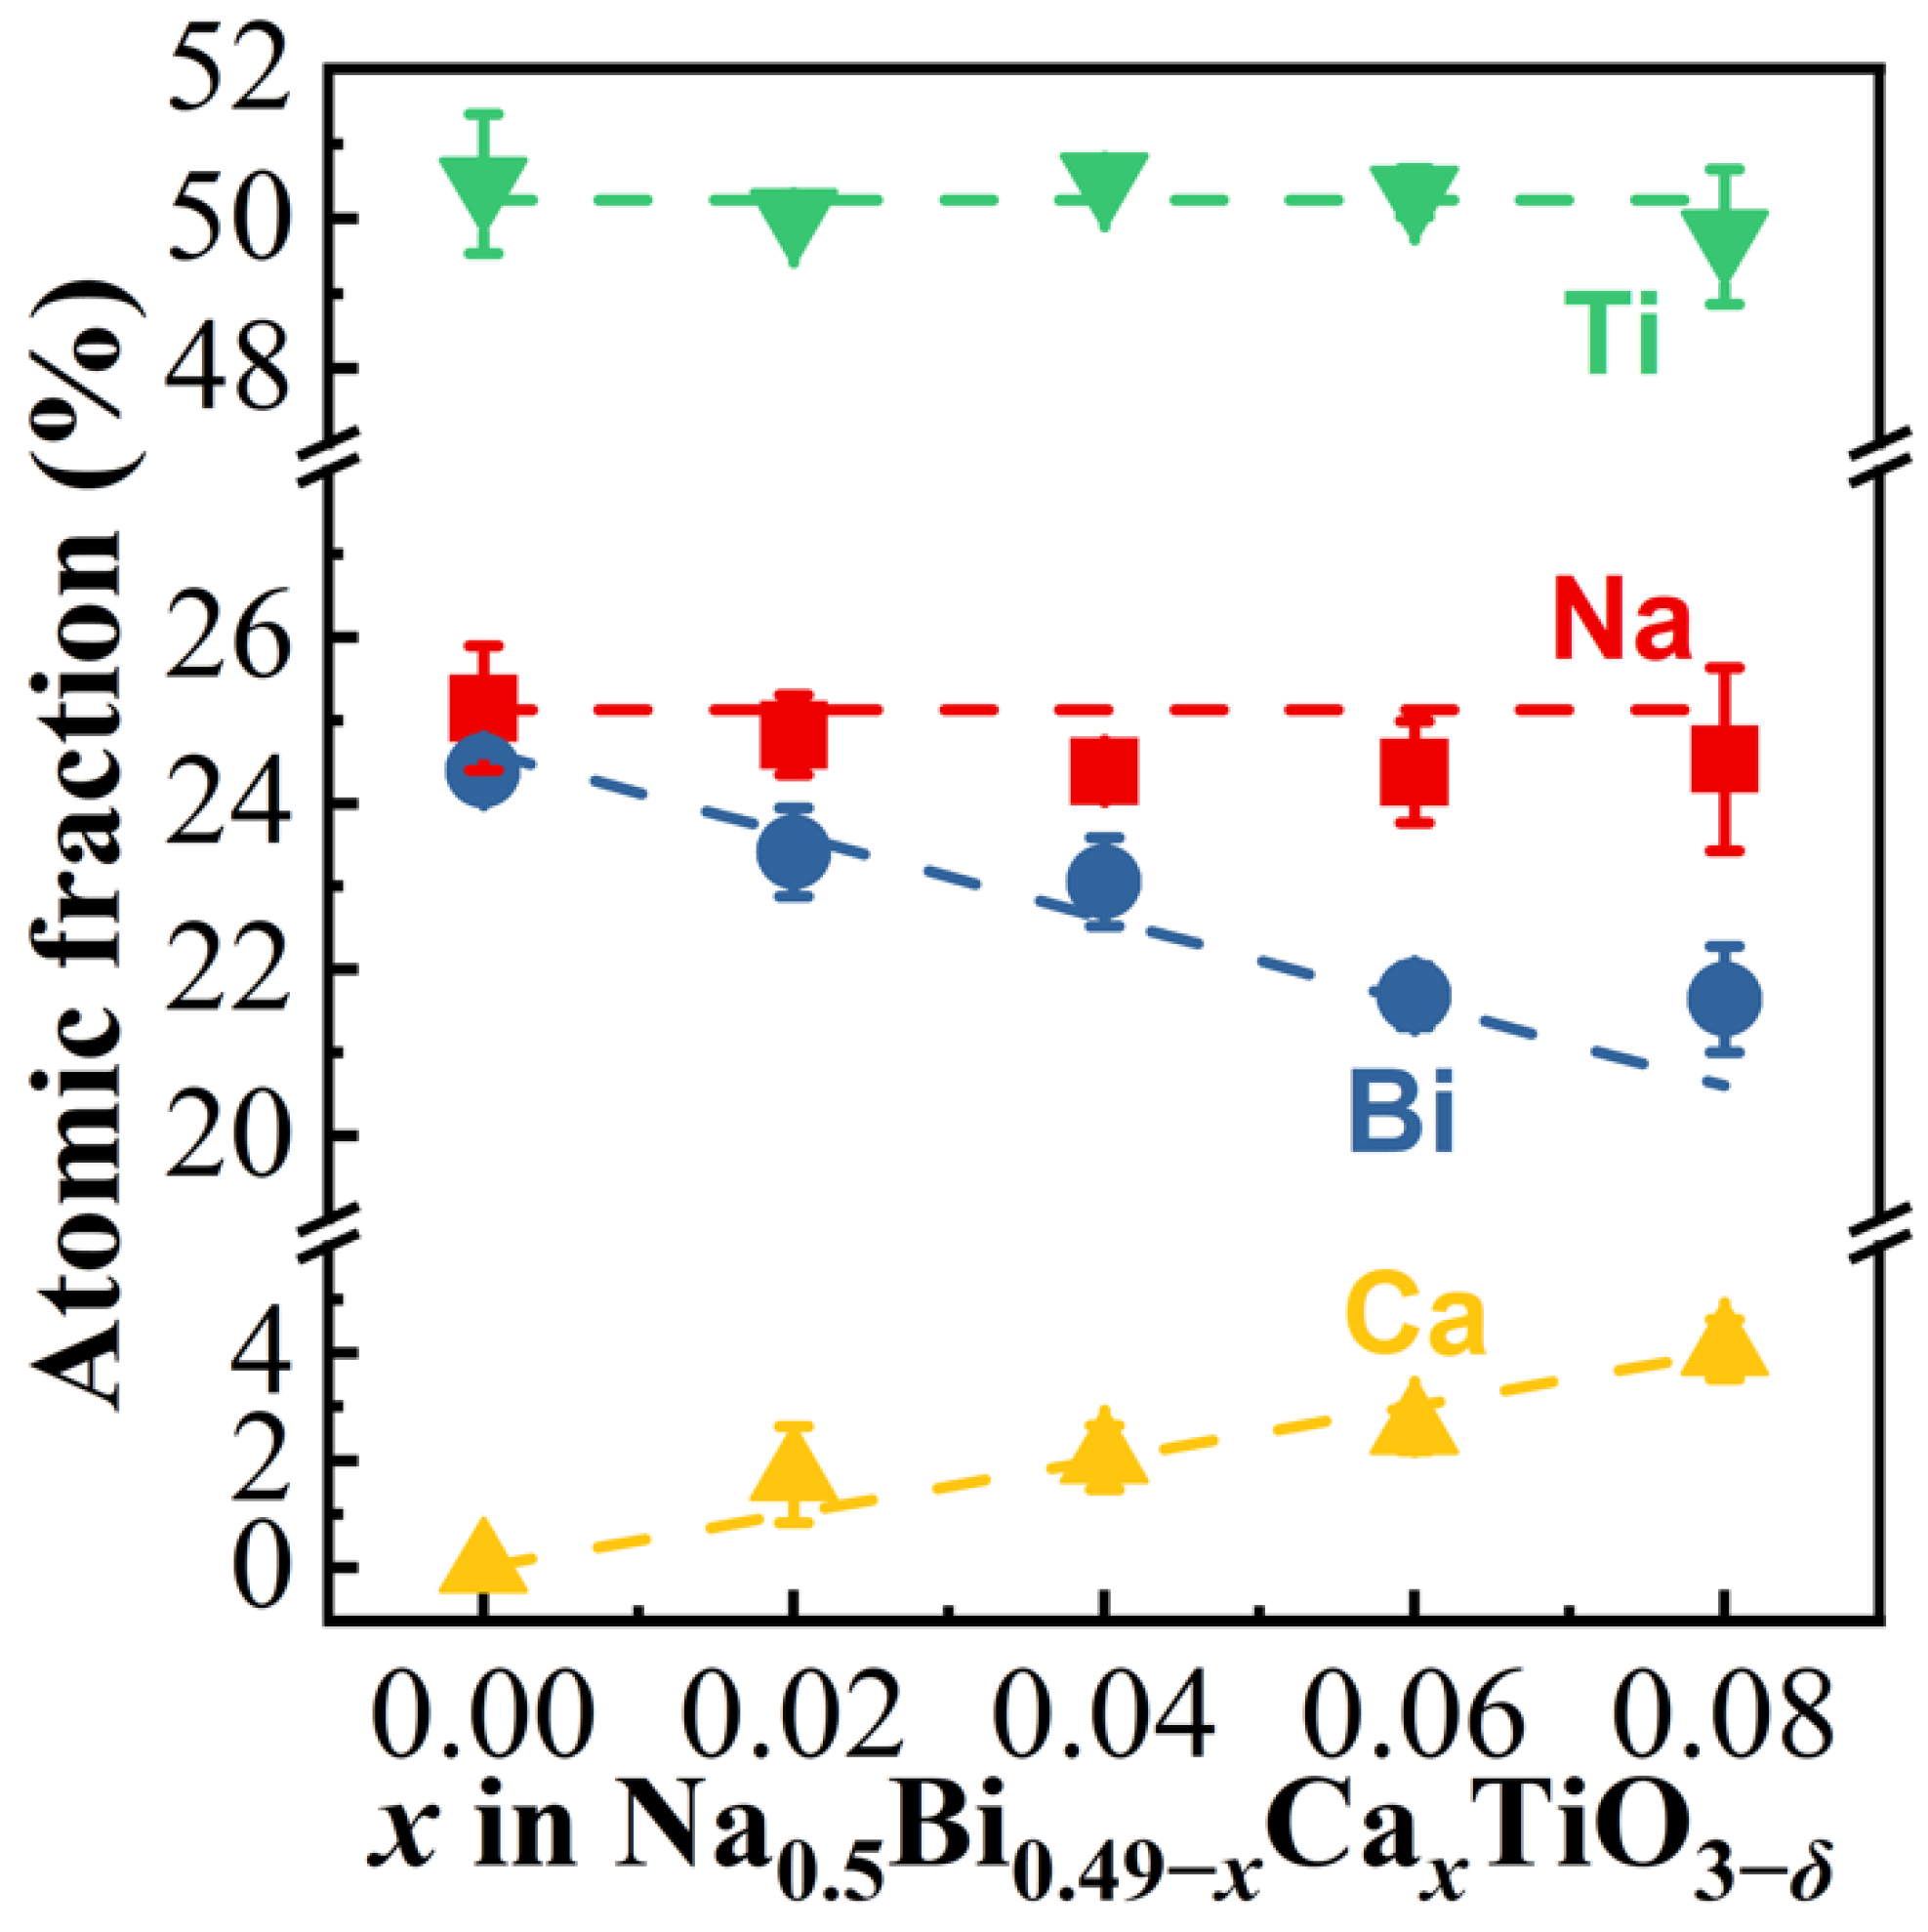
3.1. Crystal Structure, Microstructure, and Composition

The sintered Na0.5Bi0.49−xCaxTiO3−δ ceramics were phase-pure, based on laboratory XRD (Figure 1a). The main peak at 2θ~32.5° shows a systematic shift to higher angle with increasing x (Figure 1b), suggesting Ca2+ was successfully incorporated into the NBT lattice. A small superlattice reflection at 2θ~38.5° from the rhombohedral structure, as indicated by the dashed box in Figure 1c, can be observed for all compositions. Intensity of the superlattice peak decreased with increasing x. The crystal structure could be refined to a rhombohedral cell (space group R3c, Figure 1d, x = 0.04 as an example). The cell volume decreased with increasing x (Figure 1e) due to the smaller ionic radius of Ca2+ (1.34 Å [30]) than that of Bi3+ (~1.39 Å [31]) in 12-fold coordination. Lattice parameters and the fitting qualities are listed in Table 1.
SEM micrographs of thermally-etched surfaces of the sintered Na0.5Bi0.49−xCaxTiO3−δ ceramics are presented in Figure 2, where well-densified microstructure can be observed for all samples. The undoped NB0.49T has an average grain size, d~7.2 μm, which is larger than that of the Ca-doped NB0.49T ceramics due to the higher sintering temperature (1150 °C versus 1100 °C). The value of d decreases with increasing x from ~2.1 μm for x = 0.02 to ~1.6 μm for x = 0.08. EDS analysis shows that the atomic fractions of the A-site (Na, Bi, and Ca), and B-site (Ti) cations are close to their nominal values (Figure 3), which further confirms the successful incorporation of Ca2+ into NB0.49T.

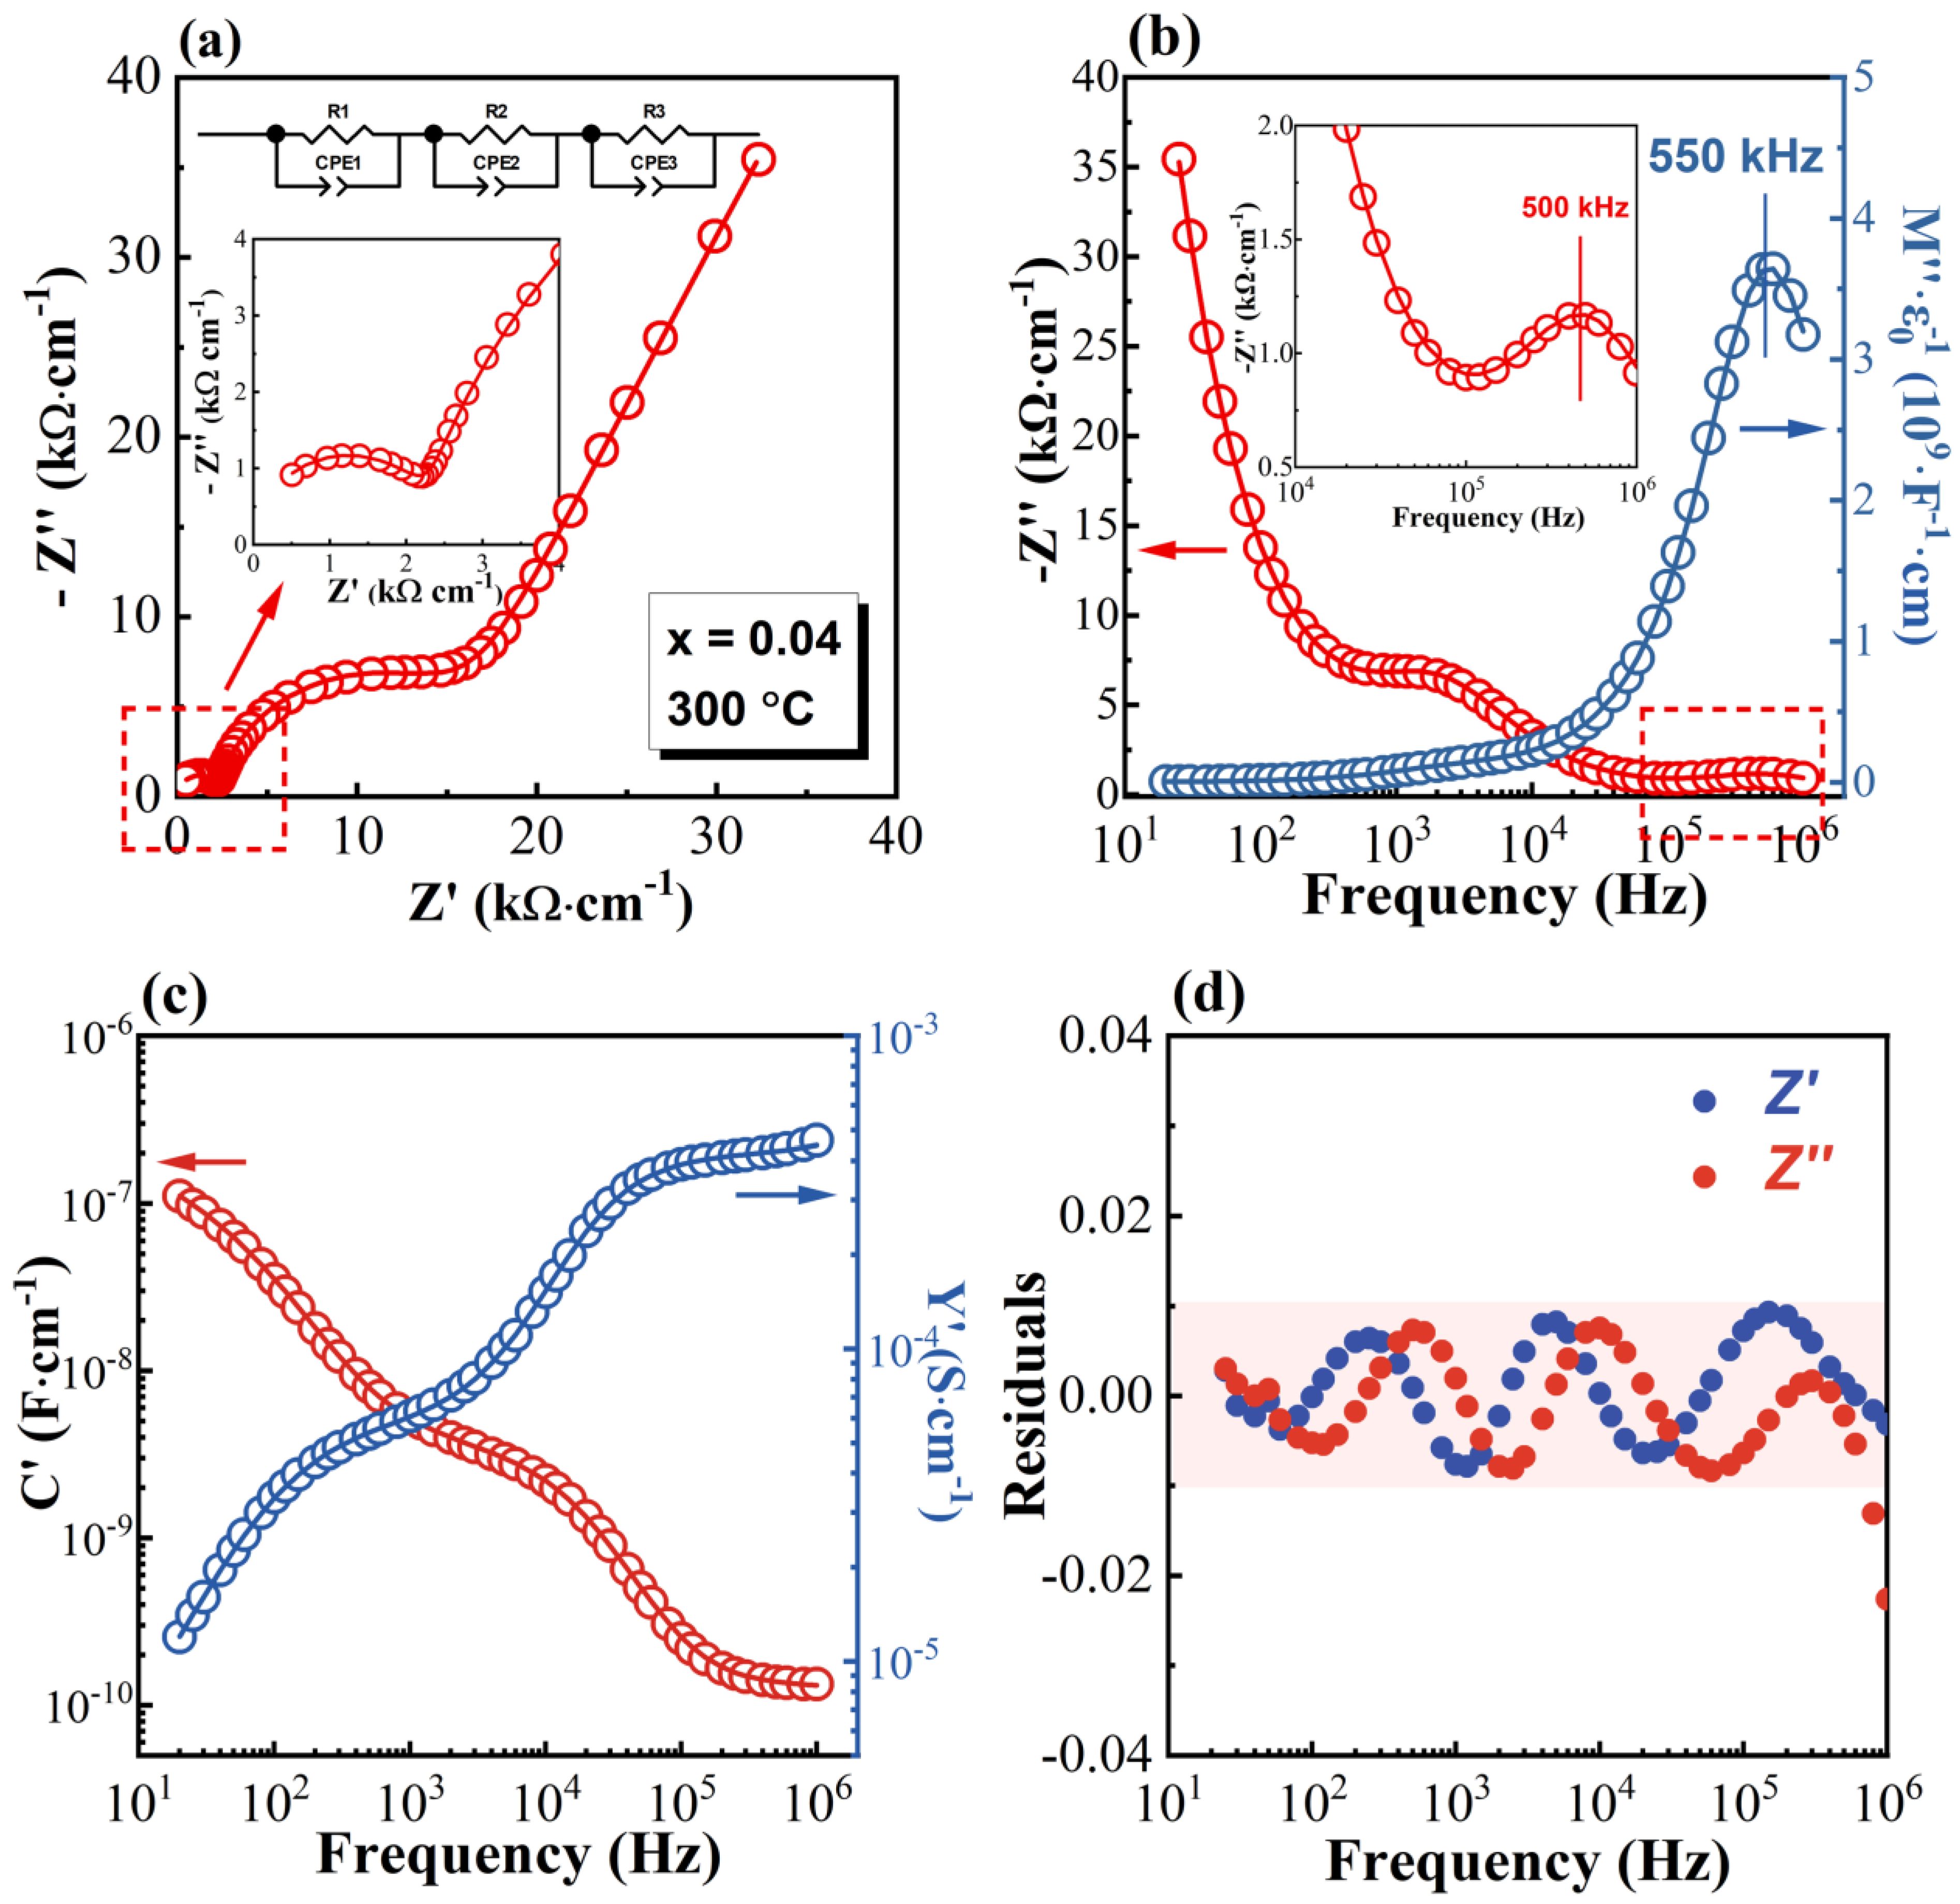
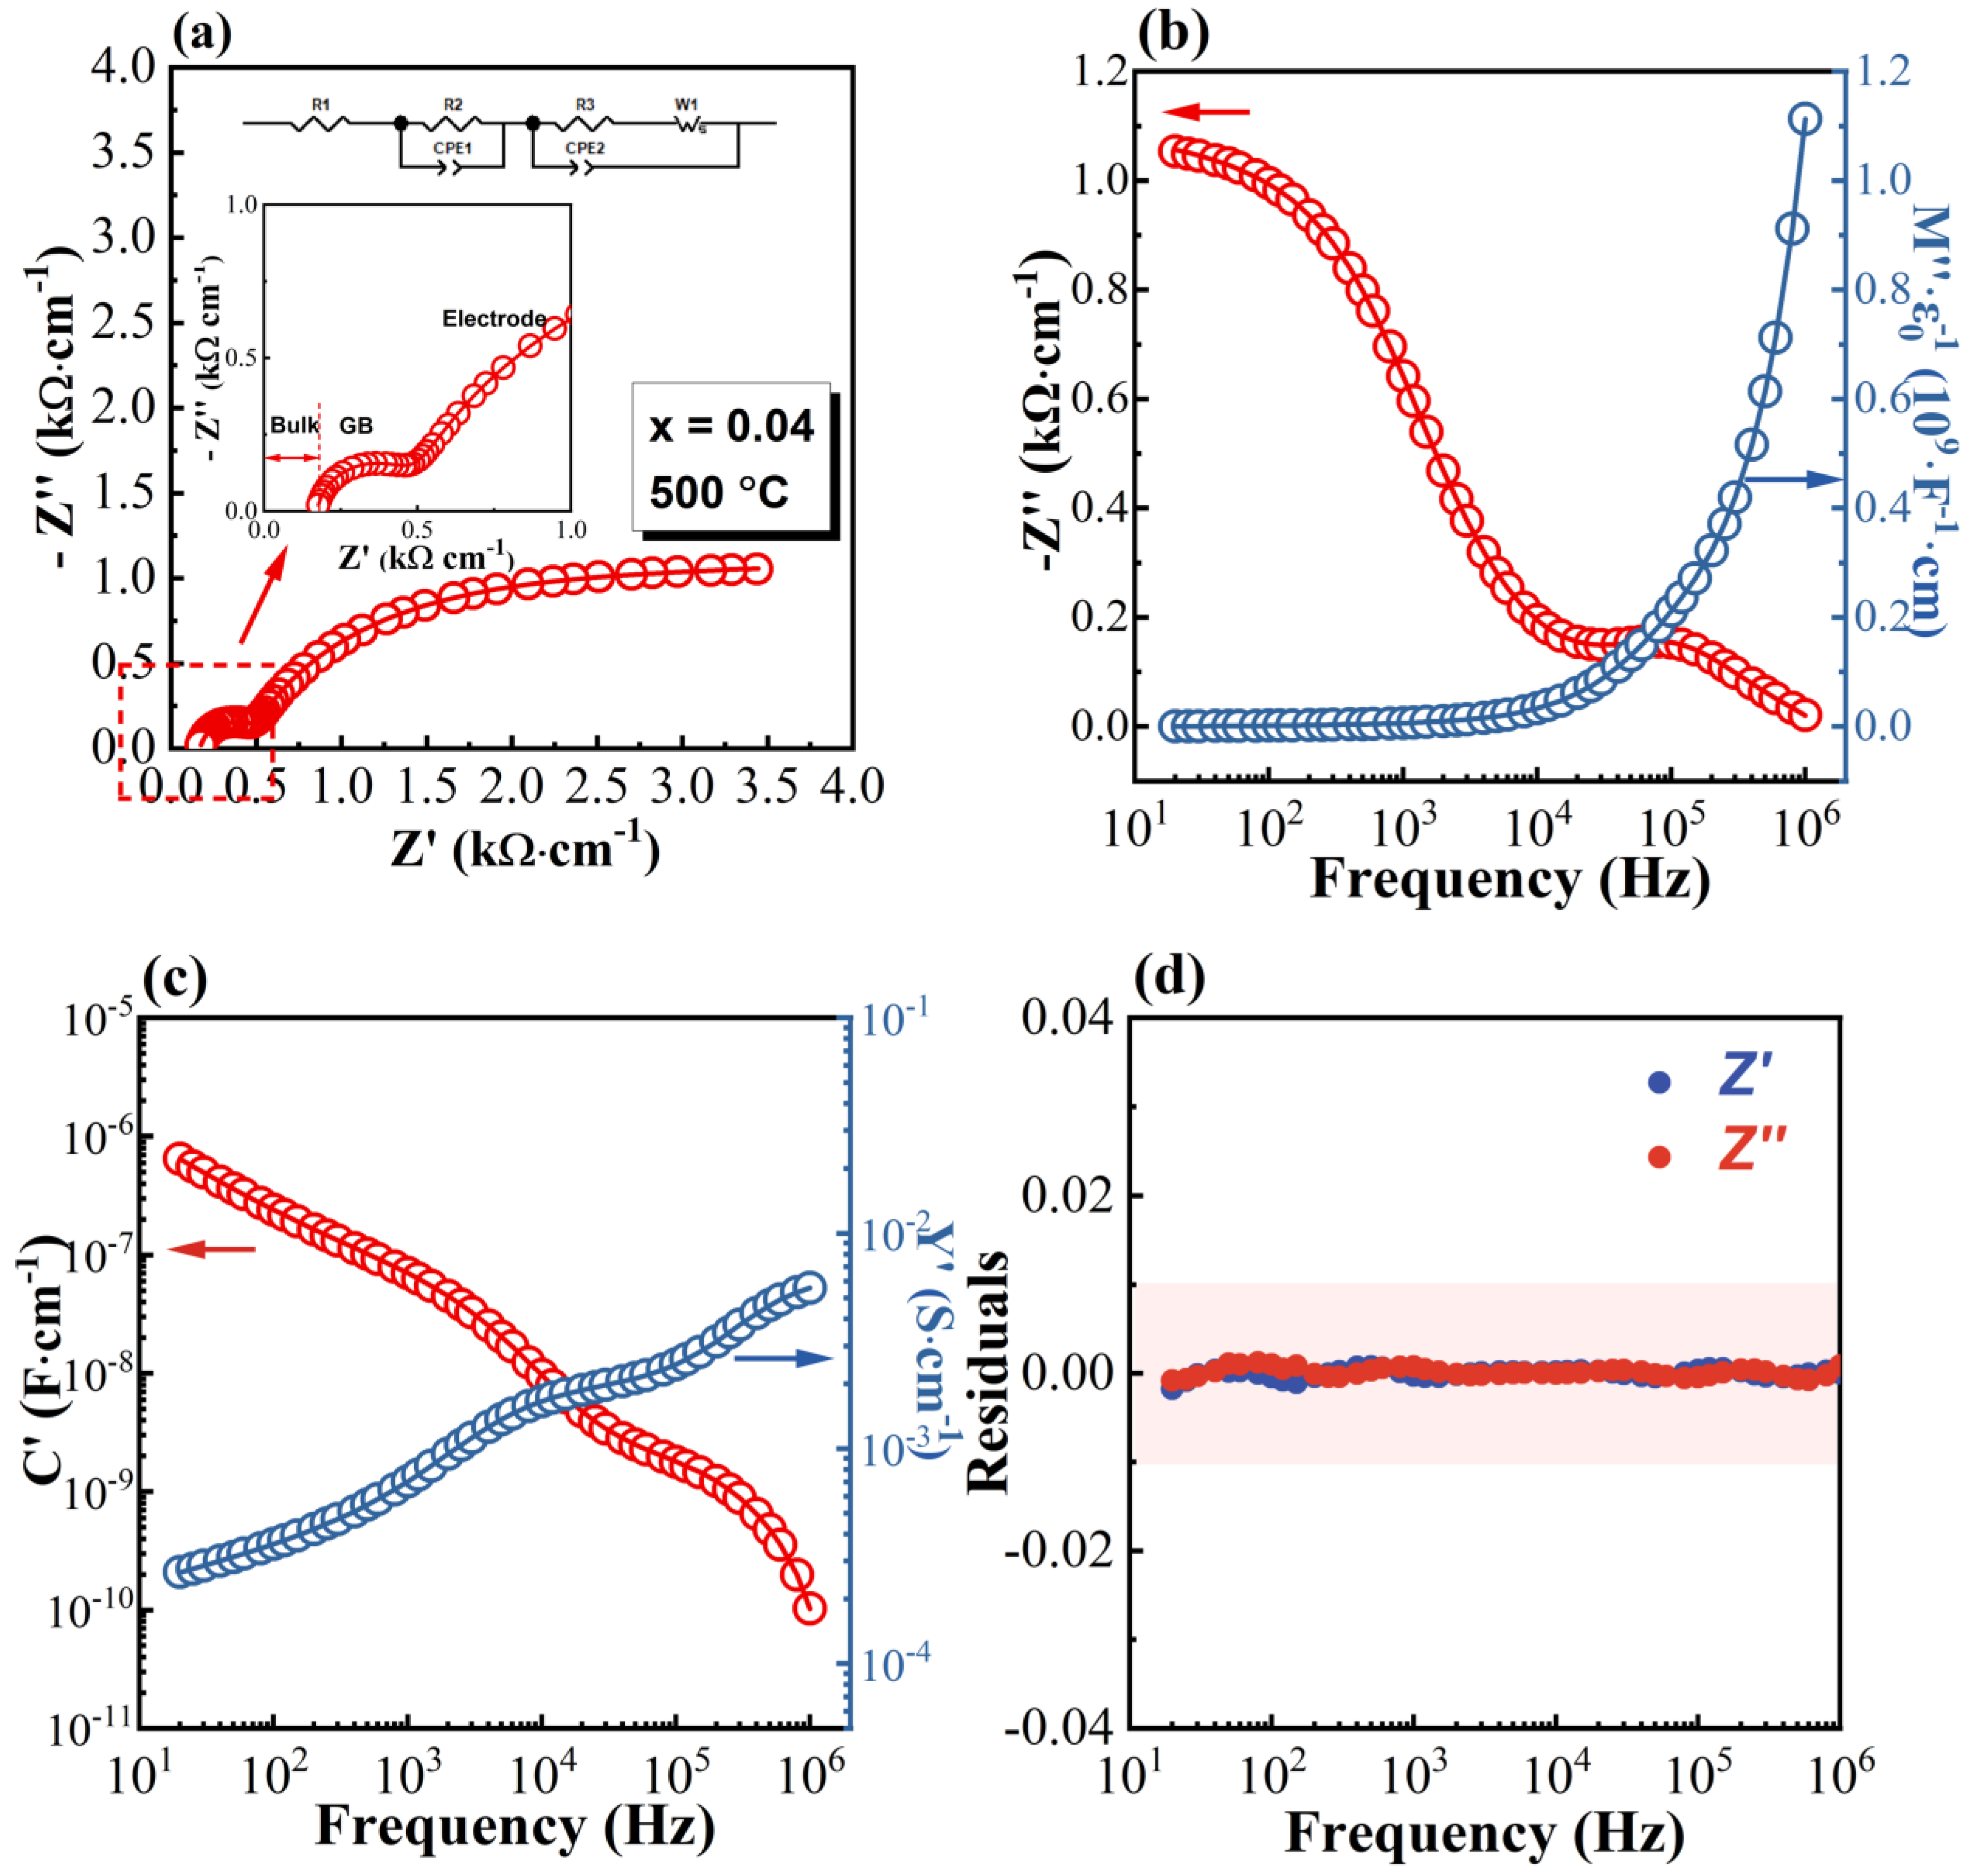
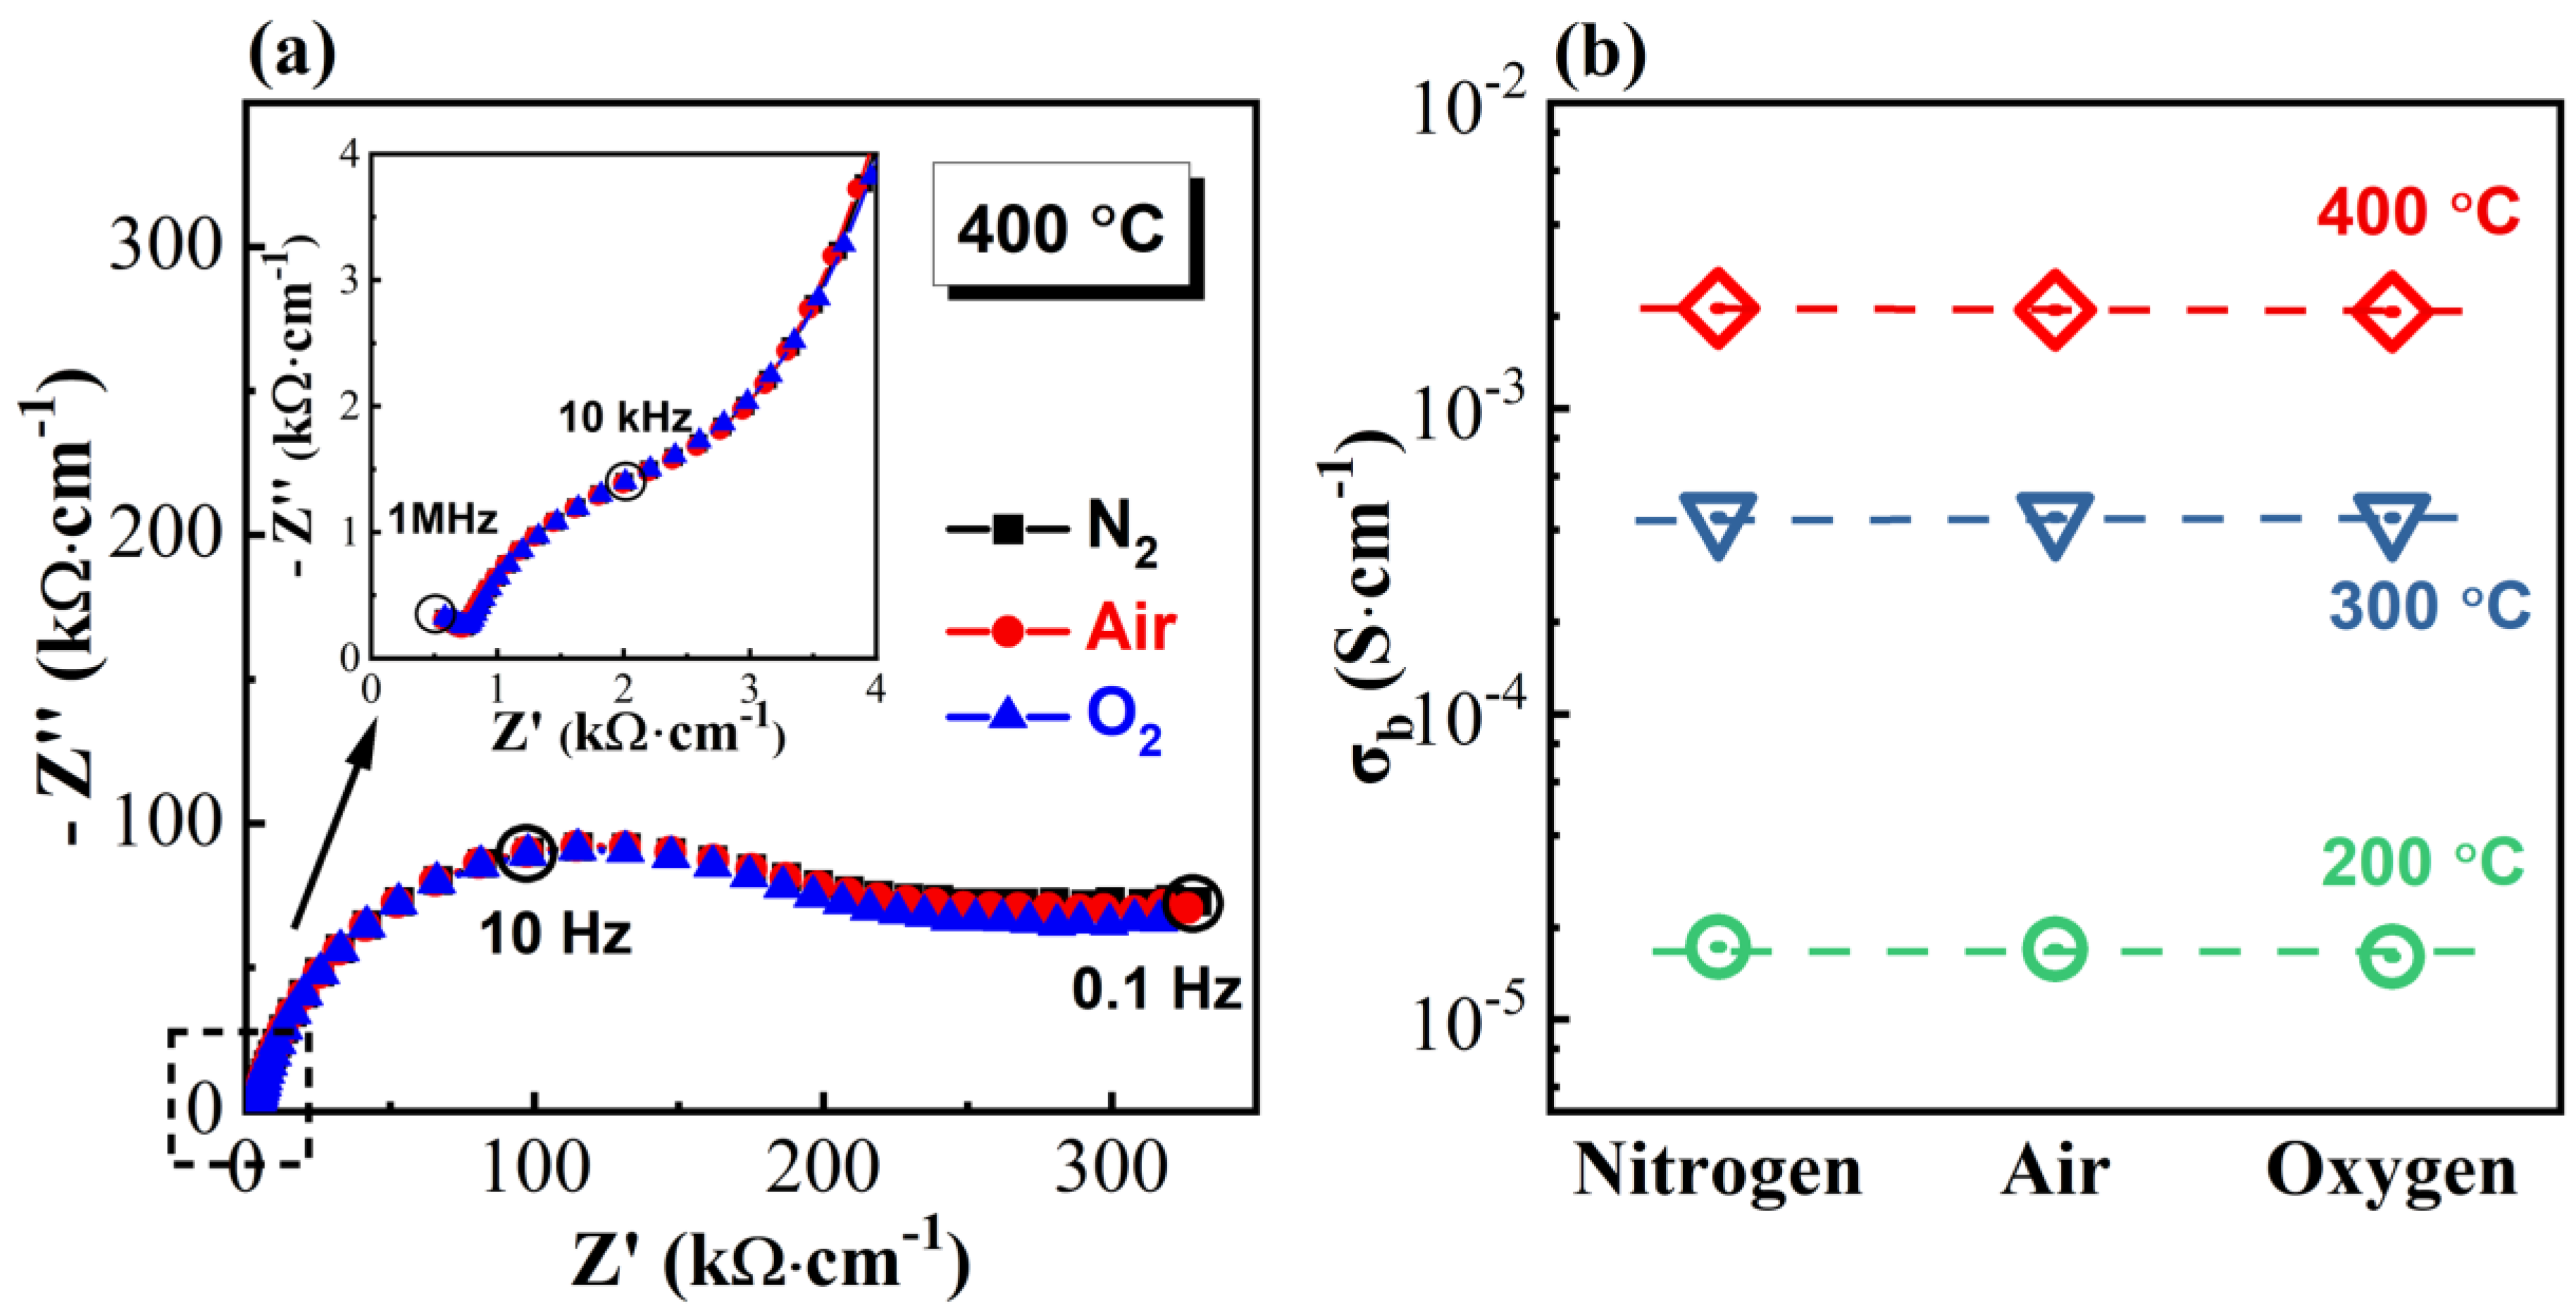
3.2. Impedance Spectra

Impedance spectra of all the Na0.5Bi0.49-xCaxTiO3-δ ceramics present typical features for oxide-ion-conducting NBT. To avoid unnecessary duplication, the impedance spectra for a selected composition, x = 0.04, are presented here. As displayed in Figure 4a, the complex plane Z* plot at 300 °C shows three well-resolved arcs, and can be fitted by an equivalent circuit of three resistor-constant phase elements (R-CPE) connected in series (inset figure in Figure 4a). Apart from the Z* plot, the impedance data and the associated fitting results are also presented in different formats (Figure 4b,c). As shown in Figure 4b, a single peak at ~550 kHz can be observed from the M″-logf plot. The capacitance calculated from the M″ peak maximum according to C = 0.5/Mmax is 1.38 × 10⁻¹⁰ F·cm−1, corresponding to a relative permittivity of ~1570, which is consistent with the reported permittivity magnitude of ferroelectric NBT. Moreover, an expanded view of the high-frequency region of the −Z″-logf plot (inset figure in Figure 4b) shows a peak at ~500 kHz. The very close high-frequency peak positions from M″-logf and −Z″-logf plots, along with the magnitude of the relative permittivity, confirm that the high-frequency response represents the bulk (grains) response. The C′-logf plot (Figure 4c) shows two plateaus. The one with C′~ 1 × 10⁻¹⁰ F·cm−1 at frequencies > 500 kHz agrees with the capacitance value calculated from the Mmax, and therefore represents the bulk response. The second plateau, with C’~3 × 10⁻⁹ F·cm−1 in the frequency range between 103–104 Hz, suggests the response is from grain boundaries (GBs) [32]. In the lower frequency range < 103 Hz, C’ increases with decreasing frequency and approaches 10−7 F·cm−1 at 20 Hz, indicating the low-frequency response originates from the electrode effect [32]. Combining the above information, it can be confirmed that the three arcs on the Z* plot, from high to low frequency, correspond to the responses from the bulk, GBs, and electrode effect, respectively. In all formats, the fitted impedance curves agree well with the experimental data, and the impedance residuals, defined as Zresiduals = (ZmeasuredZfitted)/|Zmeasured| [33], are within 2% in the entire frequency range (Figure 4d). Agreements between the experimental and the fitted data, along with the low-impedance residuals, indicate the validity of the selected equivalent circuit and provide confidence in the extracted resistance and capacitance values.
At high temperatures, for example, 500 °C, the Z* plot displays different features compared to that at lower temperatures. As shown in Figure 5a, from high to low frequency, the Z* plot is featured by an intercept on the Z′ axis, a small arc, and a highly distorted large tail, respectively. The impedance spectra, along with the fitting curves, are also presented in Bode plots (Figure 5b,c). As shown in Figure 5b, at frequencies > 104 Hz, M″ increased continuously with increasing frequency, indicating the M″ peak from the bulk response should appear at f > 1 MHz. On the other hand, a peak at ~10 kHz is presented on the −Z″-logf plot; however, no peak is observed on the M″-logf plot near this frequency, suggesting the response was associated with a large capacitance. In addition, the C′-logf plot in Figure 5c, shows one plateau of ~10−9 F·cm−1 in the frequency range of 20–200 kHz. At lower frequencies (< 104 Hz), C′ approaches 10−6 F·cm−1 at 20 Hz, indicating the low-frequency response originates from the electrode effect. Combining the above information, it can be concluded that the intercept on the Z′ axis, the arc, and the large tail represent the responses from the bulk, the GBs, and the electrode effect, respectively. Therefore, an equivalent circuit, as presented in the top inset figure in Figure 5a, was selected to fit the impedance data, in which L1 and R1 represent the high-frequency induction from the equipment/wire connection and the intercept on the Z′ axis, respectively; R2-CPE2 represents the intermediate-frequency response; R3, W1, and CPE3 are the parameters describing the charge transfer resistance, Warburg impedance, and the double-layer capacitance associated with the electrode process [34]. The impedance residuals were within 0.5% (Figure 5d), showing a high-fitting quality and providing confidence in the validity of the equivalent circuit and its associated fitting results.
From the above equivalent circuit fittings, the bulk resistance (Rb) in the temperature range of 200–500 °C can be obtained, and subsequently converted to σb by σb = 1/Rb. Arrhenius plots for σb of Na0.5Bi0.49−xCaxTiO3−δ ceramics and the compositional dependence of σb at selected temperatures are displayed in Figure 6a,b, respectively, from which the following information can be extracted: (1) σb values for Ca-doped NB0.49T ceramics were higher than that of NB0.49T, confirming the effectiveness of enhancing σb by replacing Bi3+ by Ca2+ on the A-site of NBT; (2) the highest σb was achieved in 2% Ca-doped NB0.49T, with an enhancement of σb by ~1 order of magnitude at temperatures > 350 °C, and ~0.5 order of magnitude at temperatures < 350 °C; (3) σb decreased with further increase in the Ca-doping level, which was more pronounced at temperatures below 350 °C. At temperatures > 400 °C, σb values for Ca-doped NB0.49T showed very small variation with the doping level; (4) for all compositions, a change in the activation energy (Ea) could be observed within the temperature range investigated. The temperature where Ea changed (TEa) was dependent on the Ca-doping level. As shown in Figure 6c, TEa increased with increasing x from ~325 °C for x = 0 to > 400 °C for x = 0.08. Ea varied between 0.75 and 0.84 eV at temperatures below TEa, and between 0.37 and 0.43 eV above TEa.
On the other hand, capacitance of the high-frequency bulk response can be calculated from equivalent circuit-fitting parameters according to C = R(1−-n)/nQ1/n [35], and then converted to the bulk permittivity εr-bulk according to εr-bulk = C/ε0, where ε0 is the vacuum permittivity (8.85 × 10⁻¹⁴ F·cm−1). The εr-bulk of Na0.5Bi0.49-xCaxTiO3-δ ceramics was plotted as a function of temperature and presented in Figure 6d. The εr-bulk of the undoped NB0.49T had a strong dependence on temperature and showed a maximum ~3200 at 325 °C. Ca doping had a significant impact on the εr-bulkT profile: (1) εr-bulk decreased with increasing Ca2+ doping level, which can be related to the lower polarizability of Ca2+ than Bi3+ (3.16 Å3 versus 6.12 Å3 [36]). This gives additional evidence that Ca2+ was successfully incorporated into NB0.49T. (2) With increasing Ca2+-doping level, εr-bulk became less dependent on temperature, i.e., an almost temperature-independent εr between 150 and 350 °C could be observed for x = 0.08.
As the 2% Ca-doped NB0.49T exhibited the highest σb, impedance measurements over a wider frequency range (0.1 Hz to 1 MHz) were carried out for this composition in flowing nitrogen, air, and oxygen at various temperatures. As shown in Figure 7a, the Z* plot at 400 °C was dominated by the large electrode response at low frequencies, which showed a weak dependence on the atmosphere. The bulk and GB responses at high- and intermediate-frequency ranges did not change with oxygen partial pressure (pO2), as shown by the inset figure. The pO2-independent σb (Figure 7b) suggests the electrical conduction was predominately ionic over the limited temperature and pO2 range investigated.

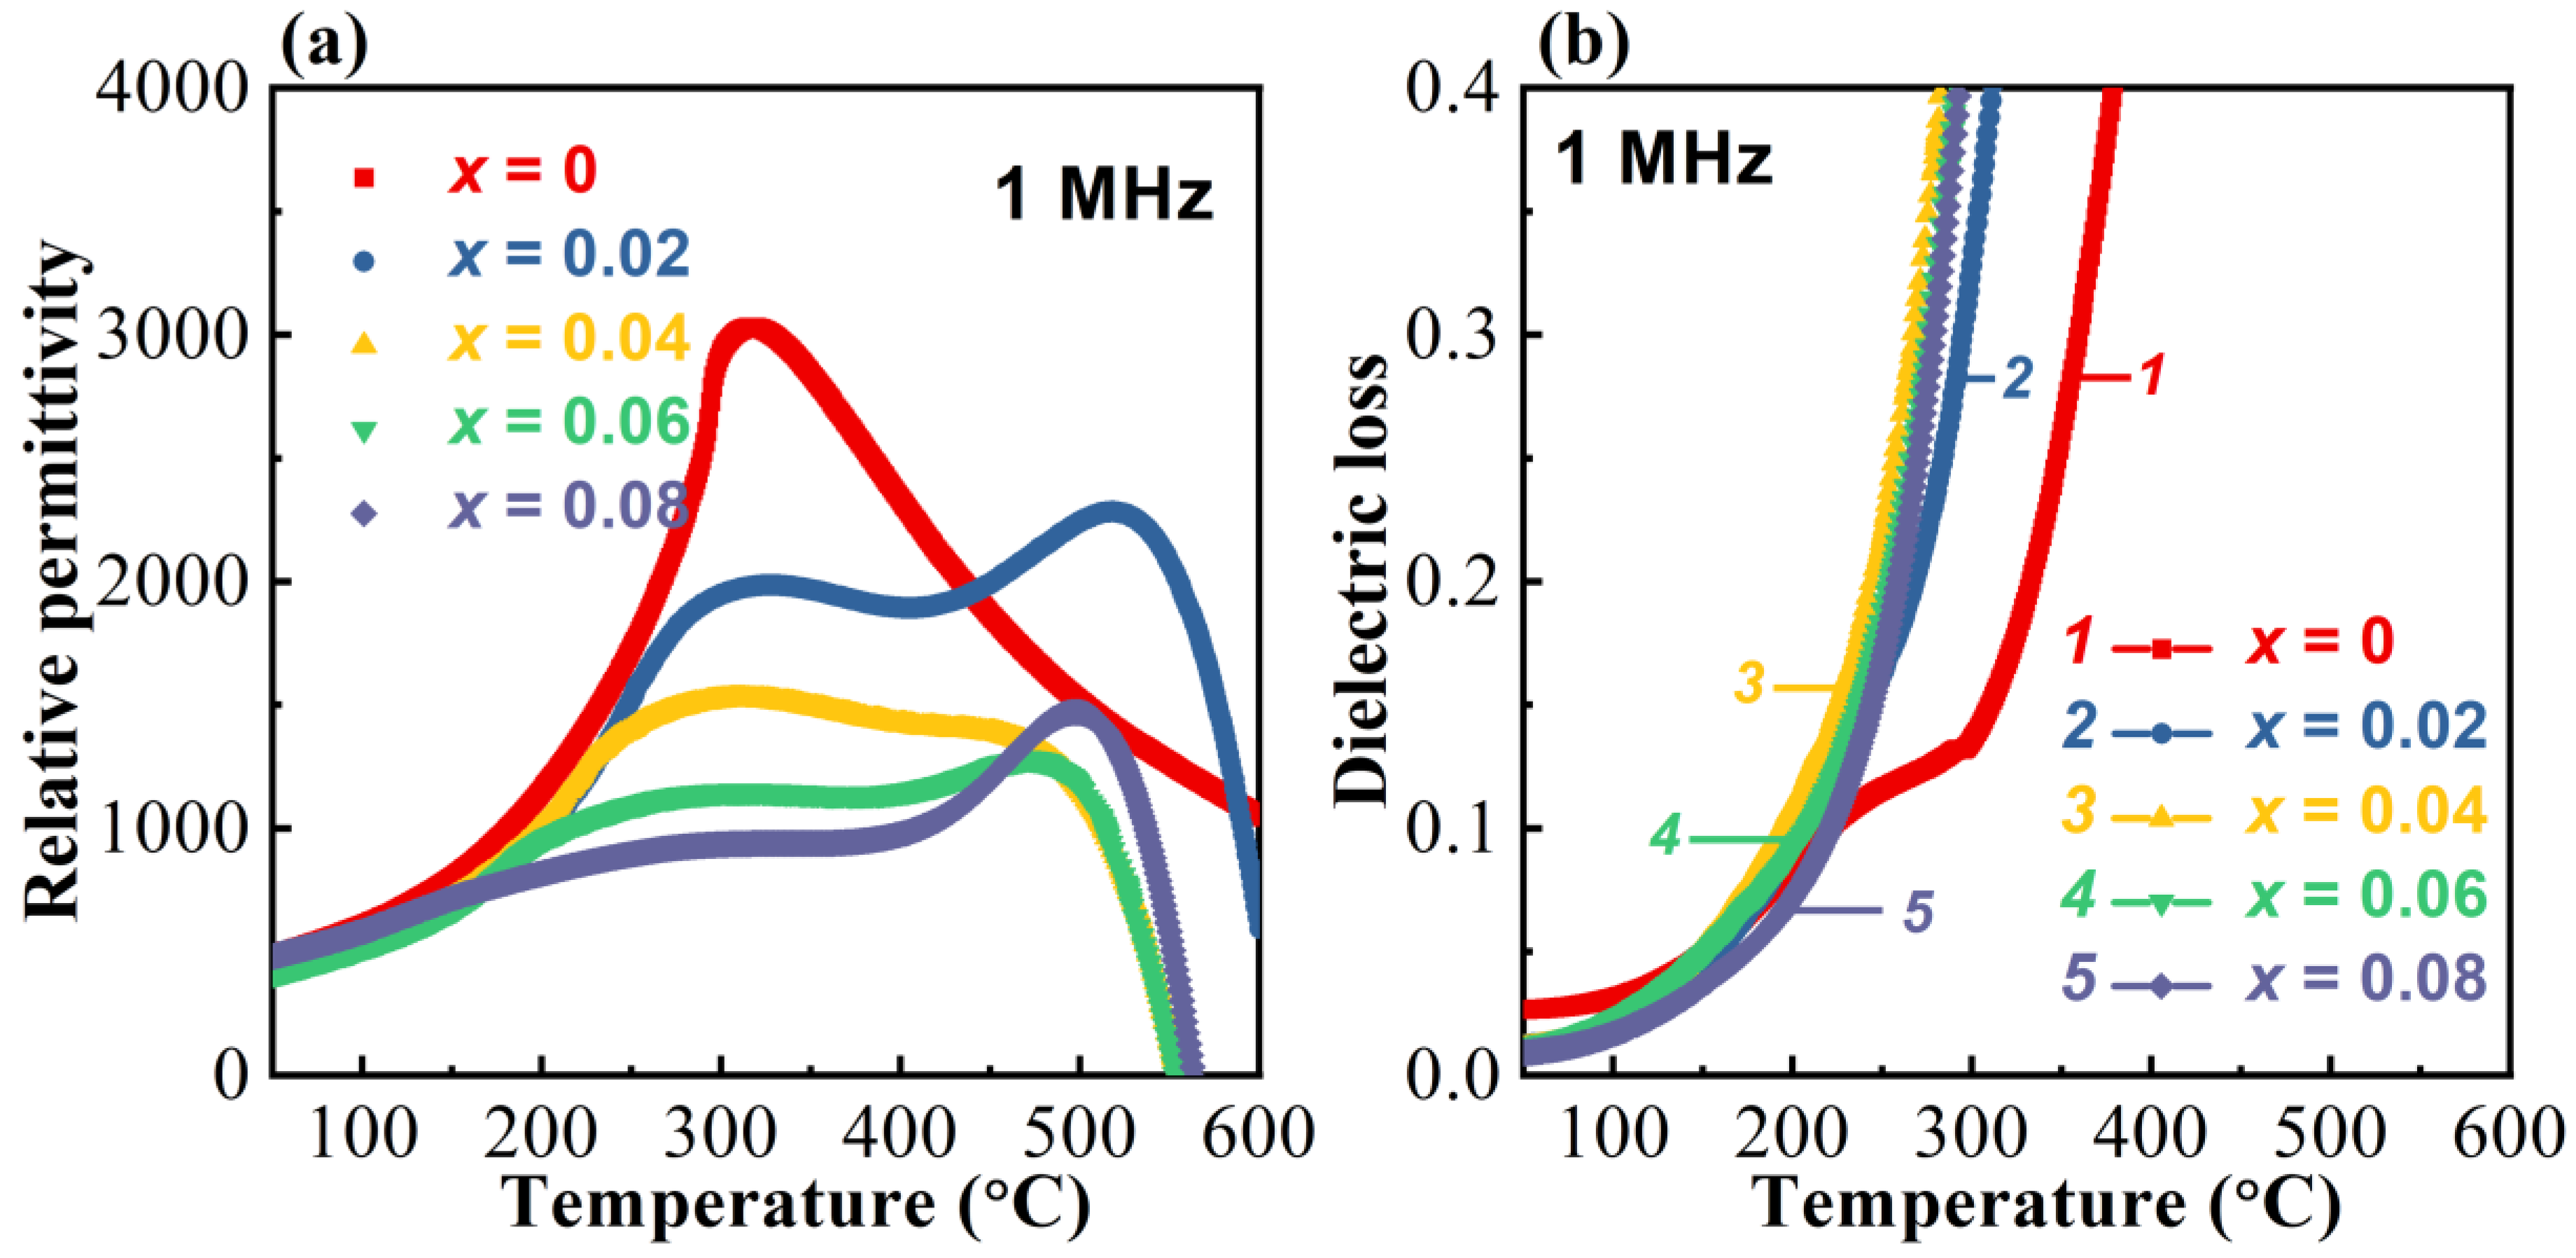
3.3. Dielectric Properties

The permittivity temperature (εr-T) profiles of Na0.5Bi0.49−xCaxTiO3−δ ceramics measured at 1 MHz are presented in Figure 8a. At temperatures < 400 °C, the permittivity maximum decreased with increasing x, and εr was less dependent on temperature when the doping level was high (e.g., x = 0.08). This is consistent with that observed from the εr-bulkT relationship in Figure 7d. At temperatures > 400 °C, εr of the Ca-doped NB0.49T showed a further increase with increasing temperature until ~500 °C, which may be related to the GB or electrode effect and will be discussed later. A further increase in the temperature (T > 500 °C) caused a rapid drop of εr, which was caused by the non-negligible effect from induction when the conductivity of the measured ceramic was sufficiently high. As shown in Figure 8b, the dielectric loss (tan δ) of undoped NB0.49T showed a rapid increase with increasing temperature, and exceeded 0.4 at ~400 °C, which is a characteristic for oxide-ion-conducting NBT. In comparison, tan δ of Ca-doped NB0.49T ceramics showed a steeper increase with increasing temperature and exceeded 0.4 at ~300 °C due to the higher conductivity caused by Ca doping.

4. Discussion

The major findings of this work are: (1) σb of NB0.49T can be enhanced by replacing Bi3+ by Ca2+. The highest σb is reached in 2% Ca-doped NB0.49T. Further increases in the doping level (x) decreases σb; (2) similar to NB0.49T, σbT−1 relationship of Ca-doped NB0.49T also shows a change in Ea from ~0.80 eV at lower temperatures to ~0.40 eV at high temperatures. The temperature at which Ea changes, TEa, depends on the doping level. The higher x, the higher TEa.
In NB0.49T, oxygen vacancies are generated according to the following Kroger–Vink equation:
2 B i B i x + 3 O O x B i 2 O 3 2 V B i + 3 V O ˙ ˙
When Bi3+ is partially replaced by Ca2+ doping, additional oxygen vacancies are created according to
2 C a O B i 2 O 3 2 C a B i + V O ˙ ˙ + 2 O O x
Occurrence of the reaction described by Equation (2) has been confirmed by the significant and systematic reduction of the maximum permittivity (εr-max) of NB0.49T with increasing Ca-doping level (Figure 6d and Figure 8a). Moreover, the analyzed composition from EDS is close to the nominal composition (Figure 3), which also supports the successful incorporation of Ca2+ into NB0.49T. As a consequence, the oxygen vacancy concentration, [ V O ˙ ˙ ] increases with increasing Ca-doping level x (Table 2). As conductivity is determined by the charge carrier concentration (n), charge (q), and mobility (μ) according to σ = n·q·μ, the observed σbx relationship suggests the mobility of oxygen ions as playing a dominant role for σb in Ca-NB0.49T. Possible factors that influence the oxide ion mobility in Ca-doped NB0.49T are discussed, as follows:
(1)
The average structure. Oxide ion conductivity in a perovskite lattice can usually be predicted empirically by the tolerance factor, t [37]; the lattice free volume, Vsf [27]; and the critical radius, rC [38]. Equations for calculating the above three parameters can be found in our previous publications [7,39,40], and the values for Ca-doped NB0.49T are listed in Table 2. With increasing doping level, t decreases towards the optimum value of 0.96 [27]; furthermore, Vsf and rC both increase, which are beneficial to the oxygen ion conduction in perovskites. This fails to explain the σbx relationship in Figure 6b.
(2)
The local structure. Previous studies by first principles calculations have revealed the significant impact of the local structure on oxygen ion diffusion in NBT [22,41]. In perovskites, oxygen ion migration occurs through a saddle point, which is a triangle formed by two A-site cations and one B-site cation [42]. In NBT, the energy barriers for oxygen ion migration through the Na-Na-Ti, Na-Bi-Ti, and Bi-Bi-Ti saddle points are 1.0–1.3, 0.6–0.85 and 0.22 eV, respectively [22]. As high polarizability of Bi3+ and weak Bi–O bonds are critical to the high mobility of oxygen ions, replacement of Bi3+ by Ca2+ with a lower polarizability and a stronger bond with oxygen increases the energy barrier for oxygen migration, and therefore reduces the oxygen ion mobility.
(3)
Trapping of oxygen vacancies by C a B i . Trapping of the positively charged oxygen vacancies by the negatively charged acceptor-type dopants has been widely observed in oxide ion conductors. Evidence comes from the “volcano”-shaped relationship between conductivity and doping level, and a decrease in the activation energy at higher temperatures when the defect associates are released [43]. In NBT, trapping between the B-site acceptor dopants and oxygen vacancies has been supported by first-principles calculations. Although the calculations suggest A-site acceptor dopants are beneficial to oxygen ion diffusion, experimental results on Li- and K-doped NBT still show a drop in the σb when the doping level exceeds 4% [18]. Trapping of oxygen vacancies by C a B i can be another possible reason for the reduced oxygen ion mobility.
The change of Ea for σb at ~300 °C is characteristic of oxide-ion-conducting NBT. The temperature at which Ea changes is associated with a maximum in the permittivity–temperature profile. Several possible reasons for a change of Ea, including the coexistence of rhombohedral and tetragonal phases at 250–400 °C [6], and dissociation of defect clusters and/or changing of conduction paths associated with the various NBT polymorphs [14,23] have been proposed. The reason why Ca doping can delay the change of Ea may be related to the phase transition behavior of Na0.5Bi0.49-xCaxTiO3-δ. CaTiO3 has an orthorhombic structure. Previous studies [25,26] have shown the coexistence of rhombohedral and orthorhombic phases at room temperature and coexistence of orthorhombic and tetragonal phases at 200–450 °C for the solid solution (NBT)0.9(CaTiO3)0.1. Although here the doping level is smaller than 10%, and Ca2+ only nominally substitutes Bi3+ (instead of both Na+ and Bi3+), it is still possible that Ca doping influences the phase transition behavior. However, further in-depth structural analysis is required to understand the relationship between phase transition and the σbT−1 relationship.

5. Conclusions

Na0.5Bi0.49−xCaxTiO3−δ (0 ≤ x ≤ 0.08) ceramics were prepared by solid-state reaction, and their electrical and dielectric properties were investigated primarily by impedance spectroscopy. The major conclusions are summarized as follows:
Replacement of Bi3+ by Ca2+ on the A-site of NB0.49T is an effective approach for enhancing the σb of NB0.49T by creating oxygen vacancies. The highest σb (0.006 S·cm−1) is achieved by 2% Ca2+ doping. Further increase in the doping level decreases σb, which is more pronounced at temperatures below ~350 °C. The σbx relationship can be attributed to the reduced cell volume caused by Ca2+ doping, and the defect association between C a B i and V ˙ ˙ .
Similar to undoped NB0.49T, Ca-doped NB0.49T ceramics show a change in the activation energy for bulk conduction from ~0.80 eV at low temperatures to ~0.40 eV at high temperatures. However, Ca doping can increase the temperature of the activation energy for bulk conduction. This may be related to the delay in phase transition caused by Ca doping, which has been observed in NBT-CaTiO3 solid solutions. Further in-depth investigations of the crystal structure and its evolution with temperature are in progress to support the above speculation.
Ca doping can reduce the temperature dependence of permittivity of NB0.49T. This provides a strategy for obtaining a stable permittivity in certain temperature ranges for NBT-based material by Ca incorporation; however, in this case an insulating NBT and a different doping strategy should be considered to reduce the dielectric loss.

Author Contributions

Conceptualization, F.Y. and D.C.S.; methodology, F.Y. and P.W.; software, F.Y.; validation, F.Y., Q.H. and D.C.S.; formal analysis, F.Y.; investigation, F.Y., Y.H. and P.W.; resources, F.Y., Q.H. and D.C.S.; data curation, F.Y., Y.H. and P.W.; writing—original draft preparation, F.Y.; writing—review and editing, F.Y., Q.H. and D.C.S.; visualization, F.Y.; supervision, F.Y., Q.H. and D.C.S.; project administration, F.Y., Q.H. and D.C.S.; funding acquisition, F.Y., Q.H. and D.C.S. All authors have read and agreed to the published version of the manuscript.

Funding

This research was funded by [National Natural Science Foundation of China] grant number [52072239], [52234010], and [EPSRC] grant number [EP/L027348/1].

Conflicts of Interest

The authors declare no conflict of interest.

References

  1. Li, M.; Pietrowski, M.J.; de Souza, R.A.; Zhang, H.; Reaney, I.M.; Cook, S.N.; Kilner, J.A.; Sinclair, D.C. A family of oxide-ion conductors based on the ferroelectric perovskite Na0.5Bi0.5TiO3. Nat. Mater. 2014, 13, 31–35. [Google Scholar] [CrossRef] [PubMed]
  2. Li, M.; Zhang, H.; Cook, S.N.; Li, L.; Kilner, J.A.; Reaney, I.M.; Sinclair, D.C. Dramatic influence of A-site nonstoichiometry on the electrical conductivity and conduction mechanisms in the perovskite oxide Na0.5Bi0.5TiO3. Chem. Mater. 2015, 27, 629–634. [Google Scholar] [CrossRef]
  3. Chen, X.; Zeng, J.; Yan, X.; Zhou, M.; Tang, P.; Liang, T.; Li, W. Effects of Bi deficiency on the microstructural and conductive properties of Na0.5Bi0.5TiO3 (NBT) perovskite. Solid State Ion. 2017, 209, 152–162. [Google Scholar] [CrossRef]
  4. Chen, X.; Zhou, M.; Shi, J.; Liang, T.; Zeng, J.; Yan, X.; Luo, N.; Li, W.; Wei, Y. Microstructure and electrical conductivity of A-site fully stoichiometric Na0.5+xBi0.5−xTiO3−δ with different Na/Bi ratios. Ceram. Int. 2019, 45, 11438–11447. [Google Scholar] [CrossRef]
  5. Shi, J.; Liu, X.; Zhu, F.; Tian, W.; Xia, Y.; Li, T.; Rao, R.; Zhang, T.; Liu, L. Oxygen vacancy migration and its lattice structural origin in A-site non-stoichiometric bismuth sodium titanate perovskites. J. Mater. 2022, 8, 719–729. [Google Scholar] [CrossRef]
  6. Yang, F.; Zhang, H.; Li, L.; Reaney, I.M.; Sinclair, D.C. High ionic conductivity with low degradation in A-site strontium-doped nonstoichiometric sodium bismuth titanate perovskite. Chem. Mater. 2016, 28, 5269–5273. [Google Scholar] [CrossRef] [Green Version]
  7. Yang, F.; Wu, P.; Sinclair, D.C. Enhanced bulk conductivity of A-site divalent acceptor-doped non-stoichiometric sodium bismuth titanate. Solid State Ion. 2017, 299, 38–45. [Google Scholar] [CrossRef] [Green Version]
  8. Yang, F.; Li, M.; Li, L.; Wu, P.; Pradal-Velázquez, E.; Sinclair, D.C. Optimisation of oxide-ion conductivity in acceptor-doped Na0.5Bi0.5TiO3 perovskite: Approaching the limit? J. Mater. Chem. A 2017, 5, 21658–21662. [Google Scholar] [CrossRef] [Green Version]
  9. Bhattacharyya, R.; Omar, S. Electrical conductivity study of B-site Ga doped non-stoichiometric sodium bismuth titanate ceramics. J. Alloy. Compd. 2018, 746, 54–61. [Google Scholar] [CrossRef]
  10. Li, M.Y.; He, C.; Wang, W.G.; Hao, G.L.; Li, X.Y.; Liu, T.; Wang, X.F.; Wang, D. Investigation of Ga doping for non-stoichiometric sodium bismuth titanate ceramics. J. Mater. Sci. Mater. Electron. 2021, 32, 16104–16112. [Google Scholar] [CrossRef]
  11. Singh, P.; Pandey, R.; Singh, P. Polyol-mediated synthesis of Bi-deficient Mg2+-doped sodium bismuth titanate and study of oxide ion migration behavior with functional properties. J. Alloy. Compd. 2021, 860, 158492. [Google Scholar] [CrossRef]
  12. Bhattacharyya, R.; Das, S.; Omar, S. High ionic conductivity of Mg2+-doped non-stoichiometric sodium bismuth titanate. Acta Mater. 2018, 159, 8–15. [Google Scholar] [CrossRef]
  13. Lu, Y.; López, C.A.; Wang, J.; Alonso, J.A.; Sun, C. Insight into the structure and functional application of Mg-doped Na0.5Bi0.5TiO3 electrolyte for solid oxide fuel cells. J. Alloy. Compd. 2018, 752, 213–219. [Google Scholar] [CrossRef]
  14. Koch, L.; Steiner, S.; Meyer, K.; Seo, I.; Albe, K.; Frömling, T. Ionic conductivity of acceptor doped sodium bismuth titanate: Influence of dopants, phase transitions and defect associates. J. Mater. Chem. C 2017, 5, 8958–8965. [Google Scholar] [CrossRef]
  15. Steiner, S.; Seo, I.; Ren, P.; Li, M.; Keeble, D.J.; Frömling, T. The effect of Fe-acceptor doping on the electrical properties of Na1/2Bi1/2TiO3 and 0.94(Na1/2Bi1/2)TiO3-0.06BaTiO3. J. Am. Ceram. Soc. 2019, 102, 5295–5304. [Google Scholar] [CrossRef] [Green Version]
  16. Groszewicz, P.B.; Koch, L.; Steiner, S.; Ayrikyan, A.; Webber, K.G.; Frömling, T.; Albe, K.; Buntkowsky, G. The fate of aluminium in (Na,Bi)TiO3-based ionic conductors. J. Mater. Chem. A 2020, 8, 18188–18197. [Google Scholar] [CrossRef]
  17. Shih, D.P.C.; Aguadero, A.; Skinner, S.J. Improvement of ionic conductivity in A-site lithium doped sodium bismuth titanate. Solid State Ion. 2018, 317, 32–38. [Google Scholar] [CrossRef]
  18. Shih, D.P.C.; Aguadero, A.; Skinner, S.J. A-site acceptor-doping strategy to enhance oxygen transport in sodium-bismuth-titanate perovskite. J. Am. Ceram. Soc. 2023, 106, 100–108. [Google Scholar] [CrossRef]
  19. Liu, X.; Zhao, Y.; Hu, H.; Du, H.; Shi, J. Ionic conductive and dielectric properties of samarium isovalent doping in non-stoichiometric bismuth sodium titanate perovskite. Ionics 2019, 25, 2729–2734. [Google Scholar] [CrossRef]
  20. Shi, J.; Rao, R.; Tian, W.; Xu, X.; Liu, X. Anomalous electrical performance of A-site double-bivalent-doped Bi0.49Na0.5TiO3-δ ceramics from nominal oxygen deficiency to excess. Ceram. Int. 2022, 48, 5210–5216. [Google Scholar] [CrossRef]
  21. Liu, X.; Du, H.; Shi, J.; Hu, H.; Hao, X. Ionic conduction and anomalous diffusion in Sr and Ga acceptor co-doped bismuth sodium titanate solid solutions. ECS J. Solid State Sci. Technol. 2018, 7, N96–N100. [Google Scholar] [CrossRef]
  22. He, X.; Mo, Y. Accelerated materials design of Na0.5Bi0.5TiO3 oxygen ionic conductors based on first principles calculations. Phys. Chem. Chem. Phys. 2015, 17, 18035–18044. [Google Scholar] [CrossRef] [PubMed]
  23. Meyer, K.; Albe, K. Influence of phase transitions and defect associates on the oxygen migration in the ion conductor Na1/2Bi1/2TiO3. J. Mater. Chem. A 2017, 5, 4368–4375. [Google Scholar] [CrossRef]
  24. Koch, L.; Steiner, S.; Hoang, A.; Klomp, A.J.; Albe, K.; Frömling, T. Revealing the impact of acceptor dopant type on the electrical conductivity of sodium bismuth titanate. Acta Mater. 2022, 229, 117808. [Google Scholar] [CrossRef]
  25. Ranjan, R.; Garg, R.; Kothai, V.; Agrawal, A.; Senyshyn, A.; Boysen, H. Phases in the (1−x)Na0.5Bi0.5TiO3-(x)CaTiO3 system. J. Phys. Condens. Matter 2010, 22, 075901. [Google Scholar] [CrossRef]
  26. Roukos, R.; Zaiter, N.; Chaumont, D. Relaxor behaviour and phase transition of perovskite ferroelectrics-type complex oxides (1−x)Na0.5Bi0.5TiO3xCaTiO3 system. J. Adv. Ceram. 2018, 7, 124–142. [Google Scholar] [CrossRef] [Green Version]
  27. Hayashi, H.; Inaba, H.; Matsuyama, M.; Lan, N.G.; Mokiya, M.; Tagawa, H. Structural consideration on the ionic conductivity of perovskite-type oxides. Solid State Ion. 1999, 122, 1–15. [Google Scholar] [CrossRef]
  28. Larson, A.C.; Von Drelle, R.B. General Structure Analysis System (GSAS); Los Alamos National Laboratory Report LAUR 86-748 (2004); Los Alamos National Laboratory: Los Alamos, NM, USA, 2004. [Google Scholar]
  29. Toby, B.H. EXPGUI, a graphical user interface for GSAS. J. Appl. Crystallogr. 2001, 34, 210–213. [Google Scholar] [CrossRef] [Green Version]
  30. Shannon, R.D. Revised effective ionic radii and systematic studies of interatomic distances in halides and chalcogenides. Acta Crystallogr. Sect. A 1976, 31, 751–767. [Google Scholar] [CrossRef]
  31. Jones, G.O.; Thomas, P.A. Investigation of the structure and phase transitions in the novel A-site substituted distorted perovskite compound Na0.5Bi0.5TiO3. Acta Crystallogr. Sect. B 2002, 58, 168–178. [Google Scholar] [CrossRef]
  32. Irvine, J.T.S.; Sinclair, D.C.; West, A.R. Electroceramics: Characterization by impedance spectroscopy. Adv. Mater. 1990, 2, 132–138. [Google Scholar] [CrossRef]
  33. Masó, N.; West, A.R. Electronic conductivity in yttria-stabilized zirconia under a small dc bias. Chem. Mater. 2015, 27, 1552–1558. [Google Scholar] [CrossRef]
  34. MacDonald, J.R. Impedance Spectroscopy—Emphasizing Solid Materials and Systems; Wiley: New York, NY, USA, 1987. [Google Scholar]
  35. Fleig, J. The grain boundary impedance of random microstructures: Numerical simulations and implications for the analysis of experimental data. Solid State Ion. 2002, 150, 181–193. [Google Scholar] [CrossRef]
  36. Grimes, N.W.; Grimes, R.W. Dielectric polarizability of ions and the corresponding effective number of electrons. J. Phys. Condens. Matter 1998, 10, 3029–3034. [Google Scholar] [CrossRef]
  37. Beskow, G. V. M. Goldschmidt: Geochemische Verteilungsgesetze der Elemente. Geol. Fören. I Stockh. Förh. 1924, 46, 738–743. [Google Scholar] [CrossRef]
  38. Kilner, J.A.; Brook, R.J. A study of oxygen ion conductivity in doped non-stoichiometric oxides. Solid State Ion. 1982, 6, 237–252. [Google Scholar] [CrossRef]
  39. Yang, F.; Wu, P.; Sinclair, D.C. Suppression of electrical conductivity and switching of conduction mechanisms in ‘stoichiometric’ (Na0.5Bi0.5TiO3)1−x(BiAlO3)x (0 ≤ x ≤ 0.08) solid solutions. J. Mater. Chem. C 2017, 5, 7243–7252. [Google Scholar] [CrossRef] [Green Version]
  40. Yang, F.; Wu, P.; Sinclair, D.C. Electrical conductivity and conduction mechanism in (Na0.5Bi0.5TiO3)1−x(BiScO3)x (0.00 ≤ x ≤ 0.35) solid solutions. J. Mater. Chem. C 2018, 6, 11598–11607. [Google Scholar] [CrossRef]
  41. Dawson, J.A.; Chen, H.; Tanaka, I. Crystal structure, defect chemistry and oxygen ion transport of the ferroelectric perovskite, Na0.5Bi0.5TiO3: Insights from the first principles calculations. J. Mater. Chem. A 2015, 3, 16574–16582. [Google Scholar] [CrossRef]
  42. Islam, M.S. Ionic transport in ABO3 perovskite oxides: A computer modelling tour. J. Mater. Chem. 2000, 10, 1027–1038. [Google Scholar] [CrossRef]
  43. Arachi, Y.; Sakai, H.; Yamamoto, O.; Takeda, Y.; Imanishai, N. Electrical conductivity of the ZrO2-Ln2O3 (Ln = lanthanides) system. Solid State Ionics 1999, 121, 133–139. [Google Scholar] [CrossRef]
Figure 1. (a) XRD patterns of the Na0.5Bi0.49−xCaxTiO3−δ ceramics; (b,c) expanded views of the 2θ range of 32–34° and 37–43°, respectively. The dashed vertical line in (b) shows the peak position for x = 0, and the dashed box in (c) indicates the superlattice peak from the rhombohedral structure. (d) Rietveld refinement of the XRD pattern (x = 0.04 as an example). Crosses represent the observed pattern and the solid line through the symbols shows the calculated fit. The reflection marker for the R3c structure of NBT is shown as vertical lines with the difference pattern below. The quality of fit is indicated in the figure. (e) Cell volume as a function of x.
Crystals 12 01800 g001
Figure 2. (ae) SEM micrographs of the thermally etched surfaces of Na0.5Bi0.49−xCaxTiO3−δ: (a) x = 0; (b) x = 0.02; (c) x = 0.04; (d) x = 0.06; and (e) x = 0.08. (f) Average grain size as a function of x.
Crystals 12 01800 g002
Figure 3. Atomic fraction of each cation in Na0.5Bi0.49−xCaxTiO3−δ obtained from EDS. Data were collected from 5 randomly selected areas on polished surfaces (without thermal etching). The dashed lines indicate the nominal values.
Crystals 12 01800 g003
Figure 4. Impedance spectroscopy data and equivalent circuit-fitting results presented in different formats for a selected composition, x = 0.04, at 300 °C. (a) Z* plot and the equivalent circuit used for fitting; (b) −Z″-logf and M″-logf plots; (c) C′-logf and Y′-logf plots; (d) Impedance residuals showing the quality of fit. In (ac), the open circles are the experimental data and the solid lines across the symbols are the fitting curve. The inset figures in (a,b) are the expanded views of the high-frequency arc, as indicated by the dashed rectangles.
Crystals 12 01800 g004
Figure 5. Impedance spectroscopy data and equivalent circuit fitting results presented in different formats for a selected composition, x = 0.04, at 500 °C. (a) Z* plot and the equivalent circuit used for fitting; (b) −Z″-logf and M″-logf plots; (c) C′-logf and Y′-logf plots; (d) impedance residuals showing the quality of fit. In (ac), open circles are experimental data and solid lines across the symbols are the fitting curve. The inset figure in (a) is the expanded view of the high-frequency region, as indicated by the dashed rectangle.
Crystals 12 01800 g005
Figure 6. (a) Arrhenius plots for σb; (b) compositional dependence of σb at selected temperatures; (c) variation of TEa with x. Ea values in the temperature ranges 200 °C ≤ TTEa and TEa < T ≤ 500 °C, are also indicated in the figure. (d) εr-bulk calculated from the bulk response as a function of temperature.
Crystals 12 01800 g006
Figure 7. (a) Z* plots for a selected composition, x = 0.02, measured in flowing N2, air, and O2 at 400 °C. The inset figure is an expanded view of the high-frequency region. (b) Bulk conductivity extracted from impedance data at different temperatures and atmospheres.
Crystals 12 01800 g007
Figure 8. Dielectric spectroscopy of Na0.5Bi0.49−xCaxTiO3−δ: (a) relative permittivity at 1 MHz versus temperature; (b) dielectric loss at 1 MHz versus temperature.
Crystals 12 01800 g008
Table 1. Lattice parameters and Rietveld fitting qualities of the Na0.5Bi0.49−xCaxTiO3−δ ceramics.
xSpace GroupLattice ParametersFitting Qualities
a (Å)b (Å)V (Å3)wRp (%)χ2
0R3c5.490113.5137352.759.832.14
0.02R3c5.490313.4890352.136.151.59
0.04R3c5.495713.4425351.617.611.31
0.06R3c5.493113.4416351.259.011.59
0.08R3c5.490213.4280350.529.782.17
Table 2. Oxygen deficiency, oxygen vacancy concentration, and average structural parameters of Na0.5Bi0.49−xCaxTiO3−δ (0 ≤ x ≤ 0.08) ceramics.
xδ [ V O ˙ ˙ ] (%) tVsfrC (Å)
00.0150.50.97920.19490.9071
0.020.0250.830.97890.19690.9074
0.040.0351.170.97850.19880.9076
0.060.0451.50.97810.20080.9079
0.080.0551.830.97780.20270.9082
Publisher’s Note: MDPI stays neutral with regard to jurisdictional claims in published maps and institutional affiliations.

