Article

The Electrochemical Performance of Al-Mg-Ga-Sn-xBi Alloy Used as the Anodic Material for Al-Air Battery in KOH Electrolytes

Key Laboratory of Electromagnetic Processing of Materials, Ministry of Education, Northeastern University, Shenyang 110819, China
*
Author to whom correspondence should be addressed.
Crystals 2022, 12(12), 1785; https://doi.org/10.3390/cryst12121785
Submission received: 15 November 2022 / Revised: 28 November 2022 / Accepted: 5 December 2022 / Published: 8 December 2022
(This article belongs to the Special Issue Advances of Aluminum Alloys: Innovation and Application Potential)

Abstract

:
The effects of Bi content (0–0.12 wt.%) on the self-corrosion properties, the open-circuit potential, the electrochemical impedance spectroscopy, the potentiodynamic polarization curves, and the battery performances of Al-0.4Mg-0.05Sn-0.015Ga alloys were investigated; meanwhile, the microstructures and the post-discharge surfaces of the alloy were also examined by SEM. The results show that Bi can increase the amount of the precipitated phase containing Bi. The Al-0.4Mg-0.05Sn-0.015Ga-0.10Bi alloy exhibits the optimum electrochemical properties; it has the greatest negative open circuit potential of −1.780 V, the highest constant current discharge voltage of 1.287 V, and a minimum self-corrosion rate of 0.132 mL cm−2 min−1; a uniform corrosive surface is obtained after discharge.

1. Introduction

With the continuous depletion of fossil energy, clean energy has become a relevant topic. Metal-air batteries [1,2,3,4,5,6,7] have attracted widespread attention because of their green, clean, and environmentally friendly nature. Among the various types of metal-air batteries, aluminum is a good candidate for their development due to its high capacity, high energy density [8,9,10], high abundance, and high sustainability. Aluminum has a theoretical energy density of 8.1 Wh/g, second only to lithium (13.0 Wh/g). Due to the high potential of these properties, aluminum-air batteries are considered as a potential energy source for electric vehicles [11]. However, the presence of oxides on the natural aluminum surface makes the practical power density of aluminum anodes much lower than their theoretical values [12,13,14]. Therefore, the aluminum needs to be activated to achieve higher power density. Although oxides can be removed in alkaline electrolytes, aluminum reacts with the electrolyte to form hydrogen:
Al + 4 OH = Al OH + 3 e
2 H 2 O + 2 e = H 2 + 2 OH
This parasitic corrosion or self-discharge reaction reduces the efficiency of the anode, which must be suppressed to minimize capacity loss. In recent years, some alloying elements, such as Mg, Zn, In, Pb, Sn, Ga [15,16], etc., have been discovered to destroy the protective oxide film or to have a high hydrogen evolution overpotential for aluminum, thus restraining this parasitic corrosion, as well as the self-discharge reactions. Liang et al. [17] investigated the discharge behavior of the Al-0.05Ga-0.5Sn-0.05Pb-xMg alloy anode, and found that adding 0.05–0.10 wt.% Mg could both inhibit hydrogen evolution and enhance both the corrosion potential and the open circuit potential, while adding more than 0.15 wt.% Mg led to the positive shift of the open circuit potential and the corrosion potential. Hamed et al. [18] studied Al-0.5Mg-0.1Sn-0.03Ga-0.007Pb and Al-0.5Mg-0.1Sn-0.05Ga-0.07Pb alloys and found that the addition of lead and gallium alloying elements to aluminum resulted in significant activation of aluminum. Ma et al. [19] reported that the addition of Zn elements to Al-1Mg-0.1Sn-01Ga can effectively improve the electrochemical performance. Therefore, alloying is a useful way to develop environmentally friendly, low-cost anodes with high discharge activity and high anode efficiency.
In recent years, the addition of Bi elements to the anode material of aluminum air batteries has attracted a great deal of attention. Bi elements have a higher hydrogen evolution overpotential and can inhibit the hydrogen evolution reaction. The electrode potential of the precipitated phase formed by the Bi element is more positive than that of aluminum, and it will act as the cathode phase to promote the dissolution of the aluminum substrate, so as to destroy the oxide film and increase the discharge voltage of the aluminum air battery. However, the excess of the Bi element will produce a deviated phase at the grain boundaries, leading to micro-electro-couple corrosion of the aluminum anode during the discharge process and an accelerated hydrogen evolution rate. Guo et al. [20] found that the current efficiency of Al-Zn-In-Ti-Bi increased from 65% to 71% with the addition of Bi (0.05–0.10 wt.%). Qian et al. [21] explored the effect of Bi (1–2 wt.%) on the electrochemical and battery performances of Al-3Zn-0.015Ga-0.025In, and found that Bi created a more negative value regarding the open circuit potential, but reduced the current efficiency. However, few works were focused on the relationship between the microstructure and the electrochemical properties of the aluminum anode with a Bi addition.
In the present work, the effects of the addition of (0–0.12 wt.%) Bi on the electrochemical performance and the self-corrosion behavior of Al-0.4 wt.% Mg-0.015 wt.% Ga-0.05 wt.% Sn alloy at 45 °C in 6 M KOH solution were studied using the open circuit potential-time curve, potentiodynamic polarization curve, electrochemical impedance spectroscopy (EIS), and the performance of the battery at a constant discharge current density of 100 mA/cm2. The surface states after the electrochemical tests of the alloys were analyzed by scanning electron microscopy (SEM) equipped with an energy dispersive analytical X-ray (EDAX).

2. Experiment

2.1. Sample Preparation

The anode materials used in this experiment were all aluminum alloys, Al-0.4Mg-0.05 Sn-0.015Ga-xBi (x = 0, 0.08, 0.1, 0.12), and were produced with the raw materials of high purity aluminum ingot (>99.99 wt.%, Baotou Aluminum Co., Ltd., Baotou, China), Mg rod (>99.9 wt.%), Sn particle (>99.9 wt.%), Ga particle (>99.9 wt.%), and Bi particle (>99.9 wt.%). The alloys were melted in an intermediate frequency induction furnace at 720 °C and poured into a water-cooled copper mold of 200 × 100 × 60 mm3 in size. Samples were also obtained at the top, middle, and bottom positions of the resulting ingots, and the chemical composition of the alloys was examined by an inductively coupled plasma analyzer. As shown in Table 1, the compositions of the ingots were homogeneous at the top, middle, and bottom positions. Then the ingots were homogenized at 540 °C for 2 h, followed by quenching in water at room temperature, descaling, and finally rolling to 3 mm in thickness, with a reduction of 95%.
Samples for corrosion testing and electrochemical performance measurements were sealed with epoxy resin to leave a bare area of 1 cm2 exposed to the test solution, and a surface area of 4 cm2 of the aluminum anode was used for discharge testing. All samples were ground with abrasive papers from 200# to 2000#, washed in deionized water, then rinsed with ethanol and flow dried. Each test was performed three times.

2.2. Microstructural Observations

In order to study the effect of the morphology of constituent phases containing Sn, Ga, and Bi on the electrochemical properties of the test aluminum anode, the dimension, quantities distribution, and the composition of these constituent phases were analyzed using a TESCAN MIRA3 XMU FEG-SEM equipped with an 80 mm2 silicon-drift detector (SDD) and INCA 250 EDX automated detection and analysis software (Oxford Instruments). Samples for microstructural observation were wet ground by abrasive papers from 200# to 5000# and polished with 1 μm and 0.5 μm diamond pasters. The surface morphologies after discharge tested at 100 mA/cm2 for 3.5 h in 6 M KOH at 45 °C were observed on a Joel SSX550 type scanning electron microscope equipped with a DX-4EDAX type Energy Dispersive X-ray analyzer. Corrosion products were cleaned using a solution of 2% CrO3 and 5% H3PO4 at 80 °C for about 5 min, and then rinsed with distilled water and ethanol.

2.3. Hydrogen Evolution Test

The effect of element Bi on the self-corrosion rate of the Al-Mg-Sn-Ga-xBi alloy was evaluated by the measurement of the hydrogen evolution rate. The device for the hydrogen evolution test consisted of a square trough, a conical flask, a volumetric cylinder, a gas-guide tube, and a constant temperature water bath. The test sample was placed into the conical flask filled with 400 mL of 6 M KOH solution, and a volumetric cylinder full of distilled water, connecting the conical flask with a gas-guide tube, was placed vertically in the square groove. Hydrogen gas, which was generated by the alkaline corrosion of the aluminum anode, was collected via the drainage method and recorded at different immersion times at 45 ± 1 °C. Then, a linear curve between the volume of hydrogen gas and the immersion time was produced. The corrosion rate was acquired by calculating the slope of the linear curve using the following formula [22]:
R = V H 2 A × t
where R represents the hydrogen evolution rate (in mL/cm2 min), V H 2 represents the volume of the collected hydrogen gas (in mL), A represents the surface area of the test sample (in cm2), and t represents the immersion time (in min), respectively.

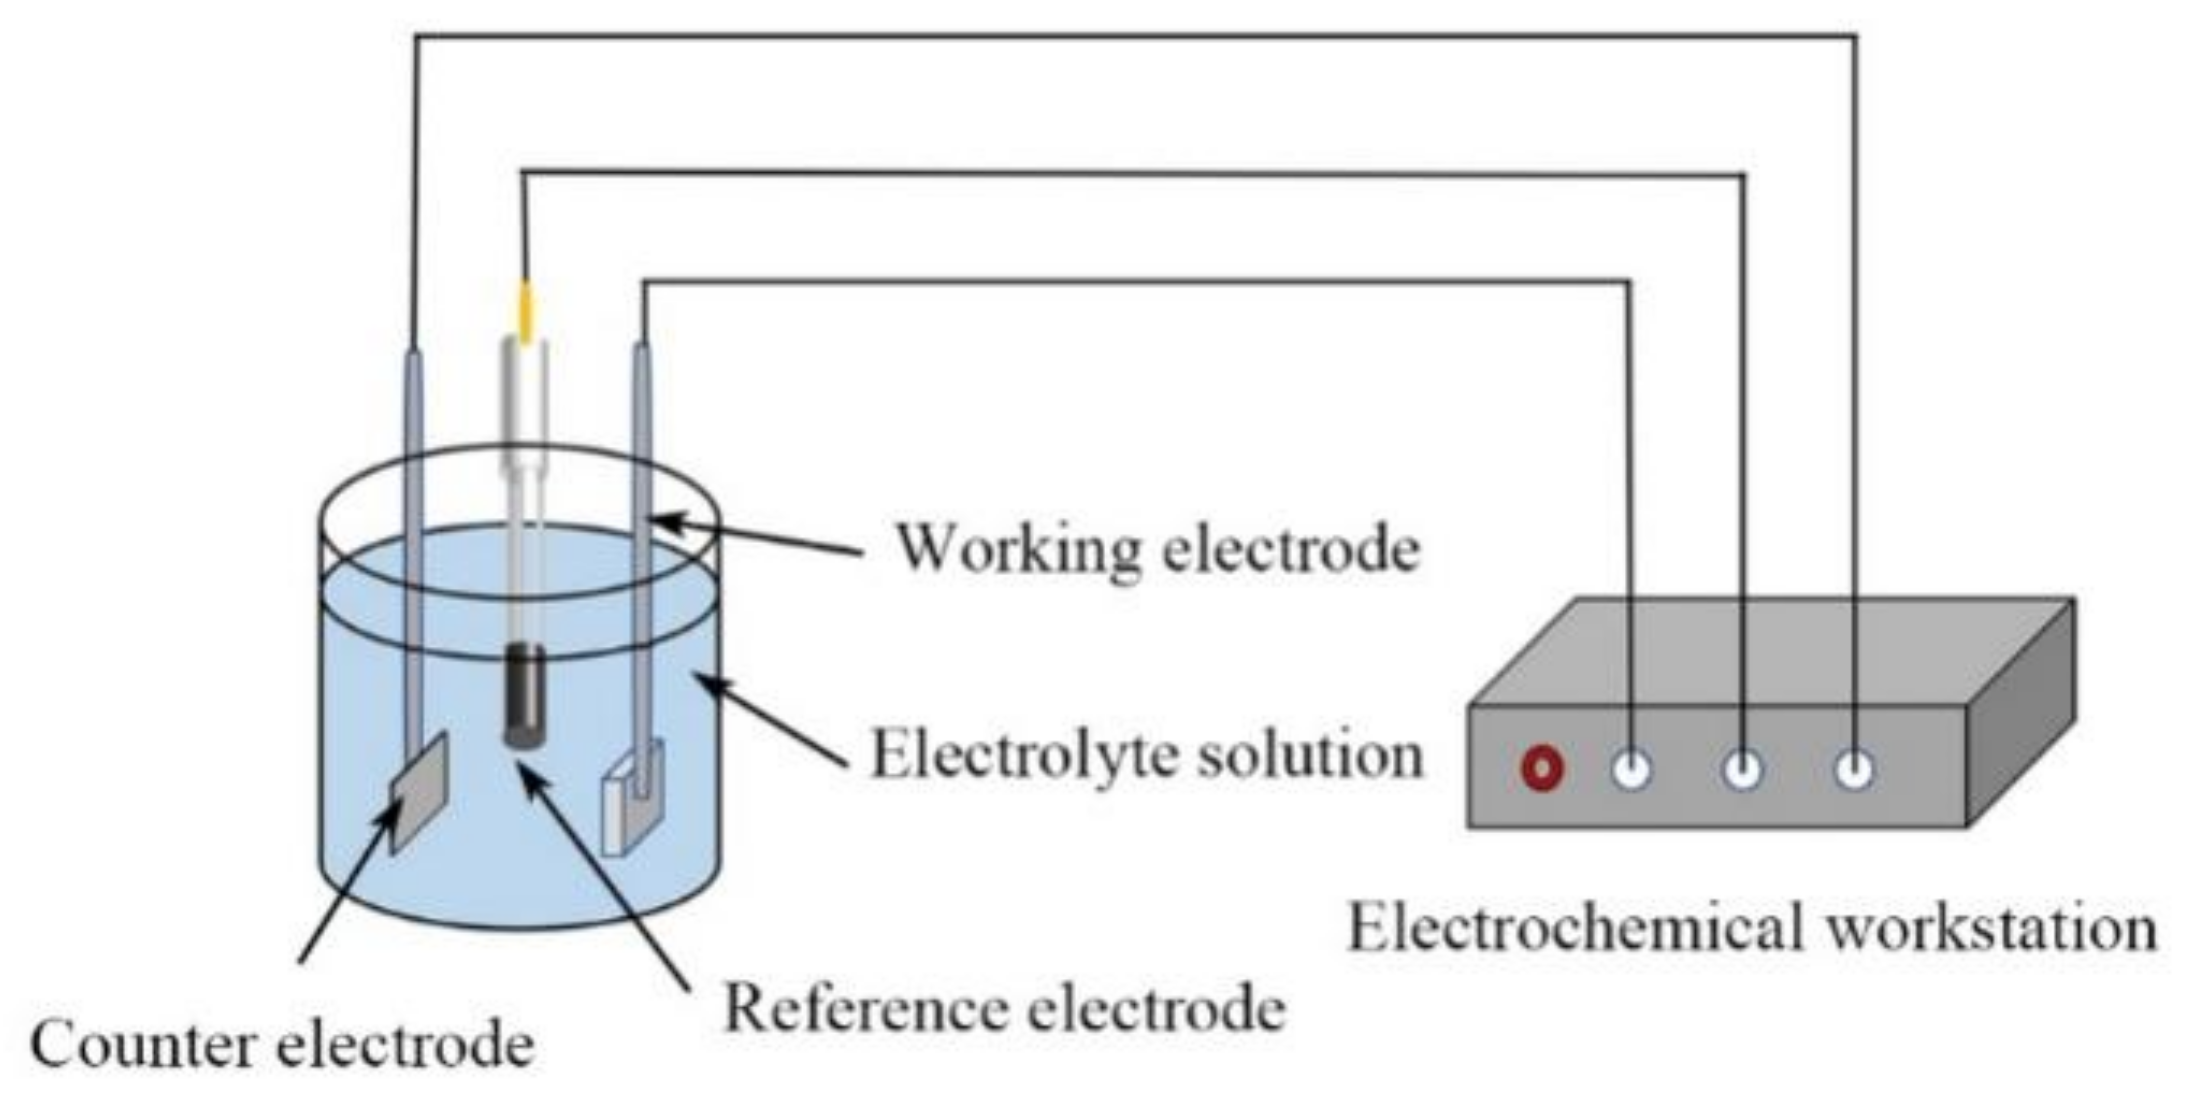
2.4. Electrochemical Measurements

The electrochemical tests were carried out using a CHI660E electrochemical workstation with a conventional three-electrode test system (Figure 1). A commercially available Hg/HgO (1 M KOH) electrode as the reference electrode (RE), a 20 × 20 mm2 commercially available platinum foil as the counter electrode (CE), an aluminum specimen as the working electrode (WE), and 6 M KOH as the electrolyte solution were used. The open circuit potential (OCP) of the aluminum anode was measured continuously for 3600 s. The open circuit potential was stabilized, and then the kinetic potential polarization scan was performed, with a scan rate of 1 mv/S and a voltage scan range of ±0.5 vs. the open circuit potential (OCP). The electrochemical impedance spectroscopy (EIS) perturbation amplitude was 5 mV, the frequency was set to 100 kHz~0.1 Hz, and the EIS results were fitted using ZSimpWin software (AMETEK SI, Berwyn, PA, USA).

2.5. Battery Performance Tests

The aluminum air battery consisted of an anode, an air cathode, and an electrolyte, as shown in Figure 2. The anodes sheets, with a thickness of 3 mm, were Al-Mg-Sn-Ga-xBi alloy with different Bi contents. A commercial gas diffusion electrode using graphene/MnO2 as the oxygen reduction reaction catalyst was adopted as the cathode. The anode was a 3 mm thick aluminum plate. The electrolyte was 6 M KOH solution. The 4 × 4 cm2 size electrodes were located at a distance of 1 cm. The discharge experiments were tested using the LAND-CT3001H system. Discharge at 45 °C for 210 min at 100 mA/cm−2 current density was used to simulate the conditions of short time multiple batteries working together to study the effect of Bi content on the discharge performance. The anode weight was measured before and after discharge process to determine the anode utilization rate, according to the following formula:
η = 100 × W W 0
where η represents the anode utilization rate, and W and W0 represent the theoretical and actual mass loss, respectively. W is related to the actual current capacity Q and the theoretical current capacity Q0, using Equation (5) [23]:
W = Q Q 0
In the present work, Q = 1.60 A × 3.5 h = 5.6 Ah, Q0 = 2980 Ah/kg. In addition, energy density E can be obtained by Equation (6) [24]:
E = U × I × t W 0
where U represents the average operating voltage (in V), I represents the discharge current density (in mA/cm2), t represents the discharge time (in h), and W0 is the actual mass loss (in g), respectively.

3. Results and Discussion

3.1. Microstructure

The microstructures of Al-Mg-Sn-Ga-xBi alloys after solid solution treatment were observed by field emission scanning electron microscopy (SEM, TESCAN MIRA3). The backscattered electron image of the test alloy is shown in Figure 3. Apparently, the microstructure of the alloy consists of a gray a-Al matrix and a white deviatoric phase. With the increase in the Bi element, the number of white precipitates increased significantly, and the shape changed from irregular spheres and short stripes to spherical precipitates. The distribution of the isolated phase in the a-Al matrix is shown in Figure 3. According to previous studies, low melting point elements, such as Bi, Zn, and Sn, tend to form biased cationic processes at grain boundaries in solid solutions [25].
Figure 4 shows SEM images of the precipitated phases in the Al-Mg-Sn-Ga-xBi alloy. The chemical compositions obtained by EDS analysis for points 1–8 are listed in Table 2. The results show that the white precipitates created by the Al-Mg-Sn-Ga-xBi alloy are mainly Bi-rich and Sn-rich phases, due to the low solid solution of Bi and Sn in aluminum. For two of the points, the content of Sn (wt.%) was 51.36, respectively, but the other composition points indicated that the precipitated phase was essentially free of Sn. The reason for this is that elemental Bi can expand the lattice of aluminum alloys and increase the solid solubility of Sn in the aluminum matrix [26]. Comparing the EDS results for the five composition points 3, 4, 6, 7, and 8, it was found that the Mg content in the precipitated phase increased with the increase in Bi content. These results may be because the addition of Bi to the alloy inhibits the dissolution of Mg, thus giving Mg more opportunity to combine with Bi and thus form more white precipitated phases. The EDS results corresponding to the five component points 4–8, labeled in Table 1, indicate that the atomic number percentage ratio of Mg and Bi is about 2:3, and it is assumed that the precipitated phase may contain Mg2Bi3 phase.

3.2. Self-Corrosion

The self-corrosion rates of Al-Mg-Sn-Ga-xBi alloys were decided by hydrogen evolution rates, which were tested in 6 M KOH solution for 1.5 h. Figure 5 presents the hydrogen evolution rates of the Al-Mg-Sn-Ga-xBi alloys. It can be seen that the volume of hydrogen evolution is linearly related to time. The rate of hydrogen evolution in the alloy without the addition of Bi is fast, at 0.796 mL cm−2 min−1. Increasing the Bi content to 0.10 wt.%, the rate of hydrogen evolution in the alloy gradually decreases to a minimum of 0.407 mL cm−2 min−1, which indicates that the addition of Bi is beneficial to reduce the hydrogen evolution rate of the alloy. This is mainly because the hydrogen evolution potential of the Al-Mg-Sn-Ga-xBi alloy increases in the presence of the Bi element, which makes the hydrogen evolution overpotential of Al-Mg-Ga-Sn-xBi alloy increase and causes the hydrogen evolution rate of the alloy to decrease [27]. The hydrogen evolution rate of the Al-Mg-Ga-Sn-0.12Bi alloy was accelerated by increasing the content of Bi in the alloy, and it reached 0.938 mL cm−2 min−1. This is due to the fact that the number of precipitated phases increases significantly when excess Bi elements are added to the alloy. These Bi-rich phases form corrosion microcells with the aluminum matrix. Since the standard electrode potential of Bi elements is −0.46 V, which is more positive than that of Al (−2.35 V), the Bi-rich phases act as cathodic hydrogen evolution sites and accelerate the dissolution rate of the surrounding aluminum alloy.

3.3. Open Circuit Potential (OCP)

Figure 6 exhibits the open circuit potential–time curves of different alloys in 6 M KOH solution. The OCP represents the steady-state self-corrosion potential of the alloys, without the external current. It can be seen from Figure 6 that the potential of the alloys changes very significantly as the reaction time increases. The OCP of the Al-Mg-Sn-Ga-xBi alloys shows of negative shifting trend, followed by a rapid positive shift, and then stabilization. This trend demonstrates that the Al-Mg-Sn-Ga-xBi alloy rapidly and violently corrodes when placed in a 6 M KOH solution, shifting the OCP towards a more negative result. A large number of corrosion products are generated on the surface because the generation rate of the corrosion products is greater than their decomposition rate, so the OCP of the Al-Mg-Sn-Ga-xBi alloy shifts, becoming rapidly positive. The corrosion product layer of Al-Mg-Sn-Ga-xBi becomes so loose and porous that it cannot prevent further corrosion as the corrosion time increases, so the OCP is no longer positively shifted. With the corrosion process continuing, the rate of corrosion products generated and the dissolution reach a dynamic equilibrium, gradually stabilizing the OCP of the Al-Mg-Sn-Ga-xBi at a certain value.
It can be seen from the Figure 6 that the OCP of Al-Mg-Sn-Ga can only reach −1.70 V. The OCP is negatively shifted, to different degrees, with the adding of the element of Bi. Among them, the Al-Mg-Sn-Ga-0.10Bi alloy has the most negative OCP of −1.79 V, compared with Al-Mg-Sn-Ga, which shifted 90 mV towards the negative. Generally speaking, the OCP is closely related to the activity of the alloys, and Bi can accelerate the dissolution of aluminum substrates through microelectric effects because it induces bias precipitation with a more positive standard potential compared to that of aluminum substrates [28]. Therefore, the isolated phase acts as the cathode position in the electrical microcell. Bi elements can play a vital activation role in the alloy.

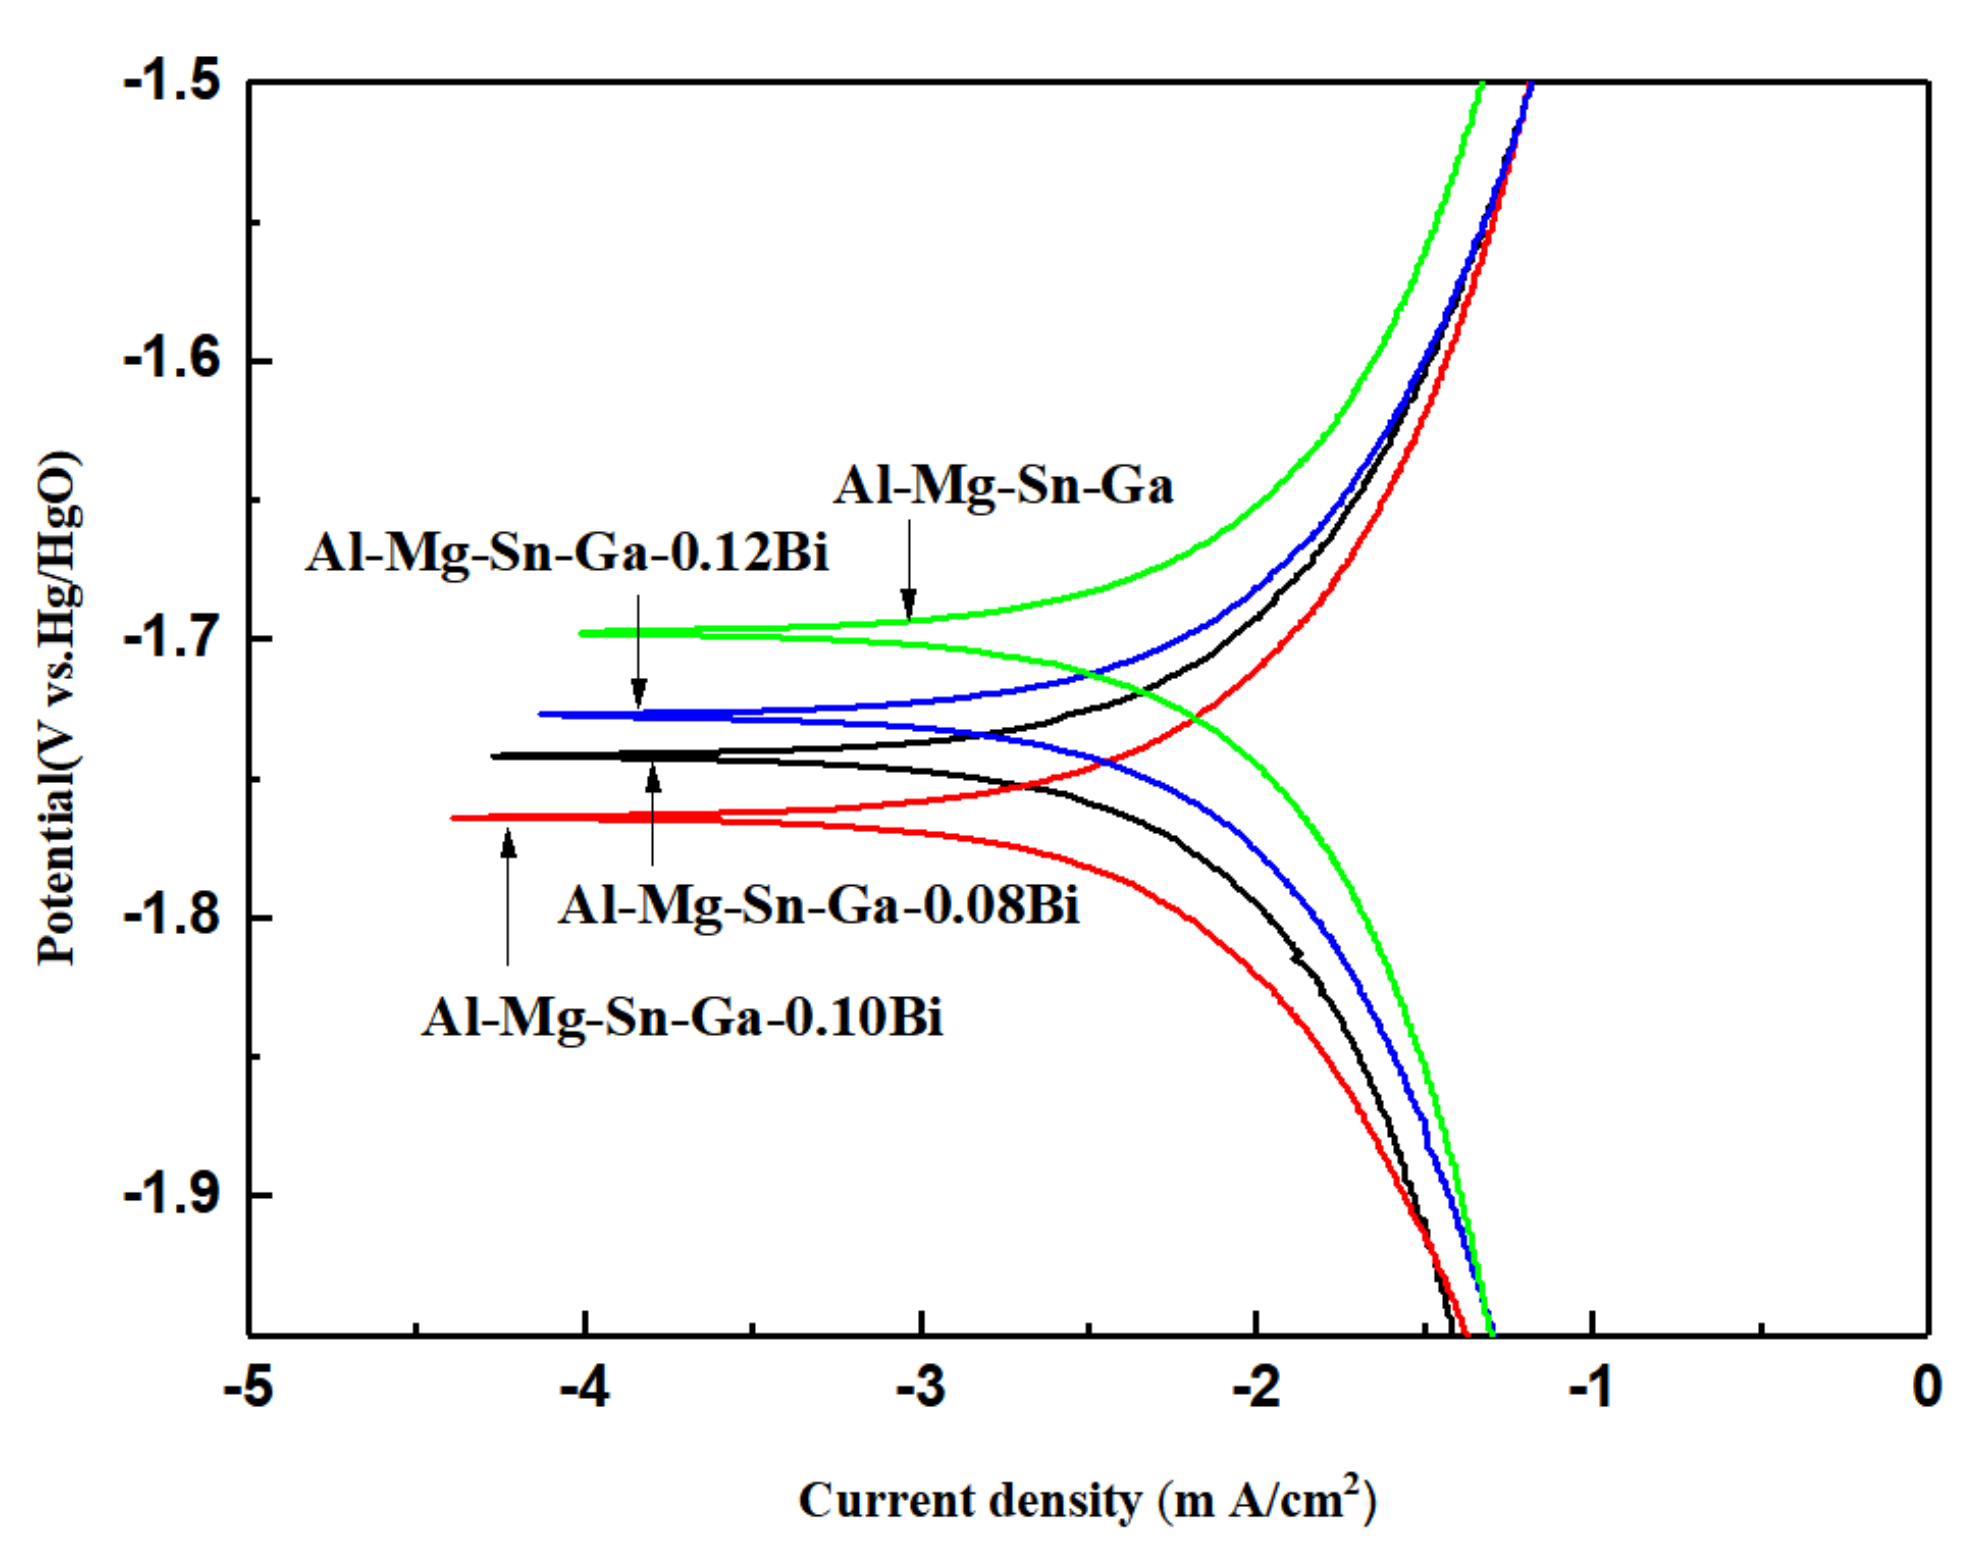
3.4. Potentiodynamic Polarization (Tafel)

The potentiodynamic polarization test was a valid way to analyze the discharge behaviors of Al anodes [29]. The polarization curves of Al-Mg-Sn-Ga-xBi with different composition were tested in 6 M KOH solution, and the results are shown in Figure 7. The curve can be divided into a cathodic region, related to hydrogen evolution, and an anodic region, related to electrochemical activity [30]. Table 3 reflects the corresponding values of corrosion parameters, i.e., corrosion potential (Ecorr), corrosion current density (Jcorr), and polarization resistance (Rp), obtained by the Tafel extrapolation method. It is clear that these samples show significant variations in corrosion potential, corrosion current, and polarization resistance. The self-corrosion rates of the alloys satisfy the following laws: Al-Mg-Sn-Ga-0.1Bi < Al-Mg-Sn-Ga-0.08Bi < Al-Mg-Sn-Ga-0.12Bi < Al-Mg-Sn-Ga. The more negative Ecorr values of the alloys indicate that the alloys were more electrochemically active, which means that Al-Mg-Sn-Ga has the lowest electrochemical activity. the results also showed that adding 0–0.10 wt.% Bi could raise the electrochemical activity of Al-Mg-Sn-Ga alloys. The element of Bi could shift the corrosion potential more negatively by the dissolution-deposition mechanism, Namely, the element with a low melting point and the aluminum matrix could form a solid solution. The solid solution could dissolve in the electrolyte solution, along with the aluminum matrix, and generate the corresponding cations. The element of Bi could be plated out by aluminum and deposited back onto the surface of the Al alloy anode. This plating process partially separates the oxide layer from the aluminum anode surface, thus driving the aluminum anode potential in the negative direction and activating the aluminum anode.
The polarization curve can also be used to assess the corrosion rate, due to the fact that the cathodic polarization is associated with the evolution of hydrogen [31]. We could draw conclusions that the results of the potentiodynamic polarization test were in agreement with the results of the hydrogen evolution examination. The corrosion behaviors of Al-Mg-Sn-Ga-xBi were reflected by the corrosion current density and polarization resistance. According to Table 3, corrosion current density decreases significantly and polarization resistance increased dramatically when the Bi content is increased from 0 wt.% to 0.1 wt.%. These results implied that the addition of Bi is beneficial in decreasing the self-corrosion rate. By continuing to add Bi elements, the corrosion current density and the polarization resistance of Al-Mg-Sn-Ga-0.12Bi could reach maximum and minimum values, respectively, which can noted, since the rate of hydrogen evolution was increased after adding 0.12 wt.% Bi.

3.5. Electrochemical Impedance Spectroscopy

The electrochemical impedance spectroscopy (EIS) of Al-Mg-Sn-Ga-xBi alloys at the open circuit potential in 6 M KOH at 45 °C were investigated. The EIS plots were structured in the form of Nyquist plots, as shown in Figure 8. The EIS plots of the Al-Mg-Sn-Ga-xBi exhibited two capacitive loops at high and low frequencies, respectively, along with an inductive loop at high frequencies. The capacitive loop at a high-frequency was related to the process of charge transfer, owing to the dissolution of aluminum [32]. The equivalent component contains the charge transfer resistance and a double-layer capacitance parallel to it [33]. The low-frequency capacitive loop was due to the dissolution of the hydroxide film on the aluminum surface, while the high-frequency inductive loop was attributed to the adsorption of hydrogen evolution reaction [34]. The radius of the high-frequency capacitive loop of the Al-Mg-Sn-Ga-xBi was larger than that of the Al-Mg-Sn-Ga. It could be concluded that the performances regarding the corrosion behavior of the Al-Mg-Sn-Ga-xBi were determined by the process of the charge transfer.
The equivalent circuit diagram of the EIS plots of the Al-Mg-Sn-Ga-xBi alloys are displayed in Figure 8. In order to improve the accuracy of the fitted parameter values, a constant phase element (CPE) was used to replace the capacitive element (C) in the equivalent circuit diagram [35,36]. According to Figure 8, L represents the capacitance during the hydrogen evolution reaction, while, Rs was the solution resistance of the alloys. Rt was placed in parallel with a double layer capacitance, CPE1. R2 and CPE2 were the parameters which were related to the hydroxide film.
The fitting values of the impedance parameters are listed in Table 4. The x2 value reflected the closeness of the fitted data to the experiment. The x2 value of Table 4 was in the range of 10−4, which indicated that the fitting equivalent circuits are fairly close to those in the experimental system. Rt was a significant parameter that could reflect the electrochemical corrosion process, and the larger the Rt, the smaller the corrosion rate. The Rt values of the Al-Mg-Sn-Ga-xBi alloys in 6 M KOH decreased in the following order: Al-Mg-Sn-Ga-0.12Bi < Al-Mg-Sn-Ga < Al-Mg-Sn-Ga-0.08Bi < Al-Mg-Sn-Ga-0.10Bi. It is obvious that Al-Mg-Sn-Ga was more prone to electrochemical corrosion. The corrosion resistance of Al-Mg-Sn-Ga-Bi could be improved substantially, which was ascribed to the presence of the Bi element. This was agreement with the potentiodynamic polarization and hydrogen evolution.

3.6. Discharge Performance Test

The discharge of constant current and continuous constant current were investigated to reflect the discharge behaviors of the Al-Mg-Sn-Ga-xBi alloys. Figure 9 shows the discharge behavior of the Al-Mg-Sn-Ga-xBi in a 6 M KOH solution with a current density of 100 mA/cm2. At the early stage of discharge, due to the adhesion of discharge products on the anode surface, the surface of the aluminum anode involved in the discharge reaction is reduced, resulting in a low discharge voltage. With the generation and shedding of discharge products reaching dynamic equilibrium, the discharge voltage of the alloy tends to stabilize with water wave type fluctuations. The parameters related to the discharge performances in the 6 M KOH solution are listed in Table 5. As shown in Table 5, the working potential, capacity density, anode utilization, energy density, and fuel utilization of Al-Mg-Sn-Ga-0.08Bi and Al-Mg-Sn-Ga-0.10Bi alloys were increased compared to those of Al-Mg-Sn-Ga, and the Al-Mg-Sn-Ga-0.10Bi reached the highest value, indicating that the addition of 0 to 0.10 Bi element can significantly improve the discharge performances. This is because Bi is a high hydrogen evolution overpotential element, which could reduce the self-corrosion rate by increasing corrosion potential. Meanwhile, the discharge voltage increased with the effect of the Bi element by destroying the oxide film on the surface of the alloys, which were originated from the dissolution-deposition mechanism. Continuing to add Bi elements, the working potential of Al-Mg-Sn-Ga-0.12Bi was only slightly higher than that of Al-Mg-Sn-Ga, but the capacity density, energy density, anode utilization, and fuel utilization are the lowest among the four alloys, mainly because it has the highest self-corrosion rate. It was noticed that excess Bi elements can cause severe self-corrosion, which has been proved by previous potentiodynamic polarization tests.
Figure 10 shows the output voltage and power density of the four alloys with different components at different current densities. As can be seen from the graph, with the increase in current density, the power density of the alloys first increases to a peak, and then gradually decreases, along with the reduction in operating voltage. The power density and output voltage of Al-Mg-Sn-Ga-0.10Bi are higher than those of the other alloys at any current density. The peak power density of Al-Mg-Sn-Ga-0.10Bi was the highest. Compared with the other three alloys, the peak power density of Al-Mg-Sn-Ga-0.10Bi was 166.3 mW/kg at a power density of 190 mA/cm2, which was slightly higher than that for Al-Mg-Sn-Ga-0.08Bi (155.76 mW/kg) and Al-Mg-Sn-Ga-0.12Bi (134.82 mW/kg), and much higher than that for Al-Mg-Sn-Ga (149.6 mW/kg). In general, Al-Mg-Sn-Ga-0.10Bi exhibited the best battery activity.

3.7. Corrosion Surface Morphology

Figure 11 shows the surface corrosion morphology of the aluminum anodes after discharge for 3.5 h at a current density of 100 mA/cm2 in 6 M KOH electrolyte. According to Figure 11a–h, there are many round corrosion pits and grooves on the anode surface, and the degree of corrosion on the different anodes is different. Al-Mg-Sn-Ga-0.10Bi, with more and smaller corrosion pits, shows the most uniform corrosion, while Al-Mg-Sn-Ga-0.08Bi has a more uniform corrosion profile than Al-Mg-Sn-Ga. It can be seen that the addition of the appropriate amount of Bi elements in the alloys is conducive to improving the corrosion uniformity of the alloys. Combined with the EDS analysis results of the composition points in Table 5, it is speculated that the corrosion pits are mainly caused by the corrosion of the Sn-rich and Bi-rich phases of the alloys. The potential of Sn-rich, Bi-rich precipitation phases and the Al matrix has a large gap, and they may form a corrosion microcell with the Al matrix to accelerate the corrosion of the Al matrix around the precipitated phases. This eventually causes the precipitated phases to fall from the Al matrix after pitting range expansion, forming large corrosion pits. From Figure 11g,h, it can be seen that there are many small corrosion pits in the large corrosion pits on the surface of Al-Mg-Sn-Ga-0.12Bi, showing a “small pits inside large pits” corrosion morphology, which indicates that with the addition of excessive Bi elements, the corrosion uniformity of the anode alloy becomes poor. It may be that after adding more Bi elements to the alloys, the interval of the Bi-rich precipitated phase is small because of the extensive precipitated phases. Large corrosion pits of the alloys will be formed after the precipitated phases fall, so the precipitated phases at the bottom of the corrosion pits come into contact with the strongly alkaline solutions, and the precipitated phase at the bottom continues to corrode off, eventually presenting this corrosion morphology.

4. Conclusions

The electrochemical properties of the Al-Mg-Sn-Ga-xBi alloy were investigated by hydrogen evolution experiments and electrochemical performance experiments. The experimental results show that Al-Mg-Sn-Ga-0.1Bi has the best corrosion resistance, and the addition of the Bi element increases the hydrogen evolution overpotential of the anodic alloy, so the hydrogen evolution reaction of the alloy is inhibited. At the same time, the addition of Bi increases the solid solution of Sn in the aluminum matrix and inhibits the precipitation of Mg.
In the simulation of multiple cells for a short period of time at the operating temperature and at 100 mA/cm−2 current density, the appropriate amount of Bi element addition can promote the dynamic balance between the rate of corrosion product generation and the shedding rate of the alloy. Meanwhile, the Bi element increases the anode alloy activity because of its dissolution-redeposition principle. Compared with other alloys, the voltage gradually decreased with increasing current density, while Al-Mg-Sn-Ga-0.1Bi exhibited the highest power density and anode utilization rate of 166.3 mW/kg and 85.03%, respectively, while Al-Mg-Sn-Ga-0.1Bi also showed the highest average output voltage of 1.29 V.

Author Contributions

Y.W.: Writing—original draft, Writing—review & editing, Methodology. H.L.: Formal analysis, Project administration. Z.J.: Methodology, Resources. B.Y.: Methodology, Project administration. L.H.: Resources, Project administration, Funding acquisition. All authors have read and agreed to the published version of the manuscript.

Funding

This research received no external funding.

Conflicts of Interest

The authors declare no conflict of interest.

References

  1. Paster, M.; Ahluwalia, R.; Berry, G.; Elgowainy, A.; Lasher, S.; McKenney, K.; Gardiner, M. Hydrogen storage technology options for fuel cell vehicles: Well-to-wheel costs, energy efficiencies, and greenhouse gas emissions. Fuel Energy Abstr. 2011, 36, 14534–14551. [Google Scholar] [CrossRef]
  2. Yuan, J.L.; Wang, J.; She, Y.Y.; Hu, J.; Tao, P.P.; Lv, F.C.; Lu, Z.G.; Gu, Y.Y. BiOCl micro-assembles consisting of ultrafine nanoplates: A high performance electro-catalyst for air electrode of Al–air batteries. J. Power Source 2014, 263, 37–45. [Google Scholar] [CrossRef]
  3. Yang, T.-H.; Venkatesan, S.; Lien, C.-H.; Chang, J.-L.; Zen, J.-M. Nafion/lead oxide–manganese oxide combined catalyst for use as a highly efficient alkaline air electrode in zinc–air battery. Electrochim. Acta 2011, 56, 6205–6210. [Google Scholar] [CrossRef]
  4. Deyab, M. Effect of nonionic surfactant as an electrolyte additive on the performance of aluminum-air battery. J. Power Source 2019, 412, 520–526. [Google Scholar] [CrossRef]
  5. Khan, Z.; Vagin, M.; Crispin, X. Can Hybrid Na–Air Batteries Outperform Nonaqueous Na–O2 Batteries? Adv. Sci. 2020, 7, 1902866. [Google Scholar] [CrossRef] [Green Version]
  6. Salado, M.; Lizundia, E. Advances, challenges, and environmental impacts in metal–air battery electrolytes. Mater. Today Energy 2022, 28, 101064. [Google Scholar] [CrossRef]
  7. Baek, M.-J.; Choi, J.; Wi, T.-U.; Lim, H.Y.; Myung, M.H.; Lim, C.; Sung, J.; Park, J.-S.; Park, J.H.; Shim, Y.H.; et al. Strong interfacial energetics between catalysts and current collectors in aqueous sodium–air batteries. J. Mater. Chem. A 2022, 10, 4601–4610. [Google Scholar] [CrossRef]
  8. Mori, R. Addition of Ceramic Barriers to Aluminum–Air Batteries to Suppress By-product Formation on Electrodes. J. Electrochem. Soc. 2015, 162, A288–A294. [Google Scholar] [CrossRef]
  9. Hoque, M.; Hannan, M.; Mohamed, A.; Ayob, A. Battery charge equalization controller in electric vehicle applications: A review. Renew. Sustain. Energy Rev. 2017, 75, 1363–1385. [Google Scholar] [CrossRef]
  10. Wu, G.; Lin, S.; Yang, C. Alkaline Zn-air and Al-air cells based on novel solid PVA/PAA polymer electrolyte membranes. J. Membr. Sci. 2006, 280, 802–808. [Google Scholar] [CrossRef]
  11. Gudić, S.; Radošević, J.; Smoljko, I.; Kliškić, M. Cathodic breakdown of anodic oxide film on Al and Al–Sn alloys in NaCl solution. Electrochim. Acta 2005, 50, 5624–5632. [Google Scholar] [CrossRef]
  12. Elia, G.A.; Marquardt, K.; Hoeppner, K.; Fantini, S.; Lin, R.; Knipping, E.; Peters, W.; Drillet, J.-F.; Passerini, S.; Hahn, R. An Overview and Future Perspectives of Aluminum Batteries. Adv. Mater. 2016, 28, 7564–7579. [Google Scholar] [CrossRef]
  13. Gelman, D.; Lasman, I.; Elfimchev, S.; Starosvetsky, D.; Ein-Eli, Y. Aluminum corrosion mitigation in alkaline electrolytes containing hybrid inorganic/organic inhibitor system for power sources applications. J. Power Source 2015, 285, 100–108. [Google Scholar] [CrossRef]
  14. Ma, J.L.; Wen, J.B.; Zhu, H.X.; Li, Q.N. Electrochemical performances of Al-0.5Mg-0.1Sn-0.02In alloy in different solutions for Al-air battery. J. Power Source 2015, 293, 592–598. [Google Scholar]
  15. Xiong, W.; Qi, G.; Guo, X.; Lu, Z. Anodic dissolution of Al sacrificial anodes in NaCl solution containing Ce. Corros. Sci. 2011, 53, 1298–1303. [Google Scholar] [CrossRef]
  16. Elango, A.; Periasamy, V.M.; Paramasivam, M. Study on polyaniline-ZnO used as corrosion inhibitors of 57S aluminium in 2 M NaOH solution. Anti-Corros. Methods Mater. 2009, 56, 266–270. [Google Scholar] [CrossRef]
  17. Liang, R.; Su, Y.; Sui, X.-L.; Gu, D.-M.; Huang, G.-S.; Wang, Z.-B. Effect of Mg content on discharge behavior of Al-0.05Ga-0.05Sn-0.05Pb-xMg alloy anode for aluminum-air battery. J. Solid State Electrochem. 2018, 23, 53–62. [Google Scholar] [CrossRef]
  18. Moghanni-Bavil-Olyaei, H.; Arjomandi, J.; Hosseini, M. Effects of gallium and lead on the electrochemical behavior of Al-Mg-Sn-Ga-Pb as anode of high rate discharge battery. J. Alloys Compd. 2017, 695, 2637–2644. [Google Scholar] [CrossRef]
  19. Ma, J.; Wen, J.; Gao, J.; Li, Q. Performance of Al–1Mg–1Zn–0.1Ga–0.1Sn as anode for Al-air battery. Electrochim. Acta 2014, 129, 69–75. [Google Scholar] [CrossRef]
  20. Guo, G.Y.; Zhang, J.L.; Sun, K.L.; Hou, B.R. Effects of Bi and Ti on electrochemical property of Al-Zn-In sacrificial anode. J. Chin. J. Oceanol. Limnol. 1991, 9, 44–48. [Google Scholar]
  21. Qian, X.R.; Kong, X.D. The Effects of Pb, Bi on the Anodic Properties of Al-Zn-Ga-In Series Alloy. Mater. Sci. Forum 2016, 852, 65–72. [Google Scholar] [CrossRef]
  22. Jeong, Y.; Kim, W. Enhancement of mechanical properties and corrosion resistance of Mg–Ca alloys through microstructural refinement by indirect extrusion. Corros. Sci. 2014, 82, 392–403. [Google Scholar] [CrossRef]
  23. Li, L.; Liu, H.; Yan, Y.; Zhu, H.; Fang, H.; Luo, X.; Dai, Y.; Yu, K. Effects of alloying elements on the electrochemical behaviors of Al-Mg-Ga-In based anode alloys. Int. J. Hydrogen Energy 2019, 44, 12073–12084. [Google Scholar] [CrossRef]
  24. Ma, J.; Zhang, Y.; Ma, M.; Qin, C.; Ren, F.; Wang, G. Corrosion and discharge performance of a magnesium aluminum eutectic alloy as anode for magnesium–air batteries. Corros. Sci. 2020, 170, 108695. [Google Scholar] [CrossRef]
  25. He, J.-G.; Wen, J.-B.; Li, X.-D.; Wang, G.-W.; Xu, C.-H. Influence of Ga and Bi on electrochemical performance of Al-Zn-Sn sacrificial anodes. Trans. Nonferrous Met. Soc. China 2011, 21, 1580–1586. [Google Scholar] [CrossRef]
  26. Karaminezhaad, M.; Jafari, A.; Sarrafi, A.; Safi, G. Influence of bismuth on electrochemical behavior of sacrificial aluminum anode. Anti-Corros. Methods Mater. 2013, 53, 102–109. [Google Scholar] [CrossRef]
  27. Wang, Q.; Miao, H.; Xue, Y.J.; Sun, S.S.; Li, S.H.; Liu, Z.P. Performances of an Al–0.15 Bi–0.15 Pb–0.035 Ga alloy as an anode for Al–air batteries in neutral and alkaline electrolytes. RSC Adv. 2017, 7, 25838–25847. [Google Scholar] [CrossRef] [Green Version]
  28. Xiong, H.; Yu, K.; Yin, X.; Dai, Y.; Yan, Y.; Zhu, H. Effects of microstructure on the electrochemical discharge behavior of Mg-6wt%Al-1wt%Sn alloy as anode for Mg-air primary battery. J. Alloys Compd. 2016, 708, 652–661. [Google Scholar] [CrossRef]
  29. Baran, E.; Yazici, B. Effect of different nano-structured Ag doped TiO2-NTs fabricated by electrodeposition on the electrocatalytic hydrogen production. Int. J. Hydrogen Energy 2016, 41, 2498–2511. [Google Scholar] [CrossRef]
  30. Wei, M.X.; Gao, S.R.; Liu, H.L.; Wang, X.; Fu, H.P.; He, L.Z. Effect of Sn on the electrochemical properties of Al-Mg-Ga-Sn anode alloys. Mater. Rep. 2021, 35, 311. [Google Scholar]
  31. Reboul, M.C.; Gimenez, P.; Rameau, J.J. A Proposed Activation Mechanism for Al Anodes. Corrosion 1984, 40, 366–371. [Google Scholar] [CrossRef]
  32. Sovizi, M.; Afshari, M. Effect of nano zirconia on electrochemical performance, corrosion behavior and microstructure of Al-Mg-Sn-Ga anode for aluminum batteries. J. Alloys Compd. 2019, 792, 1088–1094. [Google Scholar] [CrossRef]
  33. Ma, J.L.; Wen, J.B.; Gao, J.W.; Li, Q.A. Performance of Al-0.5 Mg-0.02 Ga-0.1 Sn-0.5 Mn as anode for Al-air battery in NaCl solutions. J. Power Source 2014, 253, 419–423. [Google Scholar] [CrossRef]
  34. Gudić, S.; Smoljko, I.; Kliškić, M. The effect of small addition of tin and indium on the corrosion behavior of aluminium in chloride solution. J. Alloys Compd. 2010, 505, 54–63. [Google Scholar] [CrossRef]
  35. Souto, R.; Fernández-Mérida, L.; González, S.; Scantlebury, D. Comparative EIS study of different Zn-based intermediate metallic layers in coil-coated steels. Corros. Sci. 2006, 48, 1182–1192. [Google Scholar] [CrossRef]
  36. Wang, W.; Chen, D.; Yang, K. Investigation on microstructure and hydrogen generation performance of Al-rich alloys. Int. J. Hydrogen Energy 2010, 35, 12011–12019. [Google Scholar] [CrossRef]
Figure 1. Schematic diagram of the electrochemical test system.
Crystals 12 01785 g001
Figure 2. Schematic diagram of the Al-air battery discharge test system.
Crystals 12 01785 g002
Figure 3. Backscattered electron (BSE) images of Al-Mg-Sn-Ga-xBi alloys. (a) Al-Mg-Sn-Ga, (b) Al-Mg-Sn-Ga-0.08Bi, (c) Al-Mg-Sn-Ga-0.10Bi, (d) Al-Mg-Sn-Ga-0.12Bi.
Crystals 12 01785 g003
Figure 4. The SEM images of the precipitated phases of the Al-Mg-Sn-Ga-xBi alloys. (a) x = 0, (b) x = 0.08, (c) x = 0.10, (d) x = 0.12.
Crystals 12 01785 g004
Figure 5. Hydrogen evolution rates of Al-Mg-Sn-Ga-xBi alloys.
Crystals 12 01785 g005
Figure 6. Open circuit voltage curves of Al-Mg-Sn-Ga-xBi alloys.
Crystals 12 01785 g006
Figure 7. Polarization curves of the Al-Mg-Sn-Ga-xBi alloys.
Crystals 12 01785 g007
Figure 8. EIS patterns of the Al-Mg-Sn-Ga-xBi alloys and the equivalent circuit.
Crystals 12 01785 g008
Figure 9. Discharge behavior of Al-air batteries at a current density of 100 mA cm−2.
Crystals 12 01785 g009
Figure 10. I-V discharge curves of Al-air batteries with different Al anodes.
Crystals 12 01785 g010
Figure 11. SEM micrographs of anodes after discharge for 3.5 h at a current density of 100 mA/cm2 (a,b) Al-Mg-Sn-Ga, (c,d) Al-Mg-Sn-Ga-0.08Bi, (e,f) Al-Mg-Sn-Ga-0.10Bi, (g,h) Al-Mg-Sn-Ga-0.12Bi.
Crystals 12 01785 g011
Table 1. Chemical composition of experimental alloys (wt.%).
AlloysMgSnGaBi
Al-0.4Mg-0.15Ga-0.05Sn0.340.0450.0120
Al-0.4Mg-0.15Ga-0.05Sn-0.08Bi0.370.0400.0110.074
Al-0.4Mg-0.15Ga-0.05Sn-0.1Bi0.340.0460.0130.093
Al-0.4Mg-0.15Ga-0.05Sn-0.12Bi0.360.0390.0110.115
Table 2. The EDS analysis results of the precipitated phases of the Al-Mg-Sn-Ga-xBi alloys.
PointAl/Mass %Al/At %Mg/Mass %Mg/At %Sn/Mass %Sn/At %Bi/Mass %Bi/At %Alloy %
199.5699.690.240.260.200.05--x = 0
248.2279.880.420.7851.3619.34--x = 0
362.4692.420.280.46--37.267.12x = 0.08
464.4186.235.808.62--29.795.15x = 0.08
524.4254.0211.2427.61--64.3418.38x = 0.1
632.7863.6210.1321.821.310.5855.7913.98x = 0.1
722.5751.5611.4328.97--66.0019.46x = 0.12
816.8741.2213.5936.84--69.5421.94x = 0.12
Table 3. Corrosion parameters of the alloys derived from polarization curves.
AlloyOCP (V vs. Hg/HgO)Ecorr (V vs. Hg/HgO)Jcorr (mA/cm2)Rp (Ω/cm2)
1−1.70−1.709.594.6
2−1.73−1.747.955.2
3−1.79−1.766.875.6
4−1.71−1.7312.783.5
Table 4. EIS fitted values of the Al-Mg-Sn-Ga-xBi alloys.
Alloy 1Alloy 2Alloy 3Alloy 4
L (H cm2)9.164 × 10−71.35 × 10−67.909 × 10−77.163 × 10−7
Rs (Ω cm2)1.3840.90831.3921.344
CPE1 (F cm−2)4.979 × 10−54.662 × 10−53.365 × 10−58.783 × 10−5
Rt (Ω cm2)1.3242.0843.2921.167
CPE2 (F cm−2)1.144 × 10−36.805 × 10−35.759 × 10−47.227 × 10−3
R2 (Ω cm2)0.14870.11740.59790.1187
x21.062 × 10−42.588 × 10−43.552 × 10−48.892 × 10⁻⁵
Table 5. Discharge performances of Al-air batteries with the Al-Mg-Sn-Ga-xBi alloys.
AnodesOperating Voltage (v)Capacity Density (mAh g−1)η (%)Energy Density (mWh g−1)ηfuel (%)
Al-Mg-Sn-Ga1.135 ± 0.022382.9879.972704.6832.39
Al-Mg-Sn-Ga-0.08Bi1.229 ± 0.052466.9682.783031.8937.43
Al-Mg-Sn-Ga-0.10Bi1.287 ± 0.022533.9485.033261.1840.26
Al-Mg-Sn-Ga-0.12Bi1.150 ± 0.022343.1079.632694.5633.26
Publisher’s Note: MDPI stays neutral with regard to jurisdictional claims in published maps and institutional affiliations.

