Article

The Role of LPSO Structures in Corrosion Resistance of Mg-Y-Zn Alloys

by
Daria Pałgan
1,
Anna Dobkowska
1,*,
Aleksandra Zielińska
1,
Daria Drozdenko
2,
Kristián Máthis
2 and
Wojciech Święszkowski
1
1
Faculty of Materials Science and Engineering, Warsaw University of Technology, 02-507 Warsaw, Poland
2
Faculty of Mathematics and Physics, Charles University, Ke Karlovu 5, 121 16 Prague, Czech Republic
*
Author to whom correspondence should be addressed.
Crystals 2022, 12(12), 1723; https://doi.org/10.3390/cryst12121723
Submission received: 14 November 2022 / Revised: 24 November 2022 / Accepted: 25 November 2022 / Published: 27 November 2022
(This article belongs to the Special Issue Advances in Laminated Metallic Composites)

Abstract

:
The growing interest in improving Mg-based alloys’ corrosion properties stimulates the development of Mg-Y-Zn alloys with long-period stacking-ordered (LPSO) structures. In this work, to describe the corrosion performance of Mg-LPSO alloys, a set of experiments, including microstructure observations and corrosion testing in media containing various concentrations of chloride ions, were carried out. It was shown that the main corrosion mechanism occurring on the alloys was not only related to the volume of LPSO structures in the Mg matrix but was also dependent on their distribution. In the chloride-containing solutions, pitting was the predominant corrosion mechanism, and with the increasing chloride concentration, microgalvanic corrosion was accelerated.

1. Introduction

Due to strong aging hardening abilities, low density, creep resistances, and biocompatibility, Mg alloys have a great application potential as lightweight structural and biomedical materials. The growing interest in further improvement of material strengthening has stimulated the development of Mg-Y-Zn alloys with long-period stacking-ordered (LPSO) structures [1,2]. The LPSO phases form in Mg alloys which contain two main types of alloying elements: (i) a transition metal with a smaller atomic radius than Mg, such as Zn; and (ii) RE elements with a larger atomic radius, such as Y and Gd [3,4]. Their stacking sequence depends on the alloying elements’ (Zn and Y) concentrations in the Mg matrix [5]. Many types of Mg-LPSO structures have been investigated, called 6H, 10H, 12R, 14H, 18R, 24R, 29H, 51R, 60H, 72R, 102R, and 192R [6]. Besides chemical composition, the formation of LPSO structures strongly depends on fabrication methods (casting, rapidly solidified powder metallurgy, electric resistance melting) and/or post processing of the alloys, including heat treatment and severe plastic deformation methods [7,8,9,10]. Generally, the formation of LPSO structures in Mg alloys leads to the enhanced mechanical properties of the Mg alloys [11,12,13,14,15]. As a result of the developed microstructure, grain refinement is a strengthening mechanism, as the number of grain boundaries increases due to a higher fraction of LPSO phases [16]. Another way of impeding the dislocations’ movement is the ongoing deformation of LPSO phases, where dislocations are accumulated and blocked by the kinked LPSO phases [17]. Additionally, bending and kinking of LPSO phases leads to the further refinement of LPSO phases, which also influences a great extent of mechanical properties [18,19]. Horváth et al. [16]. made a comparative study on the extruded WZ21 (Mg-1.8-0.7Zn, wt.%), WZ42 (Mg-3.5Y-1.6Zn, wt.%), WZ72 (Mg-6.9Y-2.5Zn, wt.%), and WZ104 (Mg-10Y-3.7Zn, wt.%), and reveals that the increasing content of Zn and Y improves mechanical properties of the alloys. Moreover, the high-temperature deformation of WZ42 was studied by Fekete et al. [20], and it was shown that two factors control the yielding of LPSO structures: activations of extension twin system in elongated grains and basal slip in the dynamically recrystallized grains (up to 300° C).
There is vast knowledge about the microstructure and mechanical properties of Mg alloys containing LPSO structures; moreover, their corrosion resistance still needs to be thoroughly investigated. Pérez et al. [21] discovered that the orientation of LPSO-phase alignments strongly influences the corrosion resistance of the extruded Mg97Y2Zn1 alloy. Li et al. [22] concluded after investigations of WZ12 (Mg-0.9Zn-1.6Y wt.%), WZ25 (Mg-2.1Zn-5.2Y wt.%), and WZ38 (Mg-3.1Zn-7.6 wt.%) that in 0.1 M neutral NaCl solution, galvanic corrosion prevails in the corrosion performance of Mg-Zn-Y alloys. Due to increasing concentration of alloying elements, mechanical properties increase; however, a higher number of LPSO phases resulted in a lowering of corrosion resistance of WZ25 and WZ38 compared to WZ12. On the contrary, it was shown that the formation of LPSO structures in as-extruded GZ51K (Mg-5Gd-1Zn-0.6Zr) alloy improves its corrosion resistance when compared to T4-treated alloy [8]. The effect of LPSO on the corrosion resistance of Mg-6Gd-2Y-1Znn-0.3Zr has been studied in detail [23]. It has been shown that, apart from LPSO structures, aged-precipitations significantly affect corrosion mechanisms of the alloys, leading to the micro galvanic corrosion between fine recrystallized grains and aged precipitations. It is worth mentioning that the method of production and its parameters also influence the corrosion resistance of Mg-LPSO alloys. As reported by Wang et al. [24], the number of passes during equal channel angular pressing (ECAP) has a major effect on the corrosion resistance of Mg-1Y-0.5Zn; however, there is no straightforward dependence showing that with the increasing number of ECAP passes, the corrosion resistance increases.
Since Mg-Zn-Y alloys became a goal of interest, due to many possibilities of microstructure control and their high mechanical properties, a vast scope of research is necessary to have detailed knowledge about their corrosion susceptibility. It would be highly beneficial to indicate the optimal content of alloying elements Y and Zn, which directly transforms into a volume fraction of LPSO phases to reach the best corrosion properties. Hence, in this study, the extruded WZ42 (Mg-3.5Y-1.6Zn, wt.%) and WZ104 (Mg-10Y-3.7Zn, wt.%) alloys in terms of their corrosion performance in various chloride-containing corrosive solutions are investigated.

2. Materials and Methods

Two Mg-Y-Zn alloys (WZ42 and WZ104 with the chemical composition given in Table 1) were conventionally extruded with the extrusion ratio of 4:1 and the extrusion rate of 0.5 mm∙s−1 at 350 °C into rods with a final diameter of 10 mm.
For microstructural characterization, optical (Zeiss AxioVision) and scanning electron microscopy (SEM, Hitachi SU8000) equipped with an energy dispersive spectrometer (EDS) were used. Samples were moulded in an acrylic resin and subsequently polished mechanically using an automatic grinding and polishing machine with #1200, #2500, and #4000 SiC grinding papers. Final polishing was carried out using water-free self-lubricating monocrystalline diamond suspensions (with gradation of 3 µm and 1 µm) along with anhydrous lubricant containing glycerine and ethanol (volume ratio of 1:2). Samples were etched with picric acid solution (5 mL of acetic acid, 40 mL of ethanol, 2.1 g of picric acid, 5 mL of distilled water) for 5 s and optionally with a solution of 10% nitric acid solution for 5 s. The microstructure observations were performed on the surfaces parallel and perpendicular to the extrusion direction. For SEM observations, polishing in a low energy Ar+ beam using an ion milling system IM4000 Hitachi was utilized. Based on SEM images, quantitative microstructure analysis (volume fraction of observed phases) was carried out [25,26]. Particularly, SEM images were converted into binary images, which enables to distinguish LPSO phases from the Mg matrix, and to calculate their fraction in the alloy.
Two types of corrosion tests (electrochemical and immersion tests) in various solutions: 0.01 M NaCl, 0.1 M NaCl, 1 M NaCl and PBS (quiescent, naturally aerated) were performed. To prepare chloride-containing solutions, distilled water, and analytical grade NaCl (Chempur) were used. The PBS was prepared using tablets purchased from Sigma Aldrich Ltd. (1 l of PBS was prepared using 5 tablets). The electrochemical tests consisted of the open circuit potential measurements (EOCP) for 1 h, electrochemical impedance spectroscopy (EIS) and potentiodynamic polarization measurements. To conduct electrochemical measurements, a working station consisting of Gamry Potentiostat Reference 600+ and the standard three electrode setup (reference electrode Ag|AgCl, counter electrode Pt and a sample as a working electrode) were used. After 1 h of open circuit immersion, EIS were recorded in a range of 0.01 Hz to 10,000 Hz (10 points/decade). The results were fitted using Gamry Echem Analyst™ software. The same software was used to calculate parameters from potentiodynamic polarization. The potentiodynamic curves were registered 0.5 V below the EOCP to 1.5 V vs. EOCP at a scan rate of 5 mV/s. The post-corrosion morphology of the samples was observed after 1 h immersion under open-circuit conditions using scanning electron microscopy (SEM, Hitachi SU8000). The images were obtained on the surfaces perpendicular to the extrusion direction, with and without corrosion products. To approach this, polished (#4000 SiC papers) samples were immersed in different solutions (0.01 M NaCl, 0.1 M NaCl, 1 M NaCl, PBS at 37 °C) for 1 h. Afterwards, corrosion products on one sample from each alloy were removed via chemical treatment with CrO3 for 40 s as specified in ASTM G1 Standard Practice for Preparing, Cleaning, and Evaluation Corrosion Test Specimens [27]

3. Results

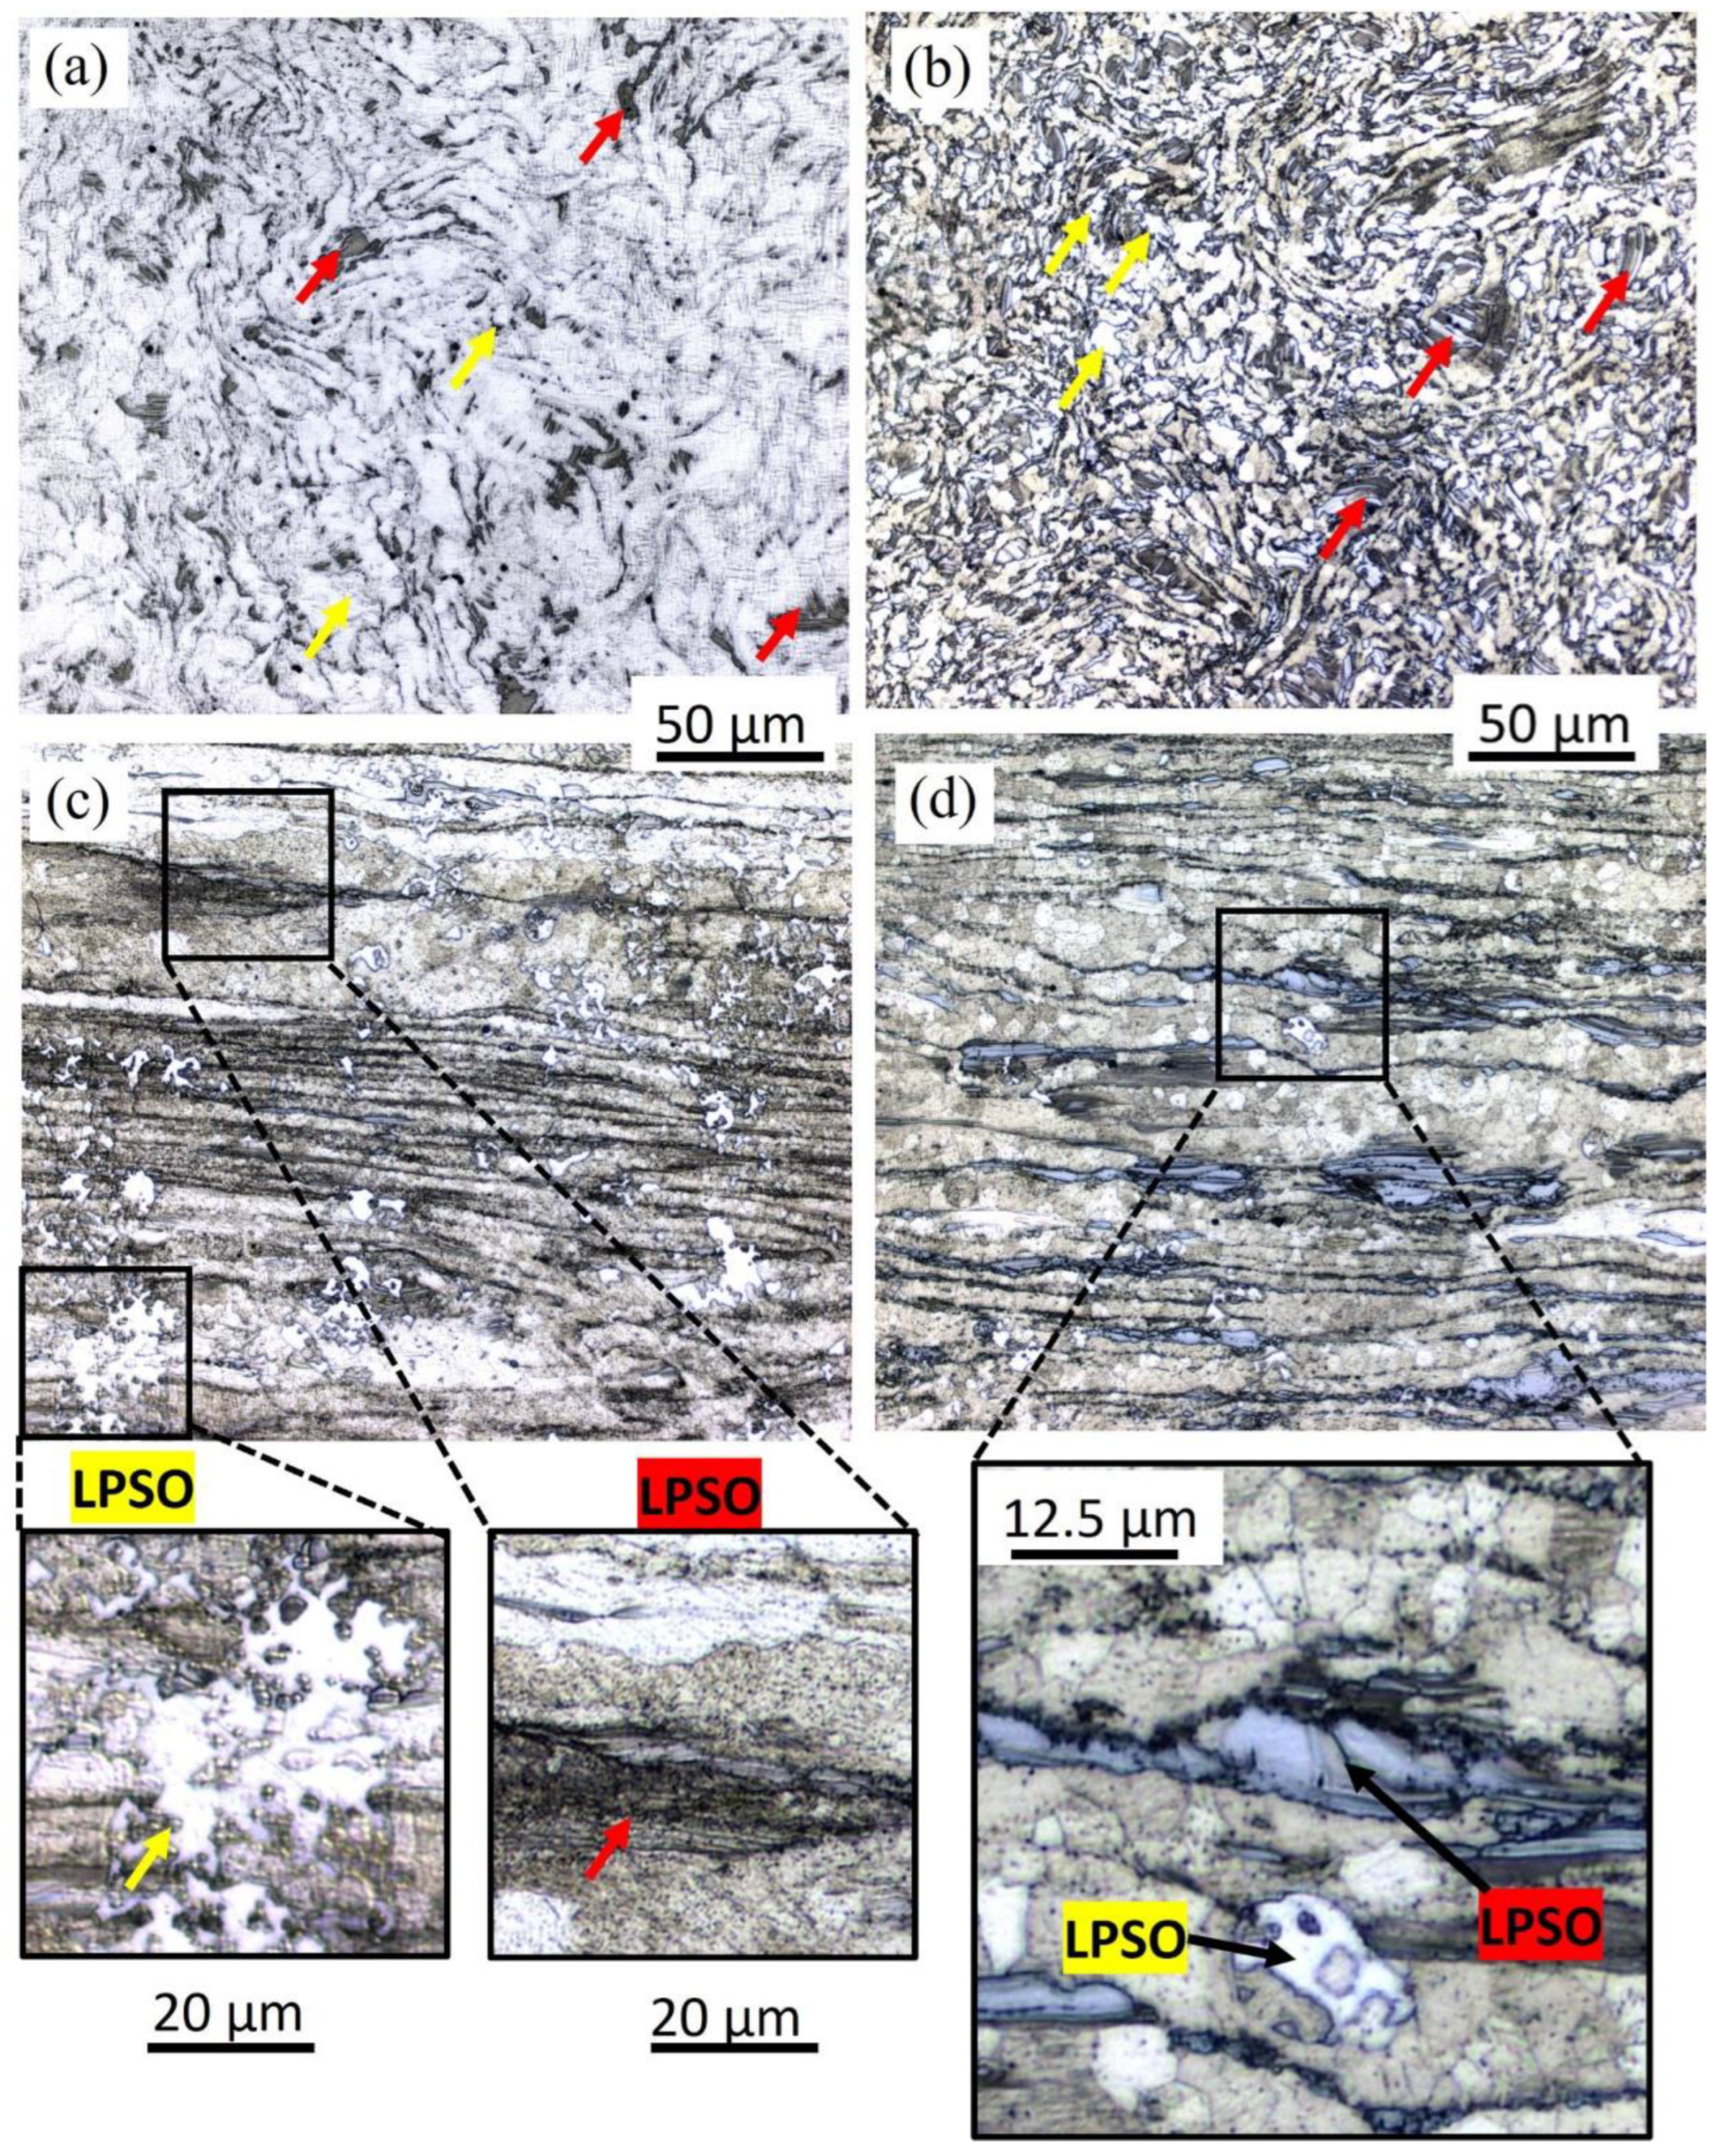
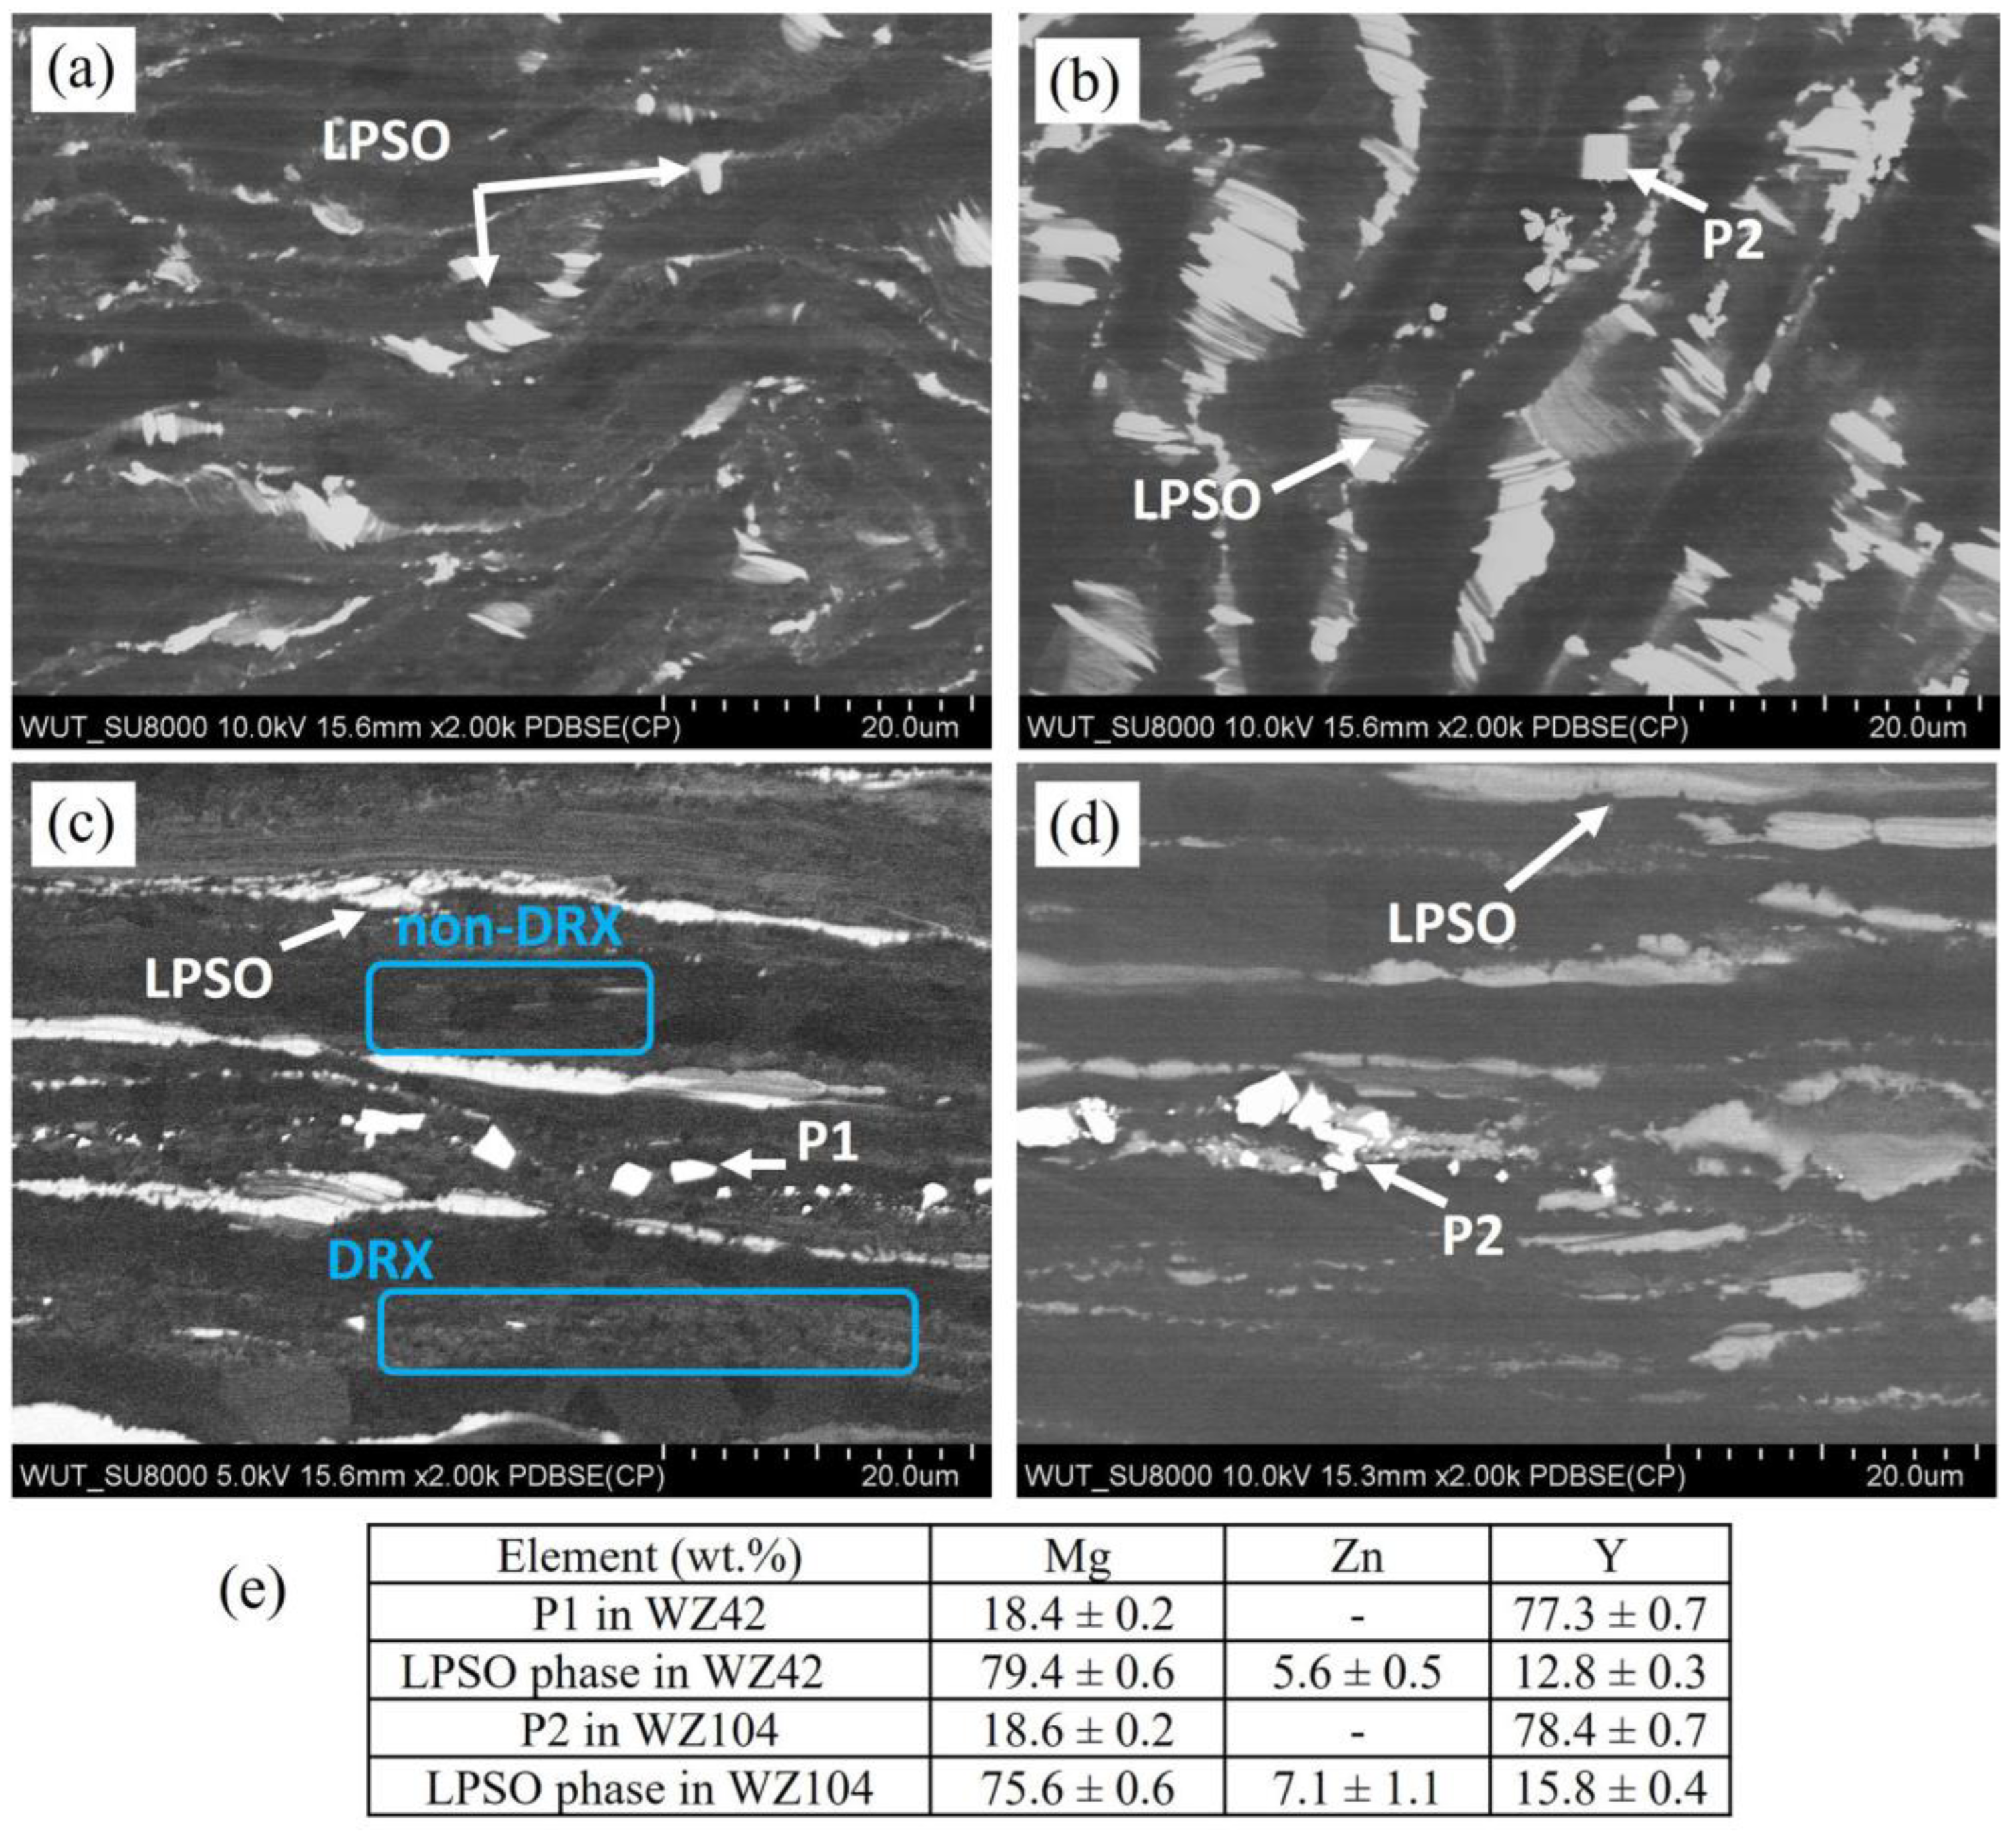
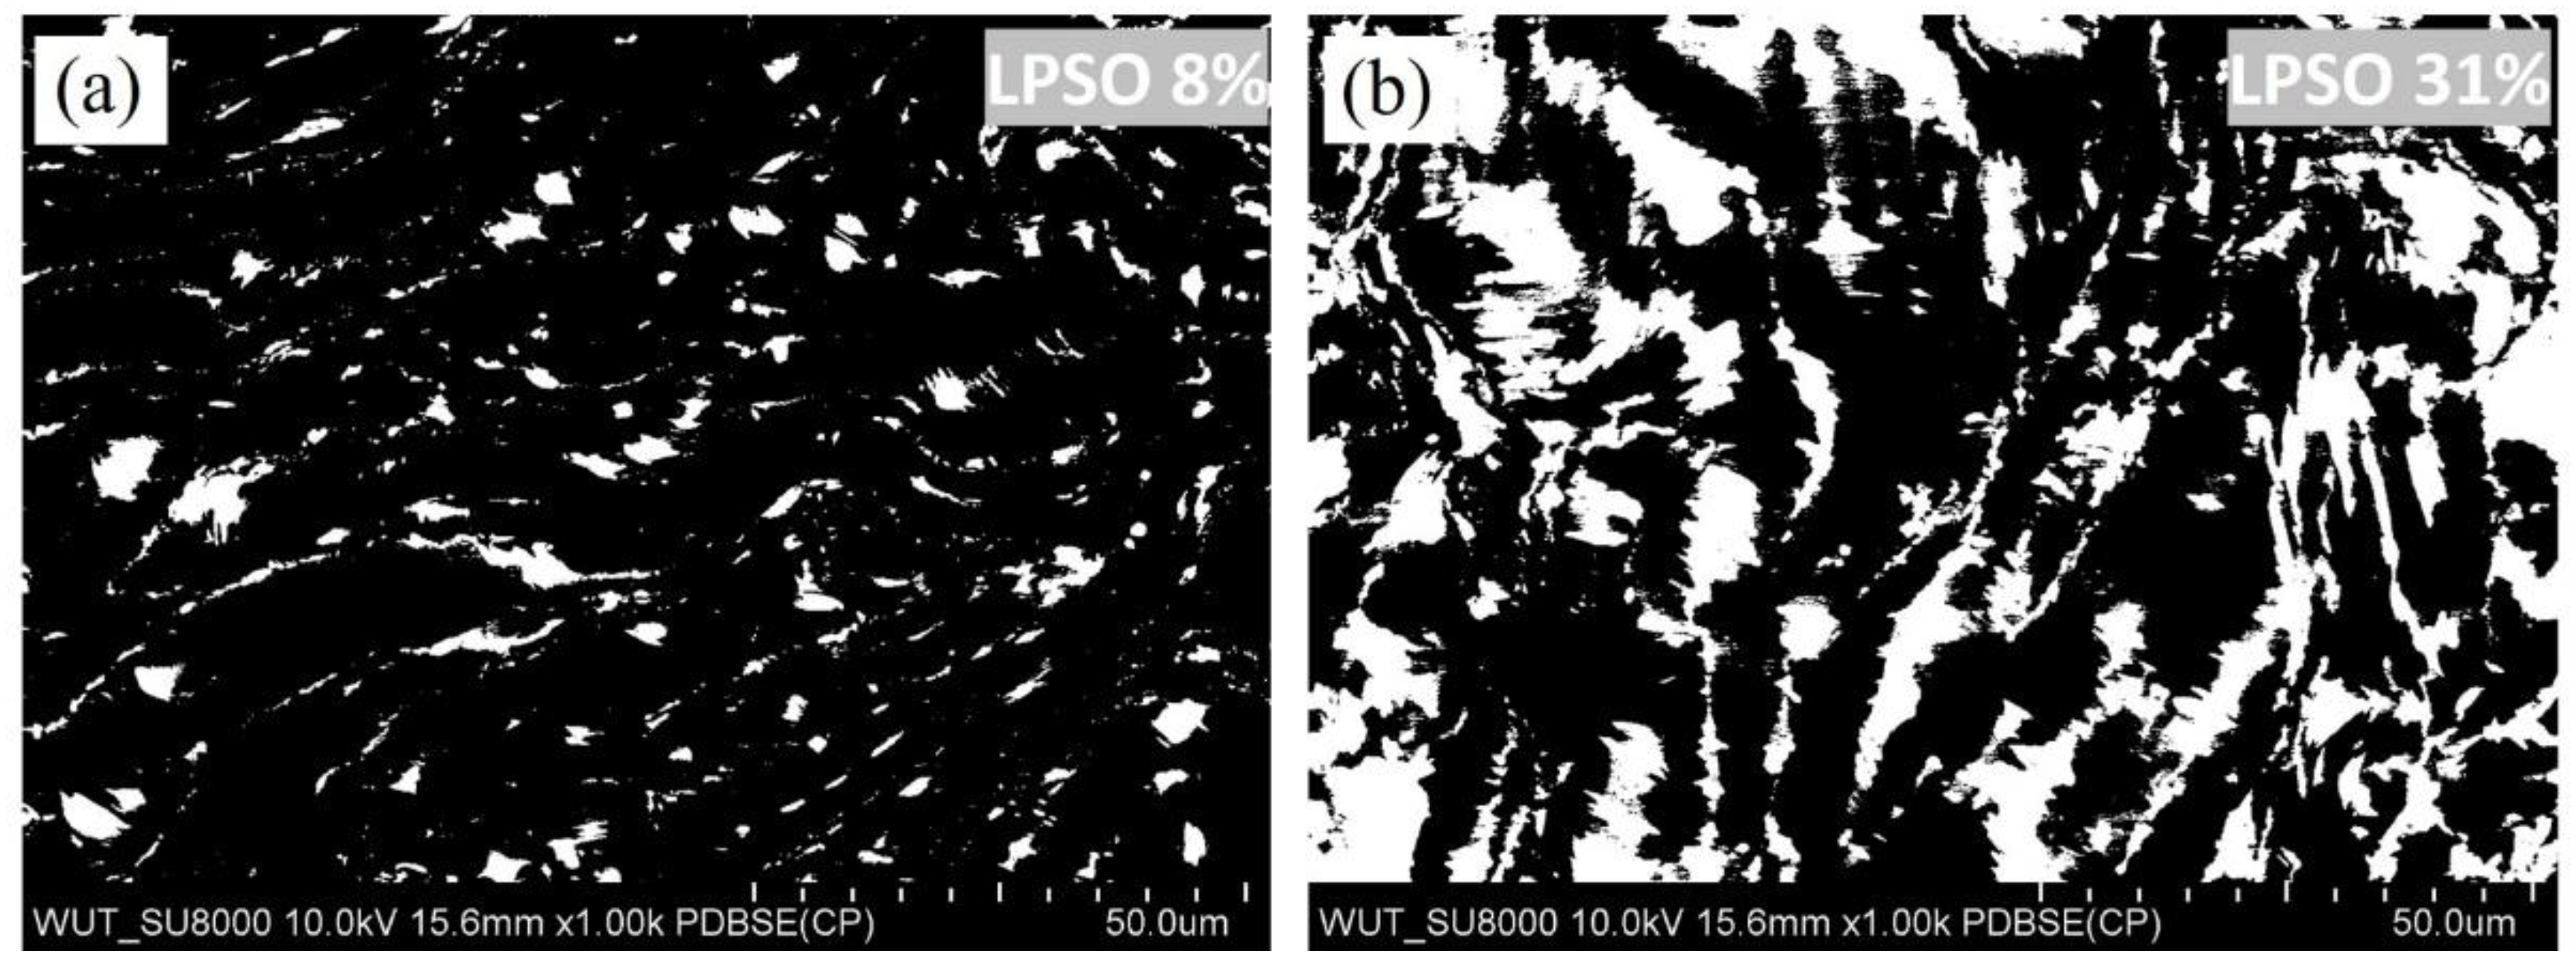
3.1. Microstructure Characterization

The microstructures of WZ42 and WZ104 in both perpendicular and parallel to extrusion directions are heterogeneous, with grains differing in size and randomly distributed fractions of LPSO phases (Figure 1). The complex and ununiform microstructure was formed during extrusion (Figure 1a,b). Distinguishable LPSO structures are observed in Figure 1. Differences observed in their morphology allowed us to distinguish two types of irregularly distributed LPSO structures: the dark grey LPSO phases (red-marked in Figure 1) exhibit a lamellar structure consisting of thin platelets, elongated along the extrusion direction. The second type are the light grey LPSO phases indicated by the yellow arrows in Figure 1a,b and shown at higher magnification in Figure 1c,d; they have a block-like structure, and they are not elongated along the extrusion direction (recognized previously as 18R polytype [20,28]. LPSO phases are distributed irregularly in both alloys, and they tend to locate as “knots on the rope” (Figure 2a,b). The sharp-edged precipitations also follow this trend by grouping along a line, especially observed in a cross-section image in a direction perpendicular to the extrusion direction (Figure 2c,d). As indicated in Figure 2e, the precipitations observed in both alloys are mainly composed of Mg and Y, LPSO phases containing Mg, Y, and Zn. It is also worth mentioning that the microstructures of both alloys are composed of α(Mg) with bimodally distributed grain sizes formed due to different kinetics of recrystallization (dynamic recrystallization, DRX, and non- DRX), which is described well in [16,29]. The DRX and non-DRX areas are clearly shown in Figure 2d. The volume fraction of the LPSO phase in the microstructure of WZ42 and WZ104 is quantitively presented in Figure 3. A higher volume of LPSO phase was formed in the WZ104 alloy, reaching 31%, while the fraction of the LPSO phase in case of WZ42 alloy was found to be about 8%.

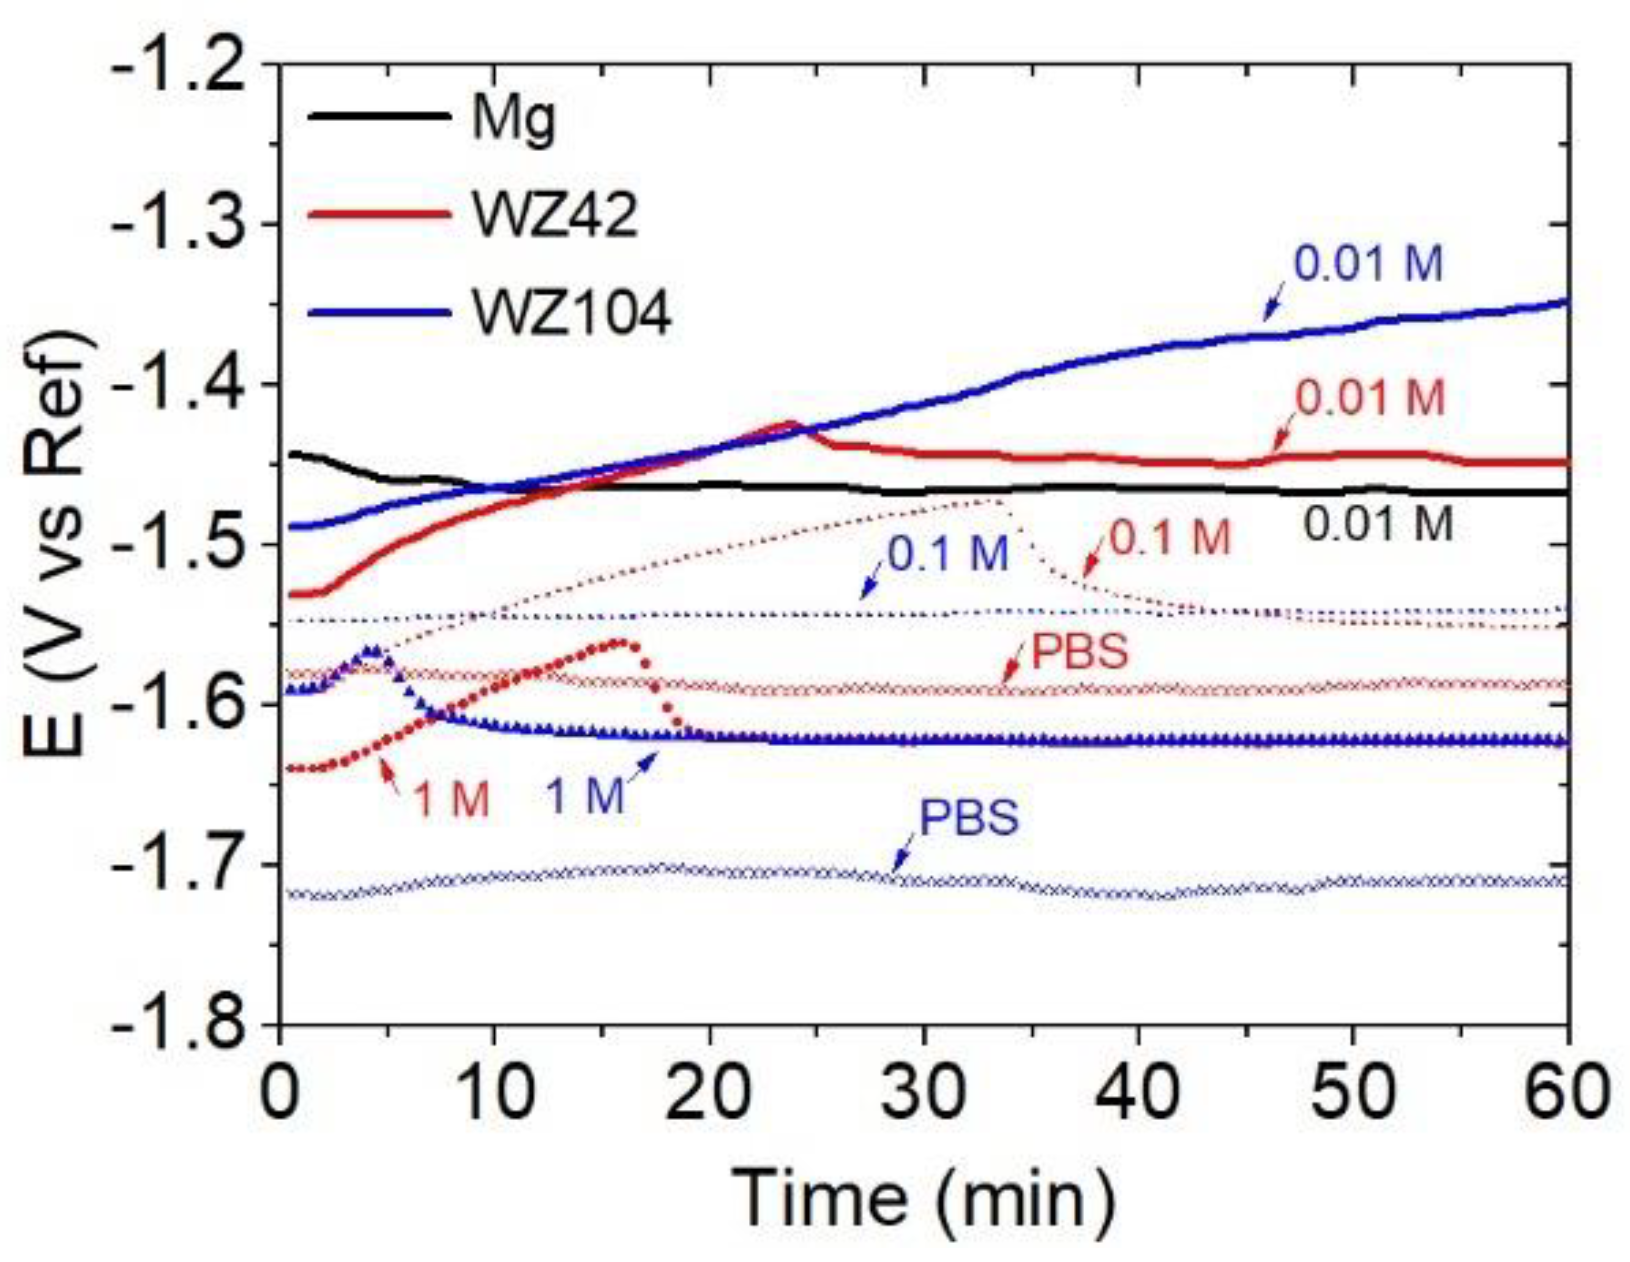
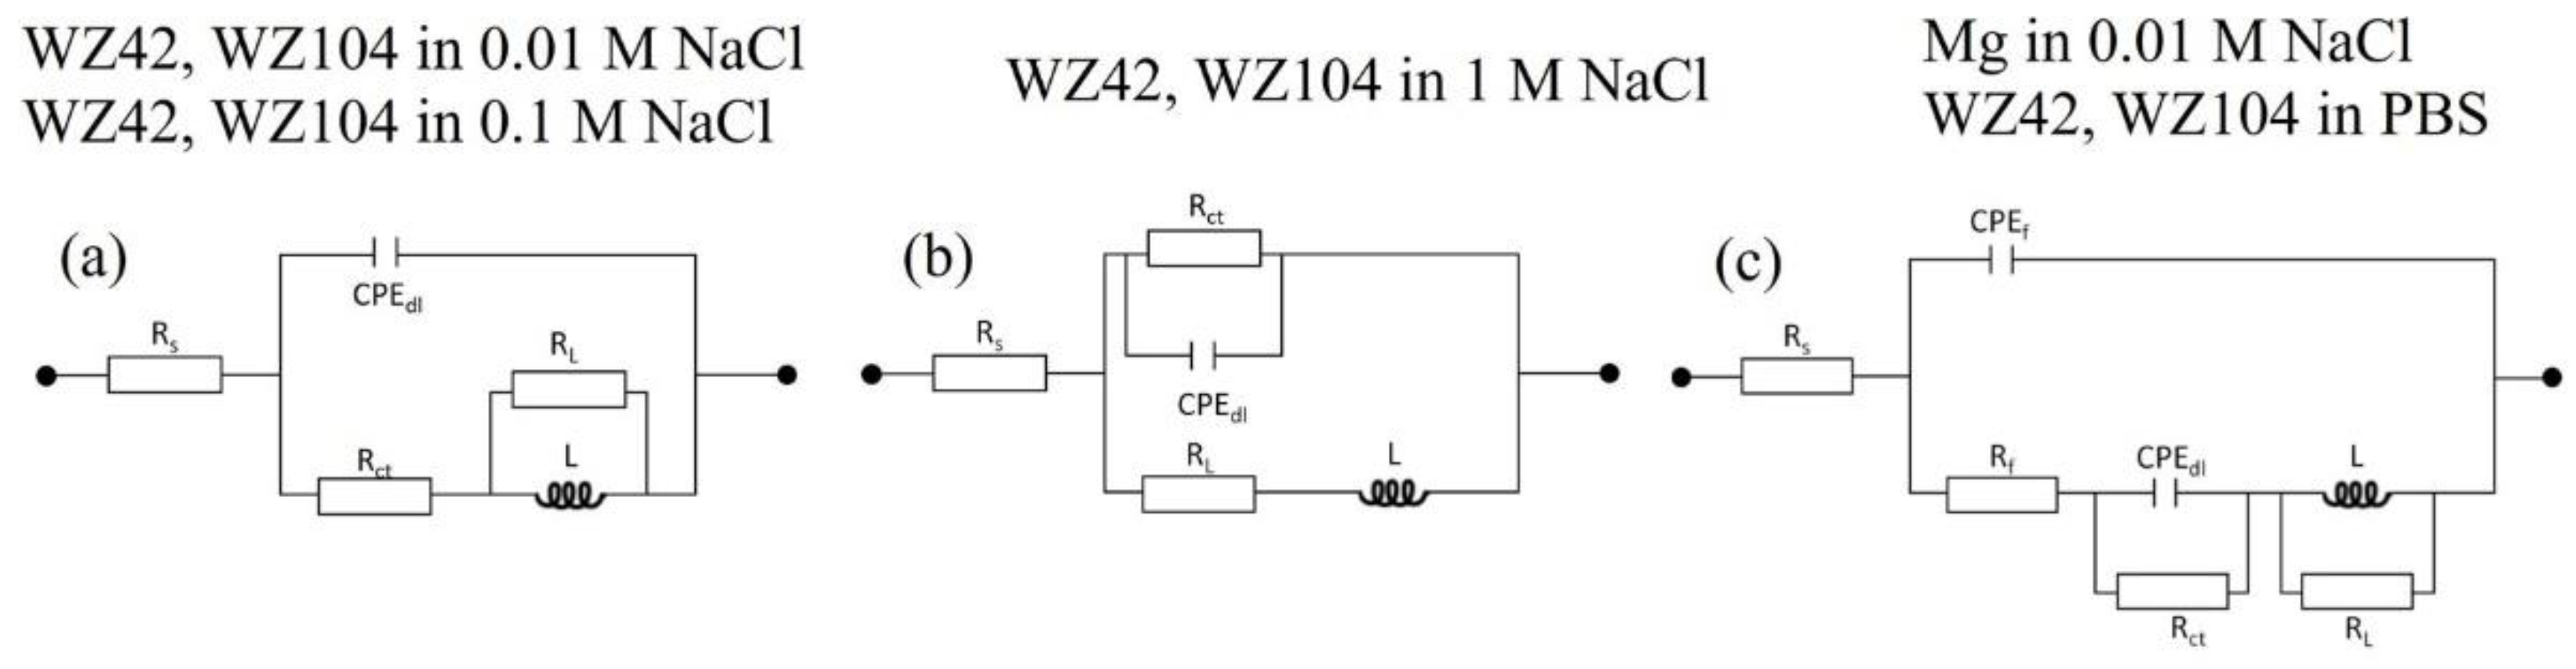
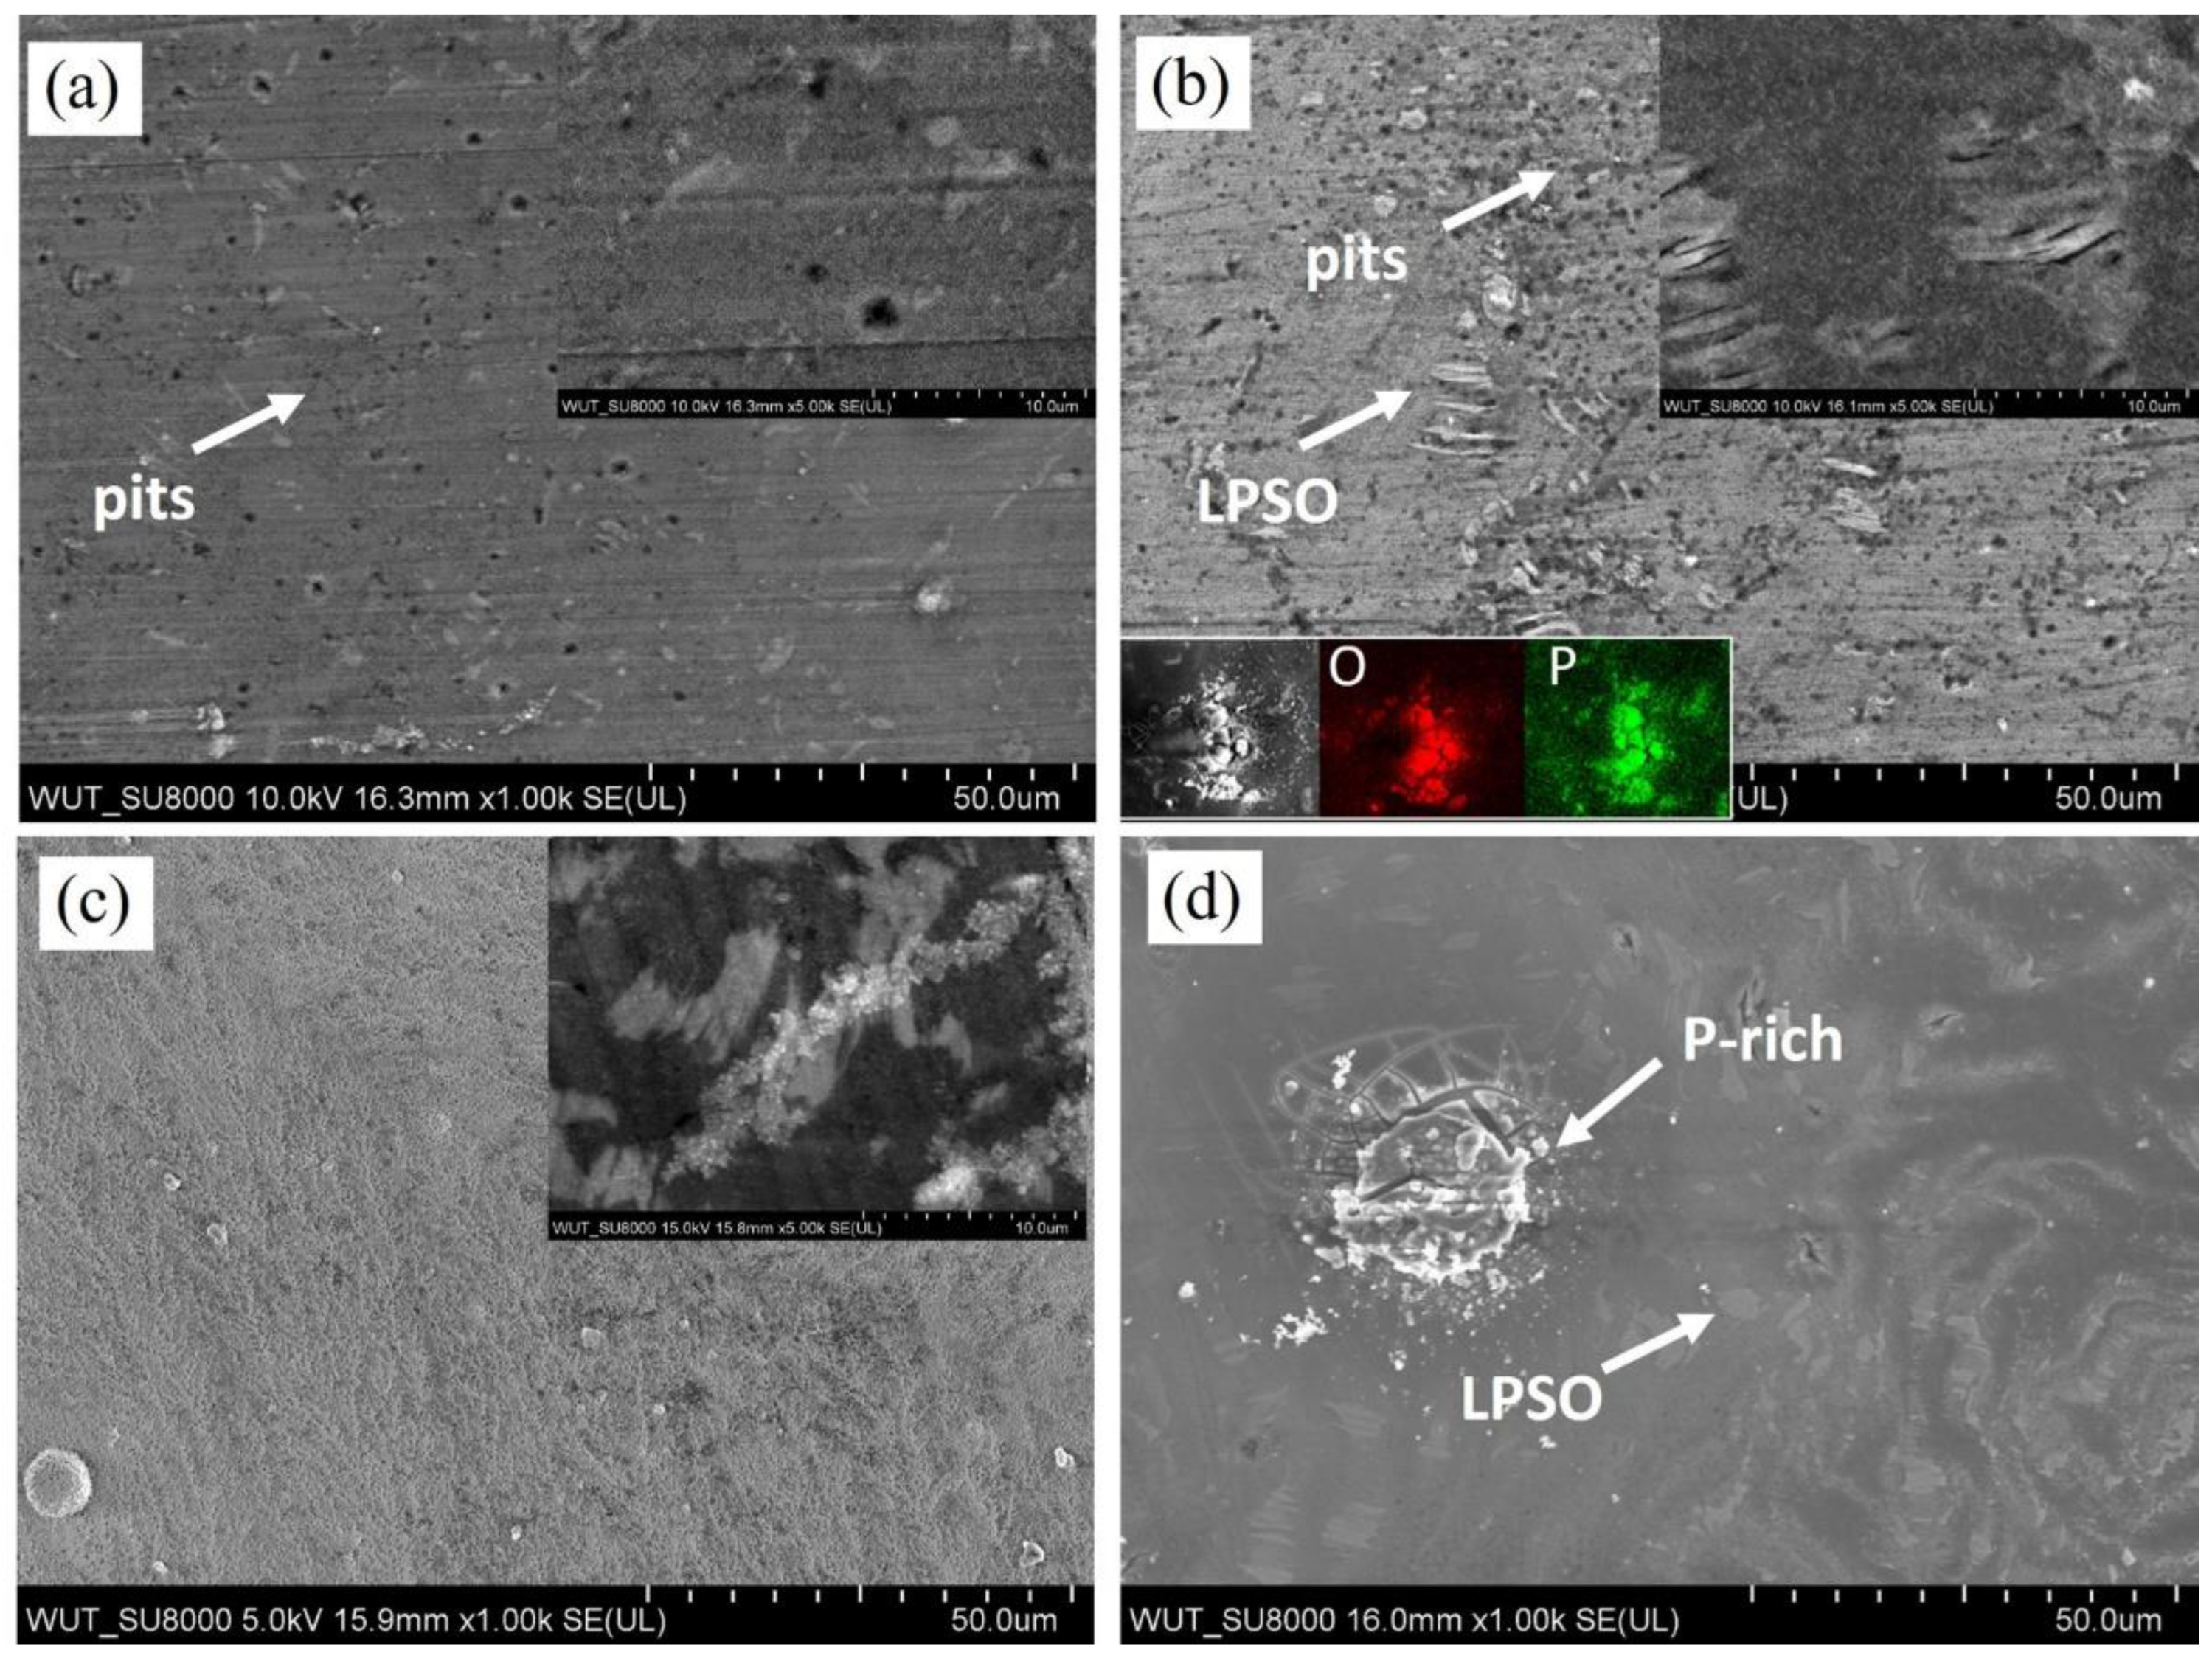
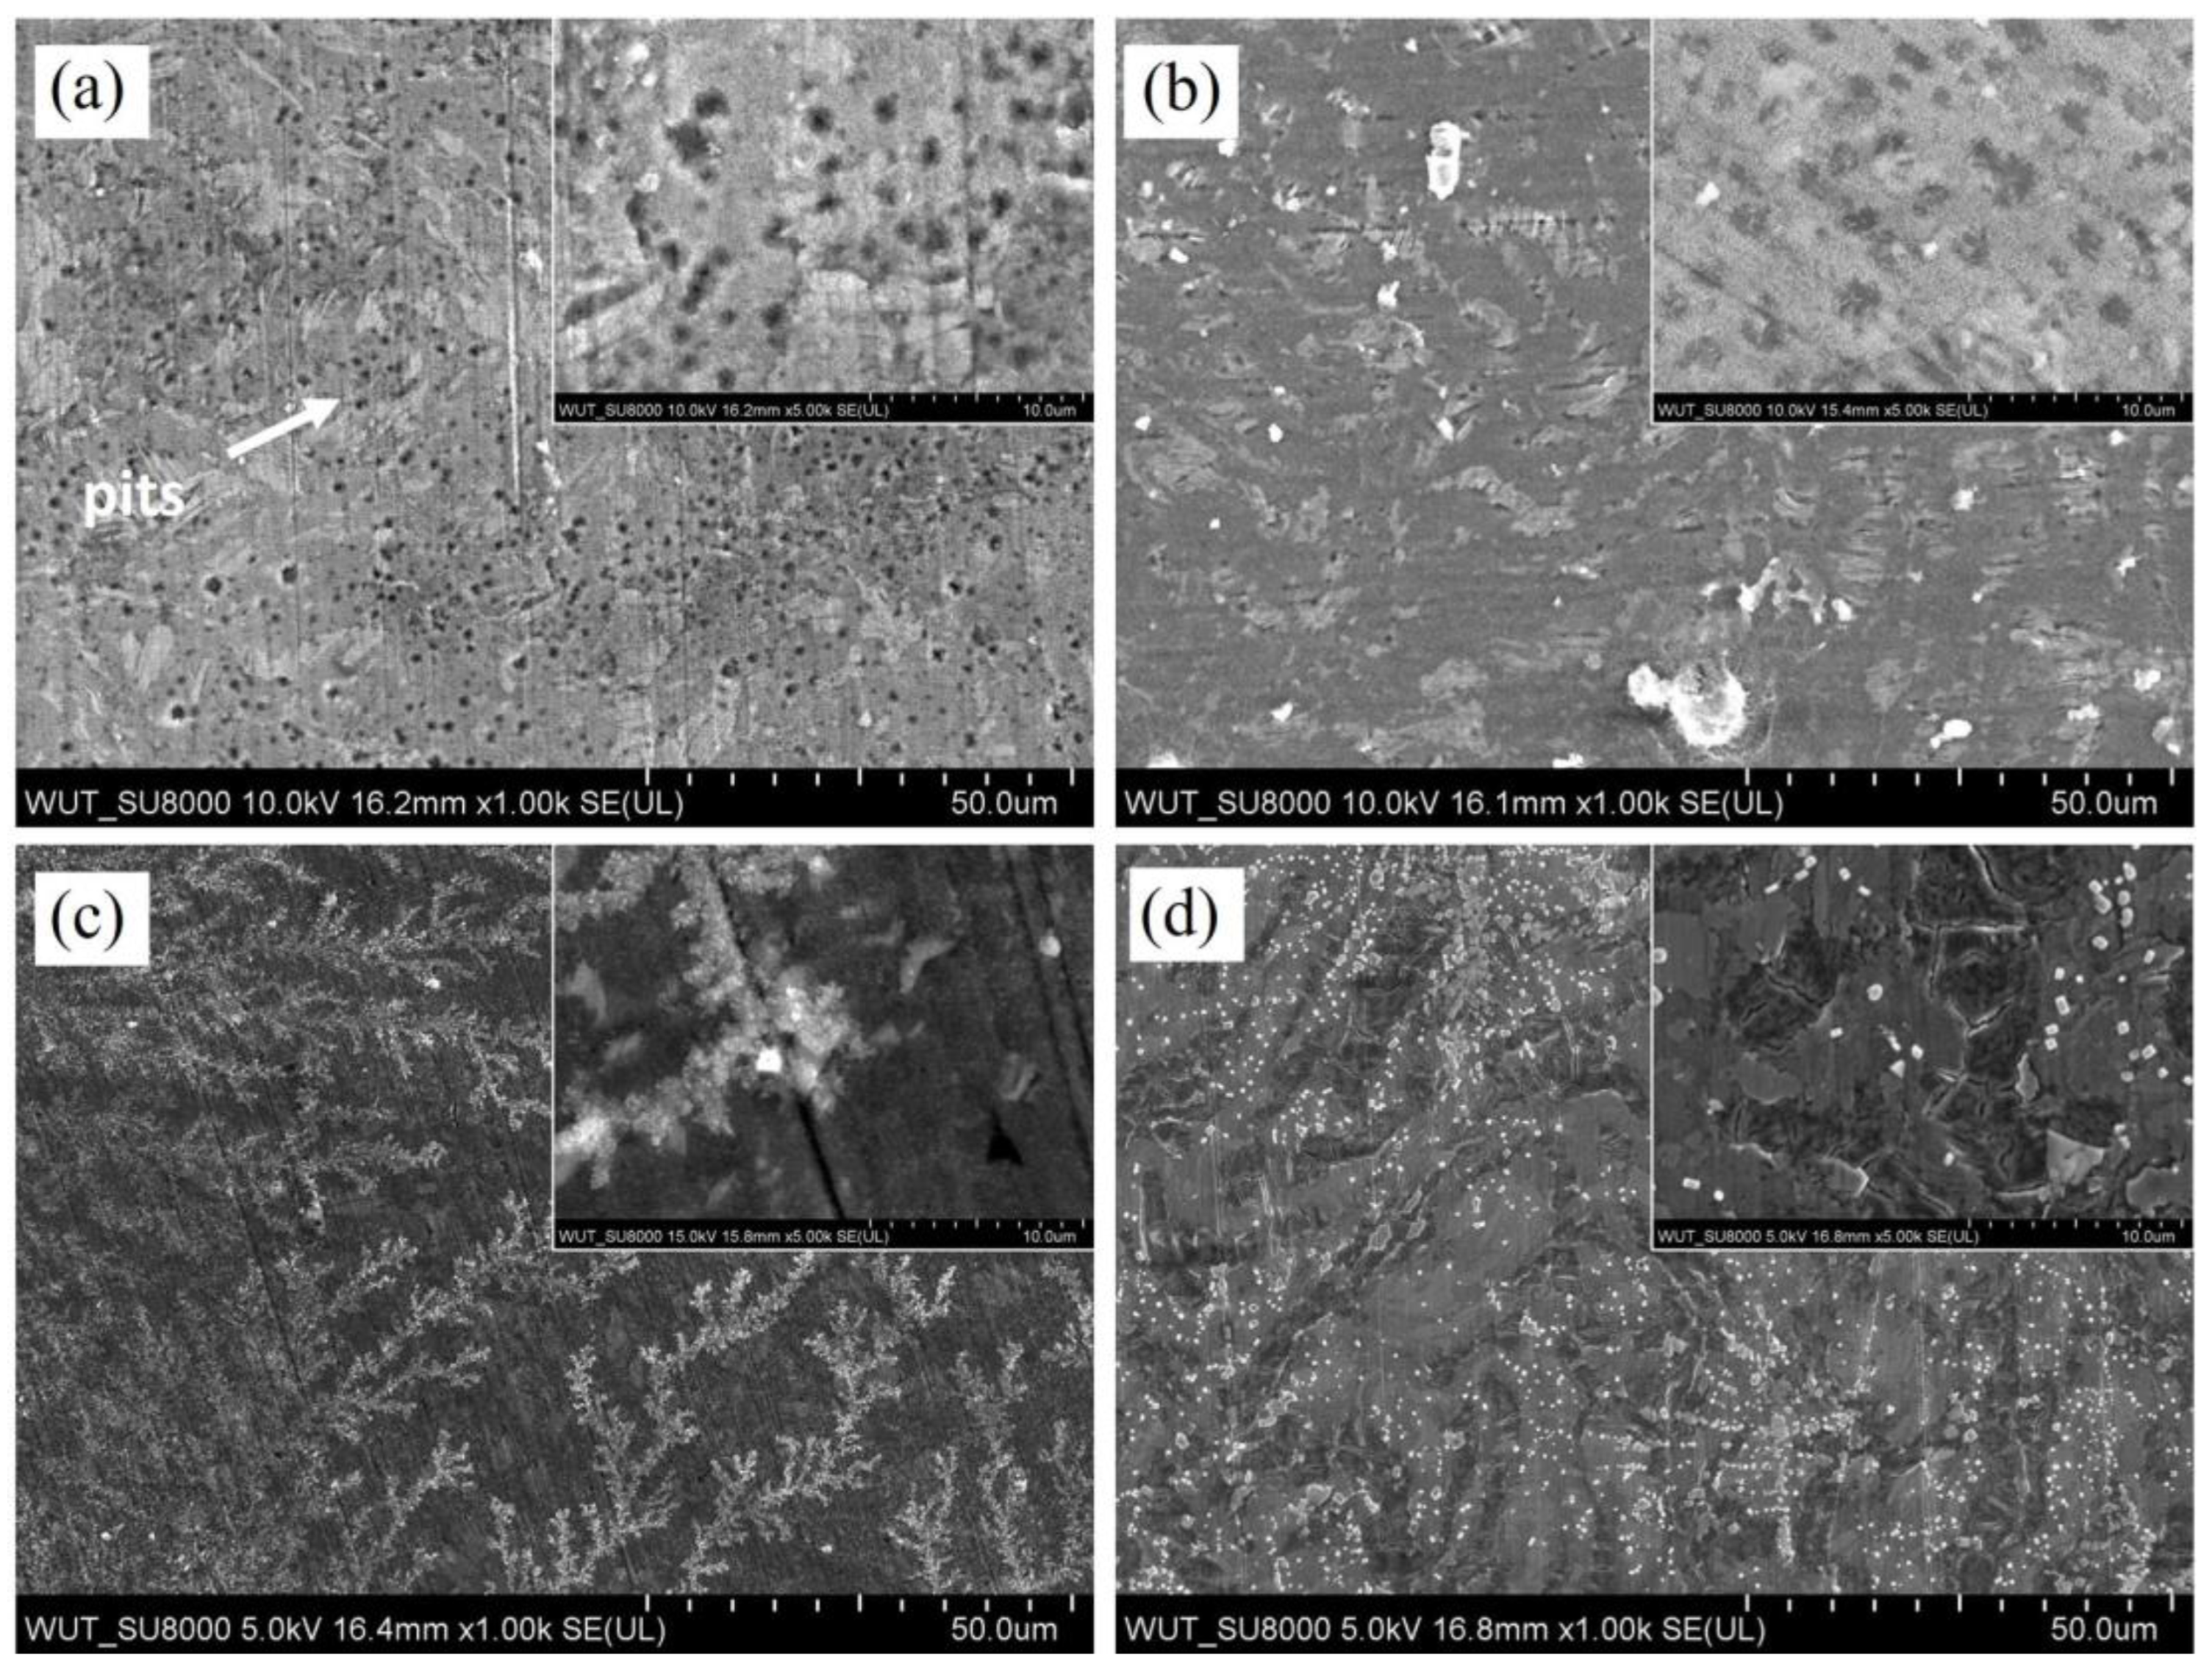
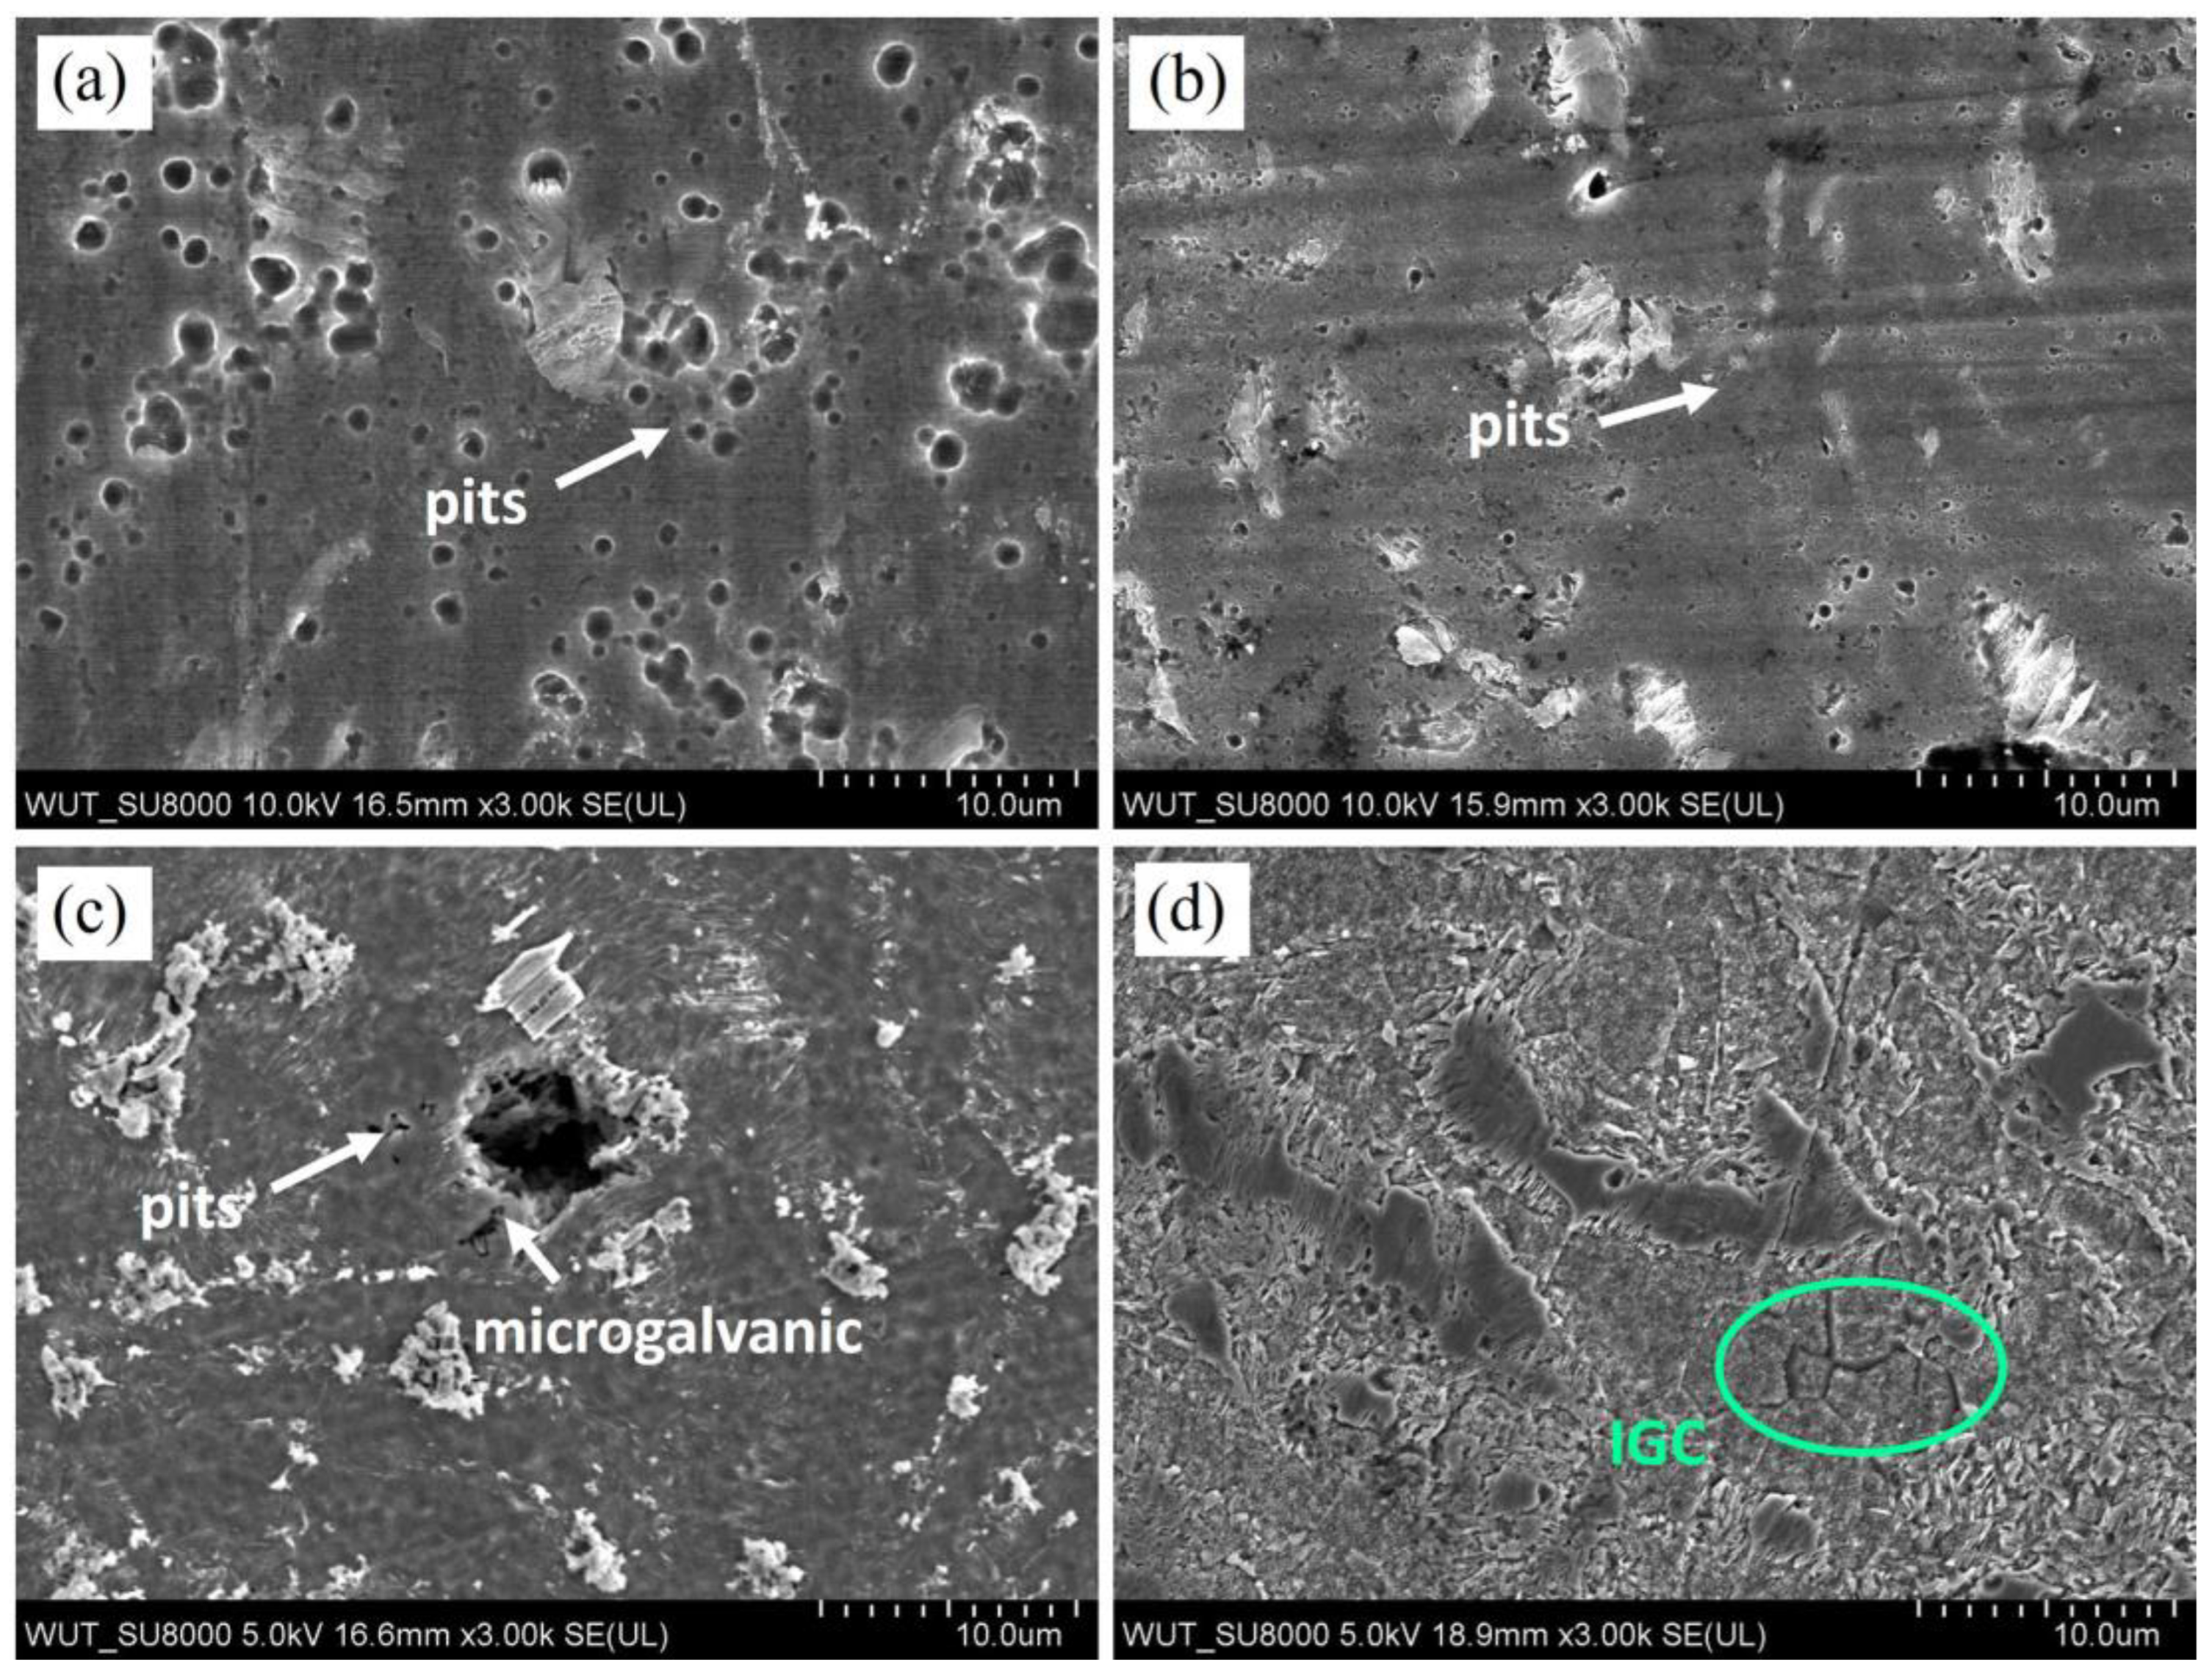
3.2. Corrosion Testing

The corrosion potential evaluation recorded under open circuit conditions in naturally aerated NaCl solution with various concentrations of chlorides (0.01 M, 0.1 M, 1 M) is shown in Figure 4. The highest values of EOCP are noticed for the materials in the least concentrated solution. Together with the Cl increase, the EOCP decreased, indicating a weaker resistance of investigated materials to the corrosive environment [30,31,32]. Among all materials, the most stable EOCP is recorded for pure Mg. In 0.01 M NaCl, the initial increase in EOCP for WZ42 is observed (from –1.53 to −1.42 V/Ref) during the first 25 min of immersion. Afterward, the EOCP slightly decreased, having a similar value of −1.45 V/Ref during the reminder of the experiment. The increasing trend of EOCP during 1 h of immersion is characteristic for the WZ104 alloy; at the beginning of immersion, EOCP was found to be −1.47 V/Ref, and at the end of immersion, it was −1.35 V/Ref. In 0.1 M NaCl, the potential evaluation for the WZ42 alloy underwent the same trend with a slow increase from −1.58 V/Ref to −1.44 V/Ref during 35 min of immersion. After that, values decreased, oscillating around −1.55 V/Ref for the remainder of the experiment. In 0.01 M NaCl, the WZ104 exhibited stable values of EOCP (−1.54 V/Ref) during the entire immersion time. In 1 M NaCl, the WZ42 and WZ104 alloys exhibited a similar trend with an initial increase in EOCP followed by its decline to −1.62 V/Ref (after 5 min for the WZ104 alloy, after 15 min for the WZ42 alloy). Stable enough values of EOCP are characteristic for both alloys oscillating around −1.58 V/Ref for the WZ42 alloy and −1.72 V/Ref for the WZ104 alloy. In PBS, there were also stable enough values of EOCP, with −1.58 V/Ref for the WZ42 alloy, and −1.72 V/Ref for the WZ104 alloy.
The potentiodynamic polarization curves registered for the investigated materials in all analyzed solutions (0.01 M NaCl, 0.1 M NaCl, 1 M NaCl and PBS) are depicted in Figure 5. The most active among the investigated materials was pure Mg; therefore, that sample was investigated only in the least concentrated solution (Figure 5a). Uniform dissolution of pure Mg in 0.01 M NaCl is also confirmed by the uniformly increasing current density together with shifting potentials towards more positive values. Anodic branches of potentiodynamic curves recorded for the WZ42 and WZ104 alloys have different trends, and inflection points typical for breakdown potential (Eb) are observed [33,34]. The increasing chloride concentration causes a more uniform dissolution of WZ104; however, on the anodic branch of WZ42, Eb can still be distinguished Figure 5b. In 1 M NaCl, Figure 5c, the WZ104 alloy started to corrode rapidly, while clear Eb is present for WZ42. As shown in Table 2, the increasing corrosion current density icorr in the sequence of WZ42 < WZ104 is repeatable in all analyzed mediums suggesting that WZ42 is more resistive than WZ104. When analyzing chloride concentration, it must be noted that in the case of WZ42, icorr follows the sequence: 0.01 M < 0.1 M << 1 M < PBS (0.6 M). This indicates that not only chloride concentration affects corrosion mechanisms and kinetics in the case of the WZ42 alloy, but also other species present in PBS. A different situation is observed for WZ104 where the highest icorr values are calculated for that sample in 1 M NaCl, giving the information that the corrosion is mainly affected by chloride concentration and with the increasing chloride concentration, the resistivity of the alloy decreased. An apparent plateau observed on the anodic branch of the polarization curve of WZ42 in PBS indicates that a more stable passive layer forms on the surface of WZ42 than on the surface of WZ104.
EIS spectra collected during the immersion tests for the investigated materials are shown in Figure 6, and the equivalent electronic circuits used for data fitting are presented in Figure 7. The detected trends in the spectra were different depending on the type of environment. The Nyquist plots recorded for the WZ42 and WZ104 in the 0.01 M, 0.1 M and 1 M NaCl are composed of one capacitive loop recorded at high and middle frequency, and a tail at low frequencies. The capacitive loops are not perfect semicircles—a so called dispersing effect in the case of which the double layer does not behave as an ideal capacitor [35]. The capacitive loops are attributed to the charge transfer of the corrosion process. To describe the capacitive loop Rct and CPEdl are used, where Rct presents charge transfer resistance and CPEdl is the electrical double layer capacitance, and Rs is a solution resistance. The inductive loop comes from the adsorbed/desorbed species on the surface of the electrode, such as Mg(OH)+ and Mg(OH)2, suggesting that this loop can be related to the pit formation [36]. In the case of PBS, additional parameters such as RF and CPEF are related to the resistance and capacitance of passive film formed on the alloys.
The parameters obtained from impedance analysis are summarized in Table 3. The diameter of the capacitive loops is generally related to the corrosion rate; the broader the radius of the capacitive loop, the lower the corrosion rate of the respective alloy. It is evident from the Nyquist plots presented in Figure 6a–c that a broader radius of the capacitive loop is associated with a lower chloride concentration of NaCl solution, which is also confirmed by the total impedance modulus decreasing due to increasing chloride concentration in the solution (Figure 6e–g). From the analysis of the results obtained in PBS, it is clearly seen that the corrosion mechanism changed, resulting in film formation on the surface of the alloys. In this case, corrosion products were more stable leading to the formation of a corrosion layer which most likely prevented the spreading attack of aggressive ions into the Mg substrate. The Equivalent electronic circuits used for data fitting of the investigated alloys are depicted in Figure 7.
To perform a detailed characterization of the corrosion mechanisms and damage that occurred on the surface, the SEM observations of the corroded surface after immersion, and after corrosion products removal, were done. Results of the observations are shown in Figure 8, Figure 9, Figure 10 and Figure 11. Corrosion products observed on the surface of WZ42 and WZ104 vary due to different corrosive mediums. In 0.01 M NaCl and 0.1 M NaCl, multiply pits were formed on the WZ42 and WZ104 and their surfaces were covered with needle-like corrosion products of Mg(OH)2 (shown in Figure 8a,b and Figure 10a,b in the insets). In 1 M NaCl, the surfaces of both alloys were covered with extensive corrosion products, however, in both cases, dendrites suggest formation of NaCl crystals on the surfaces (Figure 8c and Figure 10c). Different surface morphology is observed in Figure 8d and Figure 10d, representing the surfaces of the alloys immersed in PBS is covered with uniform corrosion deposits where the particle-like shapes are observed. Signal coming from P during EDX measurements allows us to infer the incorporation of this element in the layer of corrosion products formed on the substrate.
After removing the corrosion products, the main corrosion mechanisms must be differentiated concerning various solutions. It is essential to underline that both alloys undergo pitting corrosion in 0.01 M and 0.1 M NaCl (Figure 9a,b and Figure 11a,b). When the chloride concentration increases, pits are still visible; however, corrosion damage is formed as a result of microgalvanic interactions between LPSO structures and Mg matrix (Figure 9c and Figure 11c). Herein, the most abundant factor influencing corrosion resistance is the volume fraction of the LPSO phase. An interesting situation is observed on the surface of the alloys immersed in PBS, where the corrosion mechanism completely changed: corrosion proceeds between LPSO structures and Mg matrix to some extent, and then attacks grain boundaries, resulting in the formation of the intergranular corrosion (IGC); see Figure 9d and Figure 11d.

4. Discussion

In this work, the corrosion resistance of WZ42 and WZ104 alloys was characterized in various corrosive solutions (0.01 M NaCl, 0.1 M NaCl, 1 M NaCl, and PBS). The microstructure of both alloys is complex and is composed of bimodally distributed grain sizes of Mg matrix, fractions of the LPSO phase and Y-rich precipitations. Sets of experiments of Mg alloys containing the LPSO phase have been investigated in order to elucidate the relationship between corrosion resistance and the microstructure of the alloys. Previous reports focused mainly on the microgalvanic role of LPSO and how their presence accelerates corrosion reactions depending on the chemical composition of the alloys [6,37]. Conversely, if the LPSO fraction is high enough, they can improve the corrosion resistance of the alloys by forming corrosion barriers [6]. The results show that corrosion mechanisms occurring in the Mg alloys containing LPSO structures are not only related to the fraction of the LPSO phase, but they are also strongly dependent on the other factors, such as their distribution in the alloy or the analyzed environment. Pitting is the dominating mechanism of the corrosion proceeding in low chloride concentrated solutions, while with the chloride concentration increase, microgalvanic corrosion is accelerated, and it is strongly dependent on the fraction of the LPSO phase and their morphological structure. The most intense corrosion is observed for WZ104 in 1 M NaCl where the fraction of LPSO structures was found to be 31%. A lower fraction of the LPSO phase still led to the microgalvanic coupling; however, it does not induce such strong corrosion damage. Different corrosion mechanisms are present in PBS where the passive film formation occurred, and it was the reason for the uniform corrosion distribution on the metal surface. The presented knowledge is different from the conventional wisdom, as we did not observe microgalvanic dissolution of the LPSO phase in WZ42, but it was present in WZ104. This suggests that not only a microgalvanic effect between the LPSO phase and Mg matrix but also their number and distribution are responsible for corrosion kinetics. A higher area ratio of LPSO phases to Mg matrix leads to more intense microgalvanic corrosion due to the spatial distribution of the potential and current induced from half-reactions. Higher cathodic area must be compensated by anodic sites to drive system to equilibrium state, and this is the main reason for higher corrosion damage in the alloy containing a higher fraction of the LPSO phase. It is essential to underline that in PBS, grain boundaries were attacked simultaneously with the microgalvanic effect of LPSO phases. These processes are related to the recrystallization kinetics and must be investigated further. Nevertheless, it is important to mention that the presence of HPO42− anions in PBS may result in the precipitation of phosphate-type compounds (e.g., Mg3(PO4)2 or Ca3(PO4)2), changing the protective properties of the corrosion layers formed on the surface of the alloys.
A higher resistance against corrosion that the alloys have in the PBS can be attributed to the phosphate precipitation, which hinders the action of chloride; thus, Mg matrix dissolution is slower. In summary, the most perspective corrosion behaviour has WZ42 in the PBS environment. This result is attributed to the formation of a deposit of corrosion products, which offers more protection from the diffusion of aggressive ions to the electrode surface, as well as a lower number of microgalvanic couplings between LPSO phases and Mg alloys than those formed in the WZ104 alloy.

5. Conclusions

From the results of the investigation, the following conclusions can be drawn:
  • The corrosion mechanisms occurring in the case Mg-LPSO alloys are dependent on the volume fraction of LPSO phase, its distribution, and corrosion conditions (corrosive medium);
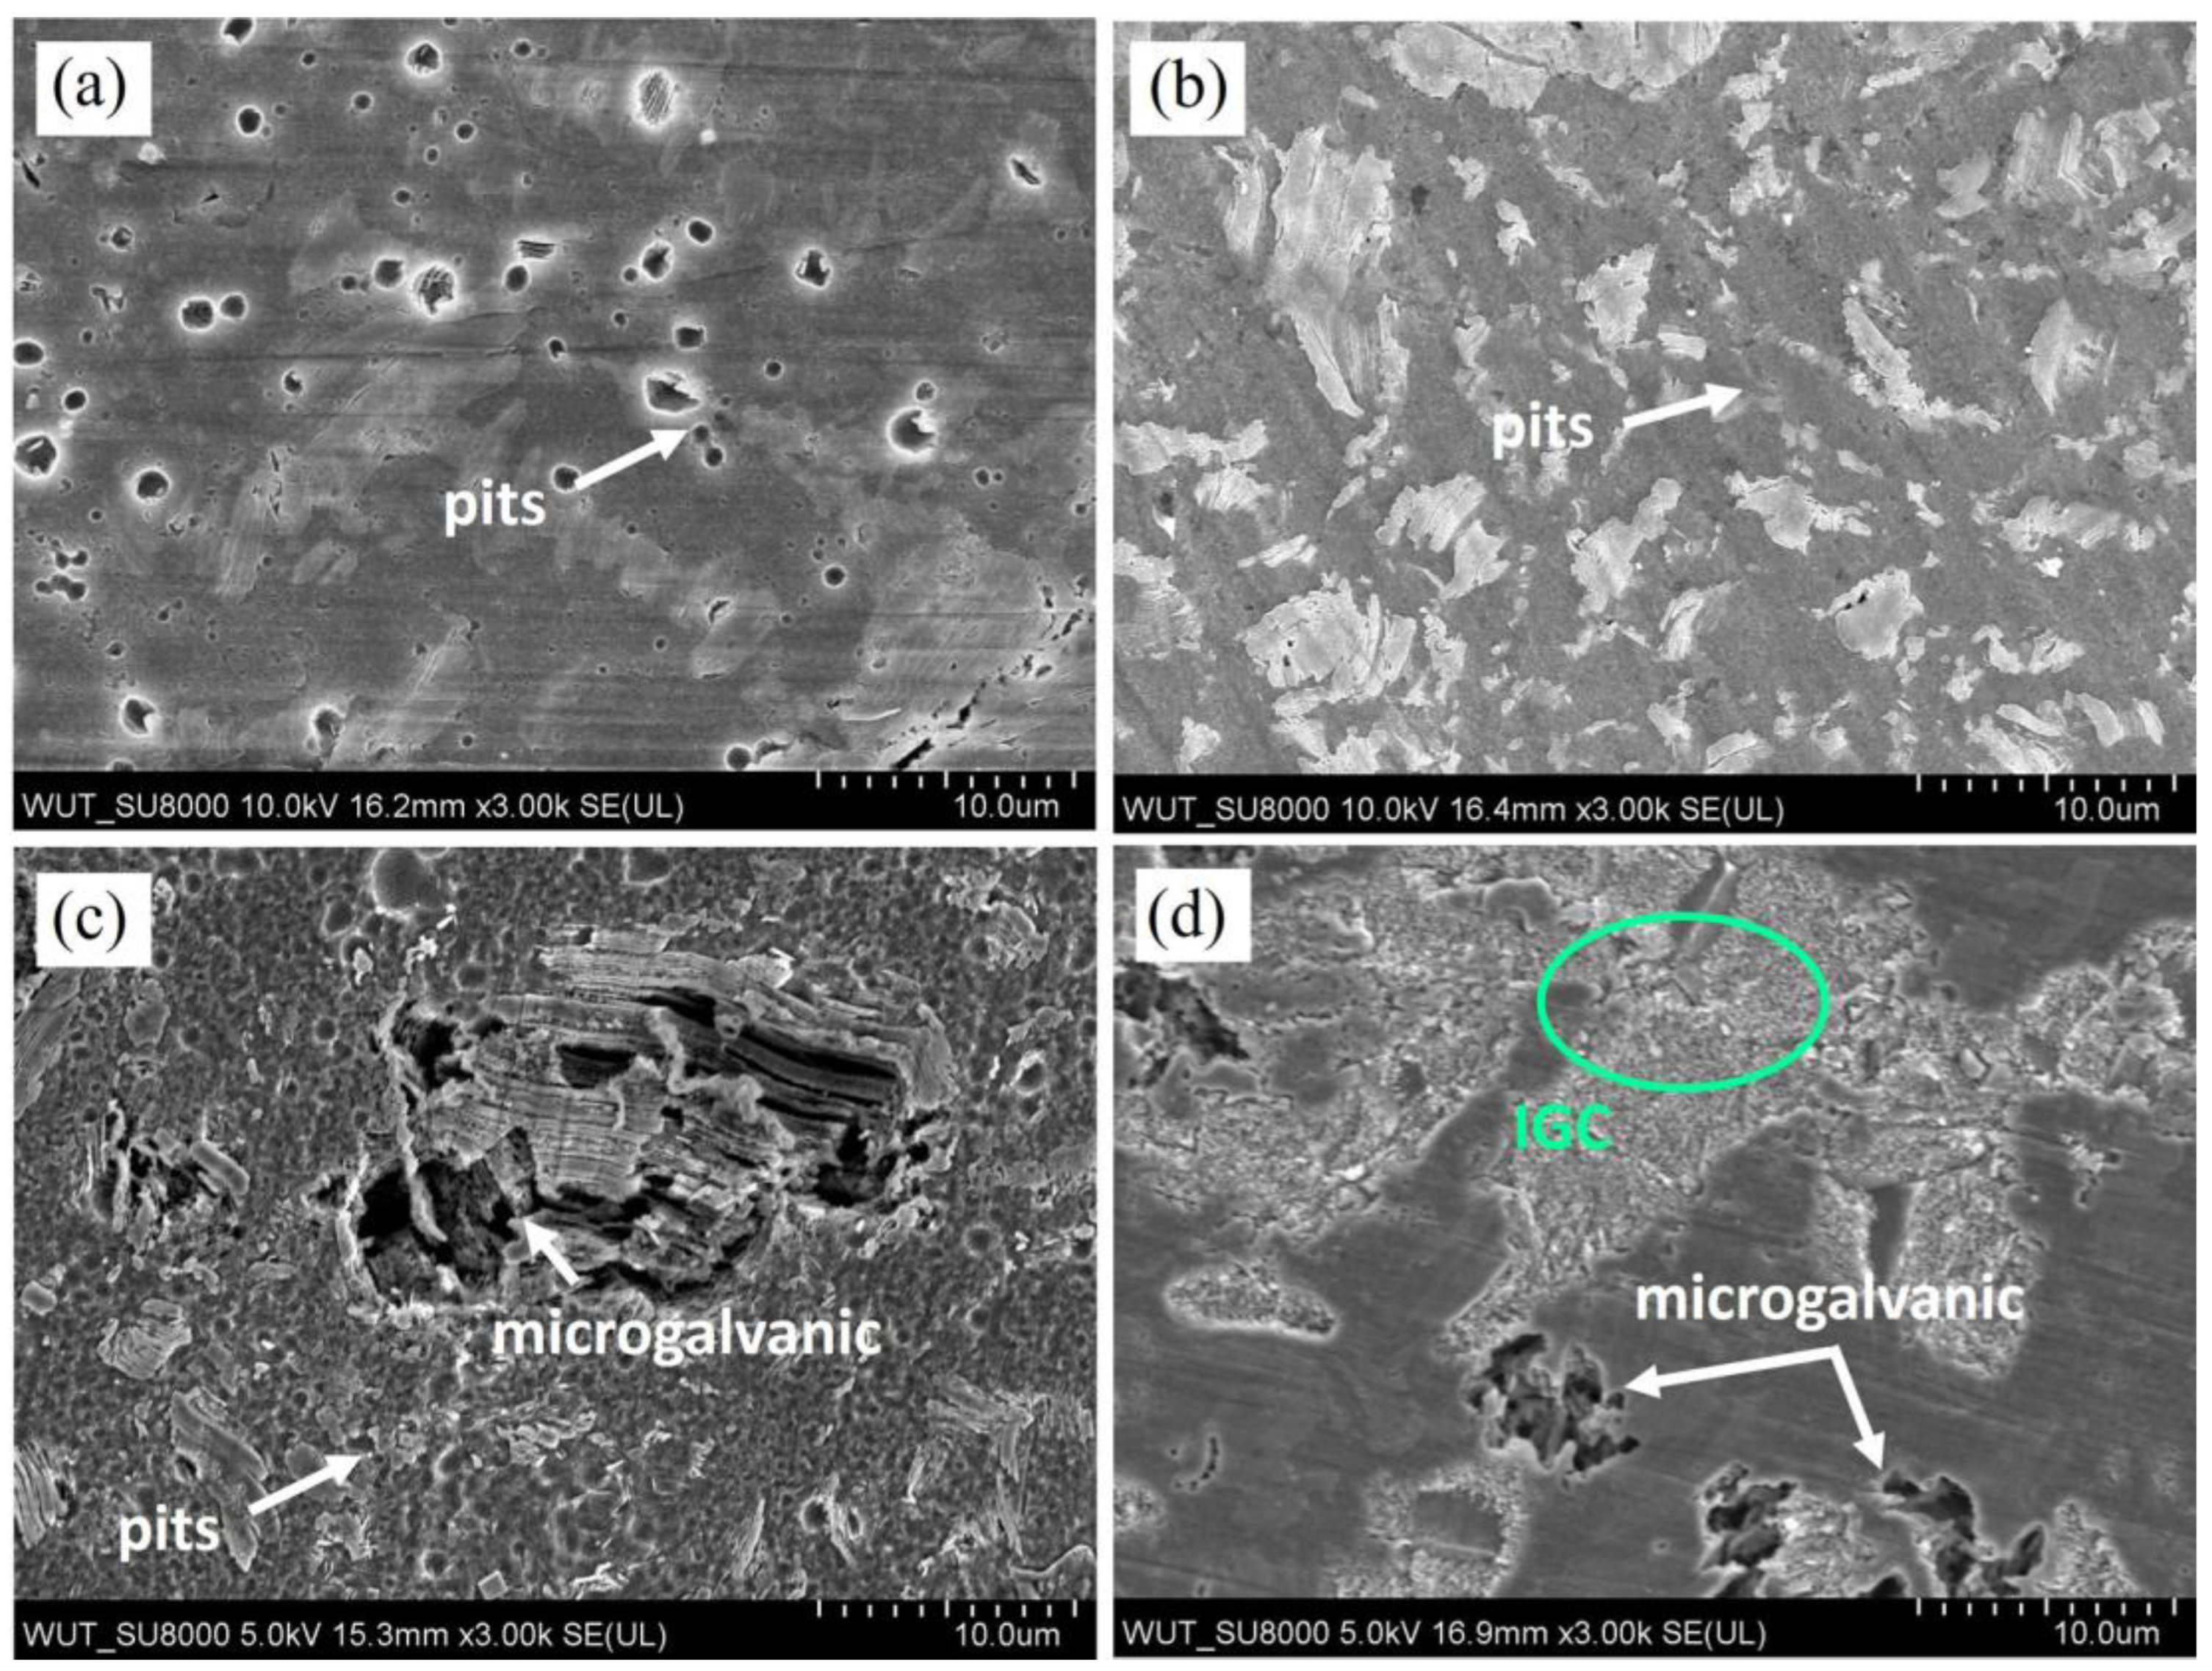
  • Depending on the corrosion medium, various corrosion mechanisms dominate. In 0.01 M NaCl and 0.1 M NaCl pitting is the dominant mechanism, while in 1M NaCl, pitting and microgalvanic corrosion between LPSO phase-Mg matrix occur. In PBS, microgalvanic and intragranular corrosion formed; however, their attack was partially slowed down by the formation of corrosion products containing P;
  • Although PBS is a more complex medium for unveiling mechanistic information regarding the degradation of Mg-LPSO alloys, it gives additional protection and thus more realistic results when the purpose of the work is the development of materials for biomedical applications.

Author Contributions

Conceptualization, A.D. and K.M.; methodology, A.D. and D.P.; software, D.P. and A.Z.; validation, A.D., D.D. and K.M.; formal analysis, D.P., A.Z. and A.D.; investigation, D.P. and A.D.; resources, K.M. and D.D.; data curation, A.D.; writing—original draft preparation, D.P.; writing—review and editing, A.D. and W.Ś.; visualization, D.P. and A.D.; supervision, W.Ś. and K.M.; funding acquisition, K.M. and W.Ś. All authors have read and agreed to the published version of the manuscript.

Funding

This research was realized under the project “Development of Advanced Magnesium Alloys for Multifunctional Applications in Extreme Environments” No. V4-JAPAN/2/15/MagMAX/2022 financed by the National Centre for Research and Development in Poland in the framework of Visegrad Group (V4)-Japan Joint Research Program—Advanced Materials. Support in the framework of Visegrad Group (V4)-Japan Joint Research Program—Advanced Materials under grant No. 8F21011, and support from the the Czech Science Foundation under grant No. 20-07384Y is gratefully acknowledged.

Data Availability Statement

The data presented in this study are available on request from the corresponding author.

Conflicts of Interest

The authors declare no conflict of interest. The funders had no role in the design of the study; in the collection, analyses, or interpretation of data; in the writing of the manuscript; or in the decision to publish the results.

References

  1. Yokota, A.; Matsushita, M.; Geshi, N.; Yamasaki, D.; Shinmei, T.; Yamasaki, M.; Kawamura, Y. Formation process of long-period stacking-ordered structures in Mg97Zn1Y2 alloy comprising HCP and cubic phases fabricated by high-pressure high-temperature annealing. Metals 2021, 11, 1031. [Google Scholar] [CrossRef]
  2. Wu, G.; Wang, C.; Sun, M.; Ding, W. Recent developments and applications on high-performance cast magnesium rare-earth alloys. J. Magnes. Alloy 2021, 9, 1–20. [Google Scholar] [CrossRef]
  3. Meier, J.M.; Miao, J.; Liang, S.M.; Zhu, J.; Zhang, C.; Caris, J.; Luo, A.A. Phase equilibria and microstructure investigation of Mg-Gd-Y-Zn alloy system. J. Magnes. Alloy 2021, 10, 689–696. [Google Scholar] [CrossRef]
  4. Li, J.; Albu, M.; Wu, Y.; Peng, L.; Dienstleder, M.; Kothleitner, G.; Hofer, F.; Schumacher, P. Precipitation of long-period stacking ordered structure in Mg-Gd-Zn-Mn Alloy. Adv. Eng. Mater. 2017, 19, 1600705. [Google Scholar] [CrossRef]
  5. Lu, F.; Ma, A.; Jiang, J.; Yang, D.; Zhou, Q. Review on long-period stacking-ordered structures in Mg-Zn-RE alloys. Rare Met. 2012, 31, 303–310. [Google Scholar] [CrossRef]
  6. Nie, Y.; Dai, J.; Li, X.; Zhang, X. Recent developments on corrosion behaviors of Mg alloys with stacking fault or long period stacking ordered structures. J. Magnes. Alloy 2021, 9, 1123–1146. [Google Scholar] [CrossRef]
  7. Yang, L.; Huang, Y.; Feyerabend, F.; Willumeit, R.; Mendis, C.; Kainer, K.U.; Hort, N. Microstructure, mechanical and corrosion properties of Mg–Dy–Gd–Zr alloys for medical applications. Acta Biomater. 2013, 9, 8499–8508. [Google Scholar] [CrossRef] [PubMed] [Green Version]
  8. Zhang, X.; Ba, Z.; Wang, Z.; Wu, Y.; Xue, Y. Effect of LPSO structure on mechanical properties and corrosion behavior of as-extruded GZ51K magnesium alloy. Mater. Lett. 2016, 163, 250–253. [Google Scholar] [CrossRef]
  9. Chen, R.; Sandlöbes, S.; Zeng, X.; Li, D.; Korte-Kerzel, S.; Raabe, D. Room temperature deformation of LPSO structures by non-basal slip. Mater. Sci. Eng. A 2017, 682, 354–358. [Google Scholar] [CrossRef]
  10. Wang, W.Y.; Shang, S.L.; Wang, Y.; Darling, K.A.; Kecskes, L.J.; Mathaudhu, S.N.; Hui, X.D.; Liu, Z.K. Electronic structures of long periodic stacking order structures in Mg: A first-principles study. J. Alloys Compd. 2014, 586, 656–662. [Google Scholar] [CrossRef]
  11. Briffod, F.; Shiraiwa, T.; Enoki, M. The effect of the 18R-LPSO phase on the fatigue behavior of extruded Mg/LPSO two-phase alloy through a comparative experimental-numerical study. J. Magnes. Alloy 2021, 9, 130–143. [Google Scholar] [CrossRef]
  12. Shao, J.; Chen, Z.; Chen, T.; Hu, Z.; Zhou, X.; Liu, C. The effect of LPSO on the deformation mechanism of Mg–Gd–Y–Zn–Zr magnesium alloy. J. Magnes. Alloy 2016, 4, 83–88. [Google Scholar] [CrossRef] [Green Version]
  13. Hagihara, K.; Okamoto, T.; Izuno, H.; Yamasaki, M.; Matsushita, M.; Nakano, T.; Kawamura, Y. Plastic deformation behavior of 10H-type synchronized LPSO phase in a Mg–Zn–Y system. Acta Mater. 2016, 109, 90–102. [Google Scholar] [CrossRef]
  14. Tahreen, N.; Chen, D.L. A critical review of Mg-Zn-Y series alloys containing I, W, and LPSO phases. Adv. Eng. Mater. 2016, 18, 1983–2002. [Google Scholar] [CrossRef]
  15. Zhao, R.; Wang, J.; Zhang, J.; Zhang, L.; Zhang, J.; Xu, C.; Guo, W. Enhanced performance of Mg–Zn–Y–Mn Alloy via minor Ca addition. Adv. Eng. Mater. 2019, 21, 1900908. [Google Scholar] [CrossRef]
  16. Horváth, K.; Drozdenko, D.; Daniš, S.; Garcés, G.; Máthis, K.; Kim, S.; Dobroň, P. Characterization of microstructure and mechanical properties of Mg-Y-Zn alloys with respect to different content of LPSO phase. Adv. Eng. Mater. 2018, 20, 1700396. [Google Scholar] [CrossRef]
  17. Zhao, D.; Zhao, C.; Chen, X.; Huang, Y.; Hort, N.; Gavras, S.; Pan, F. Compressive deformation of as-extruded LPSO-containing Mg alloys at different temperatures. J. Mater. Res. Technol. 2022, 16, 944–959. [Google Scholar] [CrossRef]
  18. Liu, H.; Cheng, Z.; Yan, K.; Yan, J.; Bai, J.; Jiang, J.; Ma, A. Effect of multi-pass equal channel angular pressing on the microstructure and mechanical properties of a heterogeneous Mg88Y8Zn4 Alloy. J. Mater. Sci. Technol. 2016, 32, 1274–1281. [Google Scholar] [CrossRef]
  19. Inoue, A.; Kawamura, Y.; Matsushita, M.; Hayashi, K.; Koike, J. Novel hexagonal structure and ultrahigh strength of magnesium solid solution in the Mg–Zn–Y system. J. Mater. Res. 2001, 16, 1894–1900. [Google Scholar] [CrossRef] [Green Version]
  20. Fekete, K.H.; Drozdenko, D.; Čapek, J.; Máthis, K.; Tolnai, D.; Stark, A.; Garcés, G.; Dobroň, P. Hot deformation of Mg-Y-Zn alloy with a low content of the LPSO phase studied by in-situ synchrotron radiation diffraction. J. Magnes. Alloy 2020, 8, 199–209. [Google Scholar] [CrossRef]
  21. Pérez, P.; Cabeza, S.; Garcés, G.; Adeva, P. Influence of long period stacking ordered phase arrangements on the corrosion behaviour of extruded Mg97Y2Zn1 alloy. Corros. Sci. 2016, 107, 107–112. [Google Scholar] [CrossRef]
  22. Li, C.Q.; Xu, D.K.; Zeng, Z.R.; Wang, B.J.; Sheng, L.Y.; Chen, X.-B.; Han, E.H. Effect of volume fraction of LPSO phases on corrosion and mechanical properties of Mg-Zn-Y alloys. Mater. Des. 2017, 121, 430–441. [Google Scholar] [CrossRef]
  23. Wang, Y.; Zhang, Y.; Wang, P.; Zhang, D.; Yu, B.; Xu, Z.; Jiang, H. Effect of LPSO phases and aged-precipitations on corrosion behavior of as-forged Mg–6Gd–2Y–1Zn–0.3Zr alloy. J. Mater. Res. Technol. 2020, 9, 7087–7099. [Google Scholar] [CrossRef]
  24. Wang, L.S.; Jiang, J.H.; Saleh, B.; Xie, Q.Y.; Xu, Q.; Liu, H.; Ma, A.B. Controlling Corrosion Resistance of a Biodegradable Mg–Y–Zn Alloy with LPSO Phases via Multi-pass ECAP Process. Acta Metall. Sin. (Engl. Lett.) 2020, 33, 1180–1190. [Google Scholar] [CrossRef]
  25. Wejrzanowski, T.; Kurzydlowski, K.J. Stereology of grains in nano-crystals. Solid State Phenom. 2003, 94, 221–228. [Google Scholar] [CrossRef]
  26. Wejrzanowski, T.; Lewandowska, M.; Kurzydłowski, K.J. Stereology of nano-materials. Image Anal. Stereol. 2010, 29, 1–12. [Google Scholar] [CrossRef] [Green Version]
  27. ASTM G1; Standard Practice for Preparing, Cleaning, and Evaluation Corrosion Test Specimens. ASTM: West Conshohocken, PA, USA, 1999.
  28. Abe, E.; Ono, A.; Itoi, T.; Yamasaki, M.; Kawamura, Y. Polytypes of long-period stacking structures synchronized with chemical order in a dilute Mg–Zn–Y alloy. Philos. Mag. Lett. 2011, 91, 690–696. [Google Scholar] [CrossRef] [Green Version]
  29. Oñorbe, E.; Garcés, G.; Pérez, P.; Adeva, P. Effect of the LPSO volume fraction on the microstructure and mechanical properties of Mg-Y 2X -Zn X alloys. J. Mater. Sci. 2012, 47, 1085–1093. [Google Scholar] [CrossRef] [Green Version]
  30. Dobkowska, A.; Adamczyk-Cieślak, B.; Koralnik, M.; Chromiński, W.; Kubasek, J.; Ciftci, J.; Kuc, D.; Mizera, J. Corrosion behavior of fine-grained Mg-7.5Li-3Al-1Zn fabricated by extrusion with a forward-backward rotating die (KoBo). J. Magnes. Alloy 2021, 10, 811–820. [Google Scholar] [CrossRef]
  31. Yang, L.; Jiang, Q.; Zheng, M.; Hou, B.; Li, Y. Corrosion behavior of Mg-8Li-3Zn-Al alloy in neutral 3.5% NaCl solution. J. Magnes. Alloy 2016, 4, 22–26. [Google Scholar] [CrossRef]
  32. Poorqasemi, E.; Abootalebi, O.; Peikari, M.; Haqdar, F. Investigating accuracy of the Tafel extrapolation method in HCl solutions. Corros. Sci. 2009, 51, 1043–1054. [Google Scholar] [CrossRef]
  33. Leleu, S.; Rives, B.; Causse, N.; Pébère, N. Corrosion rate determination of rare-earth Mg alloys in a Na2SO4 solution by electrochemical measurements and inductive coupled plasma-optical emission spectroscopy. J. Magnes. Alloy 2019, 7, 47–57. [Google Scholar] [CrossRef]
  34. Hara, N.; Kobayashi, Y.; Kagaya, D.; Akao, N. Formation and breakdown of surface films on magnesium and its alloys in aqueous solutions. Corros. Sci. 2007, 49, 166–175. [Google Scholar] [CrossRef]
  35. Ishizaki, T.; Masuda, Y.; Teshima, K. Composite film formed on magnesium alloy AZ31 by chemical conversion from molybdate/phosphate/fluorinate aqueous solution toward corrosion protection. Surf. Coat. Technol. 2013, 217, 76–83. [Google Scholar] [CrossRef]
  36. Dinodi, N.; Nityananda Shetty, A. Electrochemical investigations on the corrosion behaviour of magnesium alloy ZE41 in a combined medium of chloride and sulphate. J. Magnes. Alloy 2013, 1, 201–209. [Google Scholar] [CrossRef] [Green Version]
  37. Izumi, S.; Yamasaki, M.; Kawamura, Y. Relation between corrosion behavior and microstructure of Mg–Zn–Y alloys prepared by rapid solidification at various cooling rates. Corros. Sci. 2009, 51, 395–402. [Google Scholar] [CrossRef]
Figure 1. Optical microstructures of the investigated alloys: (a) WZ42—surface parallel to the extrusion direction, (b) WZ104—surface parallel to the extrusion direction, (c) WZ42—surface perpendicular to the extrusion direction, (d) WZ104—surface perpendicular to the extrusion direction. LPSO phases with a lamellar structure consisting of thin platelets are marked by the red arrows LPSO phases with block-like structures are marked by the yellow arrows.
Crystals 12 01723 g001
Figure 2. SEM microstructures of WZ42 and WZ104 alloys: (a) WZ42—surface perpendicular to the extrusion direction, (b) WZ104—surface perpendicular to the extrusion direction, (c) WZ42—surface parallel to the extrusion direction, (d) WZ104—surface parallel to the extrusion direction, (e) EDX analyses of the precipitations marked as P1 and P2, and EDX of LPSO structures formed in WZ42 and WZ104.
Crystals 12 01723 g002
Figure 3. Representative binary images showing LPSO fraction in the investigated alloys: (a) WZ42, (b) WZ104; surfaces perpendicular to the extrusion direction.
Crystals 12 01723 g003
Figure 4. EOCP evaluation recorded for the investigated materials during 1 h of immersion in 0.01 M NaCl, 0.1 M NaCl, 1 M NaCl, and PBS.
Crystals 12 01723 g004
Figure 5. Potentiodynamic curves obtained for the investigated materials after 1 h of immersion in (a) 0.01 M NaCl, (b) 0.1 M NaCl, (c) 1 M NaCl and (d) PBS.
Crystals 12 01723 g005
Figure 6. EIS results recorded for the investigated alloys after 1 h of immersion in 0.01 M NaCl, 0.1 M NaCl, 1 M NaCl, and PBS; (ad) Nyquist plots, and (eh) Bode plots.
Crystals 12 01723 g006
Figure 7. Equivalent electronic circuits used for data fitting of the investigated alloys after 1 h of immersion in various solutions: (a) WZ42, WZ104 in 0.01 M NaCl and WZ42, WZ104 in 0.1 M NaCl, (b) WZ42, WZ104 in 1 M NaCl, (c) Mg in 0.01 M NaCl and WZ42, WZ104 in PBS.
Crystals 12 01723 g007
Figure 8. Characterization of corroded surfaces of WZ42 after 1 h of immersion in naturally aerated (a) 0.01 M NaCl, (b) 0.1 M NaCl, (c) 1 M NaCl, and (d) PBS.
Crystals 12 01723 g008
Figure 9. Characterization of the corroded surfaces of WZ42 after corrosion products removal after 1 h of immersion in (a) 0.01 M NaCl, (b) 0.1 M NaCl, (c) 1 M NaCl, and (d) PBS.
Crystals 12 01723 g009
Figure 10. Characterization of the corroded surfaces of WZ104 after 1 h of immersion in naturally aerated (a) 0.01 M NaCl, (b) 0.1 M NaCl, (c) 1 M NaCl, and (d) PBS under aerated conditions.
Crystals 12 01723 g010
Figure 11. Characterization of the corroded surfaces of WZ104 after corrosion products removal after 1 h of immersion in naturally aerated (a) 0.01 M NaCl, (b) 0.1 M NaCl, (c) 1 M NaCl, and (d) PBS under aerated conditions.
Crystals 12 01723 g011
Table 1. Chemical composition of WZ42 and WZ104 alloys, wt.% [16]).
Elements (wt.%)MgYZn
WZ4294.93.51.6
WZ10486.310.0 3.7
Table 2. Electrochemical parameters calculated from fitting of the potentiodynamic polarization curves (Ecorr—corrosion potential, icorr—corrosion current density, Eb—breakdown potential).
Ecorr (V/Ref)icorr (µA/cm2)Eb (V/Ref)βc (V/Decade)Ecorr (V/Ref)icorr (µA/cm2)Eb (V/Ref)βc (V/Decade)
0.01 M NaCl0.1 M NaCl
Mg −1.3764n/a0.10n/an/an/an/a
WZ42−1.3814−0.760.31−1.4895−1.160.22
WZ104−1.2522−1.000.47−1.42124n/a0.25
1 M NaClPBS
WZ42−1.47155−1.350.18−1.47276−1.180.34
WZ104−1.44738n/a0.27−1.43389−1.100.38
Table 3. Characteristic electrochemical parameters delivered from EIS data fitting with the use of equivalent electronic circuits presented in Figure 7 after 1 h of immersion under aerated conditions.
Rs
(Ω∙cm2)
Rf
(Ω∙cm2)
CPEf
µSsa/cm2
n1Rct
(Ω∙cm2)
CPEct
µSsa/cm2
n2RL
(Ω∙cm2)
L
(H∙cm2)
0.01 M NaCl
Mg309202110.91254290.99216987
WZ42243n/an/an/a1099140.925473180
WZ104293n/an/an/a954240.882721118
0.1 M NaCl
WZ4237n/an/an/a233170.924411204
WZ10437n/an/an/a138370.89198757
1 M NaCl
WZ425n/an/an/a468220.91207545
WZ1044n/an/an/a208840.80375963
PBS
WZ4220365350.8874912140.7483412,250
WZ10421472380.8866615680.8784625,000
Publisher’s Note: MDPI stays neutral with regard to jurisdictional claims in published maps and institutional affiliations.

