Article

Three-Component Covalent Organic Framework Nanosheets for the Detection of MicroRNAs

1
Zhuhai Rundu Pharmaceutical Co., Ltd., Zhuhai 519040, China
2
GDMPA Key Laboratory for Process Control and Quality Evaluation of Chiral Pharmaceuticals, School of Chemistry, South China Normal University, Guangzhou 510006, China
3
Guangzhou Key Laboratory of Analytical Chemistry for Biomedicine, School of Chemistry, South China Normal University, Guangzhou 510006, China
*
Authors to whom correspondence should be addressed.
These authors contributed equally to this work.
Crystals 2022, 12(11), 1628; https://doi.org/10.3390/cryst12111628
Submission received: 21 October 2022 / Revised: 6 November 2022 / Accepted: 9 November 2022 / Published: 13 November 2022
(This article belongs to the Special Issue Covalent Organic Frameworks)

Abstract

:
The development of new techniques for the detection of microRNAs (miRNAs) is highly desirable. Herein, a new crystalline three-component covalent organic framework (COF) termed EB-TAPB-TFP COF was synthesized under solvothermal conditions utilizing 1,3,5-triformylphloroglucinol, 1,3,5-tris(4-aminophenyl)benzene and ethidium bromide as monomers. Interestingly, EB-TAPB-TFP COF can be self-exfoliated into two-dimensional nanosheets (NSs) in an aqueous medium. The obtained EB-TAPB-TFP NSs exhibited a remarkable fluorescence intensity enhancement in the presence of a DNA-miRNA heteroduplex when compared to the presence of single-stranded DNA and other phosphate-based small molecules, making it promising in the detection of miRNA without tagging any fluorescent marker. Moreover, the EB-TAPB-TFP NSs can also be used as sensing material for the detection of a DNA-miRNA heteroduplex using the quartz crystal microbalance technique, which is in good agreement with the fluorescence sensing result. The exploration of COF-based sensors in this work demonstrates a new pathway for the selective detection of miRNAs.

1. Introduction

MiRNAs are a class of endogenous, noncoding small RNA molecules (roughly 22 nucleotides) that can serve as gene-expression regulators [1]. It has been proven that miRNAs can be utilized as new potential diagnostic markers for diseases; thus, the detection of miRNAs has attracted extensive attention over the past decade [2,3,4]. A series of different traditional approaches (for instance, real-time polymerase chain reaction (RT-PCR) [5], northern blotting [6] and microarray-based assays [7]) have been used wildly for the determination of miRNAs. However, the above-mentioned methods have some drawbacks, such as being time-consuming, expensive, involving complicated steps, and so on. Therefore, on the basis of new functional materials or sensing platforms, a great number of determination technologies have been explored in recent years [8,9,10].
In this context, two-dimensional (2D) nanomaterials, such as metal–organic frameworks (MOFs) [11,12,13,14,15,16,17,18], COFs [19,20,21,22,23,24,25,26,27,28], graphitic carbon nitride (g-C3N4) [29], transition metal dichalcogenides (TMDs) [30], black phosphorene (BP) [31,32] and graphene [33,34], have shown great potential for the detection of biomolecules. In particular, 2D COF NSs, a new member in the family of 2D nanomaterials, have recently attracted much interest in the field of biosensing owing to their low density, large surface area and excellent chemical stability [19]. Indeed, two typical approaches have been exploited for the fluorescence recognition of biomolecules when employing 2D COF NSs as sensing materials [35,36,37,38]. In the first approach developed by Zhang and coworkers, ultrathin TPA-COF NSs were prepared and utilized as a novel sensing platform for the highly sensitive and selective determination of DNA [35]. Nevertheless, such a method can only identify DNA biomolecules labeled with fluorescent dyes, which, to some extent, may limit their actual applications. To address this issue, an alternative approach has been recently explored by Ajayaghosh’s group, in which two-component fluorescence COF NSs were prepared for label-free DNA detection [38]. However, the sensitivity of such a detection method still requires further improvement. Furthermore, studies on the utilization of self-exfoliated 2D fluorescence COF NSs for the label-free and sensitive detection of DNA or RNA remain extremely scarce, and undoubtedly it is necessary for this to be further investigated.
Herein, by elaborately selecting the geometries of organic building blocks and their connection patterns, a new three-component 2D COF, namely, EB-TAPB-TFP COF, was successfully synthesized using 1,3,5-triformylphloroglucinol (TFP), 1,3,5-tris(4-aminophenyl)benzene (TAPB) and ethidium bromide (EB) as linkers. Interestingly, the obtained EB-TAPB-TFP COF can be facilely self-exfoliated into nanosheets (EB-TAPB-TFP NSs) in water. The EB-TAPB-TFP NSs were used as a fluorescence sensing platform for the specific recognition of a PDNA-miRNA heteroduplex, prepared by hybridization of a probe DNA (PDNA) with its complementary target miRNA (let-7). Such a platform allows the identification of total/partial complementary label-free miRNA strands. Moreover, the EB-TAPB-TFP NSs can also be used as sensing material for the determination of a PDNA-miRNA heteroduplex on a quartz crystal microbalance (QCM) sensor, which is consistent with the result of fluorescence sensing. To the best of the authors’ knowledge, this work presents the first case of the implementation of COF-based miRNA detection within a QCM sensor.

2. Experimental Section

2.1. Reagents and Instruments

All of the chemicals and reagents were commercially available and used without additional purification. TAPB (99%) and TFP (99%) were purchased from Shanghai Kylpharm Co., Ltd. (Shanghai, China). EB (99%), monobasic phosphate (MBP), dibasic phosphate (DBP), adenosine monophosphate (AMP), adenosine diphosphate (ADP) and adenosine triphosphate (ATP) were purchased from Macklin Inc. (Shanghai, China). HPLC-purified miRNA and DNA were obtained from Sangon Biotech Co., Ltd. (Shanghai, China). The sequences of DNA and miRNAs, including let-7a, let-7c, let-7b and miR221, are listed in Table S1 in the Supporting Information.
Fourier transform infrared (FT-IR) spectra were recorded on a Spectrum Two Fourier Transform Infrared Spectrometer (Perkin-Elmer, America). Power X-ray diffraction (PXRD) patterns were acquired on a Ultima IV X-ray Powder Diffractometer (Rigaku, Japan) operating at 40 mA and 40 kV using Cu Kα radiation (λ = 0.15418 nm). Thermogravimetric analysis (TGA) was carried out using a TG 209 F3 Thermogravimetric Analyzer (Netzsch, Germany) at a heating rate of 10 °C min−1 under nitrogen protection. Nitrogen adsorption–desorption isotherms were measured at liquid nitrogen temperature, using an ASAP 2020 Plus HD88 surface area and porosity analyzer (Mike, America). The samples were degassed for 12 h at 100 °C before the measurements. Surface areas were calculated by the Brunauer–Emmett–Teller (BET) method. The morphology and structure observations were performed on a ZEISS Gemini 500 field emission scanning electron microscope (FE-SEM, Carl Zeiss, Germany). The solid-state 13C NMR spectrum was recorded on a AS400MHz spectrometer (Varian, Germany). Fluorescence experiments were performed on an F4600 fluorescence analysis instrument (Hitachi, Japan). Zeta potentials were recorded by a Zetasizer Nano ZS90 system (Malvern, England). The thickness observation was taken on a Dimension Icon atomic force microscope (AFM, Bruker, Germany).

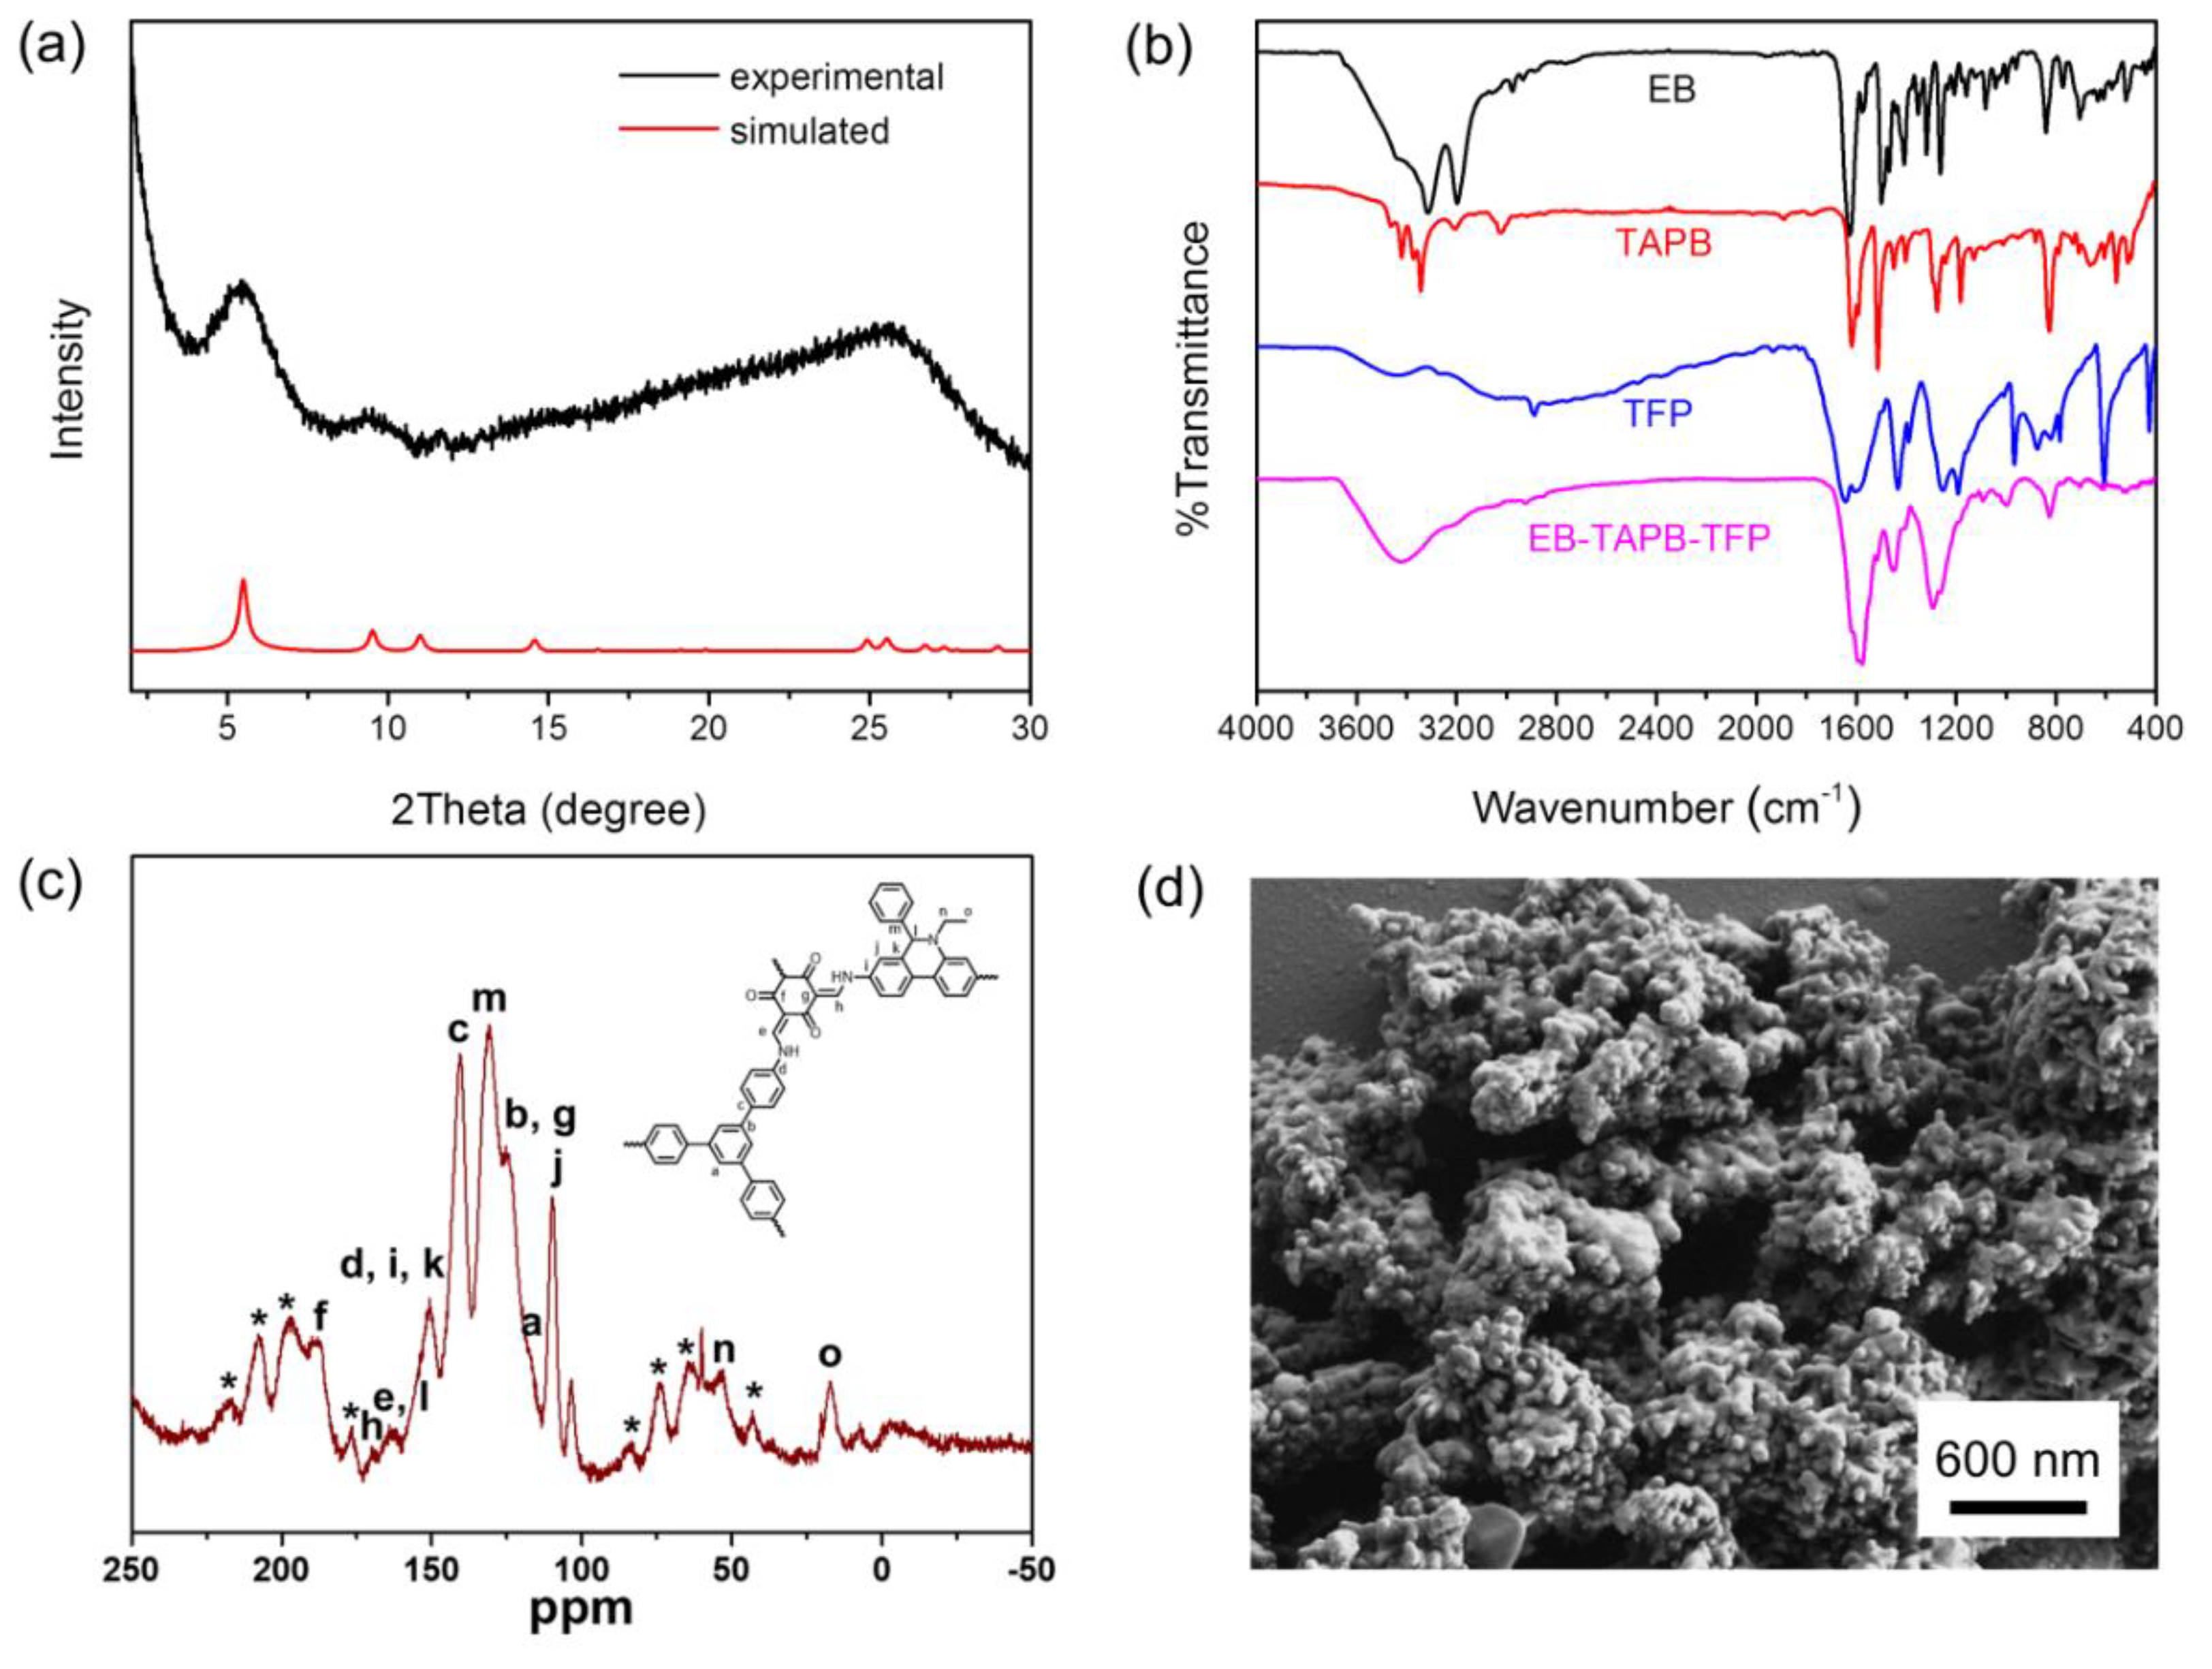
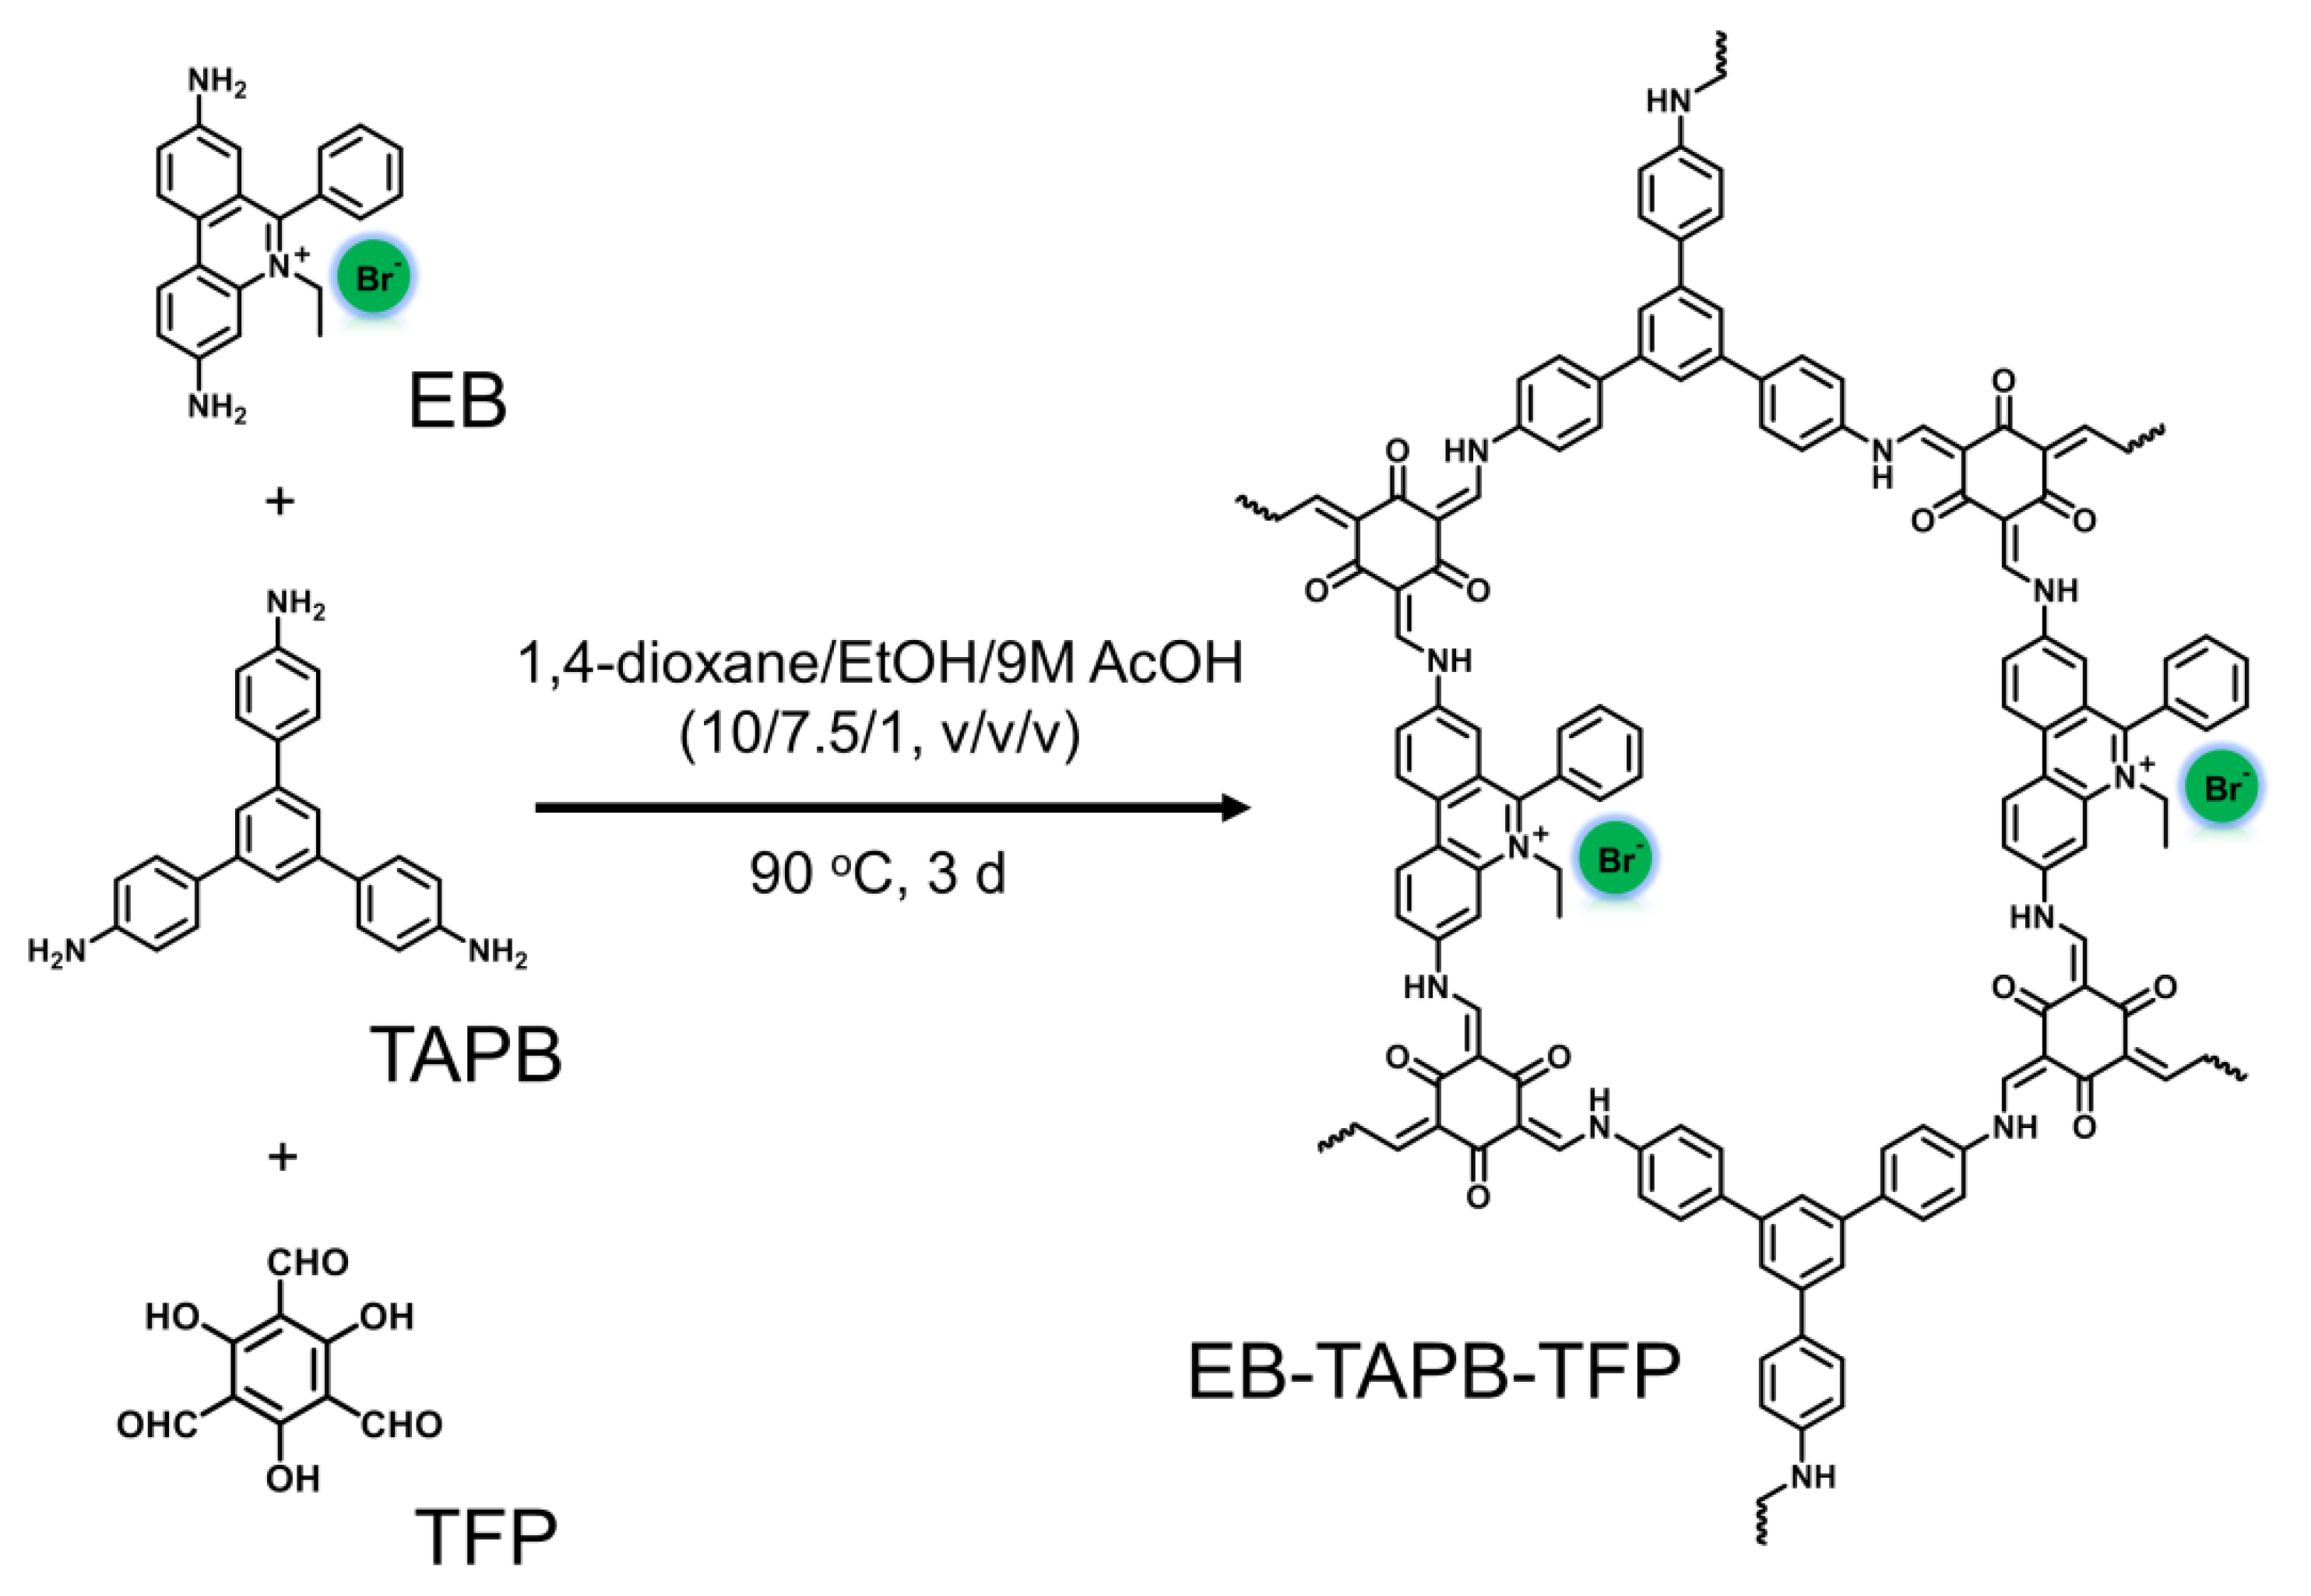
2.2. Preparation of EB-TAPB-TFP COF

EB (30.7 mg, 0.078 mmol), TAPB (27 mg, 0.078 mmol) and TFP (27 mg, 0.13 mmol) in a mixture of dioxane (1.0 mL) and EtOH (0.40 mL) were added to a 10 mL vial and sonicated for 10 min. Then, 0.10 mL of acetic acid solution (6 M) was added. Subsequently, the resulting mixture was rapidly sealed and deoxygenated with argon for 15 min. After heating in an oven at 110 °C for 3 days, the mixture was cooled to room temperature, and the solid was collected by filtration, washed successively with THF and MeOH, and dried under vacuum to produce dark-red solids of EB-TAPB-TFP COF (73.6 mg, 92% yield).

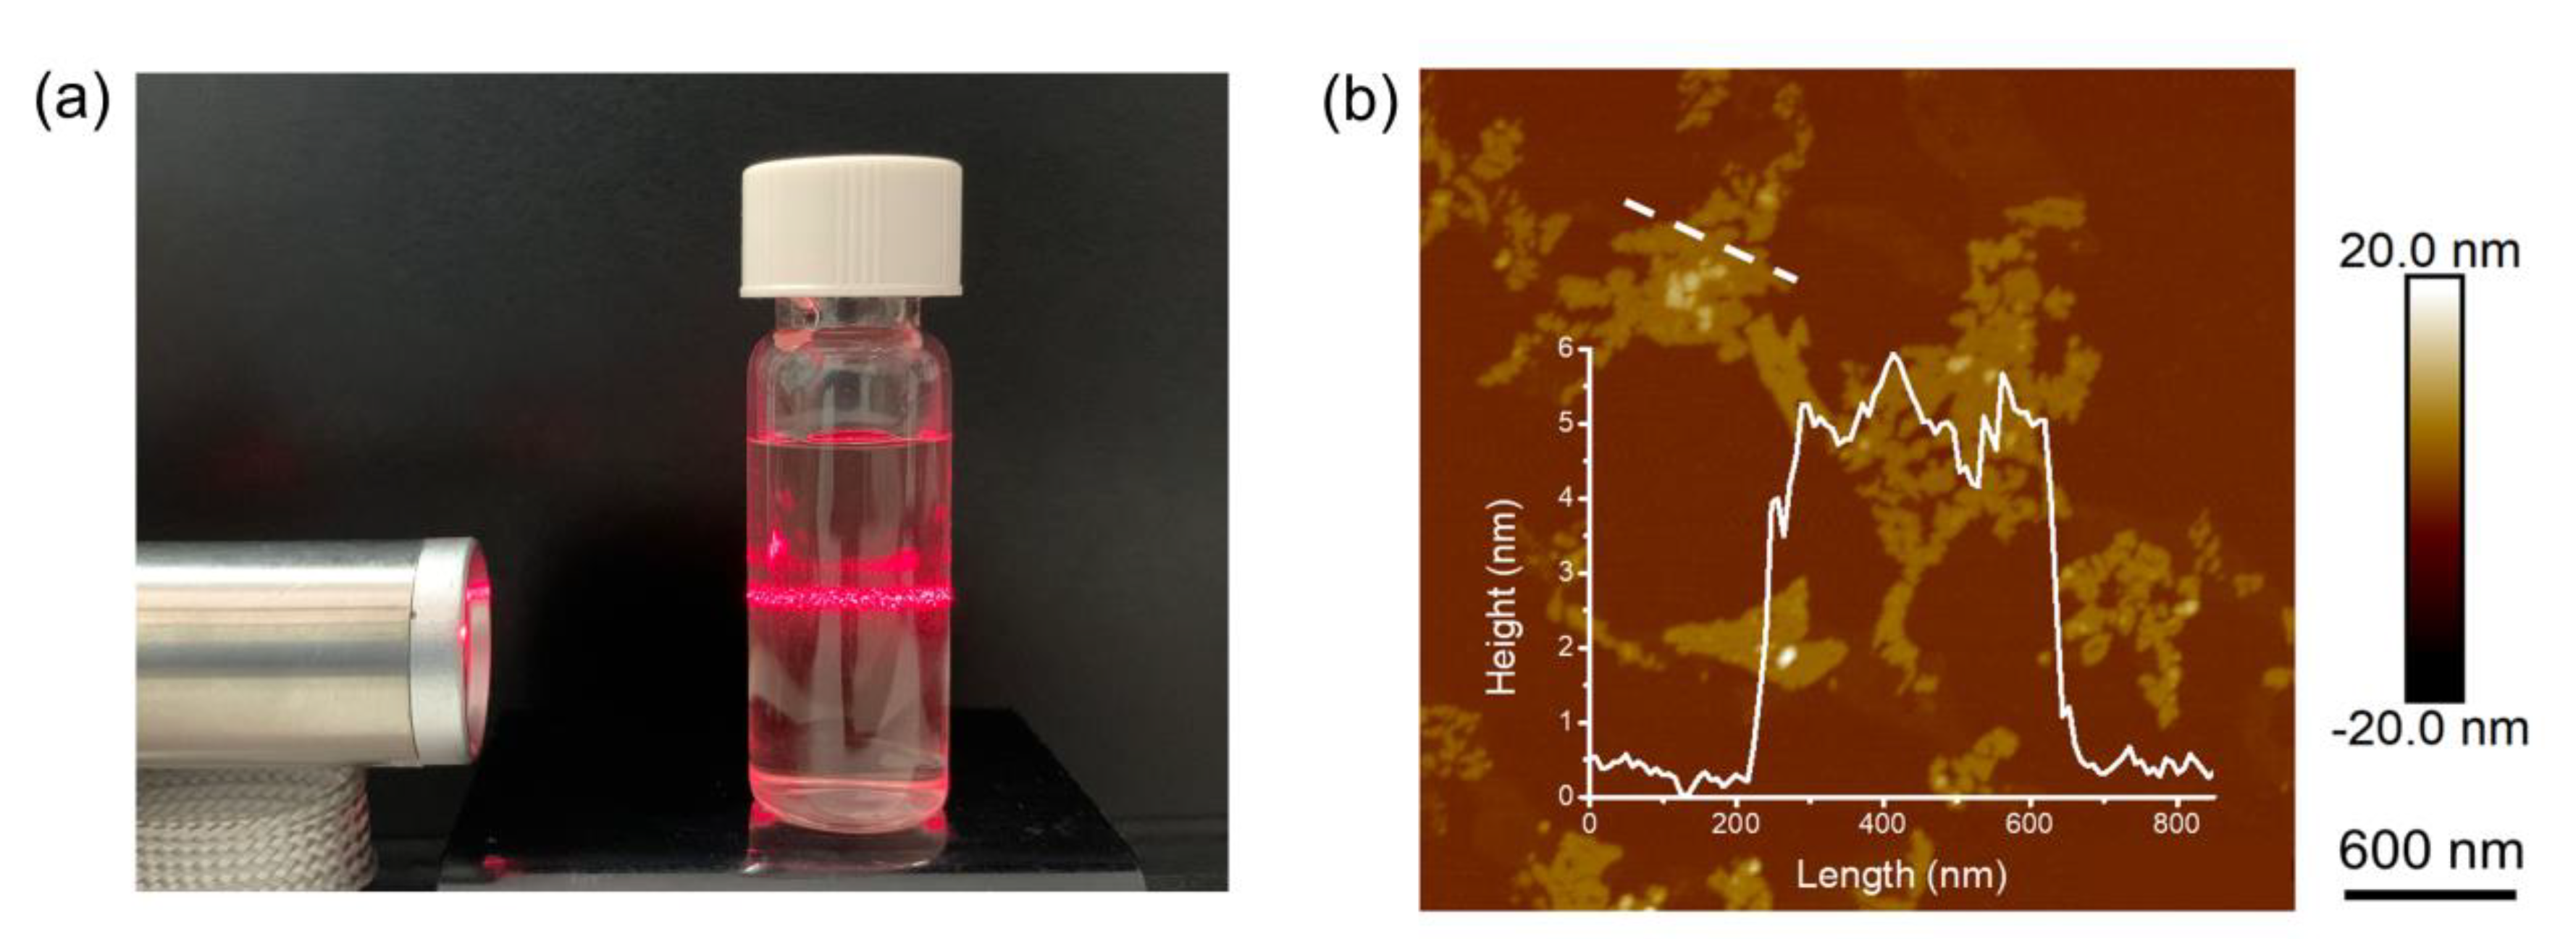
2.3. Preparation of EB-TAPB-TFP NSs

Self-exfoliation of EB-TAPB-TFP was carried out by suspending 2.0 mg EB-TAPB-TFP COF powder in 4.0 mL ultrapure water without any physical or chemical disturbance at room temperature for 48 h.

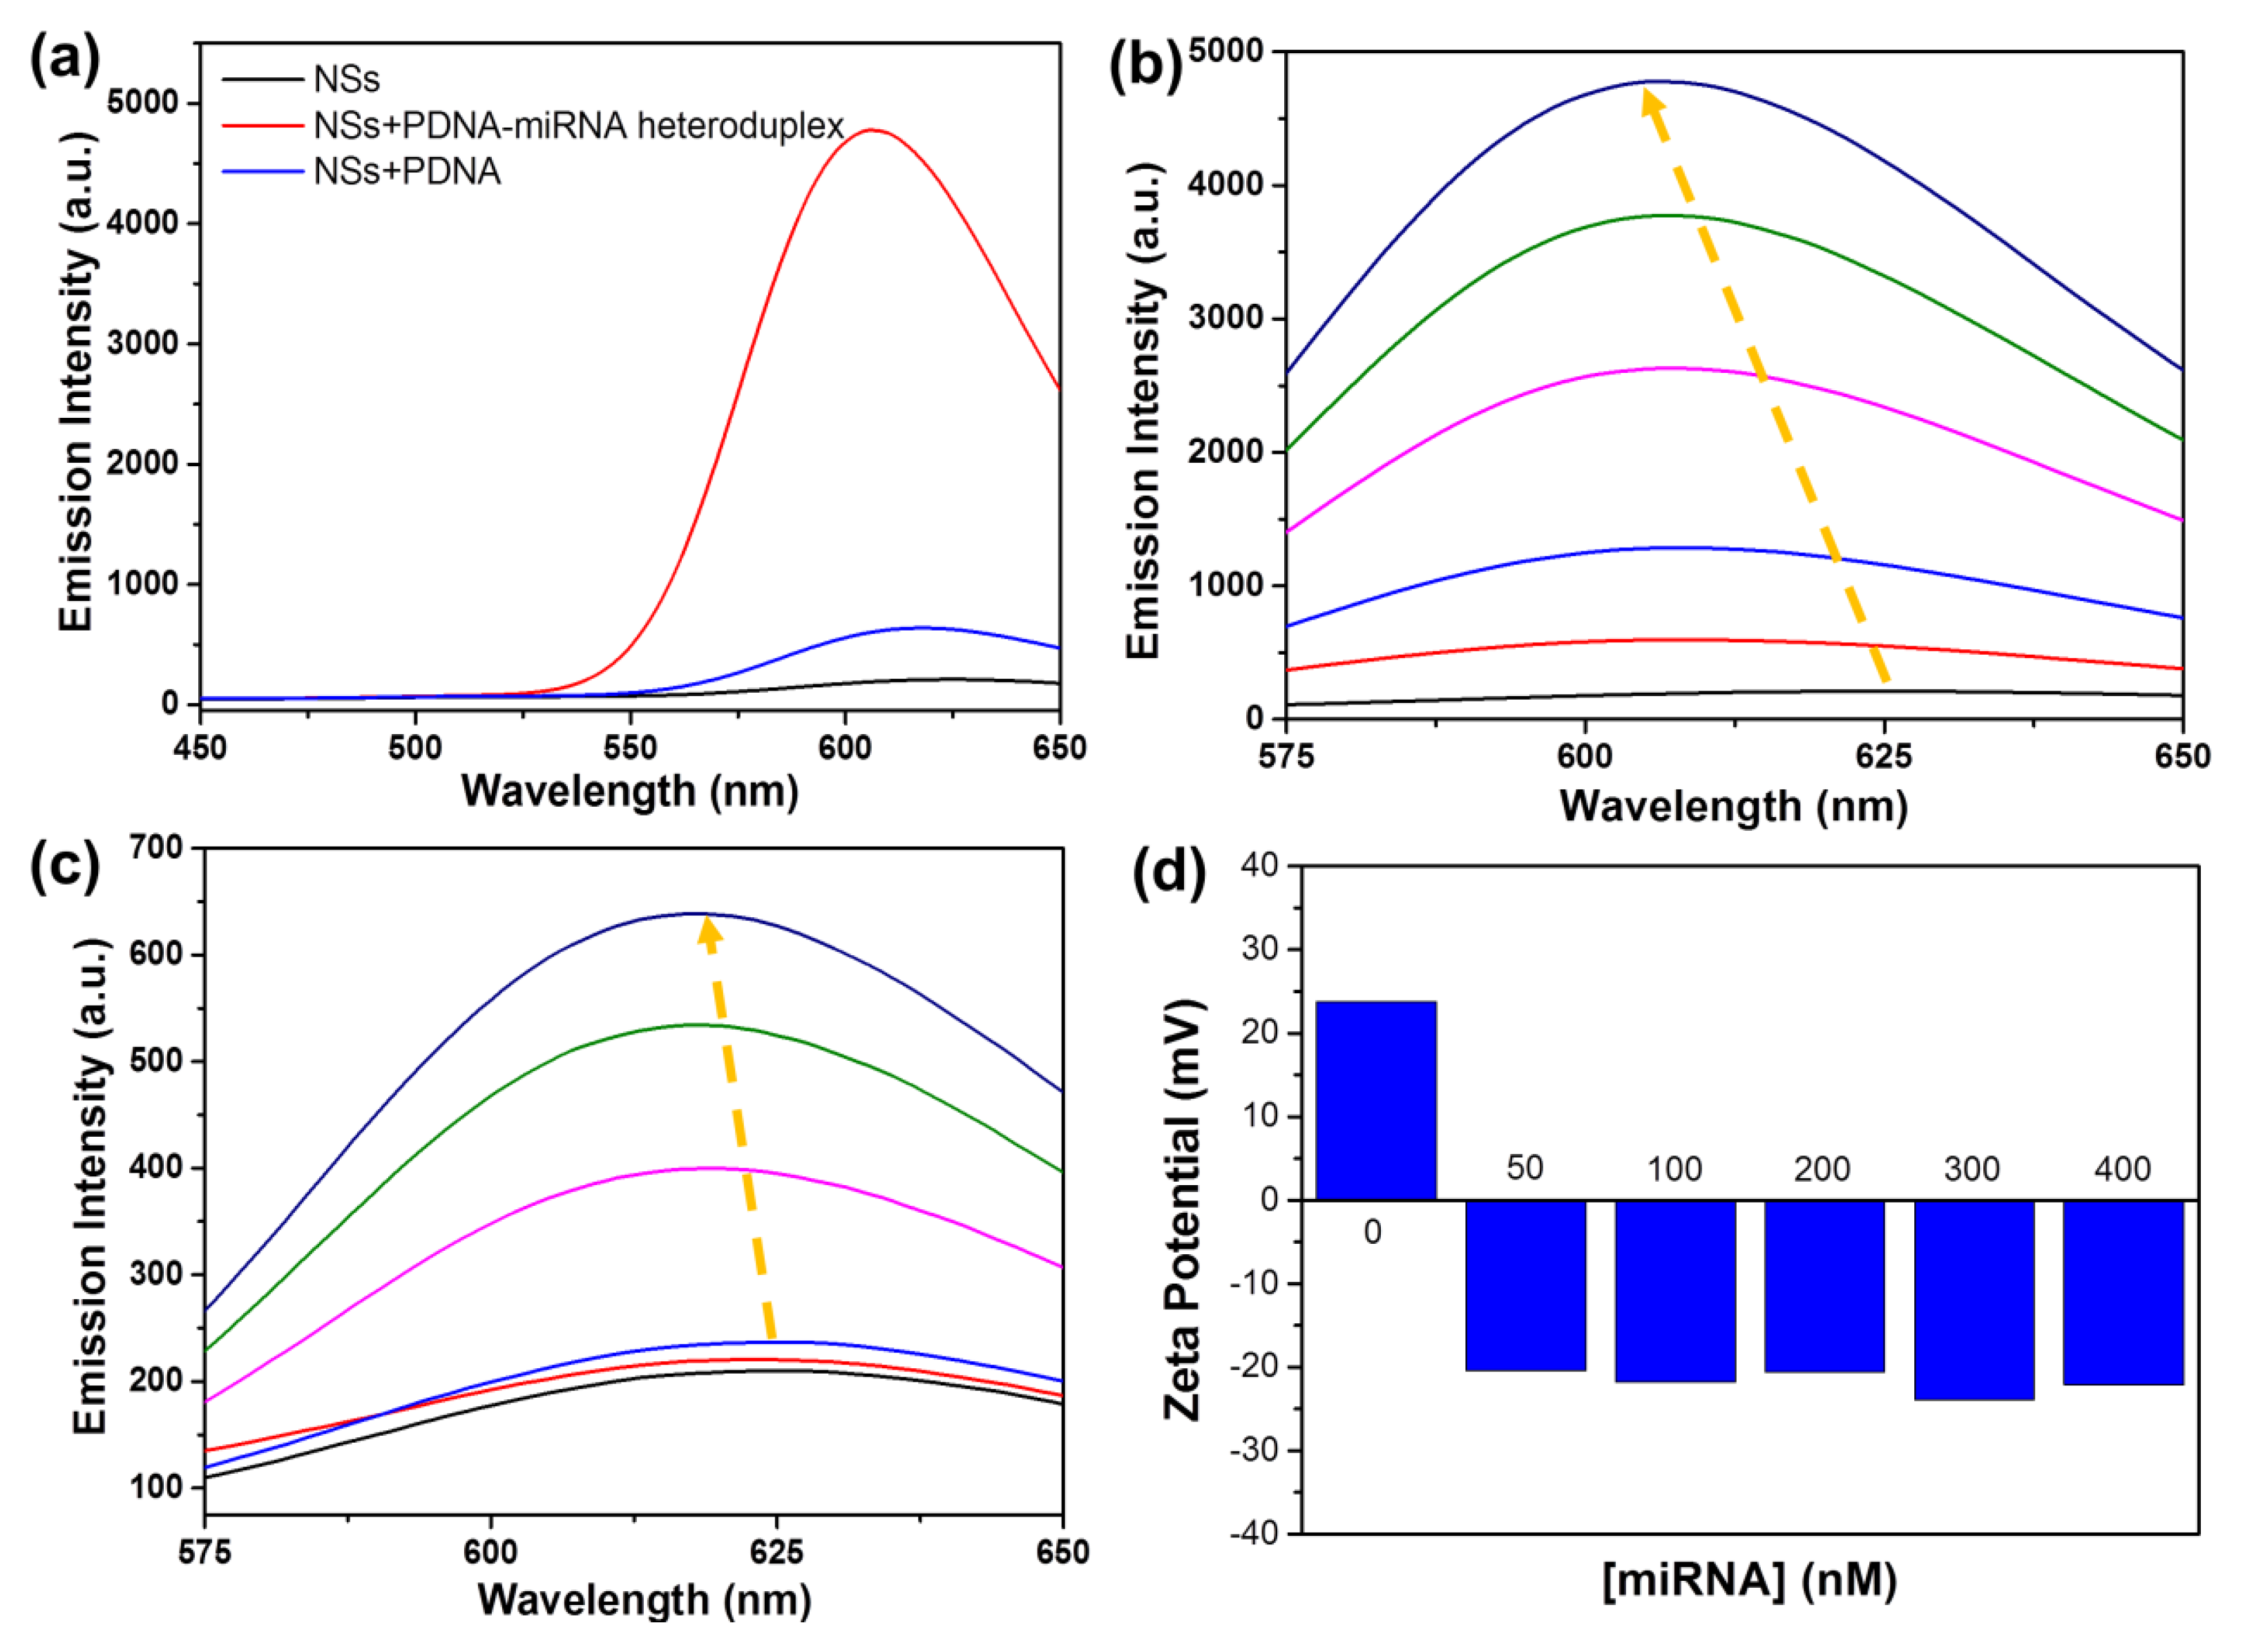
2.4. Preparation of EB-TAPB-TFP NSs–PDNA-miRNA Heteroduplex Hybrid

An EB-TAPB-TFP NSs–PDNA-miRNA heteroduplex hybrid was prepared by dropwise addition of 50 µL PDNA-miRNA heteroduplex (500 μM) in Tris-HCl buffer (50 mM) to 1.0 mL EB-TAPB-TFP NSs dispersion at room temperature. During the addition, constant stirring was maintained on vortex. For complete hybridization, the EB-TAPB-TFP NSs–PDNA-miRNA heteroduplex hybrid was kept for vortex mixing for 24 h at 22 °C. The hybrid was collected by centrifugation, followed by drying under vacuum at room temperature.

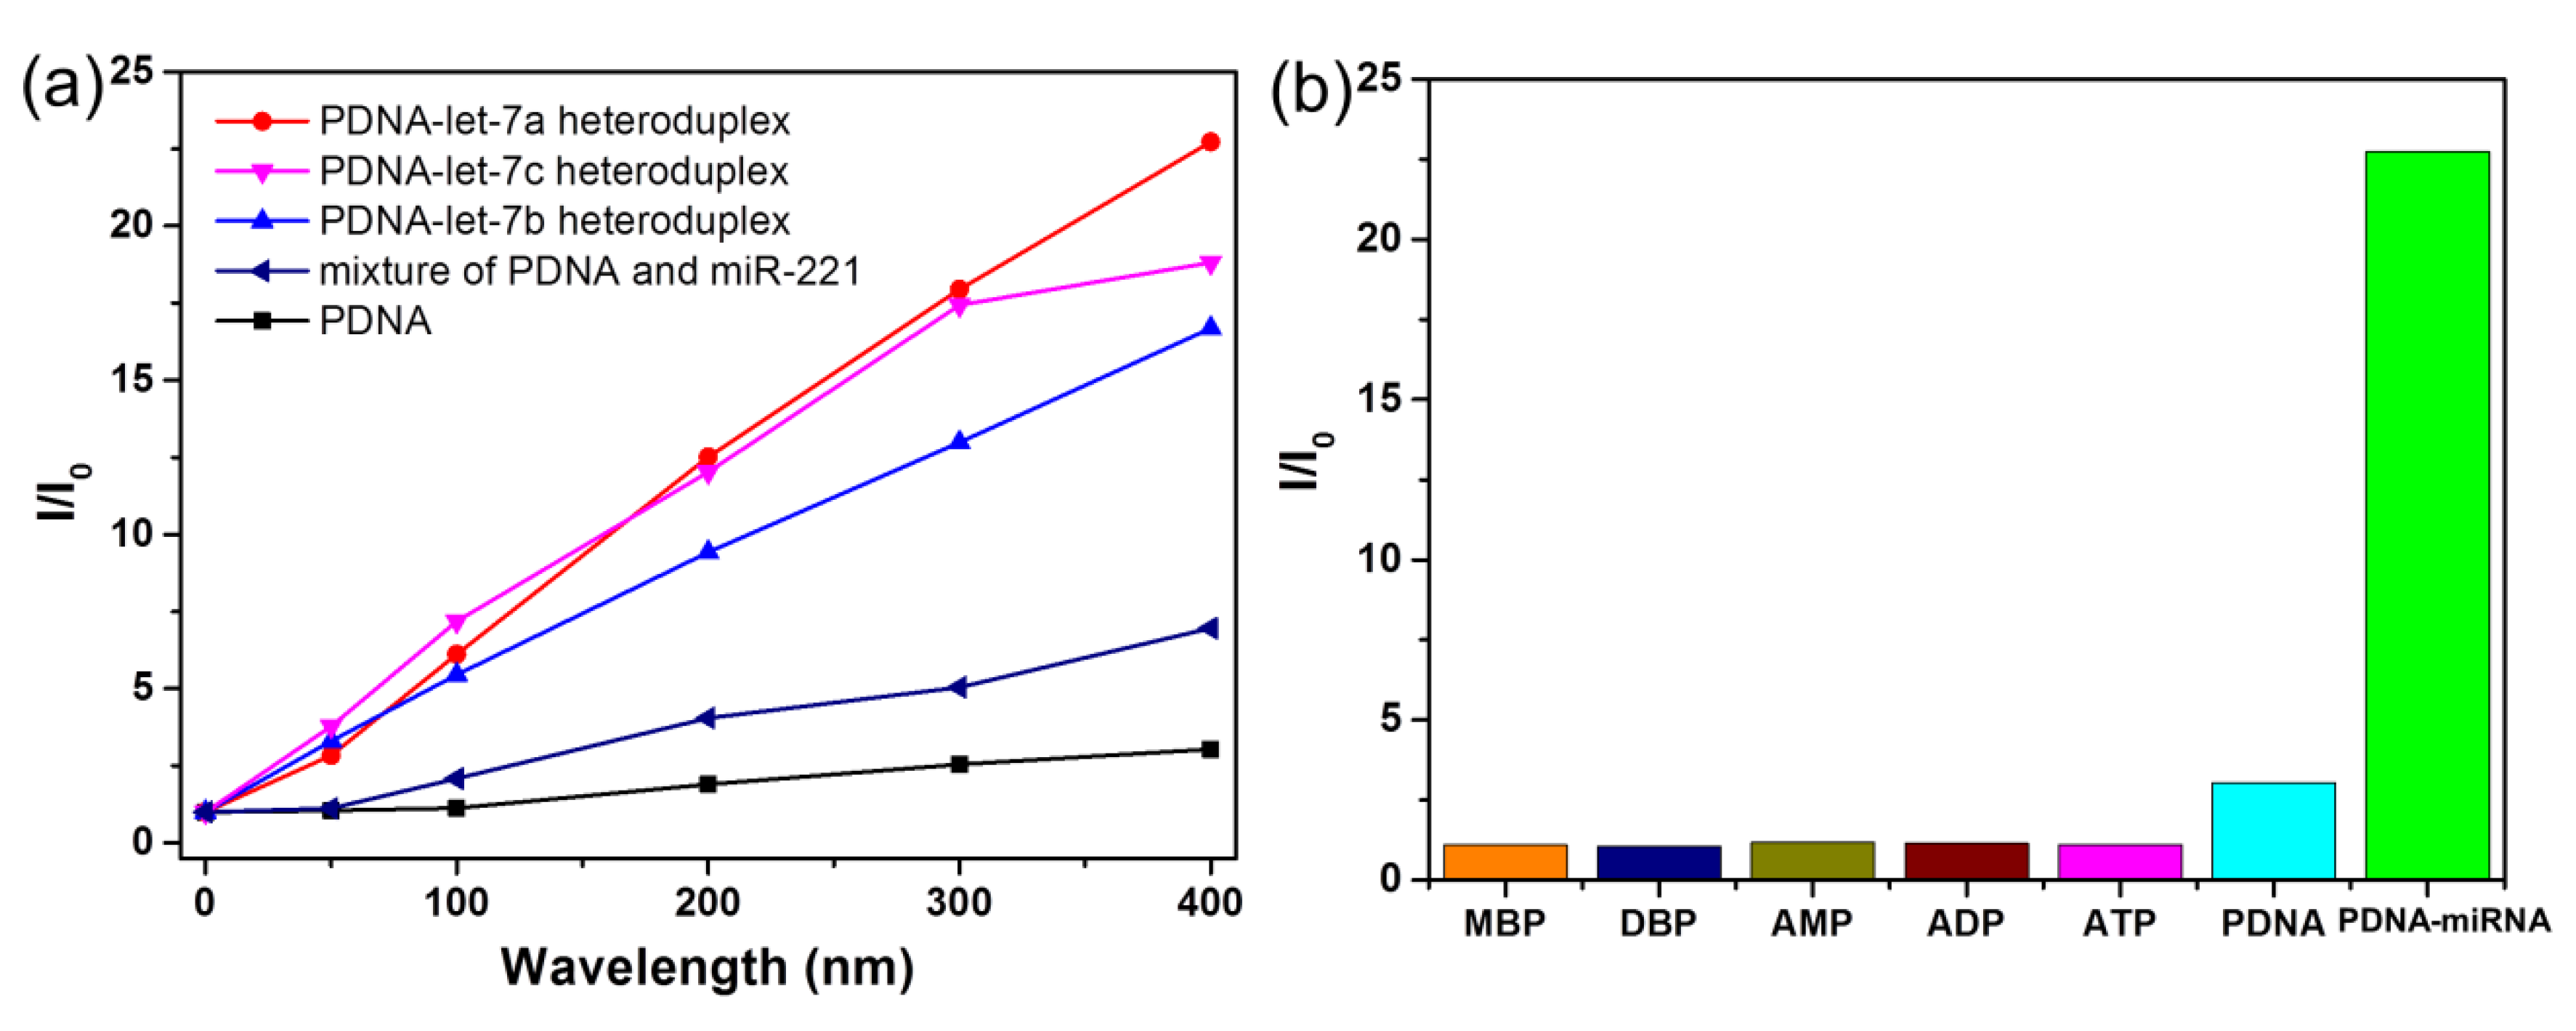
2.5. Fluorescence Measurements

For PDNA-miRNA heteroduplex hybridization, firstly, an equal volume of PDNA (40 μM) and miRNA (40 μM) in Tris-HCl buffer (50 mM) was mixed and heated at 37 °C for 2 h. Then, the PDNA and PDNA-miRNA heteroduplex were prepared in different concentrations (2.5, 5, 10, 15 and 20 μM) with Tris-HCl buffer (50 mM), respectively. Typically, a dispersion of 1.0 mL was prepared by mixing 980 μL EB-TAPB-TFP NSs with 20 μL of PDNA, PDNA-miRNA heteroduplex, MBP, DBP, AMP, ADP or ATP, respectively, and was finally measured using fluorescence spectroscopy. The fluorescence measurements were performed with an excitation slit width of 5.0 nm and an emission slit width of 5.0 nm. The emission spectra were collected from 450 to 650 nm under an excitation wavelength of 350 nm.

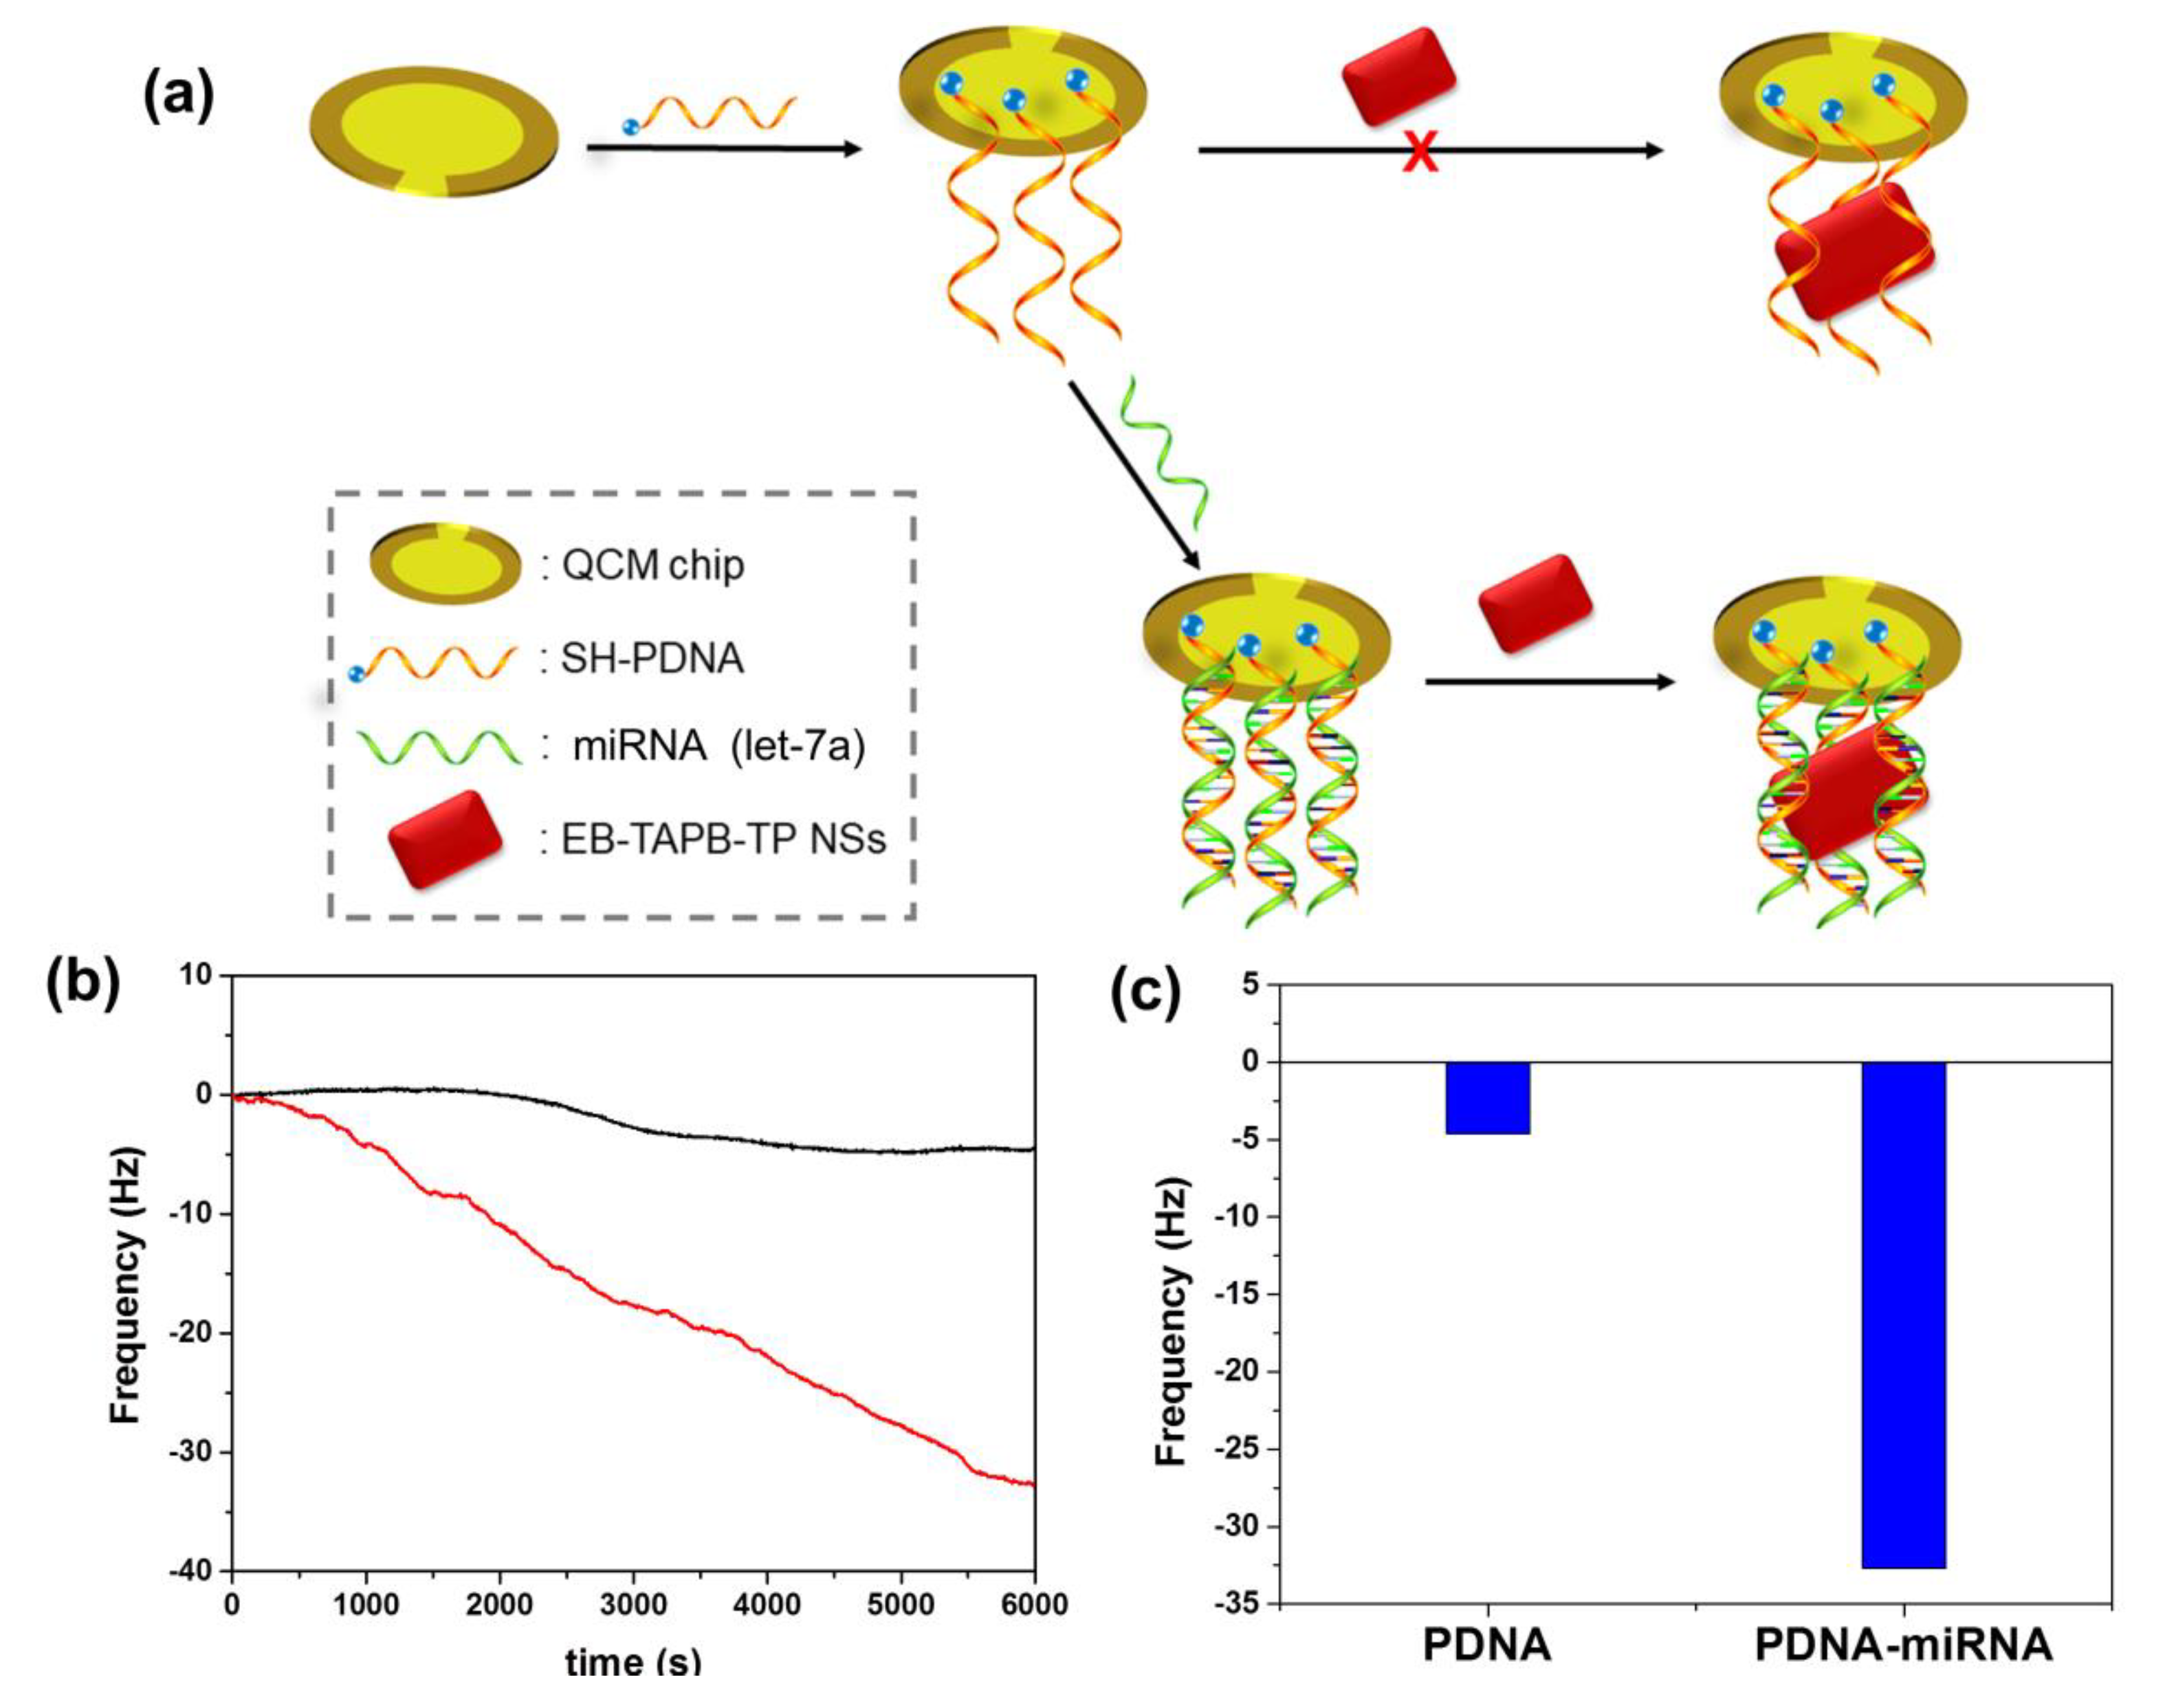
2.6. QCM Measurements

The QCM gold-plated chip was firstly immersed in a piranha solution (98% H2SO4: 30% H2O2 (v/v) = 7:3) for 10 min, then washed with deionized water several times and finally dried with N2. The pretreated gold-plated chip was immersed in PDNA (probe DNA) Tris-HCl solution (1.0 mL, 50 nM) for 1 h at room temperature. Then, the chip was washed with ultrapure water and dried with N2. Finally, the chip was immersed in 6-mercapto-1-hexanol solution (4.0 μM) for 30 min, washed with ultrapure water and dried with N2 to yield the PDNA-coated QCM chip.
Before the QCM test, the PDNA-coated QCM chip was incubated with a let-7a solution at a certain concentration for 1 h and dried by N2. To avoid NSs deposition, QCM sensors were tested face down. Firstly, phosphate buffer was injected into the QCM cell as the baseline signal. When the QCM frequency was basically stable (frequency drops < 1 Hz per min), the EB-TAPB-TFP NSs Tris-HCl solution/suspension was injected into the QCM liquid cell until it was filled, and the QCM cell was kept still until a stable signal was obtained. After 6000 s, the frequency change was recorded and used for data analyzing.

3. Results and Discussion

The new three-component EB-TAPB-TFP COF could be prepared by the condensation reaction of EB (30.7 mg, 0.078 mmol), TAPB (27 mg, 0.078 mmol) and TFP (27 mg, 0.13 mmol) in a degassed mixture of 1,4-dioxane (1.0 mL), EtOH (0.40 mL) and 6 M aqueous acetic acid (0.10 mL) at 110 °C for 3 days (Scheme 1), producing dark-red microcrystalline solids with an excellent yield (~92%). The as-prepared EB-TAPB-TFP COF was insoluble in common organic solvents such as acetone, ethanol, tetrahydrofuran, dichloromethane, N,N’-dimethylformamide (DMF), and so on. A powder X-ray diffraction (PXRD) measurement was conducted in order to evaluate the crystallinity of EB-TAPB-TFP COF. As illustrated in Figure 1a, the PXRD pattern of EB-TAPB-TFP COF showed a relatively strong diffraction peak at 5.4° and two weak diffraction peaks at 9.3° and 25.7°, which was similar to that of the reported DB50%-TAPB-Tp COF [39], indicating the long-range ordered crystalline structure of EB-TAPB-TFP COF. The above-mentioned three diffraction peaks in the PXRD pattern could be assigned to the (100), (200) and (001) facets, respectively.
As shown in Figure 1b, by comparing the three starting materials of EB, TAPB and TFP, the two new characteristic vibrational bands appearing at 1588 and 1215 cm−1 in the Fourier transform infrared (FT-IR) spectrum of EB-TAPB-TFP COF could be assigned to the C=C and C-NH bonds, suggesting the successful condensation reaction of EB and TAPB with TFP [39]. In comparison to the TFP linker, the weakened but existing stretching bands of aldehyde bands (~1699 cm−1) of EB-TAPB-TFP COF suggested the occurrence of the Keto–Enol Tautomerism. Similarly, although the characteristic N-H stretching bands of EB-TAPB-TFP COF decreased when compared with those of the EB and TAPB monomers, obvious N-H stretching bands at 3200 cm−1 could still be observed, providing further evidence for the Keto–Enol Tautomerism. As can be seen in Figure 1c, the 13C cross-polarization magic angle spinning (CP-MAS) solid-state NMR spectrum of EB-TAPB-TFP COF showed a signal at 188 ppm, which could be attributed to the carbon atom of the C=O groups, confirming that the structure of the resulting COF existed in a keto form [39]. Thermogravimetric analysis (TGA) demonstrated that EB-TAPB-TFP COF displayed good thermostability under nitrogen atmosphere (Figure S1) (see Supporting Information). The scanning electron microscopy (SEM) image suggested that EB-TAPB-TFP COF exhibited an aggregated cluster-like morphology (Figure 1d). The porosity of the EB-TAPB-TFP COF was evaluated by measuring the nitrogen adsorption–desorption isotherms at 77 K on the fully activated crystalline sample. The N2 adsorption isotherm of EB-TAPB-TFP COF presented a typical type I characteristic (Figure S2), where the N2-adsorbed amount increased sharply at the low P/P0 region, indicating the microporous nature of the obtained COF framework. The hysteresis loop was observed between the N2 adsorption isotherm and desorption isotherm, suggesting the presence of some mesopores. The Brunauer–Emmett–Teller (BET) surface area of EB-TAPB-TFP COF was calculated as 166 m2 g−1. Such a relatively low BET specific surface area of EB-TAPB-TFP COF might be attributable to the hard removal of partial guest solvents and/or unreacted linkers filling the pores of the COF framework owing to the hydrogen-bonding interactions [40,41]. Additionally, the average pore size of EB-TAPB-TFP COF was ∼1.6 nm, calculated by the nonlocal density functional theory (NLDFT), as depicted in Figure S3.
The self-exfoliated EB-TAPB-TFP NSs could be simply acquired upon treatment of EB-TAPB-TFP COF powder with deionized water, displaying an obvious Tyndall effect, as illustrated in Figure 2a. The atomic force microscopy (AFM) image of EB-TAPB-TFP NSs exhibited a thickness of 4.9 ± 1 nm, indicating the few composing layers of the COF NSs (Figure 2b).
It has been demonstrated that COFs can exhibit promising applications in the field of fluorescence sensing [19]; thus, EB-TAPB-TFP NSs were used as a sensing platform for miRNA detection in this study. The miRNA/DNA sequences used in this work are listed in Table S1. The PDNA-miRNA heteroduplex was prepared by combination of the probe DNA (PDNA) with its complementary miRNA (let-7a). As displayed in Figure 3a, the EB-TAPB-TFP NSs’ aqueous dispersion exhibited a dim emission at the wavelength of 624 nm. After the addition of PDNA into the aqueous dispersion of EB-TAPB-TFP NSs for 10 min, the fluorescence was only slightly changed in terms of the peak position and intensity. In a sharp contrast with this, the fluorescence intensity of the EB-TAPB-TFP NSs’ dispersion was significantly enhanced after the addition of the PDNA-miRNA heteroduplex. A comparison of the fluorescence intensities of the EB-TAPB-TFP NSs in the presence of the PDNA and PDNA-miRNA heteroduplex uncovered an approximately 7.5-fold enhancement in the latter case, indicating the much stronger interaction between the EB-TAPB-TFP NSs and PDNA-miRNA heteroduplex than between the EB-TAPB-TFP NSs and single-stranded PDNA.
Interestingly, the maximum emission wavelengths of the EB-TAPB-TFP NSs in the presence of the PDNA and PDNA-miRNA heteroduplex were apparently different, which aroused our interest to further study the hypsochromic shift of the EB-TAPB-TFP NSs in the presence of the PDNA and PDNA-miRNA heteroduplex, respectively. Therefore, the PDNA and PDNA-miRNA heteroduplex were prepared with various concentrations (0, 50, 100, 200, 300, 400 nM) and then added separately into the EB-TAPB-TFP NSs’ aqueous dispersion. As described in Figure 3b, the emission of EB-TAPB-TFP NSs in the presence of the PDNA-miRNA heteroduplex with different concentrations presented a similar maximum emission wavelength at around 606 nm but showed a blue-shift of 18 nm compared to that of the parent EB-TAPB-TFP NSs. On the contrary, the maximum emission wavelength of EB-TAPB-TFP NSs changed only slightly upon the addition of PDNA (Figure 3c). The larger blue-shift of EB-TAPB-TFP NSs in the presence of the PDNA-miRNA heteroduplex than of PDNA indicated a stronger interaction between the EB-TAPB-TFP NSs and PDNA-miRNA heteroduplex. Furthermore, a significant difference in the fluorescence intensity at the maximum emission wavelength was also observed after the addition of the PDNA-miRNA heteroduplex and PDNA, respectively, thus demonstrating a clear identification of the PDNA-miRNA heteroduplex. The native EB-TAPB-TFP NSs exhibited a distinct zeta potential value of +23 mV (Figure 3d). After adding the PDNA-miRNA heteroduplex into the NSs’ suspension, the positive value significantly decreased and negative zeta potential values between -24 and -20 mV were obtained (Figure 3d). Since the PDNA-miRNA heteroduplex contains a long and periodic phosphate skeleton, it may provide a great number of interaction sites to simultaneously interact with the positively charged EB-TAPB-TFP NSs [38], thus giving rise to the blue-shift and intensity enhancement phenomena in their emission spectra. Additionally, the energy dispersive X-ray spectroscopy (EDS) element mapping images supported the existence of the PDNA-miRNA heteroduplex in the resulting EB-TAPB-TFP NSs–PDNA-miRNA heteroduplex hybrid due to the presence of phosphorus originating from the PDNA-miRNA heteroduplex (Figure S4).
To further evaluate the sensing ability of the EB-TAPB-TFP NSs for miRNAs, another two let-7 miRNAs, including a single-based mismatched strand (let-7c) and a double-based mismatched strand (let-7b), and a total-based mismatched strand (miR-221) were tested. The PDNA was firstly mixed with total/partial complementary let-7 miRNAs to form different PDNA-miRNA heteroduplex hybrids and was then titrated independently against the EB-TAPB-TFP NSs. As shown in Figure 4a, the PDNA-let-7a, PDNA-let-7c and PDNA-let-7b heteroduplex hybrids exhibited gradually decreased fluorescence intensities under the same concentration of 400 nM. In this case, the difference in the fluorescence intensities of let-7 miRNAs is determined by complementarity between PDNA and miRNA. As a result, the total-based mismatched interfering agent (miR-221) exhibited a significantly smaller fluorescence enhancement, indicating the high sequence specificity and good discrimination of the EB-TAPB-TFP NSs for let-7 miRNAs. In comparison to the reported EB-TFP-iCONs in the presence of DNA [38], the EB-TAPB-TFP NSs–PDNA-miRNA heteroduplex hybrid showed a nearly 4-fold enhancement in fluorescence intensity, indicating the more sensitive detection of the EB-TAPB-TFP NSs towards double-stranded heteroduplexes. Moreover, the addition of other phosphate-based small molecules (400 nM), including MBP, DBP, AMP, ADP and ATP, to EB-TAPB-TFP NSs, respectively, has led to a negligible change in fluorescence intensity, further suggesting a better selective interaction between EB-TAPB-TFP NSs and the PDNA-miRNA heteroduplex (Figure 4b).
Finally, the EB-TAPB-TFP NSs were also used for the detection of the PDNA-miRNA heteroduplex on a QCM sensor. As illustrated in Figure 5a, the thiol-modified probe DNA (SH-PDNA) was assembled on the gold surface of the QCM chip (single-stranded-assembly-modified QCM chip). Then, the PDNA on the QCM chip could hybridize with the complementary miRNA (let-7a) to form double-stranded assemblies on the chip surface (double-stranded-assembly-modified QCM chip). Subsequently, when the EB-TAPB-TFP NSs were bound to the QCM chip surface, this gave rise to an increase in the surface quality, therefore leading to changes in the frequency. As shown in Figure 5b,c, the frequency decrement of the double-stranded-assembly-modified QCM chip upon the injection of the EB-TAPB-TFP NSs’ dispersion was found to be 32.7 Hz, while that of the single-stranded-assembly-modified QCM chip was only 4.6 Hz, further confirming the much stronger interaction between EB-TAPB-TFP NSs and the PDNA-miRNA heteroduplex than that between EB-TAPB-TFP NSs and the single-stranded PDNA. The above-mentioned results suggested that EB-TAPB-TFP NSs showed promise on the QCM sensor. Although it has been demonstrated that COF materials can be used for the detection of volatile organic compounds and metal cations through the QCM technique [42,43,44], to the best of the authors’ knowledge, this work presents the first case of the implementation of COF-based miRNA detection within a QCM sensor.

4. Conclusions

In order to develop novel 2D nanomaterials for the ever-growing needs of the label-free and sensitive detection of DNA or RNA biomolecules, a new three-component EB-TAPB-TFP COF was successfully synthesized, which could be self-exfoliated into 2D nanosheets in an aqueous medium. On the one hand, using the fluorescence recognition method, the resulting EB-TAPB-TFP NSs in the presence of a PDNA-miRNA heteroduplex exhibited a remarkable fluorescence intensity enhancement when compared to the cases of single-stranded DNA and other phosphate-based small molecules, making it promising for the detection of miRNA without tagging any fluorescent marker. On the other hand, the EB-TAPB-TFP NSs can also be used as sensing material for the detection of a PDNA-miRNA heteroduplex using the QCM technique. The frequency change when adding NSs into the double-stranded-assembly-modified QCM chip was 32.7 Hz, while the frequency shift on the single-stranded-assembly-modified QCM chip was only 4.6 Hz. Such a notable difference is in good agreement with the fluorescence sensing result. These two approaches suggested that COF NSs exhibited promising prospects for the label-free and sensitive detection of miRNAs.

Supplementary Materials

The following supporting information can be downloaded at: https://www.mdpi.com/article/10.3390/cryst12111628/s1, Table S1. Synthetic oligonucleotides used in this study; Figure S1: TGA curve of EB-TAPB-TFP COF under nitrogen atmosphere; Figure S2: N2 adsorption (filled symbols) and desorption (empty symbols) isotherms of EB-TAPB-TFP COF; Figure S3: Pore size distribution analysis of EB-TAPB-TFP COF; Figure S4: (a) SEM image of the EB-TAPB-TFP NSs–PDNA-miRNA heteroduplex hybrid and (b) corresponding elemental contents. (c) Total surface element composition of EB-TAPB-TFP NSs–PDNA-miRNA heteroduplex hybrid by SEM-EDX. Color mapping for (d) phosphorus and (e) bromine by EDX.

Author Contributions

B.X. and Y.Y. contributed equally to this work. S.C., J.F., S.Z. and X.T. designed the experiments; B.X. and Y.Y. performed the experiments; B.X., Y.Y., J.W. and X.C. performed data analysis; J.Z. and Y.L. performed computer simulation; S.C. and X.T. made the conceptualization; B.X., Y.Y., X.T. and S.C. wrote the paper. All authors have read and agreed to the published version of the manuscript.

Funding

This work was financially supported by the National Natural Science Foundation of China (Grant Nos. 22171092 and 22073032), the Natural Science Foundation of Guangdong Province (Grant Nos. 2021A1515010211 and 2022A1515011243), and the Science and Technology Program of Guangzhou (Grant No. 202102020667).

Institutional Review Board Statement

Not applicable.

Informed Consent Statement

Not applicable.

Data Availability Statement

In this work, Data is contained within the article or Supplementary Material.

Conflicts of Interest

The authors declare no conflict of interest.

References

  1. Small, E.M.; Eric, N.O. Pervasive roles of microRNAs in cardiovascular biology. Nature 2011, 469, 336. [Google Scholar] [CrossRef] [PubMed] [Green Version]
  2. Graybill, R.M.; Bailey, R.C. Emerging biosensing approaches for microRNA analysis. Anal. Chem. 2016, 88, 431. [Google Scholar] [CrossRef] [PubMed] [Green Version]
  3. Despina, P.K.; Panagiota, M.K.; Iraklis, K.K.; Theodore, K.C. The interaction of an amorphous metal-organic cage-based solid (aMOC) with miRNA/DNA and its application on a quartz crystal microbalance (QCM) sensor. Anal. Bioanal. Chem. 2018, 410, 695. [Google Scholar] [CrossRef]
  4. Keshavarz, M.; Behpour, M.; Rafiee-Pour, H.A. Recent trends in electrochemical microRNA biosensors for early detection of cancer. RSC Adv. 2015, 5, 35651. [Google Scholar] [CrossRef]
  5. Chen, C.; Ridzon, D.A.; Broomer, A.J.; Zhou, Z.; Lee, D.H.; Nguyen, J.T.; Barbisin, M.; Xu, N.L.; Mahuvakar, V.R.; Andersen, M.R.; et al. Real-time quantification of microRNAs by stem–loop RT–PCR. Nucleic Acids Res. 2005, 33, e179. [Google Scholar] [CrossRef]
  6. Friedlander, M.R.; Chen, W.; Adamidi, C.; Maaskola, J.; Einspanier, R.; Knespel, S.; Rajewsky, N. Discovering microRNAs from deep sequencing data using miRDeep. Nat. Biotechnol. 2008, 26, 407. [Google Scholar] [CrossRef]
  7. Thomson, J.M.; Parker, J.; Perou, C.M.; Hammond, S.M. A custom microarray platform for analysis of microRNA gene expression. Nat. Methods 2004, 1, 47. [Google Scholar] [CrossRef] [Green Version]
  8. Zhang, C.; Miao, P.; Sun, M.; Yan, M.; Liu, H. Progress in miRNA Detection Using Graphene Material–Based Biosensors. Small 2019, 15, e1901867. [Google Scholar] [CrossRef]
  9. Coutinho, C.; Somoza, A. MicroRNA sensors based on gold nanoparticles. Anal. Bioanal. Chem. 2019, 411, 1807. [Google Scholar] [CrossRef]
  10. Mahdiannasser, M.; Karami, Z. An innovative paradigm of methods in microRNAs detection: Highlighting DNAzymes, the illuminators. Biosens. Bioelectron. 2018, 107, 123. [Google Scholar] [CrossRef]
  11. Zhao, M.; Wang, Y.; Ma, Q.; Huang, Y.; Zhang, X.; Ping, J.; Zhang, Z.; Lu, Q.; Yu, Y.; Xu, H.; et al. Ultrathin 2D metal–organic framework nanosheets. Adv. Mater. 2015, 27, 7372. [Google Scholar] [CrossRef] [PubMed]
  12. Liu, S.; Wang, L.; Tian, J.; Luo, Y.; Chang, G.; Asiri, A.M. Application of zeolitic imidazolate framework-8 nanoparticles for the fluorescence-enhanced detection of nucleic acids. Chempluschem 2012, 77, 23. [Google Scholar] [CrossRef]
  13. Ling, P.; Lei, J.; Ju, H. Porphyrinic metal-organic framework as electrochemical probe for DNA sensing via triple-helix molecular switch. Biosens. Bioelectron. 2015, 71, 373. [Google Scholar] [CrossRef] [PubMed]
  14. Ling, P.; Lei, J.; Zhang, L.; Ju, H. Porphyrin-encapsulated metal–organic frameworks as mimetic catalysts for electrochemical DNA sensing via allosteric switch of hairpin DNA. Anal. Chem. 2015, 87, 3957. [Google Scholar] [CrossRef] [PubMed]
  15. Chen, J.; Yu, C.; Zhao, Y.L.; Niu, Y.Z.; Zhang, L.; Yu, Y.; Wu, J.; He, J. A novel non-invasive detection method for the FGFR3 gene mutation in maternal plasma for a fetal achondroplasia diagnosis based on signal amplification by hemin-MOFs/PtNPs. Biosens. Bioelectron. 2017, 91, 892. [Google Scholar] [CrossRef] [PubMed]
  16. Qin, L.; Lin, L.X.; Qiu, G.H.; Chen, J.X.; Chen, W.H. A water-stable metal–organic framework of a zwitterionic carboxylate with dysprosium: A sensing platform for Ebolavirus RNA sequences. Chem. Commun. 2016, 52, 132. [Google Scholar] [CrossRef] [PubMed]
  17. Yang, S.; Zhao, W.; Bai, L.; Li, M.; Chen, J.X. Lanthanum-based metal–organic frameworks for specific detection of Sudan virus RNA conservative sequences down to single-base mismatch. Inorg. Chem. 2017, 56, 14880. [Google Scholar] [CrossRef]
  18. Xie, B.P.; Qiu, G.H.; Hu, P.P.; Liang, Z.; Liang, Y.M.; Sun, B.; Bai, L.P.; Jiang, Z.H.; Chen, J.X. Simultaneous detection of Dengue and Zika virus RNA sequences with a three-dimensional Cu-based zwitterionic metal–organic framework, comparison of single and synchronous fluorescence analysis. Sensor. Actuator. B Chem. 2018, 254, 1133. [Google Scholar] [CrossRef]
  19. Liu, X.G.; Huang, D.L.; Lai, C.; Zeng, G.M.; Qin, L.; Wang, H.; Yi, H.; Li, B.S.; Liu, S.Y.; Zhang, M.M.; et al. Recent advances in covalent organic frameworks (COFs) as a smart sensing material. Chem. Soc. Rev. 2019, 48, 5266. [Google Scholar] [CrossRef]
  20. Wang, J.; Yang, X.; Wei, T.; Bao, J.; Zhu, Q.; Dai, Z. Fe-Porphyrin-based covalent organic framework as a novel peroxidase mimic for a one-pot glucose colorimetric assay. ACS Appl. Bio Mater. 2018, 1, 382. [Google Scholar] [CrossRef]
  21. Wang, P.; Zhou, F.; Zhang, C.; Yin, S.Y.; Teng, L.; Chen, L.; Hu, X.X.; Liu, H.W.; Yin, X.; Zhang, X.B. Ultrathin two-dimensional covalent organic framework nanoprobe for interference-resistant two-photon fluorescence bioimaging. Chem. Sci. 2018, 9, 8402. [Google Scholar] [CrossRef] [PubMed] [Green Version]
  22. Liu, W.; Cao, Y.; Wang, W.; Gong, D.; Cao, T.; Qian, J.; Iqbal, K.; Qin, W.; Guo, H. Mechanochromic luminescent covalent organic frameworks for highly selective hydroxyl radical detection. Chem. Commun. 2018, 55, 167. [Google Scholar] [CrossRef]
  23. Wang, P.; Kang, M.; Sun, S.; Liu, Q.; Zhang, Z.; Fang, S. Imine-Linked Covalent Organic Framework on Surface for Biosensor. Chin. J. Chem. 2014, 32, 838. [Google Scholar] [CrossRef]
  24. Das, G.; Benyettou, F.; Sharama, S.K.; Prakasam, T.; Gándara, F.; de la Peña-O’Shea, V.A.; Saleh, N.; Pasricha, R.; Jagannathan, R.; Olson, M.A.; et al. Covalent organic nanosheets for bioimaging. Chem. Sci. 2018, 9, 8382. [Google Scholar] [CrossRef] [Green Version]
  25. Zeng, J.Y.; Wang, X.S.; Xie, B.R.; Li, M.J.; Zhang, X.Z. Covalent Organic Framework for Improving Near-Infrared Light Induced Fluorescence Imaging through Two-Photon Induction. Angew. Chem. Int. Ed. 2020, 59, 10087. [Google Scholar] [CrossRef]
  26. Sun, P.P.; Hai, J.; Sun, S.H.; Lu, S.Y.; Liu, S.; Liu, H.W.; Chen, F.J.; Wang, B.D. Aqueous stable Pd nanoparticles/covalent organic framework nanocomposite: An efficient nanoenzyme for colorimetric detection and multicolor imaging of cancer cells. Nanoscale 2020, 12, 825. [Google Scholar] [CrossRef] [PubMed]
  27. Wang, P.; Zhou, F.; Guan, K.S.; Wang, Y.J.; Fu, X.Y.; Yang, Y.; Yin, X.; Song, G.S.; Zhang, X.B.; Tan, W.H. In vivo therapeutic response monitoring by a self-reporting upconverting covalent organic framework nanoplatform. Chem. Sci. 2020, 11, 1299. [Google Scholar] [CrossRef] [PubMed] [Green Version]
  28. Yan, X.; Song, Y.; Liu, J.; Zhou, N.; Zhang, C.; He, L.; Zhang, Z.; Liu, Z. Two-dimensional porphyrin-based covalent organic framework: A novel platform for sensitive epidermal growth factor receptor and living cancer cell detection. Biosens. Bioelectron. 2019, 126, 734. [Google Scholar] [CrossRef]
  29. Zhu, C.; Zeng, Z.; Li, H.; Li, F.; Fan, C.; Zhang, H. Single-Layer MoS2-Based Nanoprobes for Homogeneous Detection of Biomolecules. J. Am. Chem. Soc. 2013, 135, 5998. [Google Scholar] [CrossRef]
  30. Wang, Q.; Wang, W.; Lei, J.; Xu, N.; Gao, F.; Ju, H. Fluorescence quenching of carbon nitride nanosheet through its interaction with DNA for versatile fluorescence sensing. Anal. Chem. 2013, 85, 12182. [Google Scholar] [CrossRef]
  31. Yew, Y.T.; Sofer, Z.; Mayorga-Martinez, C.C.; Pumera, M. Black phosphorus nanoparticles as a novel fluorescent sensing platform for nucleic acid detection. Mater. Chem. Front. 2017, 1, 1130. [Google Scholar] [CrossRef]
  32. Li, B.; Lai, C.; Zeng, G.; Huang, D.; Qin, L.; Zhang, M.; Cheng, M.; Liu, X.; Yi, H.; Zhou, C. Black phosphorus, a rising star 2D nanomaterial in the post-graphene era: Synthesis, properties, modifications, and photocatalysis applications. Small 2019, 15, 1804565. [Google Scholar] [CrossRef] [PubMed]
  33. Lu, C.H.; Yang, H.H.; Zhu, C.L.; Chen, X.; Chen, G.N. A graphene platform for sensing biomolecules. Angew. Chem. Int. Ed. 2009, 121, 4879–4881. [Google Scholar] [CrossRef]
  34. He, S.; Song, B.; Li, D.; Zhu, C.; Qi, W.; Wen, Y.; Wang, L.; Song, S.; Fang, H.; Fan, C. A graphene nanoprobe for rapid, sensitive, and multicolor fluorescent DNA analysis. Adv. Funct. Mater. 2010, 20, 453. [Google Scholar] [CrossRef]
  35. Peng, Y.; Huang, Y.; Zhu, Y.; Chen, B.; Wang, L.; Lai, Z.; Zhang, Z.; Zhao, M.; Tan, C.; Yang, N.; et al. Ultrathin two-dimensional covalent organic framework nanosheets: Preparation and application in highly sensitive and selective DNA detection. J. Am. Chem. Soc. 2017, 139, 8698. [Google Scholar] [CrossRef] [PubMed] [Green Version]
  36. Li, W.; Yang, C.X.; Yan, X.P. A versatile covalent organic framework-based platform for sensing biomolecules. Chem. Commun. 2017, 53, 11469. [Google Scholar] [CrossRef]
  37. Mandal, T.K.; Parvin, N.; Mishra, K.; Mohandoss, S.; Lee, Y.R. Sensitive and selective fluorometric determination of DNA by using layered hexagonal nanosheets of a covalent organic framework prepared from p-phenylenediamine and benzene-1,3,5-tricarboxaldehyde. Microchim. Acta 2019, 186, 833. [Google Scholar] [CrossRef]
  38. Mal, A.; Mishra, R.K.; Praveen, V.K.; Khayum, M.A.; Banerjee, R.; Ajayaghosh, A. Supramolecular reassembly of self-exfoliated ionic covalent organic nanosheets for label-free detection of dsDNA. Angew. Chem. Int. Ed. 2018, 57, 8443. [Google Scholar] [CrossRef]
  39. Cao, J.; Shan, W.; Wang, Q.; Ling, X.; Li, G.; Lyu, Y.; Zhou, Y.; Wang, J. Ordered Porous Poly(ionic liquid) Crystallines: Spacing Confined Ionic Surface Enhancing Selective CO2 Capture and Fixation. ACS Appl. Mater. Interfaces 2019, 11, 6031. [Google Scholar] [CrossRef]
  40. Chen, G.; Lan, H.H.; Cai, S.L.; Sun, B.; Li, X.L.; He, Z.H.; Zheng, S.R.; Fan, J.; Liu, Y.; Zhang, W.G. Stable Hydrazone-Linked Covalent Organic Frameworks Containing O,N,O′-Chelating Sites for Fe(III) Detection in Water, ACS Appl. Mater. Interfaces 2019, 11, 12830. [Google Scholar] [CrossRef]
  41. Zhang, S.Y.; Tang, X.H.; Yan, Y.L.; Li, S.Q.; Zheng, S.R.; Fan, J.; Li, X.L.; Zhang, W.G.; Cai, S. Facile and Site-Selective Synthesis of an Amine-Functionalized Covalent Organic Framework. ACS Macro Lett. 2021, 10, 1590. [Google Scholar] [CrossRef] [PubMed]
  42. He, Z.H.; Gong, S.D.; Cai, S.L.; Yan, Y.L.; Chen, G.; Li, X.L.; Zheng, S.R.; Fan, J.; Zhang, W.G. A benzimidazole-containing covalent organic framework-based QCM sensor for exceptional detection of CEES. Cryst. Growth Des. 2019, 19, 3543. [Google Scholar] [CrossRef]
  43. Li, D.M.; Zhang, S.Y.; Wan, J.Y.; Zhang, W.Q.; Yan, Y.L.; Tang, X.H.; Zheng, S.R.; Cai, S.L.; Zhang, W.G. A new hydrazone-linked covalent organic framework for Fe (iii) detection by fluorescence and QCM technologies. CrystEngComm 2021, 23, 3594. [Google Scholar] [CrossRef]
  44. Li, D.-M.; Li, S.-Q.; Huang, J.-Y.; Yan, Y.-L.; Zhang, S.-Y.; Tang, X.-H.; Zheng, S.-R.; Zhang, W.-G.; Cai, S.-L. A recyclable bipyridine-containing covalent organic framework-based QCM sensor for detection of Hg (II) ion in aqueous solution. J. Solid State Chem. 2021, 302, 122421. [Google Scholar] [CrossRef]
Scheme 1. Synthesis of the three−component EB−TAPB−TFP COF using EB, TAPB and TFP as linkers.
Crystals 12 01628 sch001
Figure 1. (a) The simulated and experimental PXRD patterns of EB−TAPB−TFP COF. (b) The FT−IR spectra of the starting materials of EB, TAPB and TFP, as well as EB−TAPB−TFP COF. (c) Solid−state 13C CP−MAS NMR spectrum of EB−TAPB−TFP COF. The asterisks (*) indicate the spinning side bands. (d) SEM image of EB−TAPB−TFP COF.
Crystals 12 01628 g001
Figure 2. (a) Tyndall effect, (b) AFM image of EB−TAPB−TFP NSs. Inset indicates the corresponding height profile.
Crystals 12 01628 g002
Figure 3. (a) The fluorescence spectral changes of the dispersed EB−TAPB−TFP NSs with and without addition of PDNA and PDNA−miRNA heteroduplex. (b) Changes in the emission (λex = 350 nm) of EB−TAPB−TFP NSs upon addition of PDNA−miRNA heteroduplex with various concentrations from 0 to 400 nM. (c) Changes in the emission (λex = 350 nm) of EB−TAPB−TFP NSs upon addition of PDNA with various concentrations from 0 to 400 nM. (d) Changes in zeta potential value of EB−TAPB−TFP NSs upon increasing the concentration of PDNA−miRNA heteroduplex.
Crystals 12 01628 g003
Figure 4. (a) Plot showing fluorescence intensity changes of EB-TAPB-TFP NSs from 606 nm to 625 nm with increasing concentrations of PDNA, mixture of PDNA and miR-221, PDNA-let-7b heteroduplex, let-7c heteroduplex and let-7a heteroduplex, from down to up. (b) Plot showing selective fluorescence enhancement (λex = 350 nm) of EB-TAPB-TFP NSs upon adding MBP, DBP, AMP, ADP, ATP, PDNA and PDNA-miRNA heteroduplex.
Crystals 12 01628 g004
Figure 5. (a) Schematic outline of the QCM sensing system. (b) Real-time frequency responses of EB−TAPB−TFP NSs on the QCM sensor incubated with different concentrations of miRNA (let−7a). From up to down at 6000 s: 0 nM and 50 nM. (c) Frequency changes of EB−TAPB−TFP NSs on the QCM sensor incubated with PDNA and PDNA−miRNA heteroduplex.
Crystals 12 01628 g005
Publisher’s Note: MDPI stays neutral with regard to jurisdictional claims in published maps and institutional affiliations.

