Article

Secondary Cooling Analysis of AZ80Y Magnesium Alloy Slab during DC Casting by Modelling and Verification Based on Experiment

1
Key Lab of Electromagnetic Processing of Materials, Ministry of Education, Northeastern University, Shenyang 110819, China
2
School of Mechanical and Mining Engineering, The University of Queensland, Brisbane 4072, Australia
3
School of Chemical and Materials Science, Longyan University, Longyan 364012, China
4
School of Mechanical Engineering, Taiyuan University of Science and Technology, Taiyuan 030024, China
5
College of Mechanical Engineering, Shenyang University, Shenyang 110044, China
*
Authors to whom correspondence should be addressed.
Crystals 2022, 12(11), 1515; https://doi.org/10.3390/cryst12111515
Submission received: 24 September 2022 / Revised: 19 October 2022 / Accepted: 21 October 2022 / Published: 25 October 2022
(This article belongs to the Special Issue State-of-the-Art Magnesium Alloys)

Abstract

:
The secondary cooling of AZ80 during DC casting was investigated by measuring the temperature at a given position during steady state. The experiment was carried out under different parameters including the water flow rate density ( Q * ) and initial temperature ( T i ) of the impingement points. To theorize the heat transfer of the secondary cooling zone in practical DC casting, we designed a series of experimental equipment to simulate the secondary cooling with differing T i (between 473 and 673 K) and Q * (between 20 and 100 L min−1 m−1) based on the DC casting temperature-measurement experiment above. Detailed analysis was carried out of both the experimental results combined with Q * . The empirical formulae of Rohsenow and Weckman were modified due to the need to divide the secondary cooling zone into an impingement zone and a free-falling zone. Finally, a verification of the model’s accuracy was conducted by comparing the results of the finite volume numerical simulation and the experiment, which revealed that the model exhibited extremely high accuracy.

1. Introduction

From a historical perspective, the direct-chill (DC) casting of magnesium alloys was first extensively used in the manufacture of aircraft and other military applications during World War II [1,2]. DC casting is a semi-continuous process which can produce ingots and blooms for rolling as well as cylindrical billets for extrusion and forging [2,3]. However, unlike other non-ferrous metals and their alloys, the commercial viability of magnesium alloys which possess the advantages of light weight, excellent mechanical and electromagnetic shielding properties was weakened due to the lack of understanding of DC casting after World War II [4,5,6,7]. Consequently, a number of significant obstacles needed to be overcome.
One of the problems that plague the DC casting of magnesium alloys is the formation of defects, such as hot-cracking, butt curl, and cold shuts [8]. In contrast to the DC casting of aluminum, a relatively wide solidification range and hexagonal close-packed (HCP) structure result in poor workability in the subsequent processes such as rolling, extrusion and forging. Additionally, other peculiarities that emerged were the faster freezing of magnesium melt and the more hard-to-control start up in DC casting due to the thermophysical properties of magnesium alloys [9].
Currently, controlling the distribution of temperature with the parameters such as pouring temperature, withdrawal speed, primary cooling and secondary cooling during the whole DC casting process is confirmed by researchers [10,11] as the most idealized and effective method to solve the problem above. Obviously, the variation of heat transfer in secondary cooling (SC) has a more critical effect on the temperature field during DC casting due to more than 80% of total heat removal in steady state [12]. Accordingly, the factors affecting secondary cooling must be understood.
In terms of factors affecting secondary cooling, the advancements of surface heat flux include the correlations that are a function of surface temperature and water flow rate [13,14,15]. However, rare models distinguish between the impingement zone and free-falling zone, and there are no further studies on models of the impingement zone and free-falling zone based on the Leidenfrost boiling mechanism.
In this paper, the boiling curve at the secondary cooling zone during the steady state was introduced by temperature measurement tests. Then, an experiment named the spray water quenching test by DC casting simulator was designed to analyze the effect of various parameters on boiling. The inverse heat transfer (IHT) module was applied to calculate the surface heat flux during both the DC temperature measurement test and the water spray quenching test. The thermal conditions in the secondary cooling zone were established by quantifying each boiling regime as a function of various parameters such as the cooling Q * , surface temperature ( T s ) and water temperature ( T w ). A further discussion on the impingement zone and free-falling zone, based on the Leidenfrost boiling mechanism, has been made in this paper. Finally, the empirical equations were applied and the temperature field results by finite volume method (FVM) were compared with the temperature history from the DC temperature measurement test.

2. Experiment

2.1. Melting and Casting during DC Process

The chemical composition of AZ80 based alloy is shown in Table 1. The flammability of the target melting alloys decreased due to the addition of element Y with the 1% mass fraction. The liquidus and solidus temperatures of the final alloy were 879 and 791 K, respectively, determined by comprehensive analysis of the differential scanning calorimetry (DSC) measurements and JMatPro [16]. The melting process for the preparation of casting typically included three steps:
(1)
The ingots of pure Mg and pure Al were melted together in an electrical resistance furnace;
(2)
The ingots of pure Zn, Mg-50%Y (mass fraction, the same below) and Mg-80%Mn master alloys were added to the melt at 973 K subsequently;
(3)
The melt was kept at the temperature between 953 K and 973 K for 10 min before casting after refinement and purification.
A crystallizer made of aluminum was used in direct chilling (DC) for both DC processes to produce the AZ80Y slab with a cross-section size of 300 mm × 130 mm. The semi-continuous casting parameters including withdrawal speed (V), secondary cooling water flow rate density (Q*), pouring temperature (Tp) and primary cooling (PF) conditions are shown in Table 2.

2.2. Temperature Measurement Arrangement during DC Casting

The continuous temperature measurement is shown in Figure 1. The K-type thermocouples (chromel–alumel, with a single leg of 0.2 mm in diameter) were fixed at various positions by steel stent. The temperature-measurement points were located above the crystallizer at first with a given distance to obtain the temperature–time curve [16]. The temperature data obtained by HIOKI9334 logger communicator are presented as a function of time with 50 Hz acquisition rate or the distance to the top liquid surface (by multiplying the casting velocity by casting time).

2.3. Water Spray Quenching on Ingot by the DC Secondary Cooling Simulator

Undoubtedly, temperature measurement can provide enough data to understand the heat transfer behavior of DC casting but it consumes more time and increases the probability of risk for the laboratory technician.
Consequently, to have a fully developed perspective on the variation of heat exchange at the secondary cooling zone (SCZ), the values of the surface heat flux density and heat transfer are key. A series of experiments were conducted with the thermocouples inside and around the samples to gain the variations of T s and T w with a raise-down device and a water-spraying mold design to simulate the heat transfer behavior at the secondary cooling zone, as shown in Figure 2. The samples with the dimensions 300 mm (height) and 160 mm (diameter) were taken from an industrial cast product with the sample alloy composition shown in Table 1.
A series of K-type thermocouples were installed inside the sample along the axial direction beneath the surface. The samples, instrumented with thermocouples, were heated up to the target temperature before quenching as shown in Figure 2a. The water-spraying box produced jets of cooling water with a linear flow rate Q*, from 20 L to 100 L min−1 m−1. The process is shown in Figure 2b. The typical heating and cooling curves are shown in Figure 2c,d, respectively.

2.4. Leidenfrost Boiling Mechanism

Typical boiling heat transfer occurs according to the Leidenfrost boiling curve [17] and can be classified into the following four regimes, shown in Figure 3, which relate the surface heat flux density q, (generally expressed in W m2 or MW m2) to the T s (expressed in K): film boiling (FB), transition boiling (TB), nucleate boiling (NB) and forced convection (FC) by decreasing temperature. Figure 3 illustrates the pool boiling curve, in which a heated surface is submerged in a large volume of stagnant liquid; the forced convection regime was replaced here with natural convection.
During the FB stage, the heat transformation occurred between the heated surface covered with the stable film and vapor by conduction and convection. The Leidenfrost point (identified as T3 in Figure 3) marks the boundary between the transition boiling stage (T2) and film boiling (T3) stage. This point corresponds to the breakdown of the vapor film and to a minimum heat flux (MHF). During the TB stage, the heat exchange occurred between the heated surface covered with unstable film and part of the wetted region. The critical heat flux (CHF), pointed out in Figure 3, exhibited the characteristics with the upper limit of the boiling curve and the boundary between the nucleate boiling interval (T1–T2) and transition boiling interval (T2–T3). During the NB stage, vapor bubbles were formed at the heated surface. Vapor structures varied from a few individual nucleation sites at low temperature to patches of coalesced bubbles and vapor columns as the heat flux density increased. Below the onset of nucleate boiling pointed out in Figure 3, no vapor nucleation occurred and the heat was removed by forced or natural convection (T0).

3. Numerical Simulation

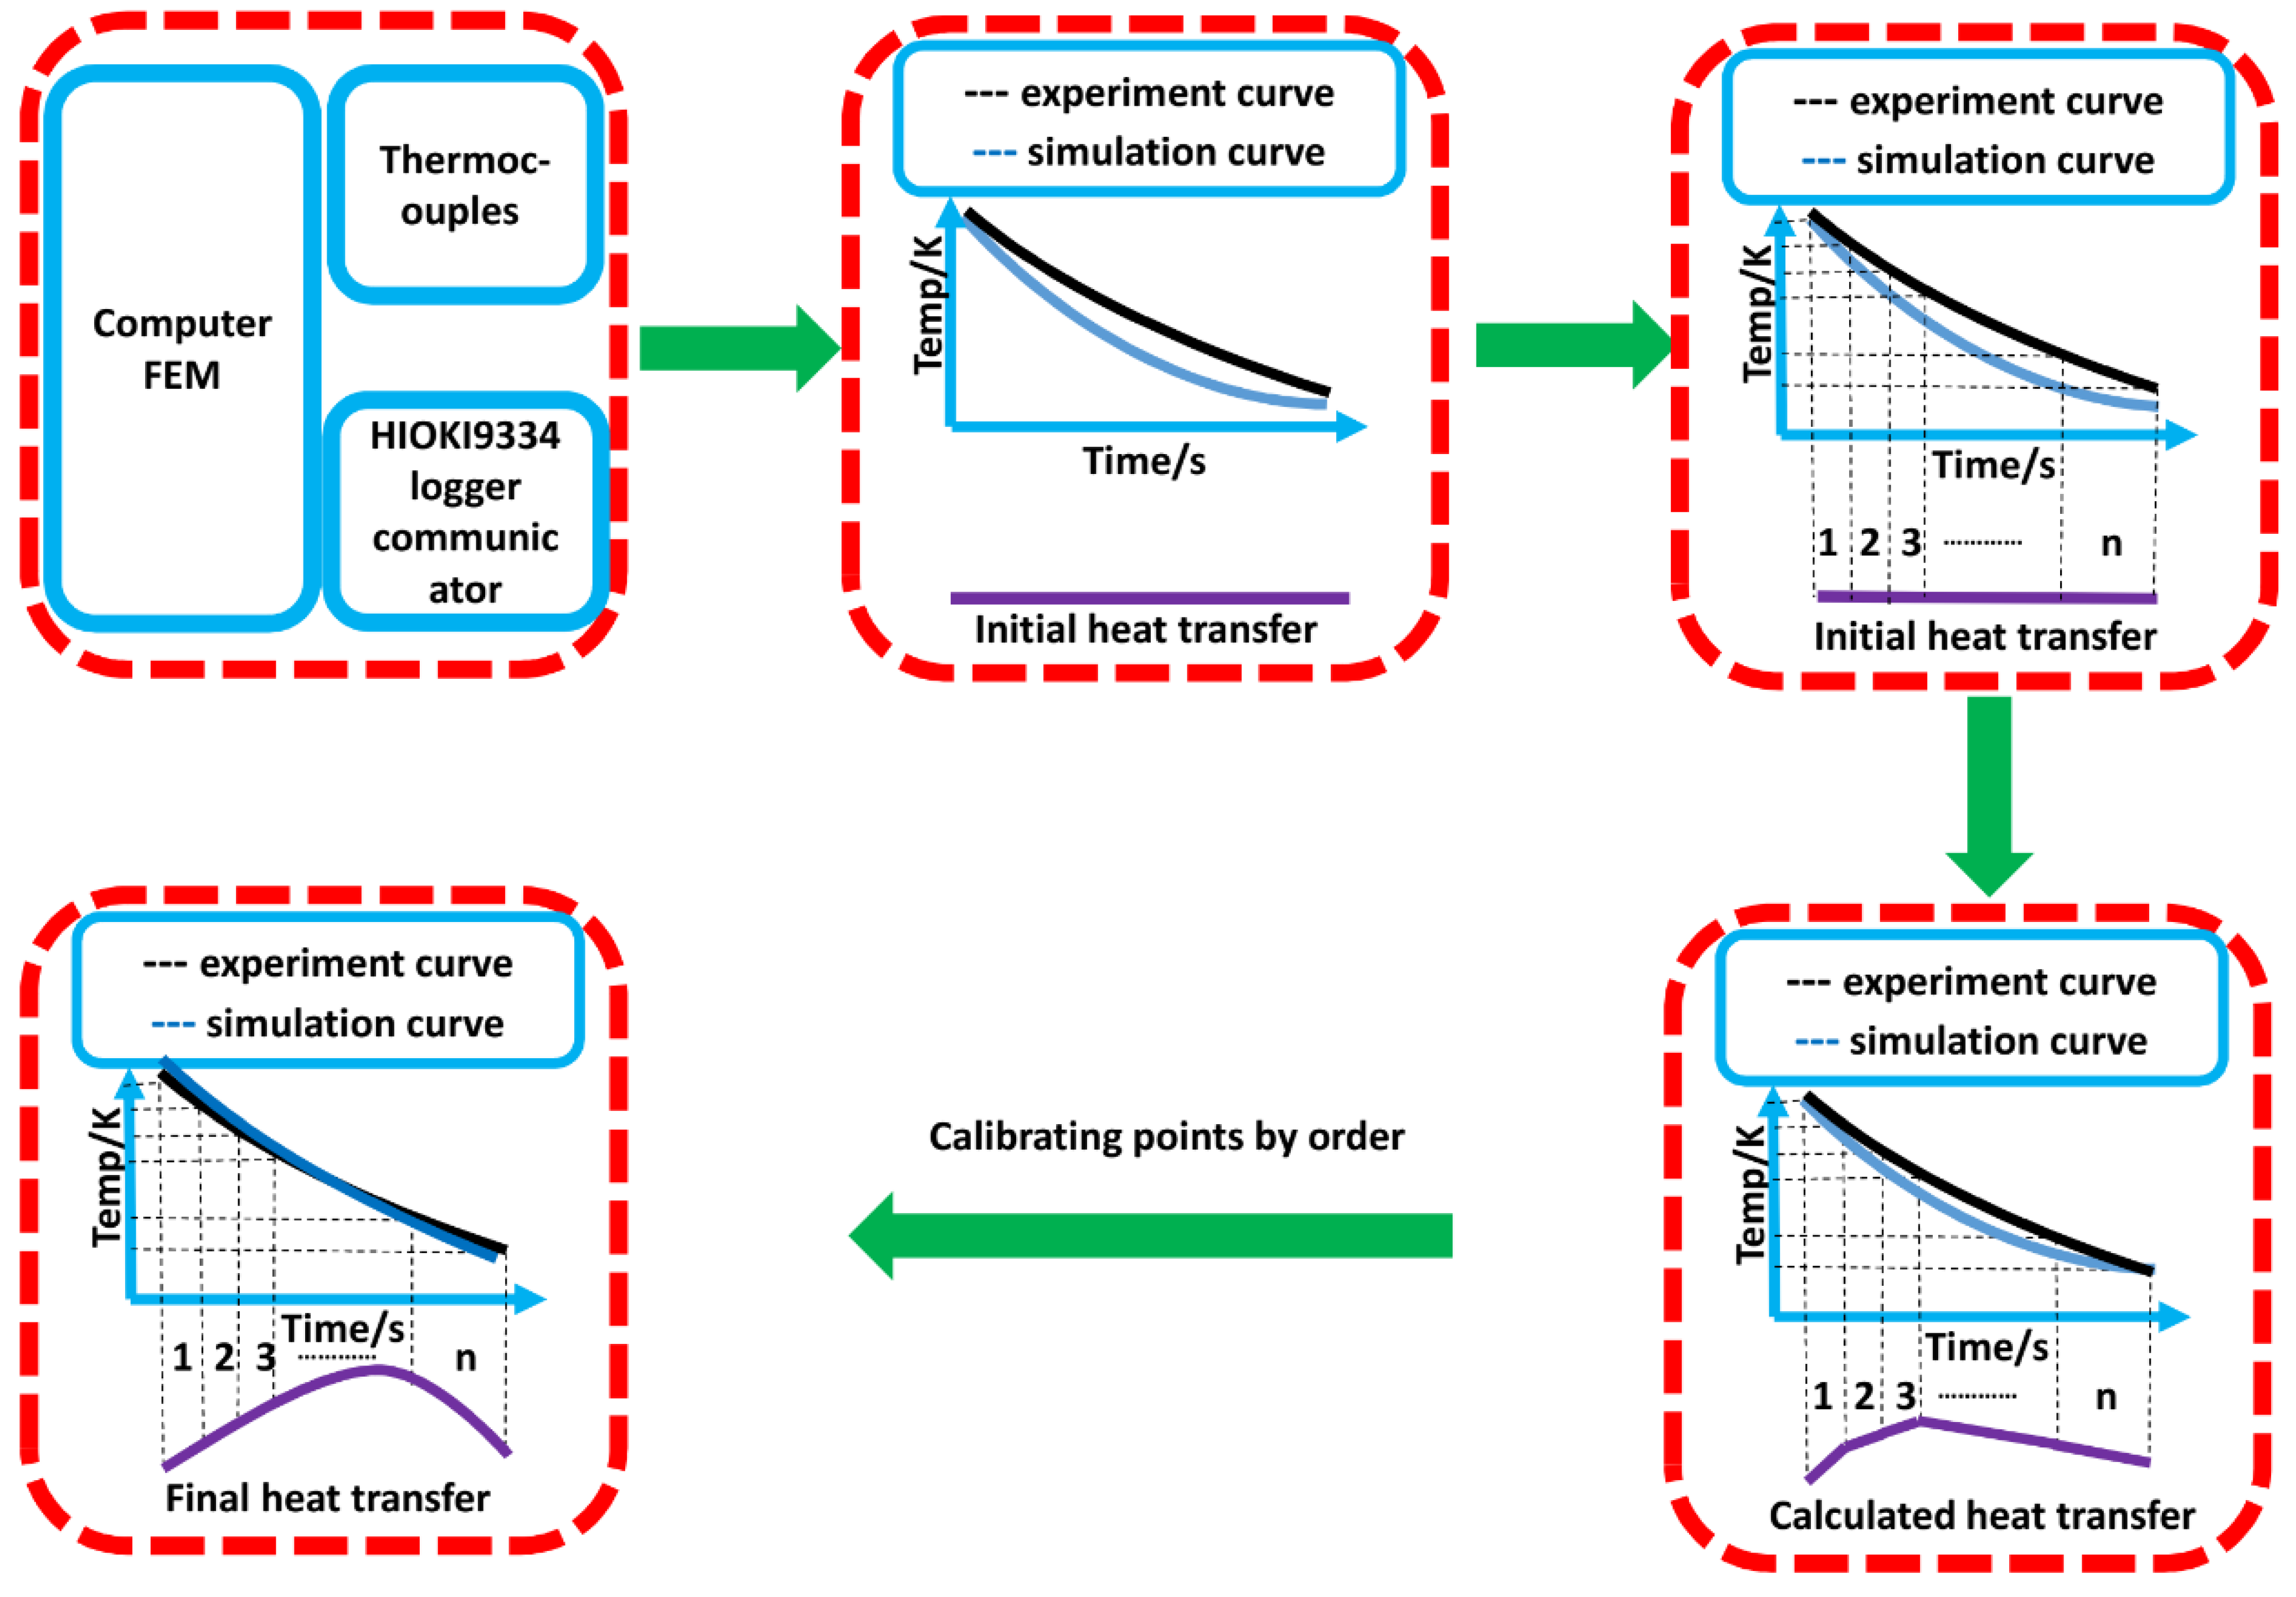
3.1. Heat Transfer Coefficient Calculated by Inverse Method

In this work, the heat transfer coefficient and heat flux density were calculated by the inverse method to systematically study the relationship between the surface heat flux density vs. temperature. The temperature history measured by the subsurface thermocouple and the thermophysical properties of AZ80Y shown in Figure 4 were inputted in the inverse heat transfer calculation program to calculate the surface heat transfer during the boiling process.
ρ c p T t = r λ T r + λ 1 r T r + z λ T z ,   ρ c p T t = λ 2 T x 2 + 2 T y 2
where ρ , c p and λ are the density, specific heat and thermal conductivity of the specimen. T is the temperature of the specimen, t is the time. The whole process of the inverse method is shown in Figure 5. The surface heat flux density is estimated from the initial temperature Ti by minimizing the objective function:
T I , J t + 1 = T I , J t + λ t T I , J + 1 t 2 T I , J t + T I , J 1 t ρ c p R 2 + λ t T I , J + 1 t T I , J 1 t 2 ρ c p R I R + λ t T I + 1 , J t 2 T I , J t + T I 1 , J t ρ c p Z 2
F h i = 1 M n = 1 M T n i + R θ Y n i + R θ 2
where M is the number of the heat fluxes to be predicted, T n i + R θ and Y n i + R θ are the calculated and measured temperature at time i + R θ , R is the number of future time steps to compensate for the heat difference and θ is a discrete time interval. The objective function is minimized through iterations. At each iteration step, the heat flux density is increased by h . This procedure is continued until the ratio ( h / h ) becomes less than 0.001, and then an estimate of h i can be obtained. At this point, the time is increased by θ , qi is used as the initial heat flux guess for the next time step and the process is repeated for h i + 1 , yielding the full history of q(t). Then, the interfacial heat flux density can be determined by the following equation
q = h T s T w
This procedure simultaneously yields the temperature of the specimen surface in contact with the quenchant. Additionally, both q and the surface temperature in boiling curve present in this study are averaged.

3.2. Assumptions and Boundary Conditions during Temperature Field Calculation by FVM Method

In the current work, a three-dimensional mathematical model of magnesium AZ80 billets was developed to compare and validate the semi-empirical models of secondary cooling. The thermophysical properties of AZ80Y are shown in Figure 4 which are combined with the equivalent specific heat method.
There are some assumptions that need to be taken into consideration in this model: (1) The meniscus surface is assumed to be flat, and the calculation of the solute field is not included in this model; (2) The fluid is incompressible; (3) When the value of wall temperature is below 373, the heat transfer coefficient is considered to be constant.
The boundary conditions (BC) are divided into seven parts, and each boundary condition is applied to the different boundaries of the billet, as shown in Figure 6:
(1) Symmetry axis boundary BC0. Heat loss along this boundary is considered to be zero due to the axis symmetry.
(2) Inlet boundary BC1. The inlet velocity V i n l e t inlet of BC is determined by casting speed based on conservation of flow. The temperature of inlet is a constant value and equal to pouring temperature. The turbulent kinetic energy k and turbulent dissipation rate ε are determined by the following two expressions:
k = 0.01 × V i n l e t 2
ε = k 1.5 R n o z
where R n o z is hydraulic radius.
(3) Free surface BC2. This boundary is set to the static adiabatic wall.
(4) Primary cooling boundary BC3. This boundary is treated as the static wall. Heat transfer between billet and mold is described using an effective heat transfer coefficient, which takes the heat insulation effect into consideration.
(5) Secondary cooling boundaries BC4 and BC5, which represent the impingement zone (IZ) and free-falling zone (FFZ). These boundaries are set as a moving wall and their velocity is casting speed. The height of IZ is qualified by equation. The total surface heat flux density at IZ and FFZ can be referred to in the Equations (20)–(26).
(6) The BC6 is treated with a wall at which the heat transfer coefficient is constant;
(7) Outlet boundary BC7. The outlet velocity V of BC6 is determined by casting speed.

4. Discussion and Results

4.1. Discussion

The recorded temperatures measured with the device shown in Figure 1 under the previously mentioned conditions, are shown in Figure 7 and Table 2. The cooling rates and the second derivative of temperature measured by the thermocouples during the temperature decrease, according to the analysis from Figure 7, were as follows: (a) according to the temperature variation rate, there was a sharp increase as the thermocouples were inserted into the melt; (b) according to the cooling rate, the temperature decrease could be classified into primary cooling air gap cooling, advanced cooling, water-impingement cooling, free falling water cooling below impingement; the cooling rate increased sharply at the transition from advanced cooling to water-impinging cooling; (c) from the analysis above, the second derivative of the measured temperature with respect to time provides a good understanding for determining the temperature of the inserted thermocouples’ melt and water impinging points.
Consequently, according to the analysis above, in this work, the temperature of the thermocouples inserted into the melt and water-impingement points were marked with the ranges of 790–900 K and 633–723 K, respectively.
Subsequently, a further study to quantify the water impinging zone height ( H i ) to distinguish the water impinging zone from the free-falling zone was conducted by a series of additional experiments mentioned above. In such a series of tests, the free-falling water film sprayed from the water jet was always ejected under the impinging zone due to the relatively high temperature and most heat removal took place in the impinging zone. As shown in Figure 8, the whole process could be classified into three stages according to time: (a) at the t1 moment, the free-falling water film came to impinge the measuring point, the temperature decrease took place at the measuring point because of the advanced cooling front effect and air convection; (b) at the t2 moment, the measuring point was covered with the impinging water film, the sharp temperature decrease took place because of the unique and extremely enhanced impinging and wetting effect on the impingement zone; (c) at the t3 moment, the free-falling water film moved up and the measuring point was located at the ejecting zone, due to the relatively low heat transfer from the stable film boiling, the reheated phenomenon took place with a slight temperature increase.

4.2. Results

4.2.1. Height of Impingement Zone

According to Figure 8 and the mentioned phenomena above, the impinging zone height could be calculated by dividing the time interval between the minimum and maximum by the sample moving speed:
H i = T V s
in which the sample moving speed V s was determined by dividing the distance between two consecutive thermocouples by the time interval between the corresponding two minima in the second derivative of the measured temperature.
The height of the impingement zone H i was measured for different water flow rate density Q* values. Because of the signal noise, a certain amount of scatter was observed for the impingement zone height. Average values for a given rewetting test, however, presented a good correlation with the water flow rate [18]. Figure 9 shows the influence of the water flow rate on the height of the impingement zone. The values were obtained by analyzing the second derivative of the temperature with respect to time. The H i and correlation coefficient R 2 are given by:
H i = 0.0208 Q * + 11.71 ,   R 2 = 0.85
Q * = Q P s   , P s , s l a b = Q w   ,   P s ,   r o u n d   i n g o t = Q π D
where Q is volume flow rate expressed in L min−1 m−1,   P s is the feature size of the sample. For the slab DC casting, where P s represents the width of RF and NF. For the DC secondary cooling simulator with a 0.16 m diameter, where w is the perimeter of bottom surface ( P s = π D ), where D is the diameter of cylindrical ingot.

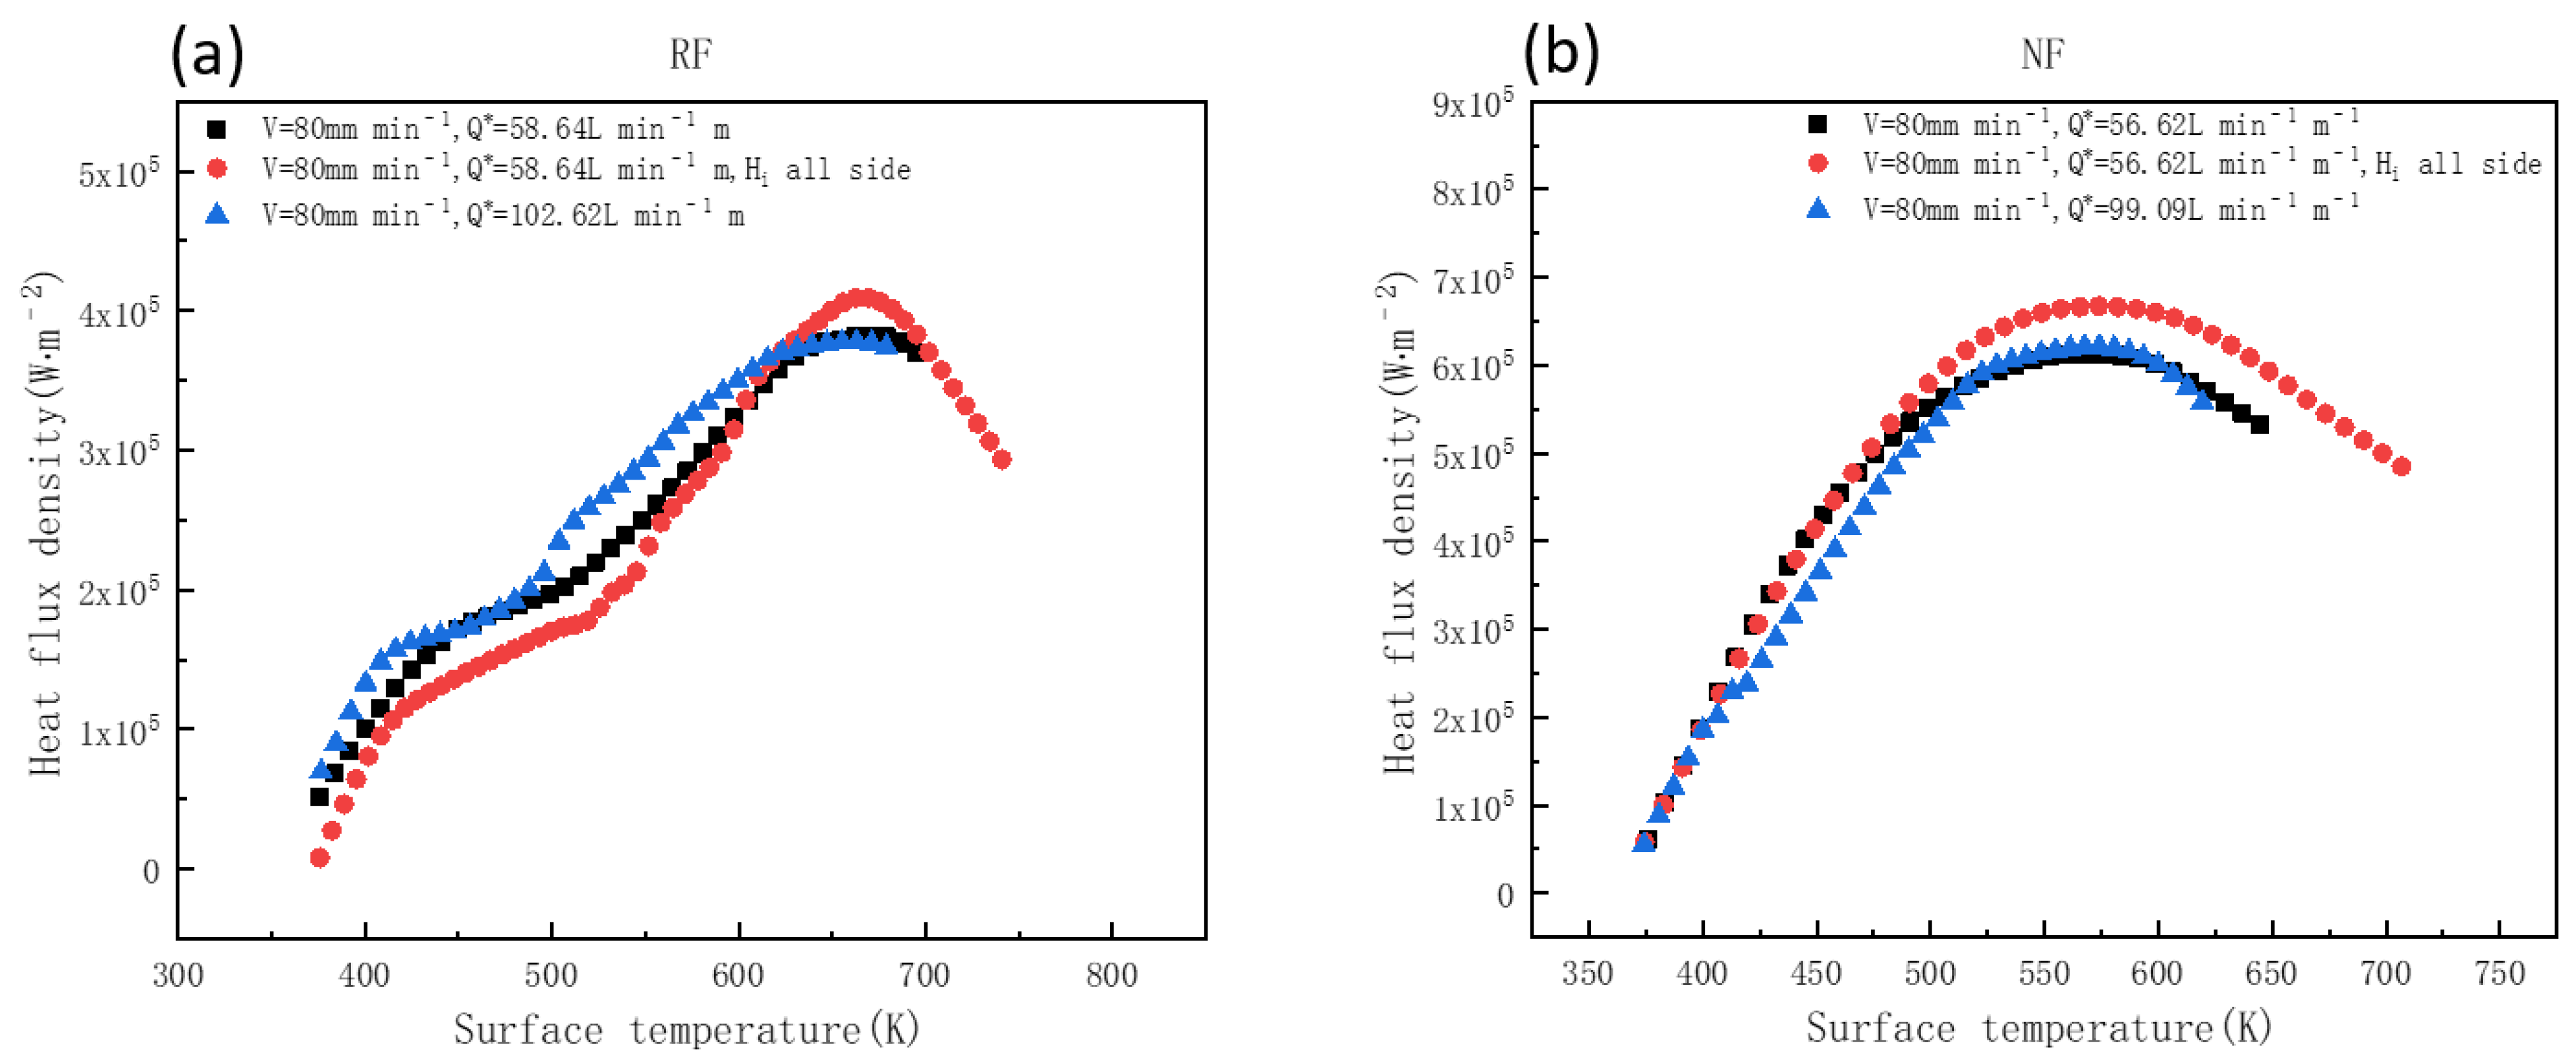
4.2.2. Heat Flux Density of Nucleate Boiling Calculated by Inverse Method

In the case of light metals such as aluminum alloy and magnesium alloy by DC casting, nucleate boiling dominates both in the impingement zone and the free-falling zone during the steady state of DC casting [19]. In treating nucleate boiling problems with forced convection, Rohsenow [20,21,22] recommends that the total combined heat flux density can be obtained simply by adding the heat flux density due to forced convection (FC) and the heat flux density from pool boiling:
q t o t a l = q c + q p b
where q t o t a l is total heat flux density, q c is the heat flux density of forced convection and q p b represents the pool boiling during nucleate boiling. Semi-empirical equations for the heat flux density in the forced convection zone (FCZ) developed by Weckman and Niessen [19] are shown. According to Weckman and Niessen’s research, the heat-transfer coefficient in the FCZ is a function of the cooling-water flow density, Q*, the water temperature, Tw, and the surface temperature, Ts:
q c = 704 T s + T w 2 + 2.53 · 10 4 T s T w Q * 1 / 3
Equation (11) was developed for the secondary cooling of aluminum alloys in the water-film FFZ. Subsequently, Carbon and Wells extended the research on convection during water cooling to impinging zone by water-jet rig test. According to Carbon and Wells’ research [23], the heat-transfer coefficient for the secondary cooling of magnesium AZ31 was similarly modeled by rearranging Equation (13):
q c , i = 16.6 T s + 71.6 T w 541 Q * 3 T s T w
q c , f = 13.2 T s + 39.5 T w + 88 Q * 3 T s T w
where q c , i and q c , f represent the heat flux density at IZ and FFZ, respectively. The heat flux density from pool boiling may be extracted from the semi-empirical equation recommended by Rohsenow [24]:
q p b , n b = k w 5.1 h w 2 c p , w 2.1 μ w 5.1 C s w 3 g ρ w ρ g σ T S T s a t 3
in which q p b , n b represents the pooling boiling during nucleate boiling stage, k w , h w   , c p , w and μ w represent the cooling water material properties of thermal conductivity, latent heat, specific heat and dynamic viscosity at saturation temperature, C s w represents a coefficient depending on surface morphology, which in this case at 1 atmosphere pressure T w is 373 K. Based on the equation above, some researchers obtained the semi-empirical equations by simplifying the equation:
q p b , n b = 20.8 T s T w 3
q p b , n b , i z = 4120 T s T w 1.40
q p b , n b , f f z = 1.96 T s T w 1.35
where q p b , n b , i z and q p b , n b , f f z represent the heat flux density at IZ and FFZ during pool boiling. To have a comprehensive perspective on nucleate boiling, a series of tests were conducted by DC simulator with various easy-to-control parameters including T i and Q * . In convection conditions, as Figure 10 shows, the experimental points have good fit on the surface. The values of correlation coefficient R2 are 0.87 and 0.86, respectively. Hence according to previous research and DC simulator experiment results, the q c T s T w Q * 1 / 3 exhibit a linear regression on T s and T w :
h c Q * 1 / 3 = q c T s T w Q * 1 / 3 = C 1 T s + C 2 T w + C 3
Double logarithmic graphs of q p b , n b and ( T s T w ) are shown in Figure 11, an intuitive understanding of q p b , n b exhibiting a linear regression on l n T s T s a t . According to the equations above, during nucleate boiling, a logarithmic transformation on the equation was made to provide a linear relationship between ln q p b , n b and ln ( T s T w ) as follows:
ln q p b , n b = C 4 ln T s T w + C 5
Based on the equations above, a comparison between the DC casting temperature measurement experiment and the calculation according to Equations (20)–(23) is shown in Figure 12a–d, the experiment points have good fitting with the surface due to the relatively high value of the correlation coefficient R2 shown in Equations (20)–(23). Further, a comparison between the DC casting temperature measurement experiment and the calculation according to Equation (17) is shown in Figure 12a–d. The heat fluxes by FC in the water-jet IZ and the water-film FFZ at the rolling and narrow faces are given by Equations (15)–(18), respectively.
q c , I Z , R F = 0.91 T s + 4.47 T w 675.16 Q * 3 T s T w , R 2 = 0.82
q c , I Z , N F = 2.14 T s + 0.92 T w + 1461.64 Q * 3 T s T w , R 2 = 0.90
q c , F F Z , R F = 0.79 T s + 2.44 T w 316.52.5 Q * 3 T s T w , R 2 = 0.77
q c , F F Z , N F = 2.1 T s + 1.67 T w + 708.35 Q * 3 T s T w , R 2 = 0.81
where q c , I Z , RF and q c , I Z , N F represent the IZ heat flux density by convection at RF and NF, q c , F F Z , R F and q c , F F Z , N F represent the FFZ heat flux density by conduction at RF and NF. As the double logarithmic graph in Figure 12 shows, obvious linear relationships between ln q p b , n b and ln T s T s a t are presented. Obviously, data points in Figure 13a under different parameters were similar to the data points in Figure 13b, which means the casting parameters have barely any influence on the trend of nucleate boiling. Based on Equation (19) and the analysis above, the equations according to Figure 12 are given as follows at rolling and narrow face:
ln q b , nb , R F = 0.82 ln T s T w + 8.08 ,   R 2 = 0.99 ,
ln q b , nb , N F = 0.88 ln T s T w + 8.84 ,   R 2 = 0.98
where ln q b , nb , R F and ln q b , nb , N F represent the heat flux density by boiling at RF and NF. Based on the above calculation and equations, the q t o t a l can be classified into two parts including forced convection and nucleate boiling under the condition of pool boiling, as recommended by Rohsenow [25,26]. During the convection process, the q c T s T w Q * 1 / 3 exhibits a linear regression on T s and T w , which means the water flow rate density Q * , as an easy-to-control parameter during DC casting, has a significant influence on the convection part. During the nucleate boiling stage, a similar linear relationship was found between the logarithmic parameters of heat flux density q and surface temperature T s . In addition, the casting parameters such as water flow rate density Q * and initial temperature T i scarcely have an influence on the trend of the boiling curve at the nucleate boiling stage. Further, the higher intensity of convection at IZ supports the view of an extremely higher cooling intensity at IZ compared with FFZ.

4.2.3. Simplify the Transition Boiling

To control the heat exchange between the slab and falling water film, the impact of the easy-to-control parameters especially the initial temperature T i when the falling water film is coming to impinge the surface, and Q * on its temperature ( T c h f ) is important. The water spray quenching test results conducted by the DC water-cooling simulator on different T i and Q * heat flux density corresponding to surface temperature are shown in Figure 14a,b, under the conditions of an increasing initial temperature with the same Q * , the T c h f increased at a relatively low temperature stage and was nearly constant at a relatively high temperature. It had good accordance with the AA5182 alloys shown in Figure 12c. Similarly, the values of T c h f in Table 3 combined with Figure 15a,b at RF and NF had scarcely changed during DC casting. Further, the value of CHF was dependent on the variations of T c h f according to Figure 12d. However, the changes of T c h f under the condition of increasing Q * with the same T i were hardly noticeable compared with the condition of increasing T i .
According to the description and analysis above, the influence of the easy-to-control parameters T i and Q * on T c h f and CHF during the water spray quenching was studied. A DC simulator test indicated the increase in T i and Q * resulted in the increase in T c h f at relatively low temperatures and almost no variations of T c h f at relatively high temperatures. T c h f is considered as having no change according to the AZ80Y DC casting experiment and such easy-to-control parameters have no influence on T c h f during DC casting in the secondary cooling zone. The value of CHF is dependent on the occurrences of T c h f .
As shown in Figure 15, the nucleate boiling dominated both at IZ and FFZ under the conditions of the tests without covering with heat insulation film at the crystallizer water block inner wall. The transition boiling was shared with the nucleate boiling in IZ due to the relatively high T i from the covering heat insulation film. During the transient boiling, there was an intermediate state between the film boiling and nucleate boiling states. As transition boiling took place and the surface temperature went down, the portion of the surface which was wetted by the cooling water increased, whereas the portion covered by the vapor blanket decreased. Systematic studies on boiling curves for water-jet spray cooling onto alloys, including AA1050 [26], AA3004 [26] and carbon steel [27,28,29,30], showed that the slope (k) in the transition boiling zone is a function of the thermal conductivity k. However, they concluded that the variations of ( d q d T ) in the boiling curves were independent of the surface temperature or the water flow rate, which could be attributed to random variations. Until now, qualifying the surface heat flux density in transition boiling using parameters is controversial.
In this study, as Figure 15 shows, the slope of the boiling curve in this regime was nearly constant at relatively higher temperatures, and gradually decreased to zero at the CHF. The variations of slope also depended on T i and T c h f by an intuitive understanding according to Figure 14a,b. In a practical DC casting situation, the value of T c h f is nearly constant which means the Ti dominates the slope during the transition boiling zone.
In consequence, to quantify the transition boiling slope, a valuation of T i with the value of solidus line temperature due to extremely high T i by covering heat insulation film and relatively low surface heat density q i compared with by q c h f film boiling:
q t b = q c h f q i T c h f T s l · T T c h f + q c h f q c h f T c h f T s l T T c h f + q c h f

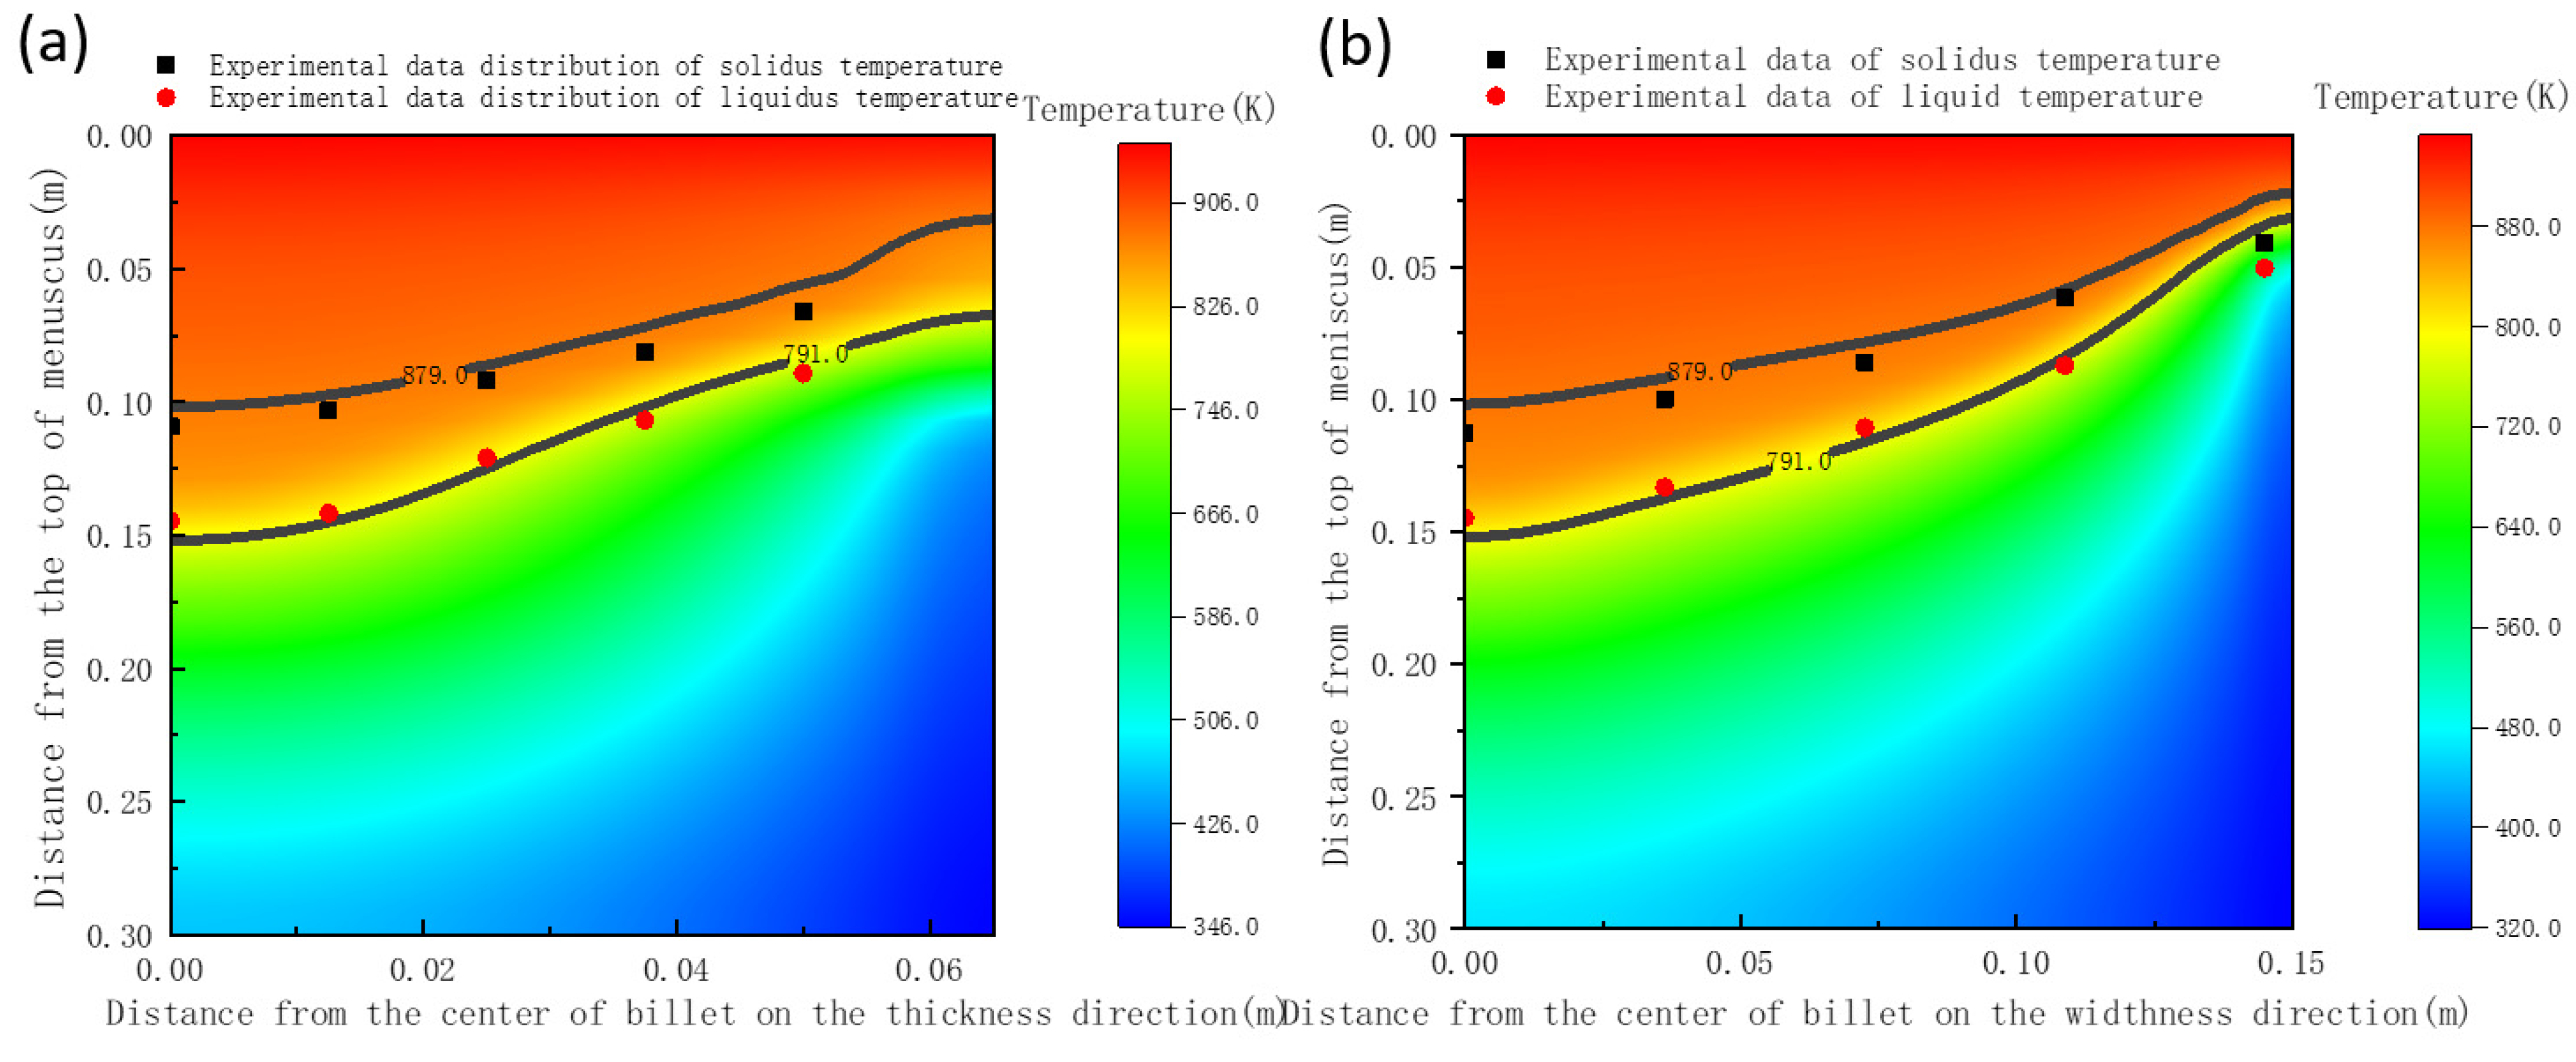
5. Verification and Comparison with Experimental Results by Numerical Method

A comparison between the experimental data of temperature during DC casting and the calculated data of temperature by computer at the symmetry surfaces S1 and S2 is shown in Figure 16. The correlation coefficient R2 between the calculated data and experimental data exhibited a significant positive correlation with the values of 0.85 (liquidus temperature at Sx face), 0.73 (liquidus temperature at Sy face), 0.93 (solidus temperature at Sx face) and 0.92 (solidus temperature at Sy face), which means the secondary cooling thermal conditions based on the semi-empirical models in this paper exhibit high accuracy.

6. Summary

In this study, an AZ80 magnesium alloy slab was subjected to the detection and tracking of temperature during the secondary cooling process of DC casting under different easy-to-control parameters including T i by changing the primary cooling (PF) condition and Q*. The cooling law in the secondary cooling process was analyzed by exhibiting the regularity of the temperature distribution at the rolling face (RF) and narrow face (NF), studying the heat transfer mechanism by designing the DC secondary cooling simulator test and subsequently quantifying the casting parameters, such as T i and Q * , based on the DC casting temperature-measurement test and DC secondary cooling simulator test. In this series of tests, the free-falling water film sprayed from a water jet was always ejected under the impinging zone due to the relatively high temperature and most heat removal took place in the impinging zone. The whole process can be classified into three stages according to time: (a) at first, the free-falling water film comes to impinge the measuring point, the temperature decrease takes place at the measuring point because of the advanced cooling front effect and air convection; (b) then, the measuring point is covered with the impinging water film; the sharp temperature decrease takes place because of the unique and extremely enhanced impinging and wetting effect in the impingement zone; (c) finally, the free-falling water film moves up, relatively, and the measuring point is located at the ejecting zone, due to the relatively low heat transfer from stable film boiling, the reheated phenomenon takes place with a slight temperature increase. The influence of the easy-to-control parameters T i and Q * on T c h f and CHF during the water spray quenching were studied. The DC simulator test indicated the increasing T i and Q * resulting in the increasing T c h f at relatively low temperatures and almost no variations of T c h f at relatively high temperatures. T c h f was considered as having no change according to the AZ80Y DC casting experiment and such easy-to-control parameters have no influence on T c h f during DC casting in the secondary cooling zone. The value of CHF is dependent on the occurrence of T c h f . The concrete results are as follows:
(1) The impinging zone height H i is sensitive to the water spray flow rate density Q * , and exhibits a similar linear relationship with Q * due to the correlation coefficient R2 being 0.85. The expression is given as follows:
H i = 0.0208 Q * + 11.71 ,
(2) The q t o t a l can be classified into two parts including forced convection and nucleate boiling under the condition of pool boiling. During the convection process, the q F C T s T w Q * 1 / 3 exhibits a linear regression on T s and T w , which means the water flow rate density Q * , as an easy-to-control parameter during DC casting, has a significant influence on the convection part. During the nucleate boiling stage, a similar linear relationship was found between the logarithmic parameters of heat flux density q and surface temperature T s . In addition, the casting parameters, such as water flow rate density Q * and initial temperature T i , have scarcely any influence on the trend of the boiling curve at the nucleate boiling stage. Further, the higher intensity of convection at IZ supports the view of an extremely high cooling intensity at IZ compared with FFZ. The expressions and correlation coefficient R2 described above are given as follows:
q c , I Z , R F = 0.91 T s + 4.47 T w 675.16 Q * 3 T s T w
q c , I Z , N F = 2.14 T s + 0.92 T w + 1461.64 Q * 3 T s T w
q c , F F Z , R F = 0.79 T s + 2.44 T w 316.52.5 Q * 3 T s T w
q c , F F Z , N F = 2.1 T s + 1.67 T w + 708.35 Q * 3 T s T w
ln q b , nb , R F = 0.82 ln T s T w + 8.08
ln q b , nb , N F = 0.88 ln T s T w + 8.84
( 3) The nucleate boiling dominated both at IZ and FFZ under the conditions of the tests without covering heat insulation film at the crystallizer water block inner wall. The transition boiling shared with the nucleate boiling in the IZ due to the relatively high T i from the covering heat insulation film. The values of T c h f at RF and NF were 667.78 and 571.94 by averaging the T c h f , according to Table 3.
(4) During the transition boiling stage, the slope of the boiling curve in this regime was nearly constant at relatively higher temperatures, and gradually decreased to zero at the CHF corresponding point. The variations of slope also depended on T i and T c h f . In a practical DC casting situation, the values of T c h f are nearly constant which means the Ti dominates the slope during the transition boiling zone. In consequence, the valuation of T i with the value of solidus line temperature due to extremely high T i by covering with heat insulation film at the primary cooling zone and with a relatively low surface heat density q i compared with by q c h f film boiling is shown as:
q t b = q c h f q i T c h f T s l · T T c h f + q c h f q c h f T c h f T s l · T T c h f + q c h f
(5) A comparison between the experimental data of temperature during DC casting and the calculated data of temperature by computer at the symmetry faces Sx and Sy revealed that, based on the semi-empirical models in this paper, it exhibited high accuracy due to the correlation coefficient R2 between the calculated data and experimental data and also exhibited a significant positive correlation with the values of 0.85 (liquidus temperature at Sx face), 0.73 (liquidus temperature at Sy face), 0.93 (solidus temperature at Sx face) and 0.92 (solidus temperature at Sy face).

Author Contributions

Conceptualization, J.H. and Q.L.; methodology, J.H., W.H., F.N.; software, J.H.; validation, J.H., W.H. and R.G.; formal analysis, J.H.; investigation, J.H. and X.Y.; resources, J.H. and W.H.; data curation, J.H.; writing—original draft preparation, J.H.; writing—review and editing, J.H. and X.C.; visualization, J.H. and L.F.; supervision, Q.L.; project administration, Q.L.; funding acquisition, Q.L. All authors have read and agreed to the published version of the manuscript.

Funding

This research is financially co-supported by the National Key Research and Development Program of China (2017YFB0305504), the National Natural Science Foundation of China (51771043) and Fundamental Research Funds for the Central Universities (N2009003) and the National Natural Science Foundation of China (51904151).

Institutional Review Board Statement

Not applicable.

Informed Consent Statement

Not applicable.

Data Availability Statement

Not applicable.

Conflicts of Interest

The authors declare no conflict of interest.

References

  1. Endo, S. Studies on the Prevention of Corrosion of Metallic Magnesium and Magnesium Alloy by Methanol. 1945. Available online: https://www.osti.gov/biblio/5954349 (accessed on 23 September 2022).
  2. Schwartz, R.T.; Martell, G.M. Mechanical Properties of Magnesium-Alloy Tubing. J. Aeronaut. Sci. 1945, 12, 31–38. [Google Scholar] [CrossRef]
  3. Cui, Q.; Ohori, K. Grain refinement of an AZ31 magnesium alloy by asymmetric rolling. J. Exp. Educ. 1934, 2, 278–282. [Google Scholar]
  4. Chen, X.; Wang, H.; Zou, Q.; Le, Q.; Wen, C.; Atrens, A. The influence of heat treatment on discharge and electrochemical properties of Mg-Gd-Zn magnesium anode with long period stacking ordered structure for Mg-air battery. Electrochim. Acta 2020, 367, 137518. [Google Scholar] [CrossRef]
  5. Chen, X.; Ning, S.; Wang, A.; Le, Q.; Liao, Q.; Jia, Y.; Cheng, C.; Li, X.; Atrens, A.; Yu, F. Microstructure, mechanical properties and corrosion behavior of quasicrystal-reinforced Mg-Zn-Y alloy subjected to dual-frequency ultrasonic field. Corros. Sci. 2019, 163, 108289. [Google Scholar] [CrossRef]
  6. Bai, Y.; Wei, R.; Le, Q.; Zhang, H. Effect of Start-Up Levels on the Stress–Strain Field and Cracking Tendency during Direct-Chill Casting of Magnesium Alloy AZ80. Adv. Eng. Mater. 2016, 18, 1600–1608. [Google Scholar] [CrossRef]
  7. Chen, X.; Jia, Y.; Le, Q.; Ning, S.; Li, X.; Yu, F. The interaction between in situ grain refiner and ultrasonic treatment and its influence on the mechanical properties of Mg–Sm–Al magnesium alloy. J. Mater. Res. Technol. 2020, 9, 9262–9270. [Google Scholar] [CrossRef]
  8. Sengupta, J.; Cockcroft, S.L.; Maijer, D.; Wells, M.A.; Larouche, A. The effect of water ejection and water incursion on the evolution of thermal field during the start-up phase of the direct chill casting process. J. Light Met. 2002, 2, 137–148. [Google Scholar] [CrossRef]
  9. Hu, W.; Le, Q.; Zhang, Z.; Bao, L.; Liu, X.; Shao, Z.; Cui, J. The effect of low frequency-electromagnetic field on temperature field and microstructure during magnesium slab casting process. Cast Met. 2016, 29, 228–235. [Google Scholar] [CrossRef]
  10. Combeau, H.; Zalonik, M.; Bedel, M. Predictive Capabilities of Multiphysics and Multiscale Models in Modeling Solidification of Steel Ingots and DC Casting of Aluminum. JOM 2018, 68, 2198–2206. [Google Scholar] [CrossRef] [Green Version]
  11. Jensen E, K. “Mathematical Model Calculations in Level Pour, D.C. Casting of Aluminum Extrusion Ingots”, Light Metals 1980; The Minerals, Metals and Materials Society: Warrendale, PA, USA, 1980; pp. 631–642. [Google Scholar]
  12. Bao, L.; Zhang, Z.Q.; Le, Q.C.; Ru, L.-I.; Cui, J.-Z. Heat transfer behavior of AZ80–1%Y alloy during low-frequency electromagnetic casting. Trans. Nonferrous Met. Soc. China 2015, 25, 3618–3624. [Google Scholar] [CrossRef]
  13. Lu, E.H.; Maijer, D.M.; Hao, H.; Sediako, D. A Mathematical Model of Heat Transfer and Fluid Flow in the Direct Chill Casting of AZ31 Magnesium Billets//Magnesium Technology 2005; Department of Materials Engineering, The University of British Columbia: Vancouver, BC, Canada, 2005. [Google Scholar]
  14. Sengupta, J.; Cockcroft, S.L.; Weckman, D.M.; Larouche, A. Quantification of temperature, stress, and strain fields during the start-up phase of direct chill casting process by using a 3D fully coupled thermal and stress model for AA5182 ingots. Mater. Sci. Eng. A Struct. Mater. 2005, 397, 157–177. [Google Scholar] [CrossRef]
  15. Drezet, J.M.; Rappaz, M.; Carrupt, B.; Plata, M. Experimental investigation of thermomechanical effects during direct chill and electromagnetic casting of aluminum alloys. Metall. Mater. Trans. B 1995, 26, 821–829. [Google Scholar] [CrossRef]
  16. Podowski, M.Z.; Alajbegovic, A.; Kurul, N.; Dreaw, D.A.; Lahey, R.T., Jr. Mechanistic modeling of CHF in forced-convection subcooled boiling. Off. Sci. Tech. Inform. Tech. Rep. 1997, 30, 30035947. [Google Scholar]
  17. Etienne, C. Secondary Cooling in the Direct-Chill Casting of Light Metals; University of British Columbia: Vancouver, BC, Canada, 2008. [Google Scholar]
  18. Weckman, D.C. A numerical simulation of the D.C. continuous casting process including nucleate boiling heat transfer. Metall. Mater. Trans. B 1982, 13, 593–602. [Google Scholar] [CrossRef]
  19. Rohsenow, W.M. Heat Transfer with Boiling. In Developments in Heat Transfer; The M.I.T. Press: Cambridge, MA, USA, 1964; pp. 169–260. [Google Scholar]
  20. Rohsenow, W.M. Heat Transfer with Boiling. In Modem Developments in Heat Transfer; Ibele, W., Ed.; Academic Press: New York, NY, USA, 1963; pp. 85–158. [Google Scholar]
  21. Rohsenow, W.M. Boiling. In Handbook of Heat Transfer; Rohsenow, W.M., Hamett, J.P., Eds.; McGraw-Hill Book Comp.: New York, NY, USA, 1973; pp. 13–133 to 13–74. [Google Scholar]
  22. Caron, E.; Wells, M.A. Secondary Cooling in the Direct-Chill Casting of Magnesium Alloy AZ31. Metall. Mater. Trans. B 2009, 40, 585–595. [Google Scholar] [CrossRef]
  23. Rohsenow, W.M. Heat Exchangers—Theory and Practice. Nucl. Technol. 1984, 65, 170–171. [Google Scholar] [CrossRef]
  24. Grandfield, J.F.; Hoadley, A.; Instone, S. Water Cooling in Direct Chill Casting: Part 1, Boiling Theory and Control. In Proceedings of the Technical Session on Light Metals Held at the TMS Annual Meeting 1997, Orlando, FL, USA, 9–13 February 1997. [Google Scholar]
  25. Li, D. Boiling Water Heat Transfer Study during DC Casting of Aluminum Alloys. Master’s Thesis, University of British Columbia, Vancouver, BC, Canada, 1961. [Google Scholar]
  26. Wells, M.A.; Li, D.; Cockcroft, S.L. Influence of surface morphology, water flow rate, and sample thermal history on the boiling-water heat transfer during direct-chill casting of commercial aluminum alloys. Metall. Mater. Trans. B 2001, 32, 929. [Google Scholar] [CrossRef]
  27. Sengupta, J.; Thomas, B.G.; Wells, M.A. Understanding the role water-cooling plays during continuous casting of steel and aluminum alloys. Metall. Sci. Technol. 2004, 2, 179–193. [Google Scholar]
  28. Caron, E.J.F.R.; Wells, M.A. Effect of Advanced Cooling Front (ACF) Phenomena on Film Boiling and Transition Boiling Regimes in the Secondary Cooling Zone during the Direct-Chill Casting of Aluminum Alloys. Mater. Sci. Forum 2006, 519–521, 1687–1692. [Google Scholar] [CrossRef]
  29. Brimacombe, J.K.; Agarwal, P.K.; Hibbins, S.; Prabhakar, B.; Baptista, L.A. Continuous Casting Vol. II: Heat Flow, Solidflcation and Crack Formation; Iron and Steel Society of AIME: Warrendale, PA, USA, 1984; pp. 109–123. [Google Scholar]
  30. Mok, J. Application of the Modified Equivalent Specific Method to the Phase Change Heat Transfer. Trans. Korean Soc. Mech. Eng. B 2005, 29, 814–819. [Google Scholar] [CrossRef]
Figure 1. Schematic illustration of temperature measurement during DC casting.
Crystals 12 01515 g001
Figure 2. Schematic diagram of DC secondary cooling simulator: (a) heat process before water cooling; (b) water spray cooling process; (c) typical heating curve; (d) water cooling curve.
Crystals 12 01515 g002
Figure 3. Typical pool boiling curve of surface heat flux density vs. surface temperature at various stages.
Crystals 12 01515 g003
Figure 4. The variations of thermal conductivity and specific heat with temperature.
Crystals 12 01515 g004
Figure 5. Schematic diagram of reverse seeking process for heat transfer coefficient.
Crystals 12 01515 g005
Figure 6. Schematic illustration of thermal conditions in numerical simulation.
Crystals 12 01515 g006
Figure 7. Graphic illustration determining the moment of thermocouples insertion into the melt and water impinging on the ingot surface.
Crystals 12 01515 g007
Figure 8. Schematic illustration of rewetting test for impingement zone height measuring.
Crystals 12 01515 g008
Figure 9. Typical measured cooling curves for IZ height test: (a) temperature decrease curve during the IZ height measurement test; (b) the enlarged zone marked in (a); (c) second derivative of temperature d2/dt2 measured during IZ height measurement; (d) impingement zone height Hi as function of water flow rate Q * .
Crystals 12 01515 g009
Figure 10. Comparison of h Q * 1 / 3 values conducted by DC secondary cooling simulator and fitted surface based on Equation (18): (a) at impingement zone (IZ); (b) at free-falling zone (FFZ).
Crystals 12 01515 g010
Figure 11. Correlation between data calculated based on Equation (19) and the data gained by DC secondary cooling simulator: (a) different T i at 473, 523, 573, 623, 673 K, respectively, at 60 L min−1 m−1; (b) different Q * at 20, 40, 60, 80, 100 L min−1 m−1 at 673 K.
Crystals 12 01515 g011
Figure 12. Comparison of h Q * 1 / 3 values conducted by DC casting temperature-measurement test and surface fitted by Equations (20)–(23): (a) impingement zone (IZ) at rolling face (RF); (b) impingement zone (IZ) at narrow face (NF); (c) free-falling zone (FFZ) at rolling face (RF); (d) free-falling zone (FFZ) at narrow face (NF).
Crystals 12 01515 g012
Figure 13. Correlation between data calculated by Equations (22) and (23) and the data gained by DC casting temperature-measurement test: (a) at RF; (b) at NF.
Crystals 12 01515 g013
Figure 14. Variations of boiling curves, CHF and T c h f with different T i and Q * by DC secondary cooling simulator tests: (a) boiling curve with different T i at 473, 523, 573, 623, 673 K, respectively, and the same Q * at 60 L min−1 m−1; (b) boiling curve with different Q * at 20, 40, 60, 80, 100 L min−1 m−1 and the same T i at 673 K; (c) the variations of T c h f at different T i ; (d) the variations of T c h f at different Q * [19,21].
Crystals 12 01515 g014
Figure 15. Boiling curves of DC casting at the secondary cooling zone with different casting parameters: (a) at RF; (b) at NF.
Crystals 12 01515 g015
Figure 16. Comparisons between results of numerical simulation and temperature-measurement experiment: (a) on thickness direction at symmetry face Sx; (b) on width direction at symmetry face Sy.
Crystals 12 01515 g016
Table 1. Chemical composition of AZ80-1Y.
ElementAlZnMnYMg
Nominal composition8.00.70.481Bal.
Table 2. Casting parameters of semi-continuous casting.
Withdrawal Speed
V/mm/min
Q* atRF
L min−1 m−1
Q* atNF
L min−1 m−1
PF (Heat Insulation Film)Tp
K
8058.6456.62All surface923
80102.6299.09None
8058.6456.62None
Table 3. The value of T c h f during DC casting temperature-measurement test.
Tchf
RF(K)
Tchf
NF(K)
V
(mm min−1)
Q*, RF
(L min−1 m−1)
Q*, NF
(L min−1 m−1)
Hi
670.91567.838058.6456.62None
669.25573.828058.6456.62RF, NF
663.18574.1880102.6299.09None
Publisher’s Note: MDPI stays neutral with regard to jurisdictional claims in published maps and institutional affiliations.

