Article

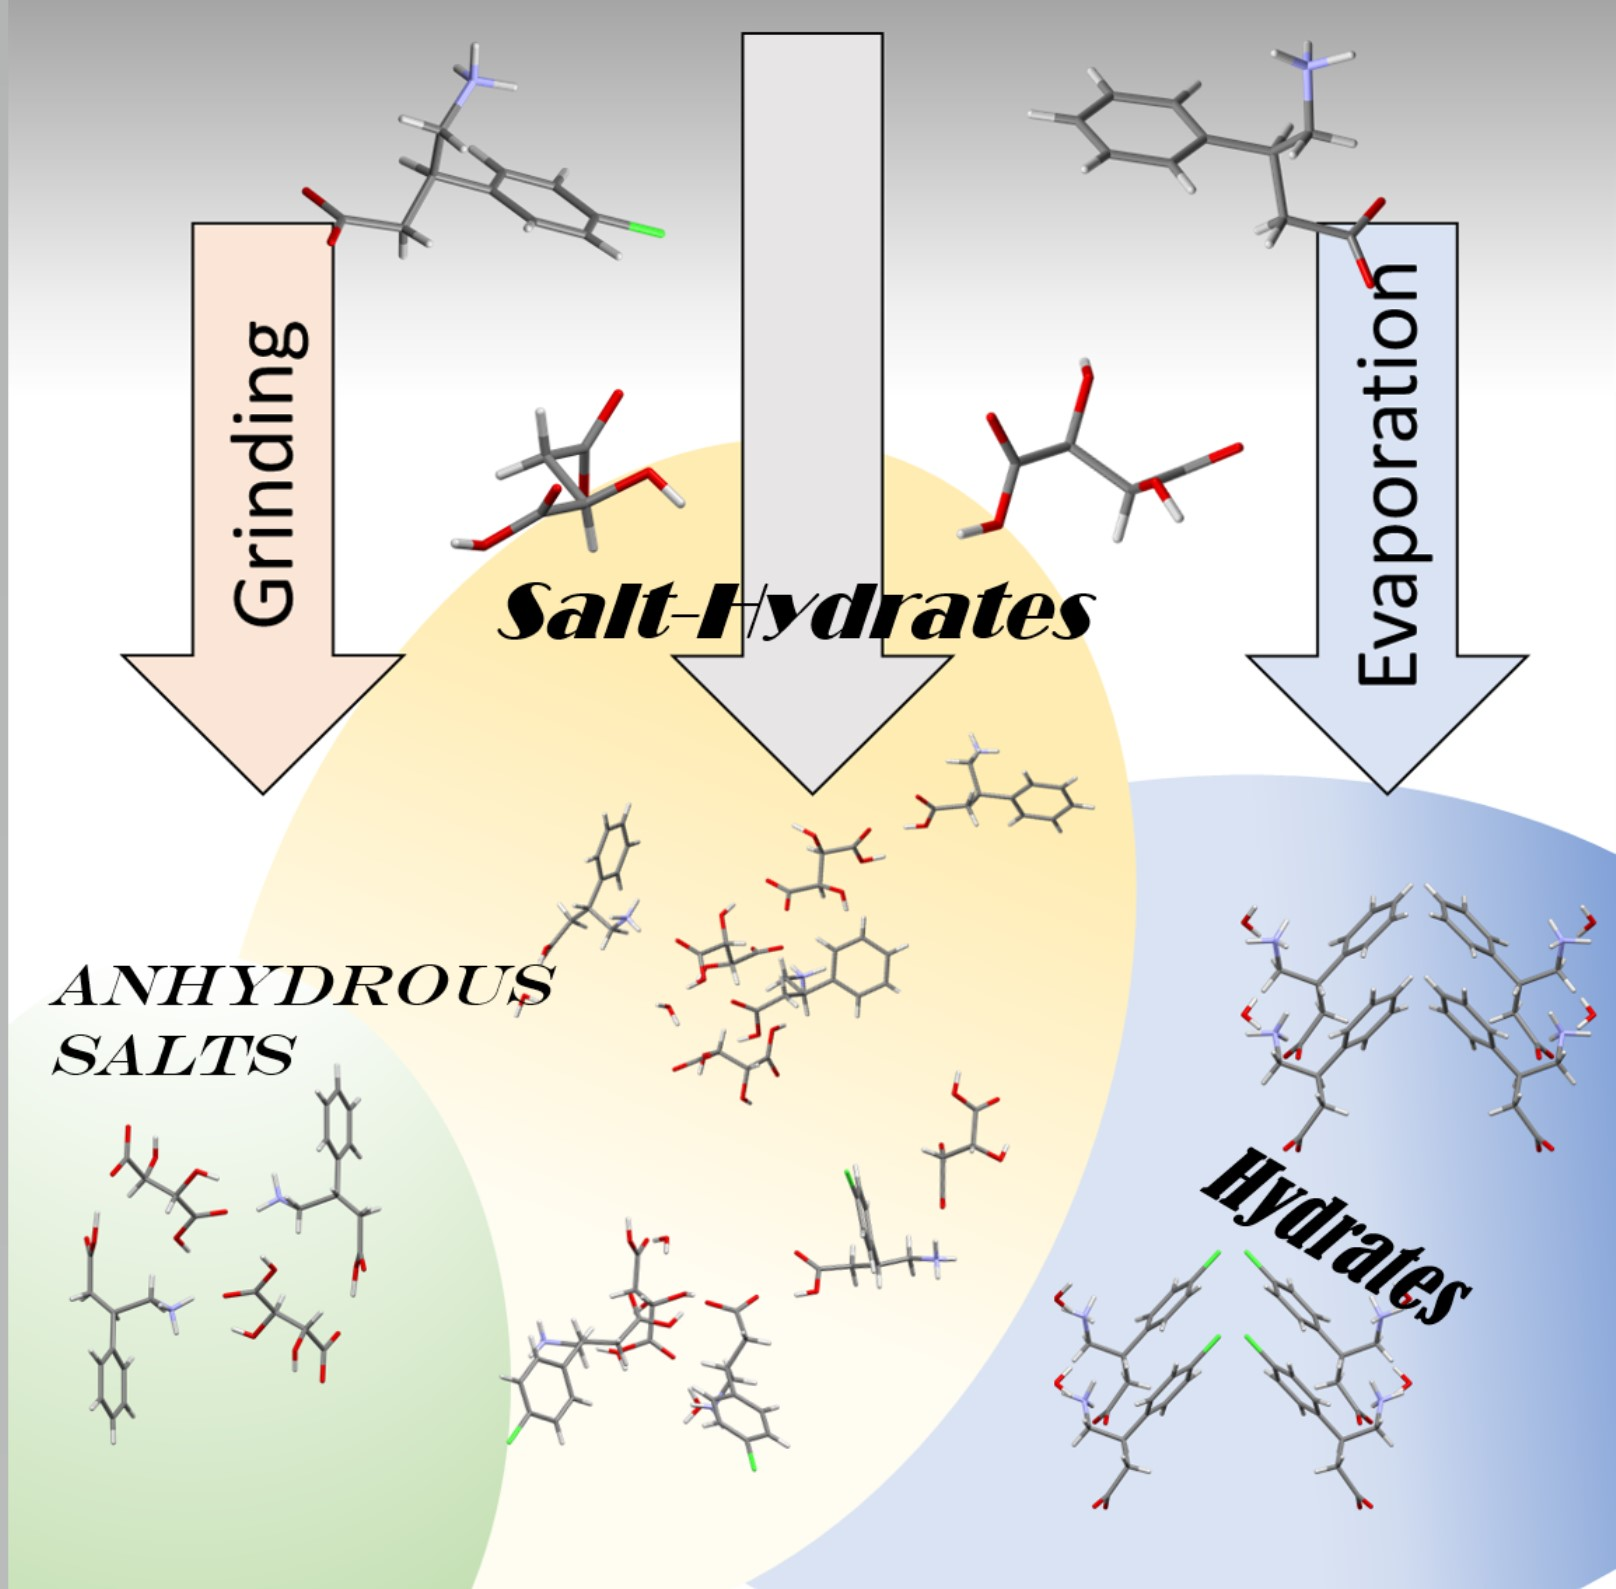
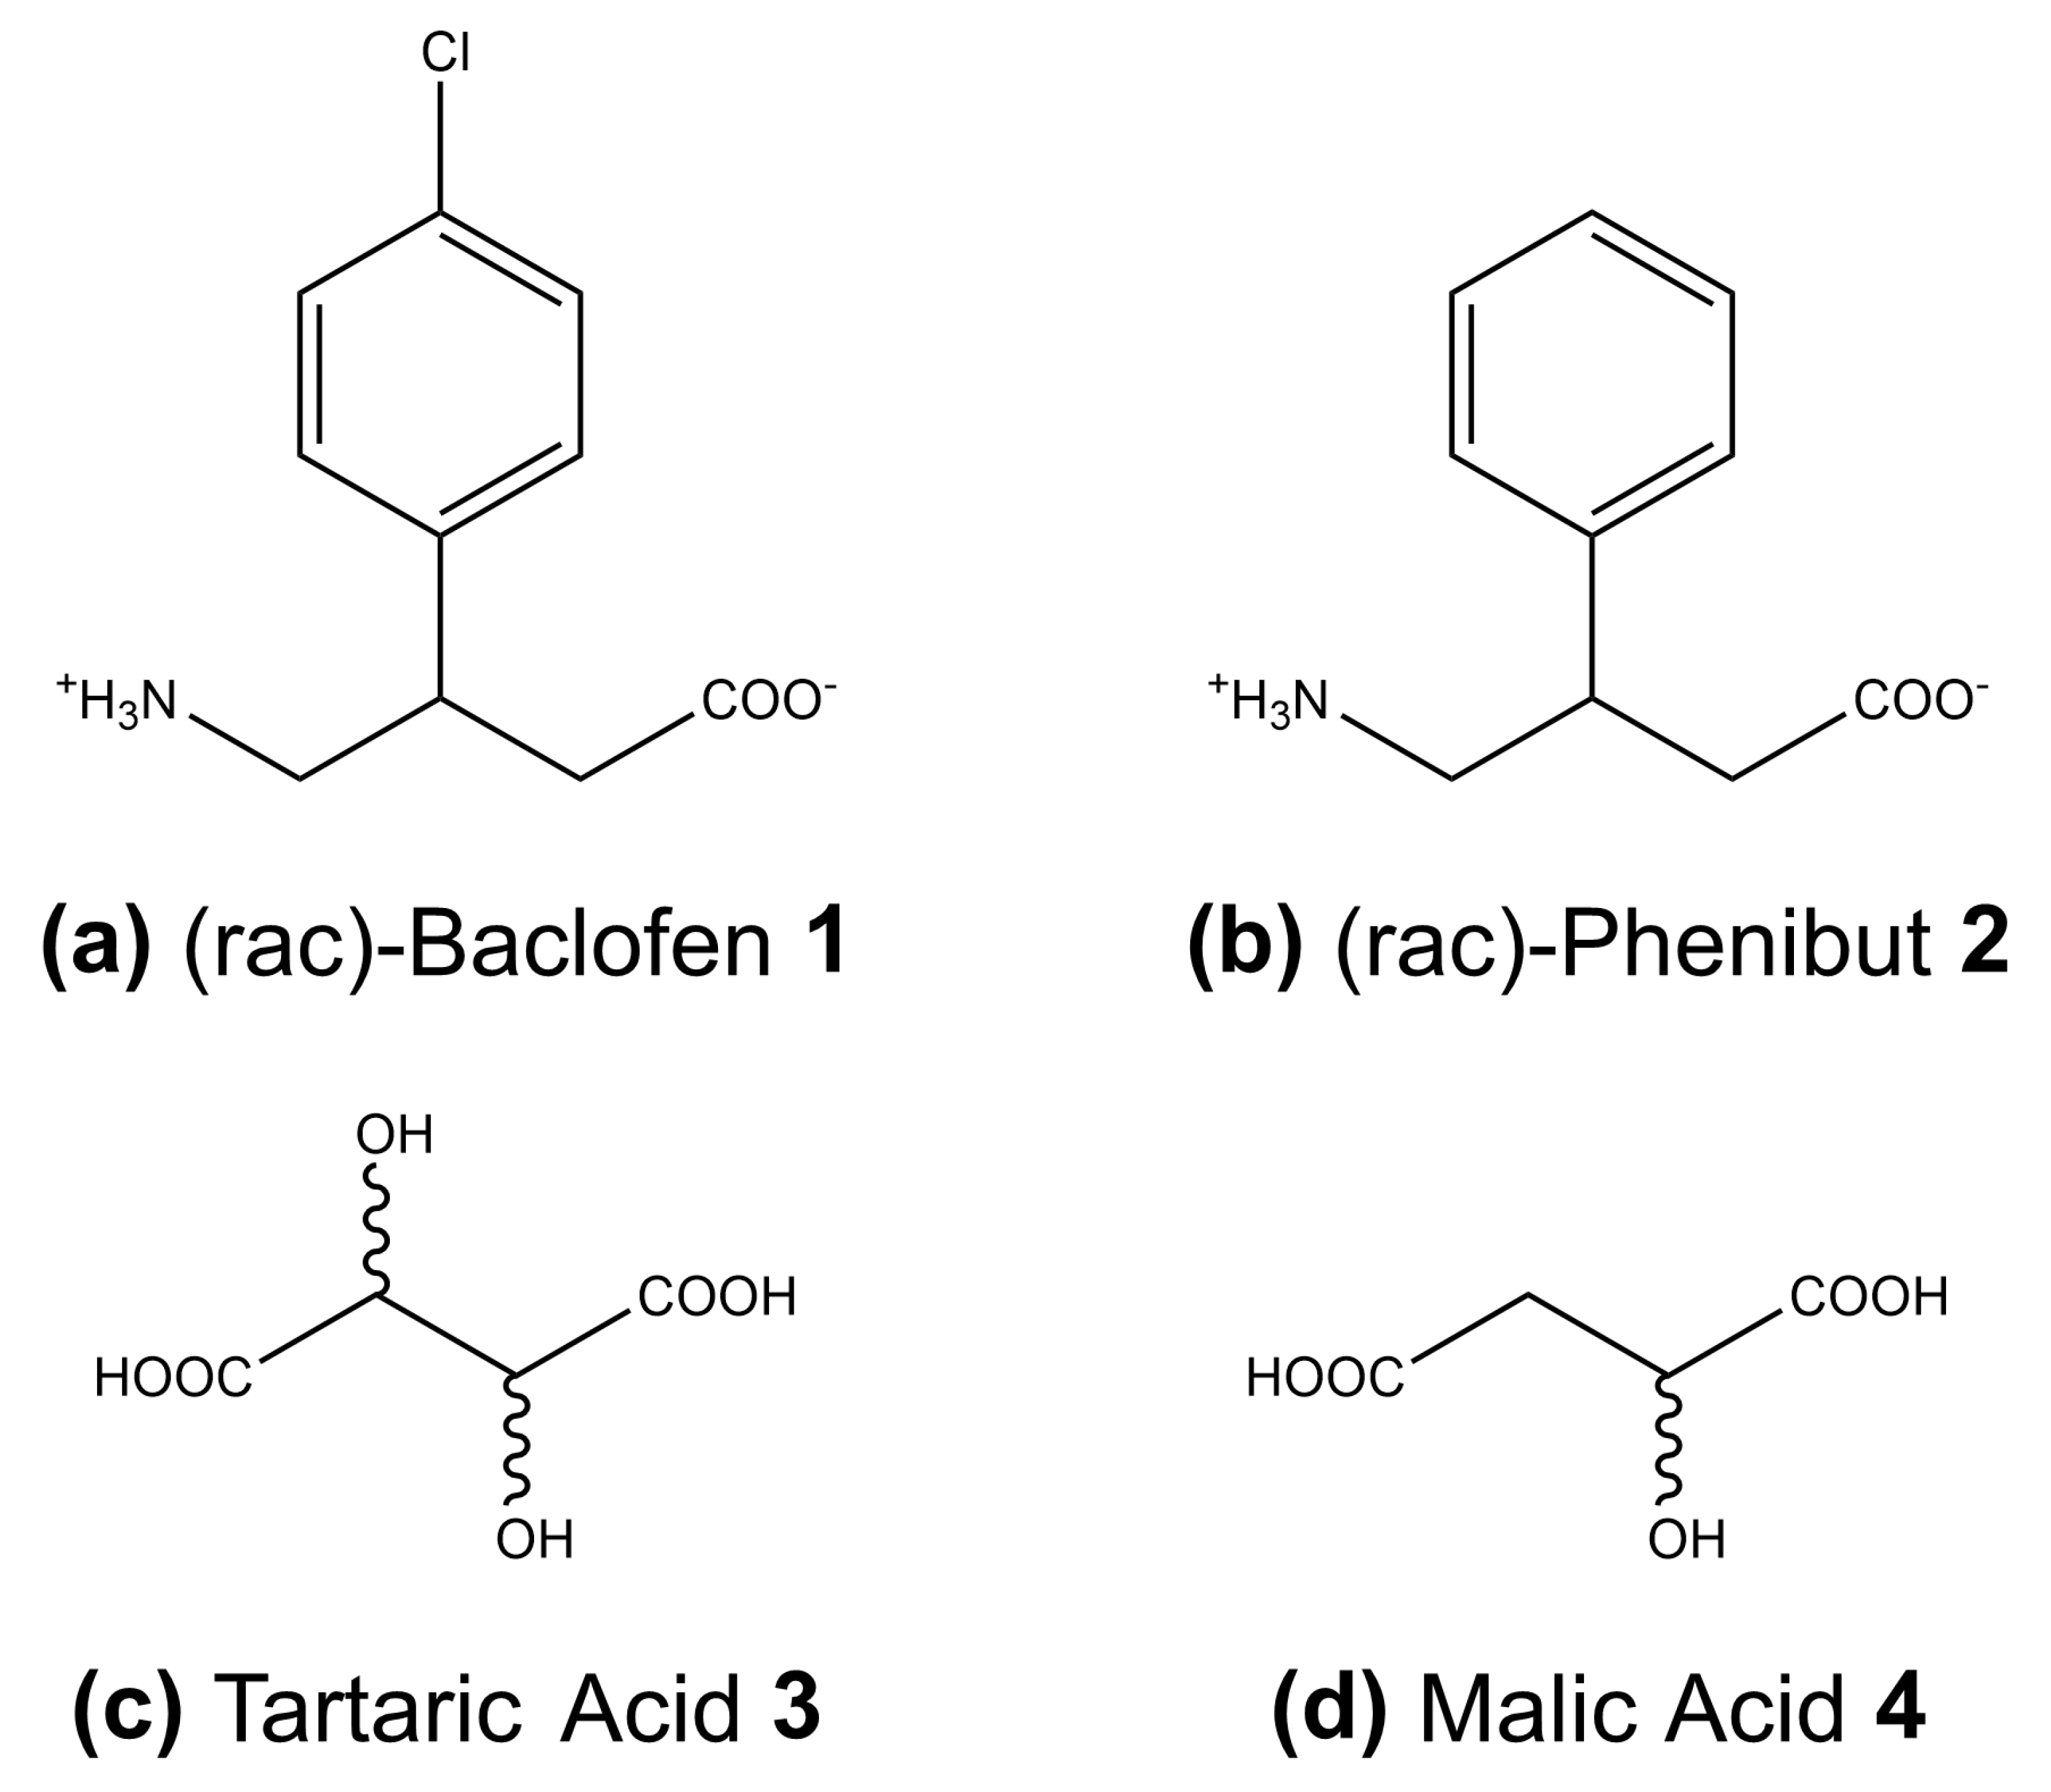
A Lection in Humbleness: Crystallization of Chiral and Zwitterionic APIs Baclofen and Phenibut

Molecular Crystal Engineering Group, Department of Inorganic and Structural Chemistry, Heinrich Heine University, 40225 Duesseldorf, Germany
*
Author to whom correspondence should be addressed.
These authors contributed equally to this work.
Crystals 2022, 12(10), 1393; https://doi.org/10.3390/cryst12101393
Submission received: 25 August 2022 / Revised: 22 September 2022 / Accepted: 23 September 2022 / Published: 1 October 2022

Abstract

:
Crystallization and multicomponent crystal formation of active pharmaceutical ingredients Baclofen and Phenibut with dicarboxylic acid co-formers are discussed. The crystallization process of several crystalline entities is elucidated via single crystal—as well as powder X-ray—diffraction, followed by thermal analysis and phase stability studies over time. Both APIs form increasingly complex crystalline phases with co-formers malic and tartaric acid, where phase purity of a desired compound is not necessarily a given. Therefore, the influence of different solution and milling environments during crystallization on the outcome is studied. Emphasis is laid on how molecular influences such as the chirality, propensity to form hydrates as well as low solubility of Baclofen and Phenibut impede attempts to gather high-quality single crystals. The results highlight that targeted crystallization of these compounds with dicarboxylic acids can be difficult and unreliable.

Graphical Abstract

1. Introduction

Targeted synthesis of a desired crystalline modification remains a core objective in crystal engineering, and manifold approaches for various applications are continuously developed [1,2,3,4]. Occurrences of polymorphism, hydrate or solvate formation can hinder crystal synthesis of the wanted product, especially if said product is not the thermodynamically most stable variant [5,6,7,8]. The underlying challenge is a common tendency among many compounds—to crystallize in varying forms during all stages of the crystallization process. This empirical observation was first conducted by Wilhelm Ostwald in 1897 [9]. Presently, progress is made in understanding how crystal growth occurs from molecular to nanocluster stages [10,11,12,13] and how factors such as solvent medium, saturation, temperature or presence of ‘impurities’ impact the crystallization product [14,15,16,17,18]. The influence of molecular chirality on crystal formation, as well as methods to determine the chiral outcome of a crystallization batch, were recently enhanced [19,20,21]. This is especially important for the pharmaceutical industry, as eutomer, the product of desired chirality, and distomer, the by-product of undesired chirality, can vary widely in their effectiveness. Receiving active pharmaceutical ingredients (APIs) in their desired crystalline phase with the correct chirality must be accomplished to guarantee reliable product effectiveness and, therefore, marketability [6,8,22,23,24].
APIs Phenibut ((RS)-4-amino-3-phenylbutanoic acid) and Baclofen ((RS)-4-amino-3-(4-chloro-phenyl) butanoic acid) are structurally similar γ-amino butanoic acid (GABA) derivatives with a phenyl subunit on C3. Both pose a chiral center in that position, with the (R)-form being the eutomer [25,26,27,28]. The sole difference is a chloro-subunit on the phenyl-ring in Baclofen in the p-position in regard to the GABA chain. Baclofen is commonly used in the treatment of spastic diseases [29,30,31], but its potential in the treatment of alcohol addiction is an additional topic of interest [32,33,34]. Contrary to that, Phenibut is not actually approved for medical use in the US, Europe or Australia but is classified as a dietary supplement, research chemical or new psychoactive substance [25,35,36,37,38]
Different attempts at multicomponent crystal formation on racemic Baclofen (1) and Phenibut (2) were conducted from solution with pure enantiomers and racemic mixtures of dicarboxylic acids tartaric acid (3) and malic acid (4) (Scheme 1). Since 1 and 2 show extremely poor solubility in almost every solvent except for water, limiting the choice of the solvent for the supramolecular synthesis and single crystals growth, a mechanochemical crystallization was performed as an alternative route to access the desired products. Various multicomponent species, including hydrates, salts and salt hydrates, were obtained, eight of which could be characterized via single crystal X-ray diffraction (SC-XRD). Powder X-ray diffraction (PXRD) shows how some of the obtained phases remain stable even after months while others undergo quick phase transitions. Furthermore, differential scanning calorimetry (DSC) investigations highlight that while a similar melting range is present in all compounds, multiple transitions can occur upon heating, and recrystallization by re-cooling can never be achieved. The present study aims to link these findings to molecular peculiarities in Baclofen and Phenibut, namely their chirality, zwitterionic charge status and phenyl-subunit. The latter distinguishes them from other GABA derivative APIs, such as Pregabalin and Gabapentin, with a comparatively reliable crystallization behavior [39,40]. By placing the herein investigated molecules in a larger context of other pharmaceutically active GABA derivatives, the massive influence of small molecular changes in otherwise similar entities is highlighted. Thus, the limits of relatively simple crystallization behavior predictions for these compounds are presented.

2. Materials and Methods

2.1. Chemicals

Baclofen and hexafluoropropan-2-ol were purchased from flurochem. Phenibut was purchased from Combi-Blocks (San Diego, United States). Enantiopure tartaric acid was bought from J&K Scientific (Beijing, China). Racemic tartaric acid was purchased from Carl Roth (Karlsruhe, Germany), D-malic acid was purchased from BLD pharm (Shanghai, China) and L-malic acid was purchased from Glentham Life Science (Corsham, United Kingdom). All chemicals were used without further purification.

2.2. Sample Preparation

Single Crystals. Equimolar amounts of the APIs (0.5 mmol) and the chosen co-formers (0.5 mmol) were dissolved in water (all systems); additionally, water: ethyl acetate (1:14) mixture and hexafluoropropan-2-ol were used for Baclofen: malic acid systems. Single crystals suitable for SC-XRD were obtained by diffusion crystallization from aqueous solution using acetonitrile as an antisolvent for Phenibut hydrate and Baclofen hydrate as well as from hexafluoropropan-2-ol solution for Baclofen: malic acid hydrate. All other single crystals were obtained by slow evaporation of the solvent from aqueous solution at room temperature.
Powder samples. Crystalline powder samples were obtained from solution under the same conditions described before. Samples were vacuum dried in a Büchi 585 Drying vacuum oven at 100 °C and 10−1 bar for 2 h. Furthermore, liquid-assisted grinding (LAG) experiments were conducted using equimolar amounts of API (0.5 mmol) and co-former (0.5 mmol) with 10 μL of methanol in a Retsch MM400 ball mill with 10 mL stainless steel containers and 2 ZrO2 balls (diameter: 1 cm), milling for 30 min at 25 Hz.

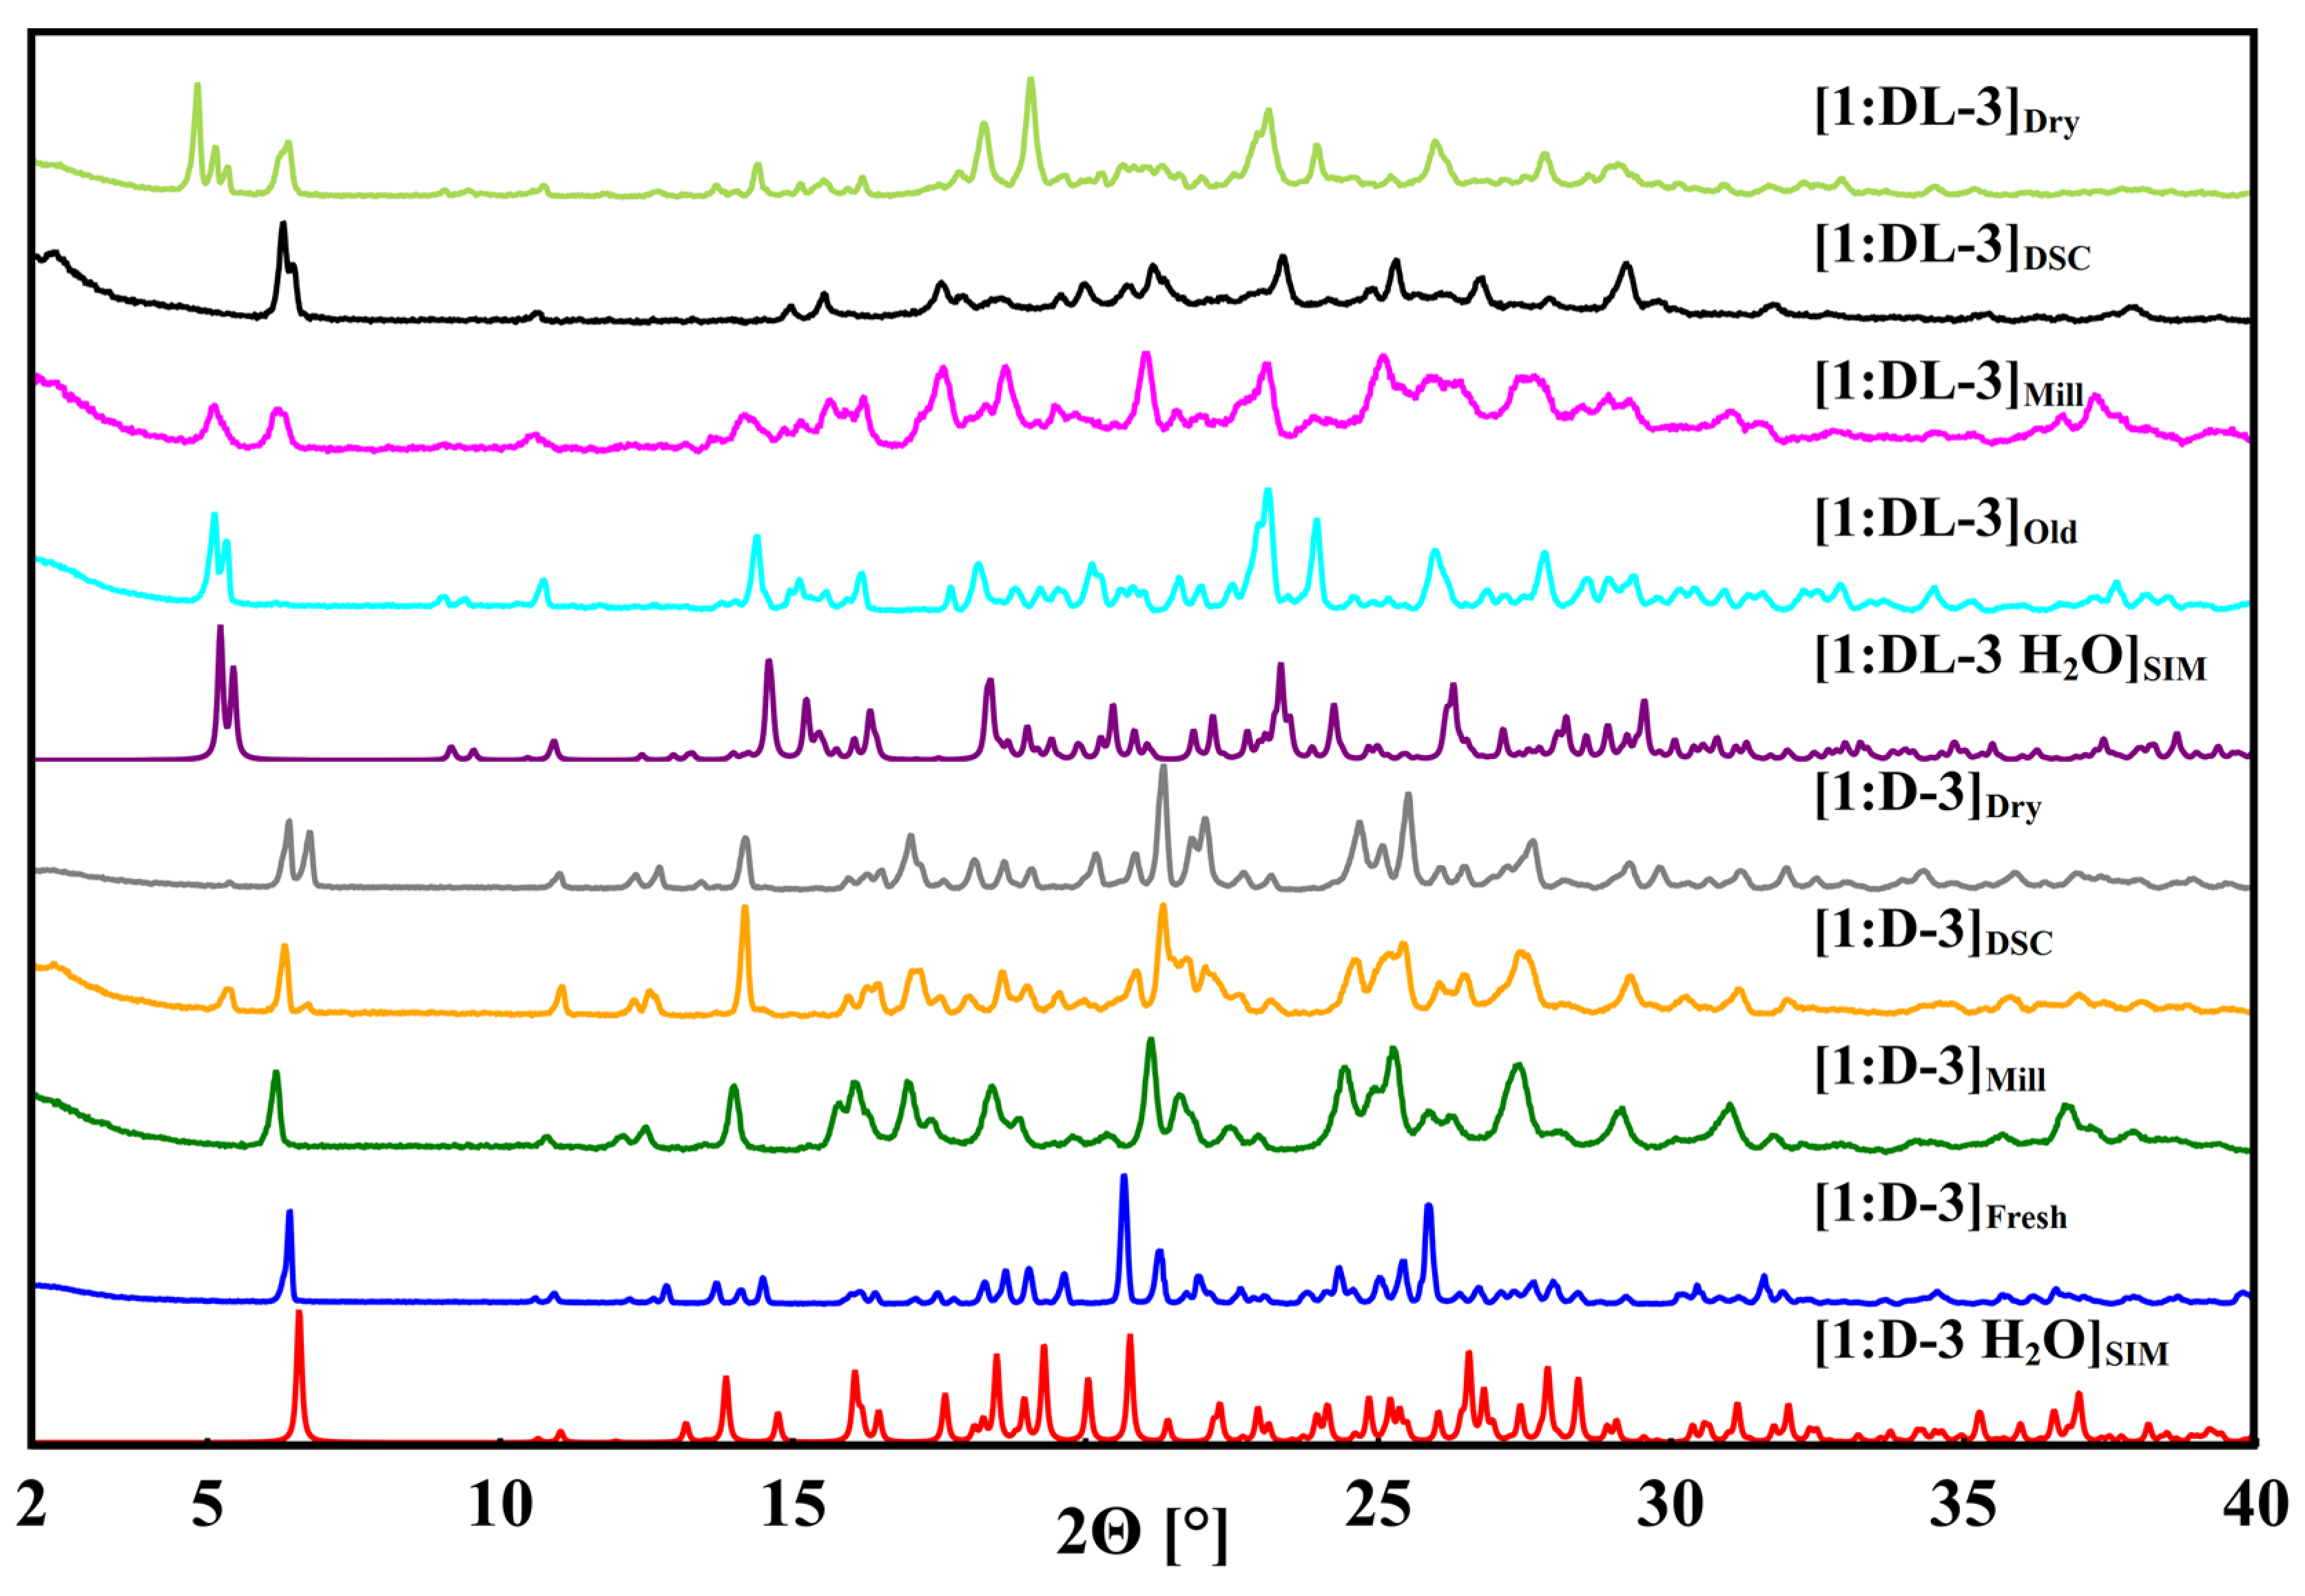
2.3. Powder X-ray Diffraction (PXRD)

Powder patterns of the obtained samples were measured on a Rigaku Miniflex 300 using Cu Kα radiation (λ = 1.54182 Å). The measurements were conducted at ambient temperature in ϴ/2ϴ geometry between 5° and 50° with a runtime of ten minutes.

2.4. Single-Crystal X-ray Diffraction (SC-XRD)

Suitable crystals were carefully selected under a polarized-light microscope, covered in protective oil and mounted on a cryo-loop. Following that, crystals were selected for SC-XRD experiments: a needle-shaped colorless crystal of 1 • H2O (size 0.87 • 0.06 • 0.05 mm); a plate-shaped colorless crystal of 2 • H2O (size 0.11 • 0.09 • 0.03 mm); a plate-shaped colorless crystal of 1:L−3 • H2O (size 0.18 • 0.06 • 0.05 mm); a block-shaped colorless crystal of 1:D−3 • H2O (size 0.35 • 0.1 • 0.09 mm); plate-shaped colorless crystals of 1:DL−3 • H2O (size 0.09 • 0.04 • 0.03 mm) and 1:D−4 • H2O (size 0.16 • 0.07 • 0.06 mm); a block-shaped colorless crystal of 2:L-3 • H2O (size 0.2 • 0.09 • 0.06 mm) and a plate-shaped colorless crystal of 2:DL−3 (size 0.16 • 0.06 • 0.05 mm). The single crystal diffraction data were collected using a Rigaku XtaLAB Synergy S Diffraction System (Malvern Panalytical, Malvern, United Kingdom) with a Hybrid Pixel Array Detector and a PhotonJet X-ray source for Cu-Kα radiation (λ = 1.54184 Å), with a multilayer mirror monochromator at 100.0 ± 0.1 K using ω-scans. Data reduction and absorption correction were performed with CrysAlisPRO v. 42 (Oxford Diffraction /Agilent Technologies UK Ltd, Yarnton, England) software, using numerical absorption correction based on Gaussian integration over a multifaceted crystal model and empirical absorption correction using spherical harmonics, implemented in SCALE3 ABSPACK scaling algorithm [41]. Structure analysis and refinement: The structures were solved by direct methods (SHELXT-2015), full-matrix least-squares refinements on F2 were executed using the SHELXL2017/1 program package [42,43]. Structure, as well as disorder solution and refinements were conducted using Olex2-1.5 (Olexsys, Durham, England) software [44]. Disorders are present in 1:D−4 • H2O and 2:DL−3. In the former, about two water molecules are disordered over three positions in canal voids (Occu. 0.75:0.64:0.58). Furthermore, malic acid’s hydroxyl group O7-H27A and hydrogen H27B were half-occupied due to an inversion center in the malic acid molecule. In the latter, the GABA subunit (C1, C2, C3) was disordered over two positions (Occu. 0.57:0.43). Hydrogen atoms were freely refined except C-H hydrogens in 1:L−3 • H2O, 1:DL−3 • H2O, 2:L−3 • H2O, 1:D−4 • H2O and 2:DL−3. The rest electron density was found on the N- and O7-atoms, which correspond to hydrogen atoms. However, all attempts to refine these freely failed and led to a structure breakdown, probably due to the present disorder. Accordingly, N-H hydrogens, as well as the O7-H27A hydrogen in 1:D−4 • H2O, were also positioned geometrically. The following atomic displacement parameters were used: Uiso(HCH) = 1.2 Ueq, and further for 1:D−4 • H2O Uiso(HNH) = 1.2 Ueq and Uiso(HOH) = 1.5 Ueq. Overviews of the received crystallographic datasets are given in Table 1, Table 2, Table 3, Table 4 and Table 5. Graphics were prepared with the program Mercury [45]. The crystallographic data for the structures were deposited in the Cambridge Crystallographic Data Centre (CCDC-numbers 2201472-2201477) and can be obtained free of charge via: www.ccdc.cam.ac.uk/data_request/cif (access date: 1 August 2022).

2.5. Thermal Analysis

Differential Scanning Calorimetry (DSC) measurements were conducted on a Linkam THMS 600 DSC with a heating rate of 5 °C/min. Additionally, thermogravimetric analysis (TGA) was executed on a Netzsch TG 209 F3 Tarsus in the range from 30 °C to 350 °C with a heating rate of 5 K min−1 under a nitrogen atmosphere. Selected TG curves are presented in the Supplementary Materials.

2.6. IR-Spectra

IR spectra were recorded on a Bruker Tensor 27 FTIR device in attenuated total reflectance mode in the range 4000 cm−1 to 400 cm−1. Spectra are presented in the Supplementary Materials.

3. Results

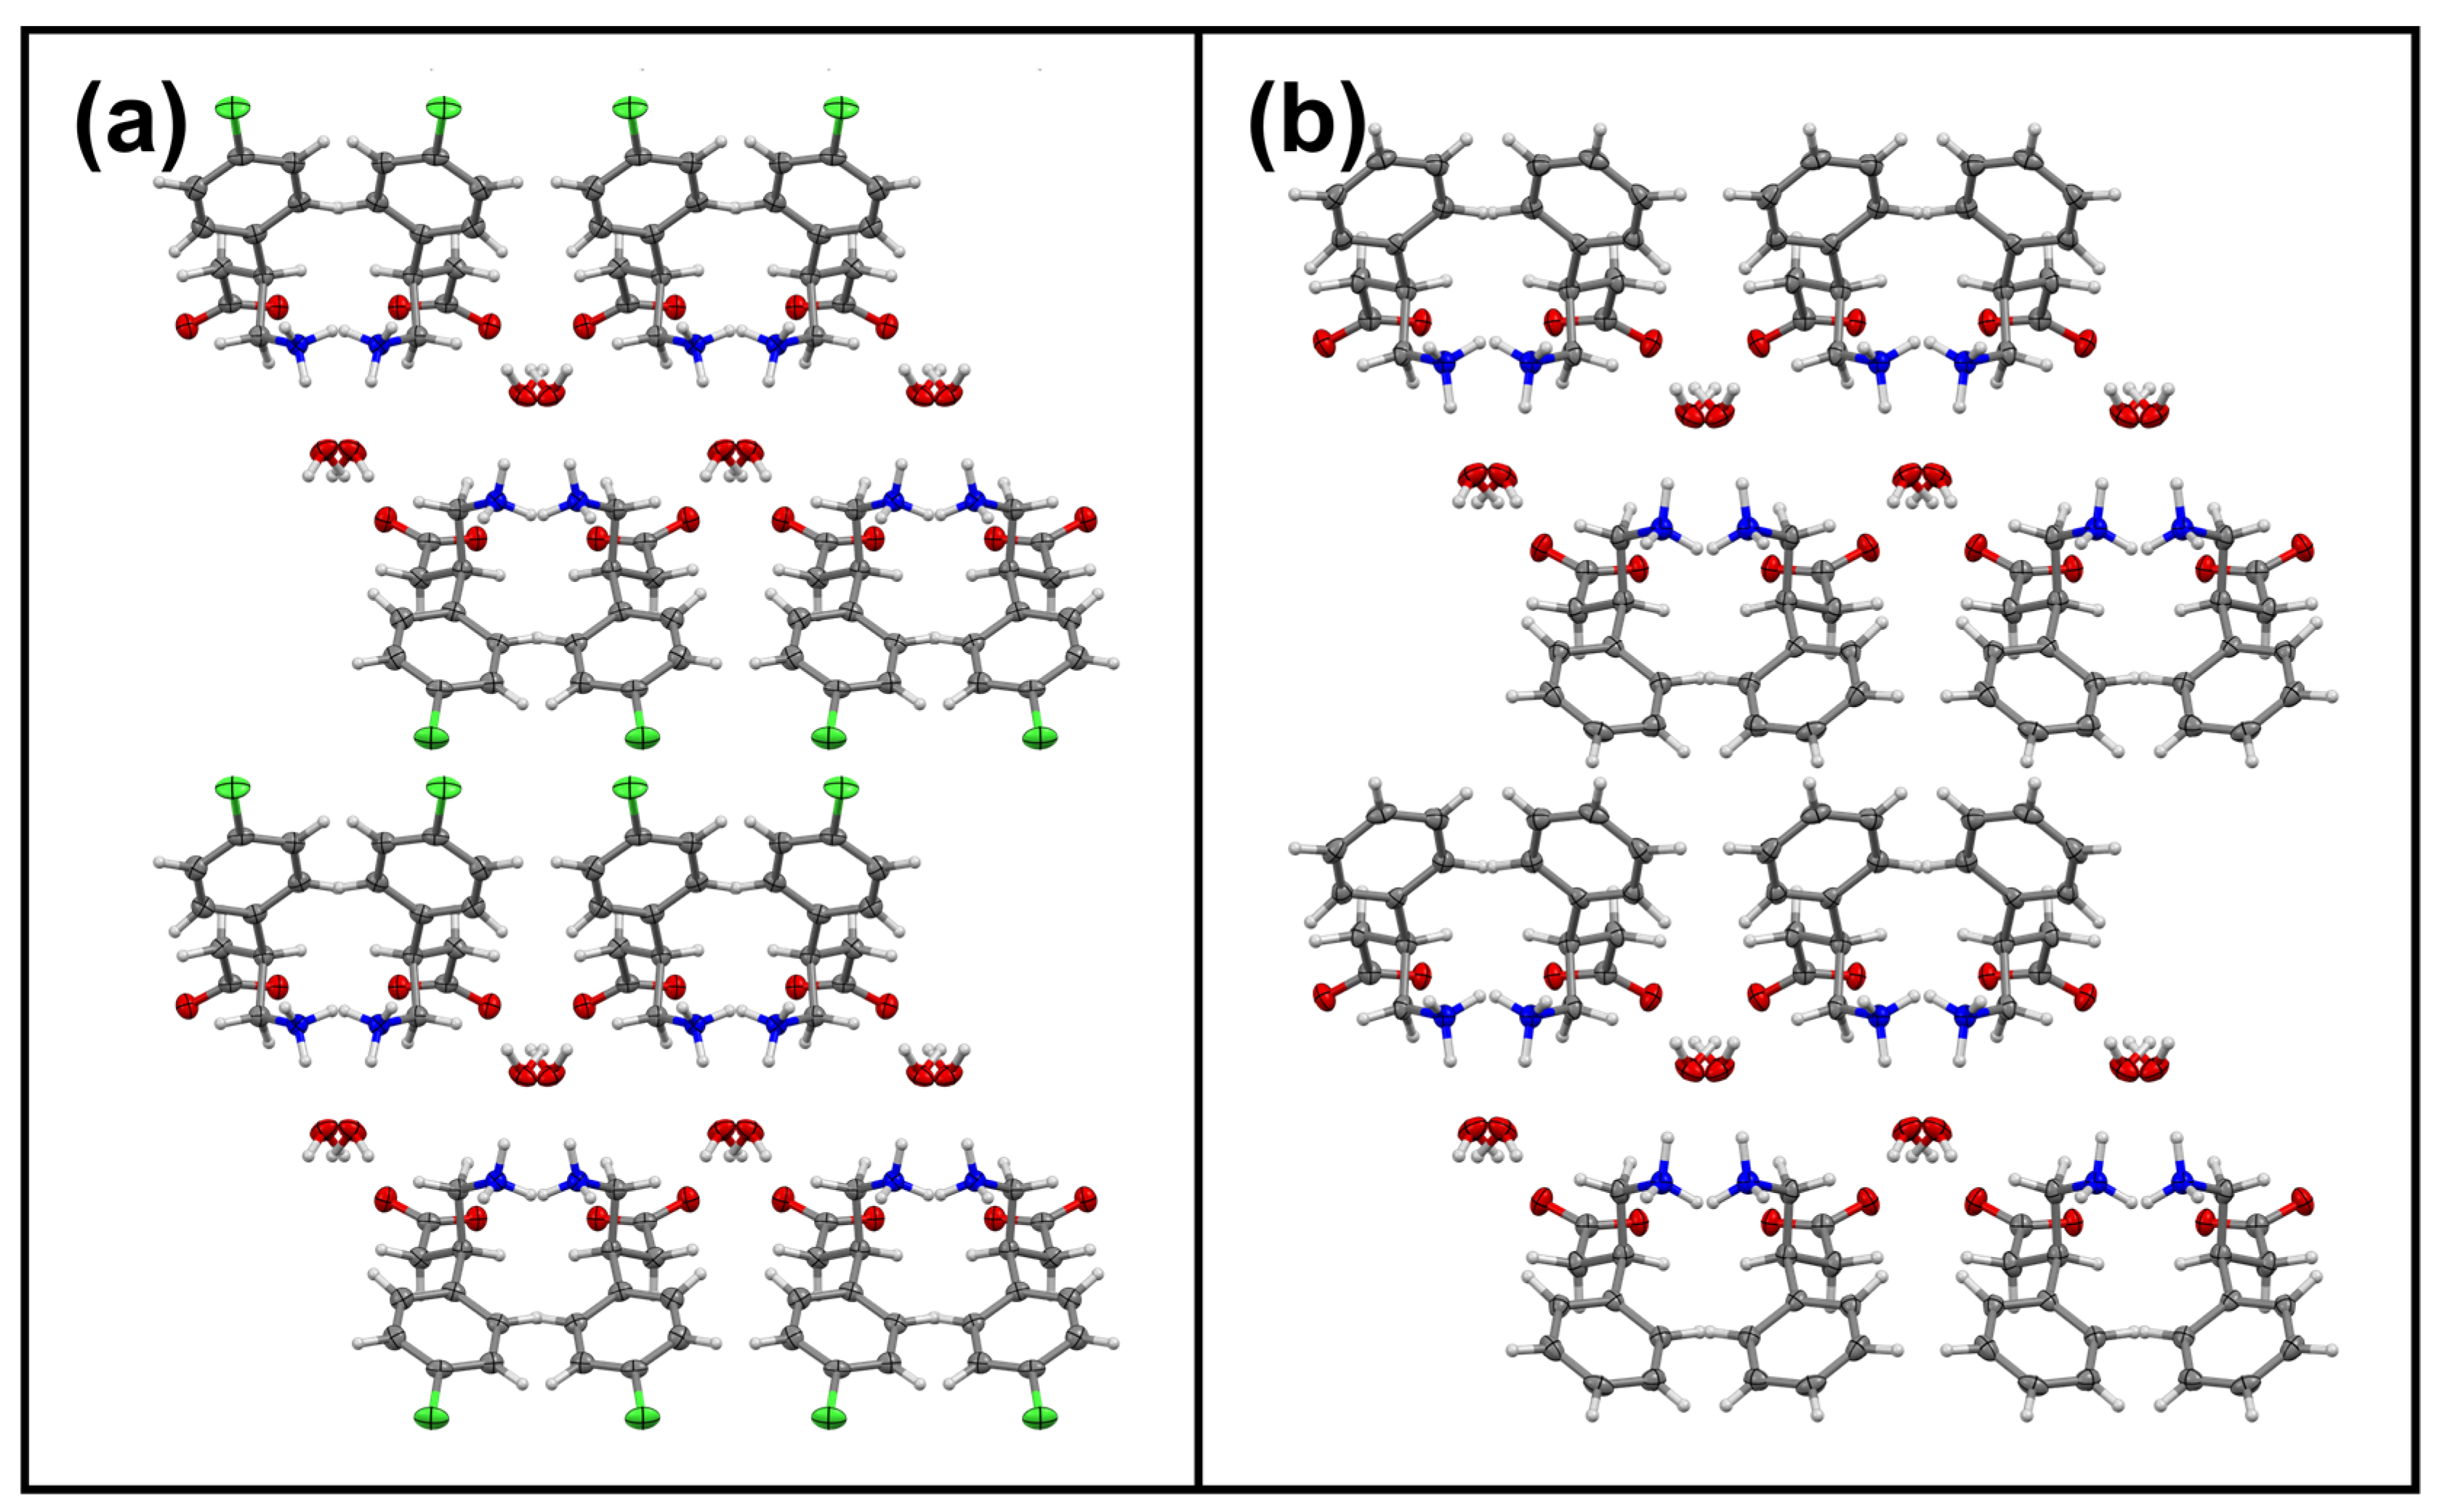
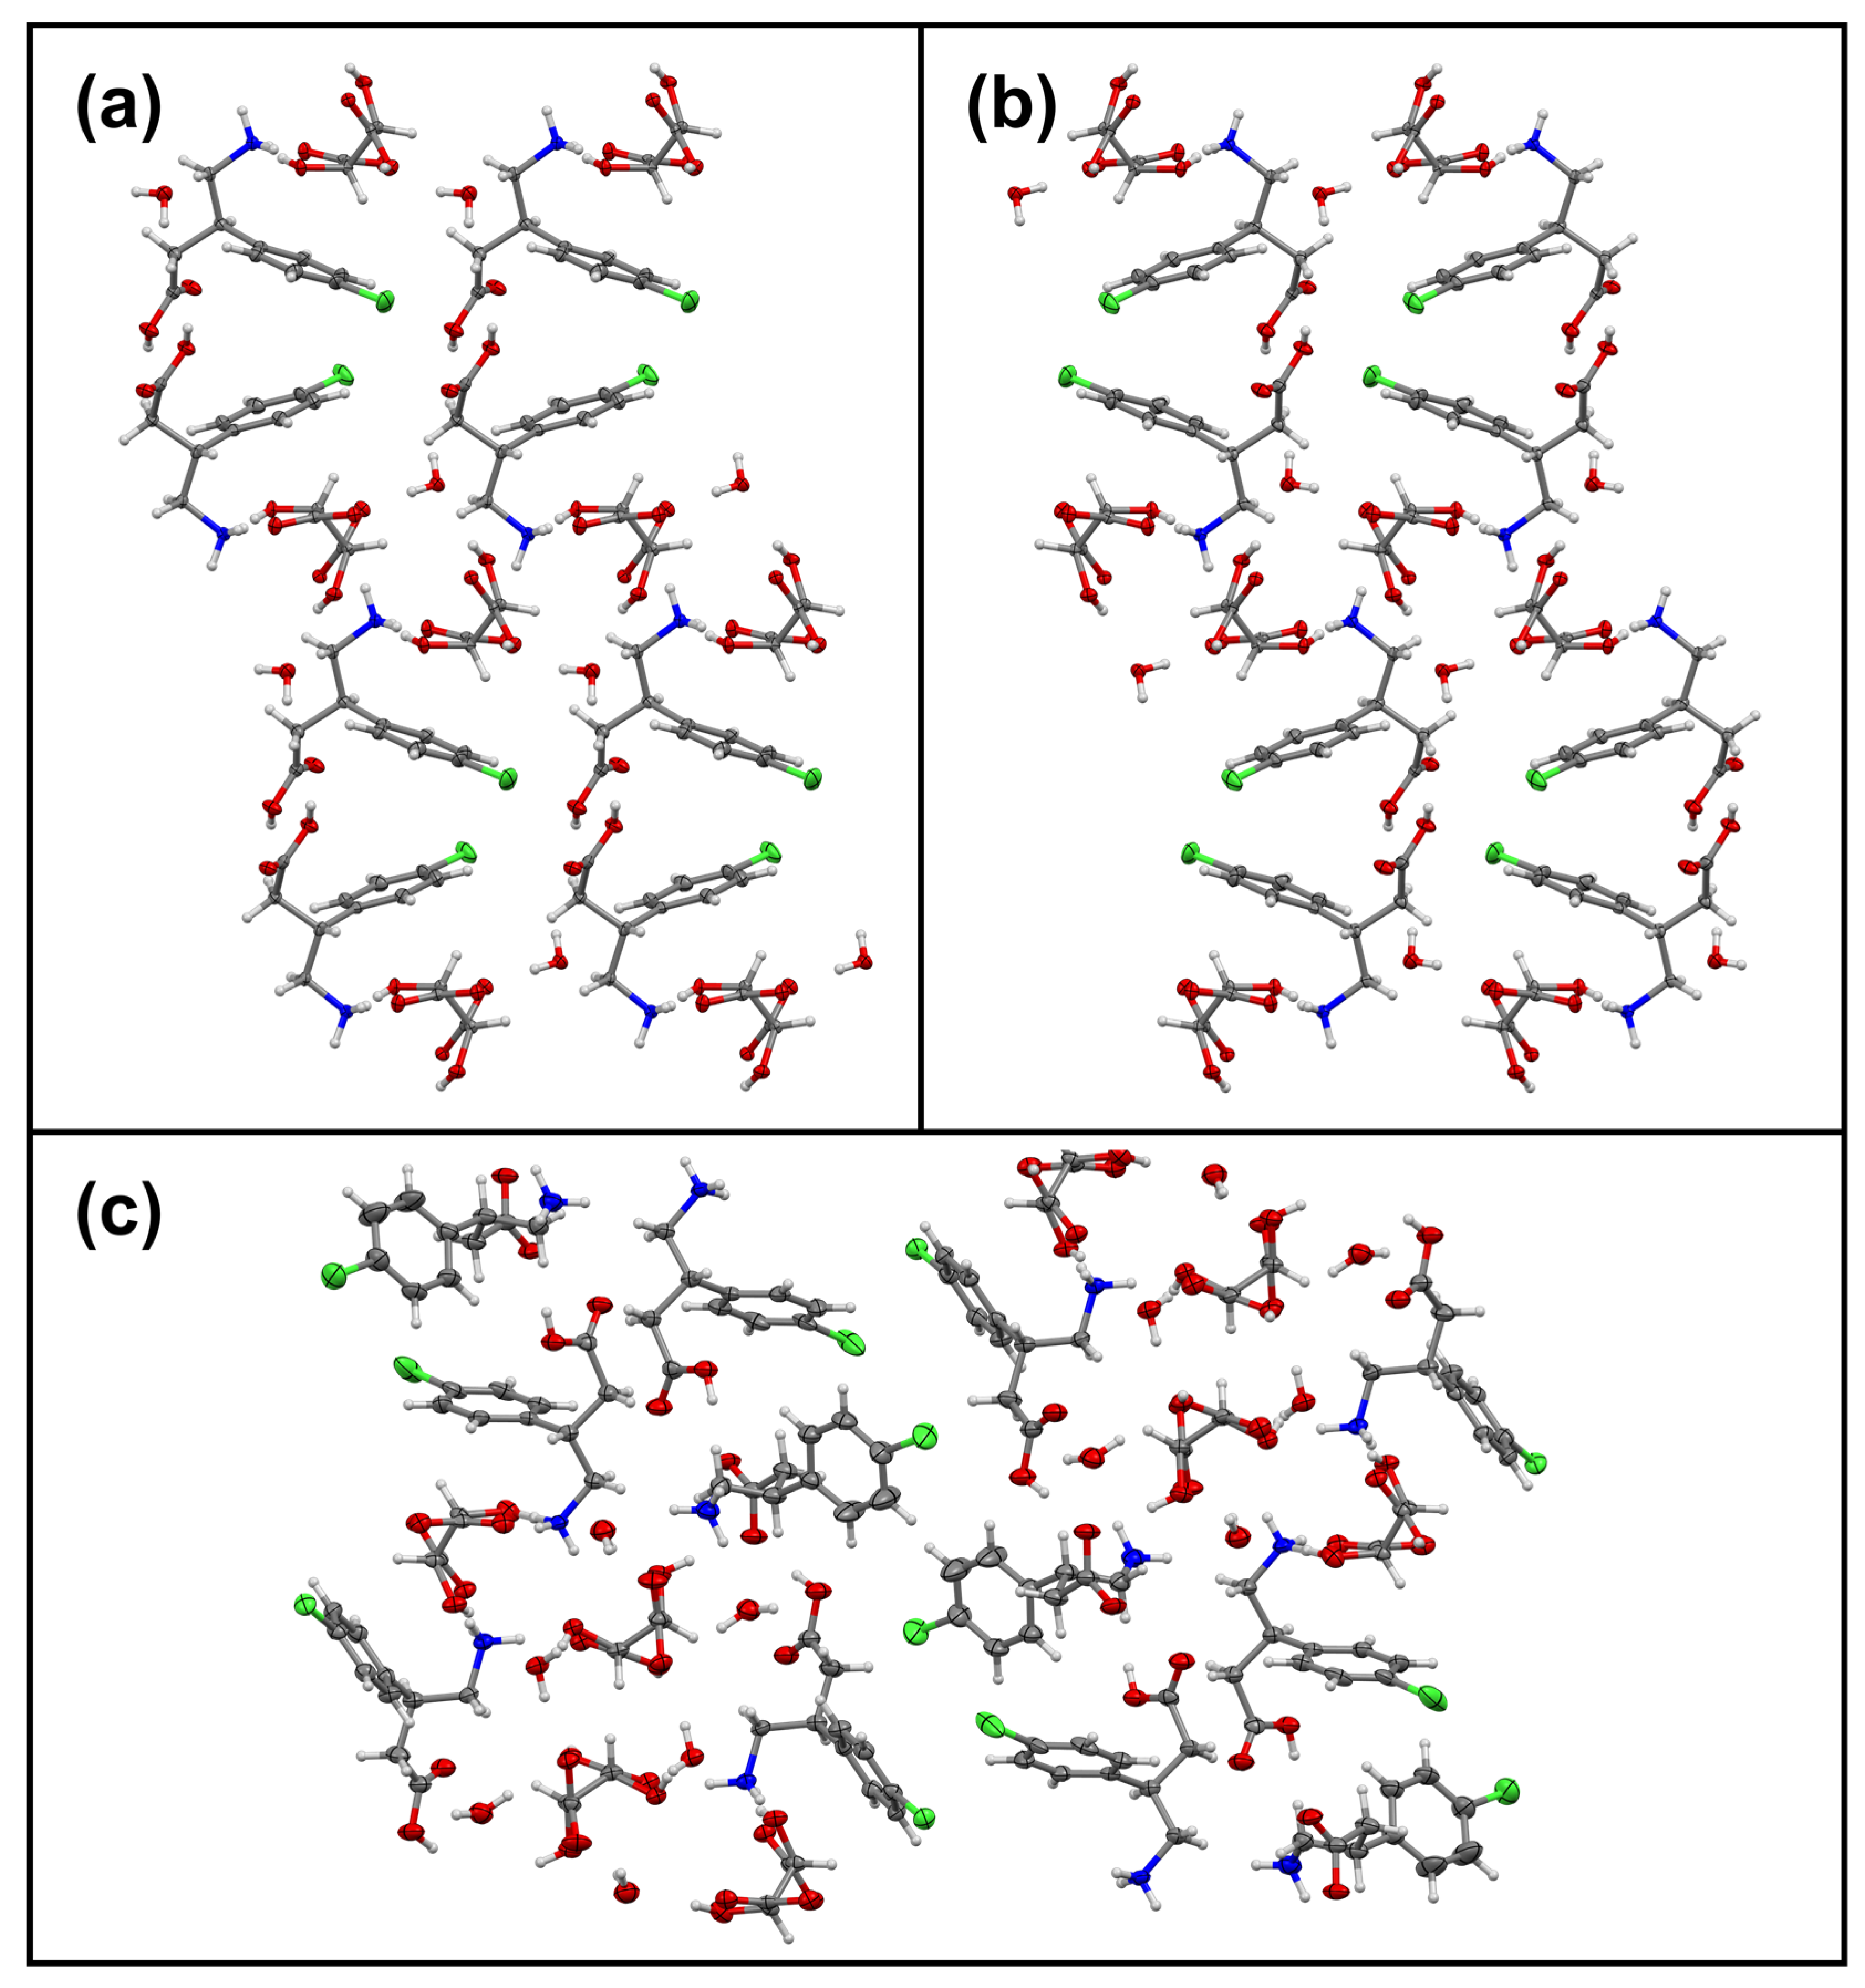
3.1. Overview of All Received Single Crystals and Pure Hydrates of Baclofen and Phenibut

Indications for a plethora of different phases could be received through solution and milling experiments via PXRD. However, single crystals could be obtained for eight phases, most of which are hydrates (Table 2). This highlights the first encountered problem—nearly all described compounds undergo one or even multiple phase transitions upon crystallization and nearly always involve a hydrate stage. At this stage, single crystals suitable for SC-XRD can sometimes be received from solution.
A commonality in both APIs is the formation of a monohydrate with the same Aea2 space group, very similar structural makeup and in both cases, 1 and 2 retain their zwitterionic molecular state. In 1 • H2O and 2 • H2O, rows of 1 or 2 molecules connect through hydrogen bonds (HBs) on their GABA subunits and via edge-to-face π-interactions on their phenyl residues. These rows are further interconnected by HB involving water molecules (Figure 1). Both hydrates decompose in a quick time frame, with 1 • H2O faster than 2 • H2O, the latter of which could be observed remarkably often. It is notable that they were obtained during attempts to receive multicomponent crystalline compounds, with three or four dissolved species present in the mother liquid. If these samples were left to dry out completely, powdery multicomponent compounds could indeed be obtained as determined via PXRD. This implies that the hydrates form prior to more complex crystalline entities. In the context of GABA derivatives as APIs, it is interesting to mention that similar hydrate formations can be observed in Gabapentin as well as racemic Pregabalin [46,47,48,49]. However, contrary to the herein-described hydrates of 1 and 2, these hydrates remain stable for a long time, even under dry conditions. Diffraction quality single crystals of 1 • H2O and 2 • H2O can reliably be grown from an aqueous solution with diffusion techniques, using acetonitrile as an antisolvent.

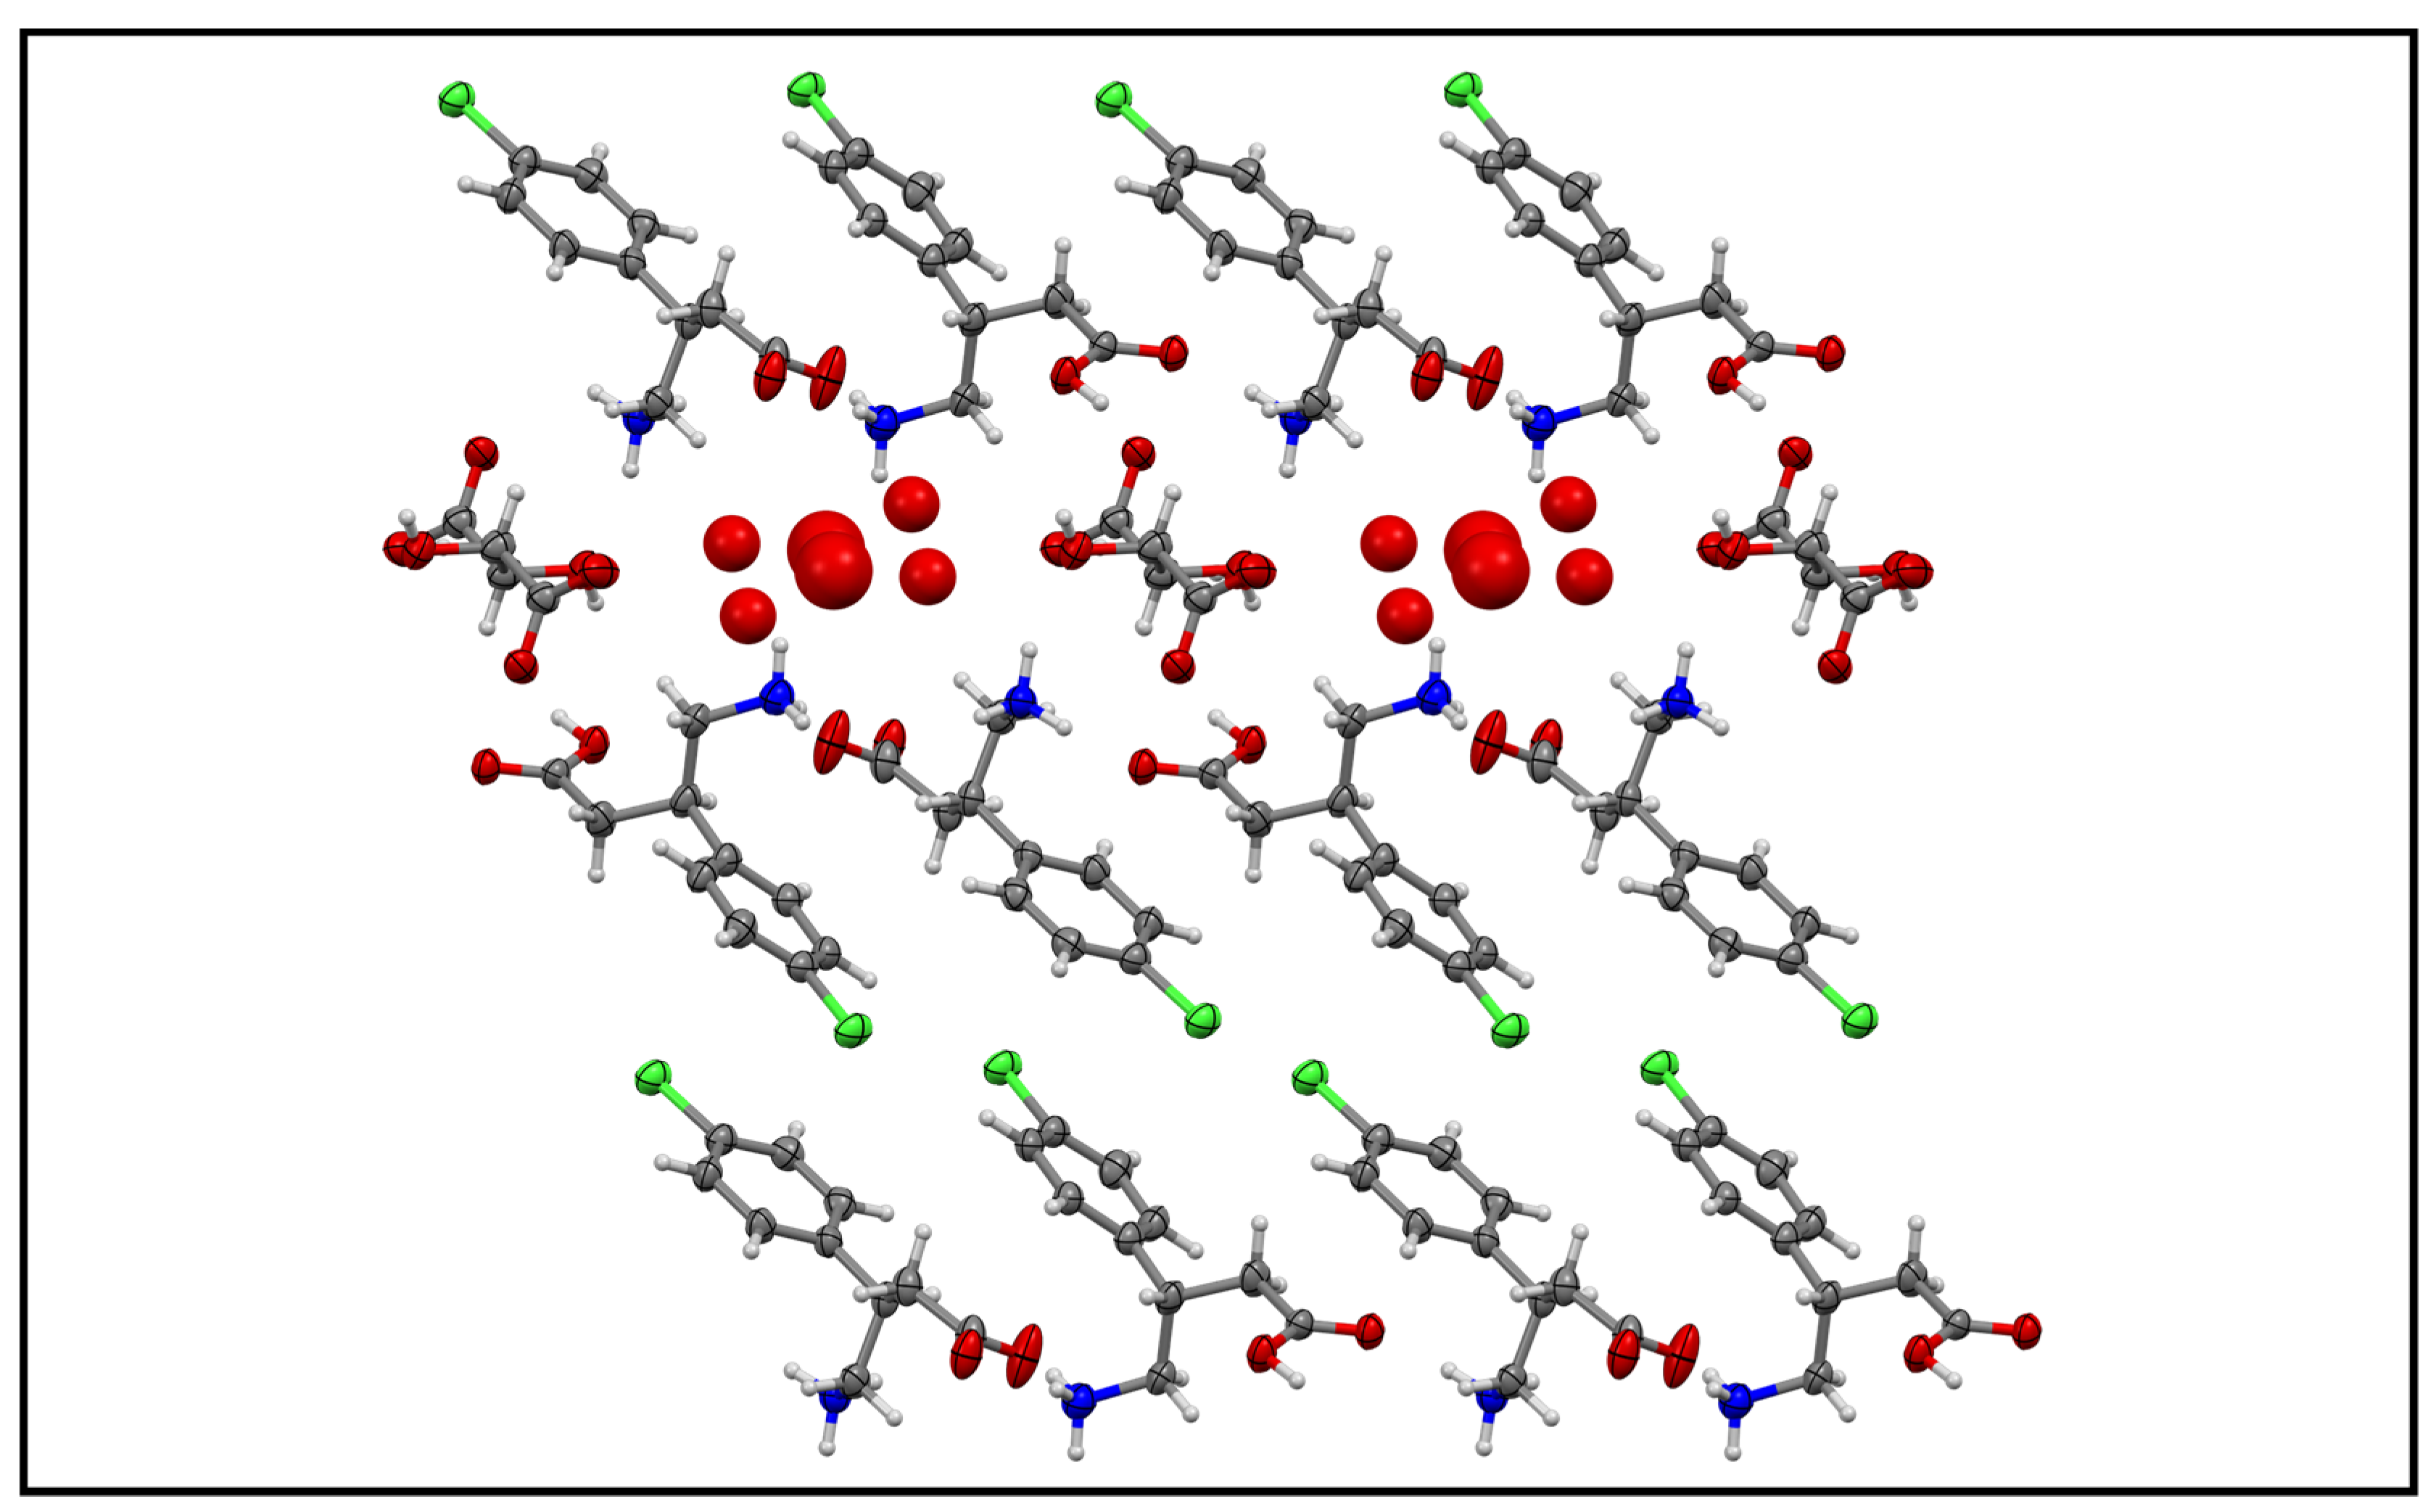
3.2. Baclofen and Tartaric Acid Species

Baclofen and tartaric acid were crystallized in equimolar ratios either through slow evaporation from aqueous solution or by methanol-assisted milling crystallization. By crystallization of 1 and D or L−3 from aqueous solution, isostructural salt hydrates in the non-centrosymmetric space group P1 are formed. Here, tartaric acid protonates the former carboxylate group in 1′s GABA subunit, leading to formal charges on co-formers 1 and 3. Water molecule positions in the lattice are well defined, such as in the described hydrates of pure 1 and 2 forms, yet a decomposition of these multicomponent species occurs later, after about one week. This stands in opposition to the 1:DL−3 • H2O system, which was likewise received by slow evaporation from aqueous solution. In this system, one 1 molecule with zwitterionic charges, as well as two further protonated 1 molecules, interact with two singly deprotonated 3 molecules and three hydrate water molecules. Even though this structure appears more complicated by the number of differently charged molecules in its asymmetric unit, it remains stable after six months under dry conditions. Crystal packings of the discussed 1:3 forms are depicted in Figure 2.
Evidence for additional species was obtained via PXRD. A possibly anhydrous phase of 1:D−3 or 1:L−3 can be observed by comparison of recorded patterns to the simulated pattern from single crystal data (Figure 3).
A careful comparison of the received patterns shows that complete phase purity for the enantiomerically pure 1:3 systems cannot be achieved in any case. While the fresh sample is still in good agreement with the simulated pattern, traces of a new phase are already visible between 10° and 15° 2Θ, in the small Bragg reflections between 16° and 18° 2Θ as well as at about 25° 2Θ. Patterns recorded after three months shared a good agreement with the presented milling or DSC patterns (see the Supplementary Materials). The possibly anhydrous phase was mostly distinguishable from the SC-XRD-characterized hydrate by its additional small reflections towards low angles at about 5° 2Θ and the prevalent occurrence of reflections between 23° and 26° 2Θ, especially well visible in the pattern recorded after DSC heating as well as the one from vacuum dried substance. It is notable that even the milling pattern seems to retain characteristics of the hydrate form, visible through the absence of the described signals at lower angles. This highlights how energetically beneficial the hydrate stage for the described systems as an intermediate must be, as trace amounts of water in the methanol or adsorbed water from the milling vessel walls have sufficed to enable its formation. Concerning the racemic 3 forms, aging does not affect the 1:DL−3 hydrate received from solution, which is in opposition to its chiral 3 counterparts. The milling sample shows the most outstanding behavior in comparison to the other received patterns. It seems to be a mixture of 1:DL−3 hydrate and its presumedly anhydrous form, possibly including hydrated or anhydrous enantiomerically pure 1:3 forms. This suggests that the formation of anhydrous 1:DL−3 is unfavorable and could explain how next to the hydrated 1:DL−3 system, enantiomerically pure 1:3 entities are formed during milling. Anhydrous 1:DL−3 is probably the most visible in the 1:DL−3 sample recorded after DSC heating. Even though the vacuum-dried sample shows three well-resolved reflections at 4.8–5.4° 2Θ, it still retains more similarity to the simulated hydrate pattern than the DSC sample. Furthermore, it does not offer higher overall crystallinity, suggesting that drying does not work as well here as in 1:3 forms with pure 3 enantiomers. Additional comparisons involving all received phases are shown in the Supplementary Materials. To rule out any further phases, DSC data were recorded from a sample obtained from solution as well as through milling (Figure 4).
The DSC data suggest that higher quality samples are obtained from aqueous solution compared to LAG experiments in the case of enantiomerically pure 3 entities. The presented signals for samples grown from solution show a better signal-to-noise ratio than those which were obtained by milling. Furthermore, the melting signal is more intense than the signal for the presumed loss of hydrate water. This is not the case in the milling samples, suggesting the presence of a larger amorphous amount of substance. The hydrate water is removed at a comparatively high temperature of 130 °C. This indicates that water molecules are bound strongly into the 1:D−3 (or 1:L−3) hydrate lattice. Low binding force to hydrate water molecules thus is probably not the reason for the phase transition. Rather than that, the anhydrous lattice is overall energetically more beneficial compared to the hydrate form. Melting of the anhydrous form occurs about 15 °C after the hydrate water loss, between 143 °C and 148 °C. In the 1:DL−3 hydrate grown from an aqueous solution, on the other hand, the presumed loss of hydrate water begins at lower temperatures of 103 °C. However, the anhydrous 1:DL−3 system remains stable for approximately just as long as the 1:3 forms of the determined chirality, resulting in a well-defined melting signal at 148 °C. Interestingly, if 1:DL−3 is produced through milling, an exothermic signal can be observed starting at 90 °C. This indicates further crystallization of amorphous material upon heating. If a powder pattern is recorded after the heating process, but prior to melting, an increase in crystallinity by better resolution of signals can indeed be observed (see the Supplementary Materials). Furthermore, signals corresponding to the 1:DL−3 hydrate are removed from the pattern. However, it still appears to be better to start from a solvent-based sample to receive an anhydrous 1:DL−3 form, indicated through a well-resolved powder pattern and a sharper melting signal.
Baclofen:tartaric acid species, including single crystals, can best be produced from aqueous solution, even though hydrates are formed in the first place. In the case of 1:3 species with enantiopure 3 co-formers, aging of the received hydrate will take place over time. Heating or vacuum drying of the described species should remove hydrate water quicker and help obtain a pure phase. Grinding leads to a product of lower crystallinity, especially visible through the badly resolved DSC data. If DL−3 is used as a co-former, the hydrate form remains stable for a longer time, but water molecules can also be removed through heating. Milling experiments lead to low crystallinity and phase mixtures in the first step. Subsequent heating interestingly leads to a similar product as the drying of a hydrate product. The described hydrates can be received reliably from aqueous solution, even though they do not remain stable for long. Milling under the exclusion of water and vacuum drying, however, can reliably produce the presumedly anhydrous forms.

3.3. Baclofen and Malic Acid Species

Similar experiments with Baclofen and tartaric acid were conducted with Baclofen and malic acid. Equimolar amounts of 1 and 4 were either crystallized by methanol-assisted grinding or from solution. Solution-based crystallization attempts involved solvent water, hexafluoro-2-propanol and ethyl acetate. Through the crystallization of 1 and D−4 from hexafluoro-2-propanol solution, the 1:D−4 monohydrate with the centrosymmetric space group P 1 ¯ was synthesized. Interestingly, while it was actually attempted to reproduce the anhydrous P21 1:4 form first described by Córdov-Villanueva et al. in 2018 [50], residual water in the hexafluoro-2-propanol seems to have favored the described hydrate formation. It should be noted that the same experiment with dried hexafluoro-2-propanol could not be performed because of the complete insolubility of 1 in the absence of water. A pure 1:D−4 • H2O form was not reproducible, neither as a single crystal nor as a crystalline powder. This species contains strongly disordered water molecules in opposition to the previously discussed compounds. An additional oddity is the changing orientation of the D4 molecule in the lattice, which is captured by the half occupation of either a hydroxy- or hydrogen subunit on C22 in D4. This variation of the alignment in the 1:D4 lattice enables the formation of a centrosymmetric space group despite decisive chiral information on a molecular level. Rows of 1 molecules, where default zwitterionic and singly protonated ones alternate, are connected through HBs on their GABA subunits over deprotonated D4 species. Canal voids are formed by two D4 entities and four 1 units filled with disordered water molecules. Towards the chlorophenyl subunits, 1 molecules are stacked offset in regard to each other. Positioning and distance between phenyl-centers-of-gravity and edges or between chlorine atoms makes π-interactions or halogen bonds unlikely. It is more probable that dispersive forces stabilize the structure in that direction (Figure 5).
The P21 form already published by Córdova-Villanueva et al. [50] could be obtained from purely aqueous solution in two cases, but more reliably via milling. Next to the described hydrate and previously published anhydrous form, a plethora of different mixtures was obtained, especially from solution and seemingly independent of the chosen conditions. Given the results of numerous experiments, authors are not comfortable in proposing a definitive answer to what phase can be safely obtained under which solvent conditions. However, the received results seem to confirm Córdova-Villanueva et al. in that milling leads to a clean formation of the anhydrous form. Furthermore, the racemic form of 4 does not appear to crystallize in an independent manner compared to enantiomerically pure co-formers. A selection of pure phase powder patterns received under various conditions is presented in Figure 6. Data recordings of some chosen phase mixtures are shown in the Supplementary Materials.
While the shown patterns might suggest easily obtainable clean phases, it should again be emphasized that 1:4 hydrates in the shown purity were only received once during the conducted experiments. The hydrate could not be obtained with DL−4. It remains stable over time but decomposes to a mixture of amorphous substance and pure 1 near its melting point in the DSC (Figure 7, see the Supplementary Materials for PXRD comparisons regarding DSC products). Milling experiments, on the other hand, led to a relatively reliable formation of the anhydrous form. Even though the shown pattern of vacuum drying suggests that this method works just as well as milling, similar results could not be obtained for any other attempts at vacuum drying (see the Supplementary Materials). It is notable that higher crystallinity seems to be present when using DL−4, as compared to enantiomerically pure 4 co-formers, and some slight changes are visible in the pattern. For example, an additional small Bragg reflection is present in 1:L−4 between the two high-intensity reflections at 17° and 18° 2Θ, respectively. Furthermore, the whole pattern appears to be shifted slightly towards lower diffraction angles. Similar observations were described by Córdova-Villanueva and colleagues [50]. They theorize the existence of an additional phase, backed by infrared spectroscopy data. We, however, suggest that the visible behavior might be explainable by considerations of chirality. Contrary to the 1:4 hydrate, the anhydrous form crystallizes in the non-centrosymmetric space group P21 and poses a definitive chirality on 1 as well as 4. Therefore, two isostructural phases are actually formed R1:L4 and S1:D4. This is not possible if only L4 or D4 are present during the experiment, which might lead to a larger amorphous amount in the received product or, as proposed by Córdova-Villanueva et al., another crystalline system. Chirality might also explain why a pure phase is hard to obtain from solution. As previously mentioned, the hydrate crystallizes in the centrosymmetric space group P 1 ¯ , even though chiral information is present on co-former 4. Yet, by forcing a disorder that accounts for the chiral directionality, this chiral influence is canceled out. Thus, the hydrate can be formed from solution, which lessens the amount of available 4 molecules for the anhydrous 1:4 formation, and as the powder recordings show, the hydrate of 1:4 remains stable over time, thereby not releasing the necessary molecules back. Furthermore, 1 tends to form its own hydrate, which can often be observed in the received solution crystallization products (see the Supplementary Materials).
DSC recordings highlight that the composition of the received products must differ. The 1:4 hydrates presented in Figure 7a,b show varying intensities and slight temperature shifts for the presumed same transitions at about 60 °C, as well as 104 °C and 113 °C. Furthermore, the melting signal at 143 °C and 139 °C is irregularly resolved in a comparable manner to the melting signals of the Baclofen:tartaric acid species. As the respective powder patterns show no evidence for impurities of a crystalline nature, possible amorphous substance or varying degrees of incorporated hydrate water might explain this behavior. As was shown, contrary to 1:3 hydrates, water molecules are not incorporated in a fixed network but rather occur as filling in present voids in 1:4 hydrates. If the powder pattern of a sample heated in a DSC-oven up to 140 °C is used for comparison, a phase mixture still remains. This could explain the uneven distribution of signals and the wide range of melting signals. Thermograms in Figure 7c,d show better-resolved phase transitions, and the melting signals for 1:D−4 and 1:L−4 are at the same position (Comparison shown in the Supplementary Materials). However, the received DSC data seem to confirm the theory regarding another phase, as assumed by Córdova-Villanueva and colleagues. 1:DL−4 melts at 116 °C, which is 5 °C prior to the 1:D−4 or 1:L−4 phases. Furthermore, the latter show an additional signal between the melting signal and the broad, less intense signal at higher temperatures. No powder patterns could be recorded for samples at this point as only a gooey substance was received, but the presence of crystallites of a different phase might be presumed.
Contrary to Baclofen:tartaric acid species, Baclofen:malic acid forms can best be produced using mechanochemical means. However, co-former chirality seems to play a decisive role in the accessibility of exact phases, as shown through PXRD recordings and thermal analysis. The phase with the highest purity is obtained if both 1 and 4 are of a racemic nature. Interestingly, anhydrous phases can possibly be obtained by vacuum drying, but it is not reliable that the outcome will show the desired qualities.

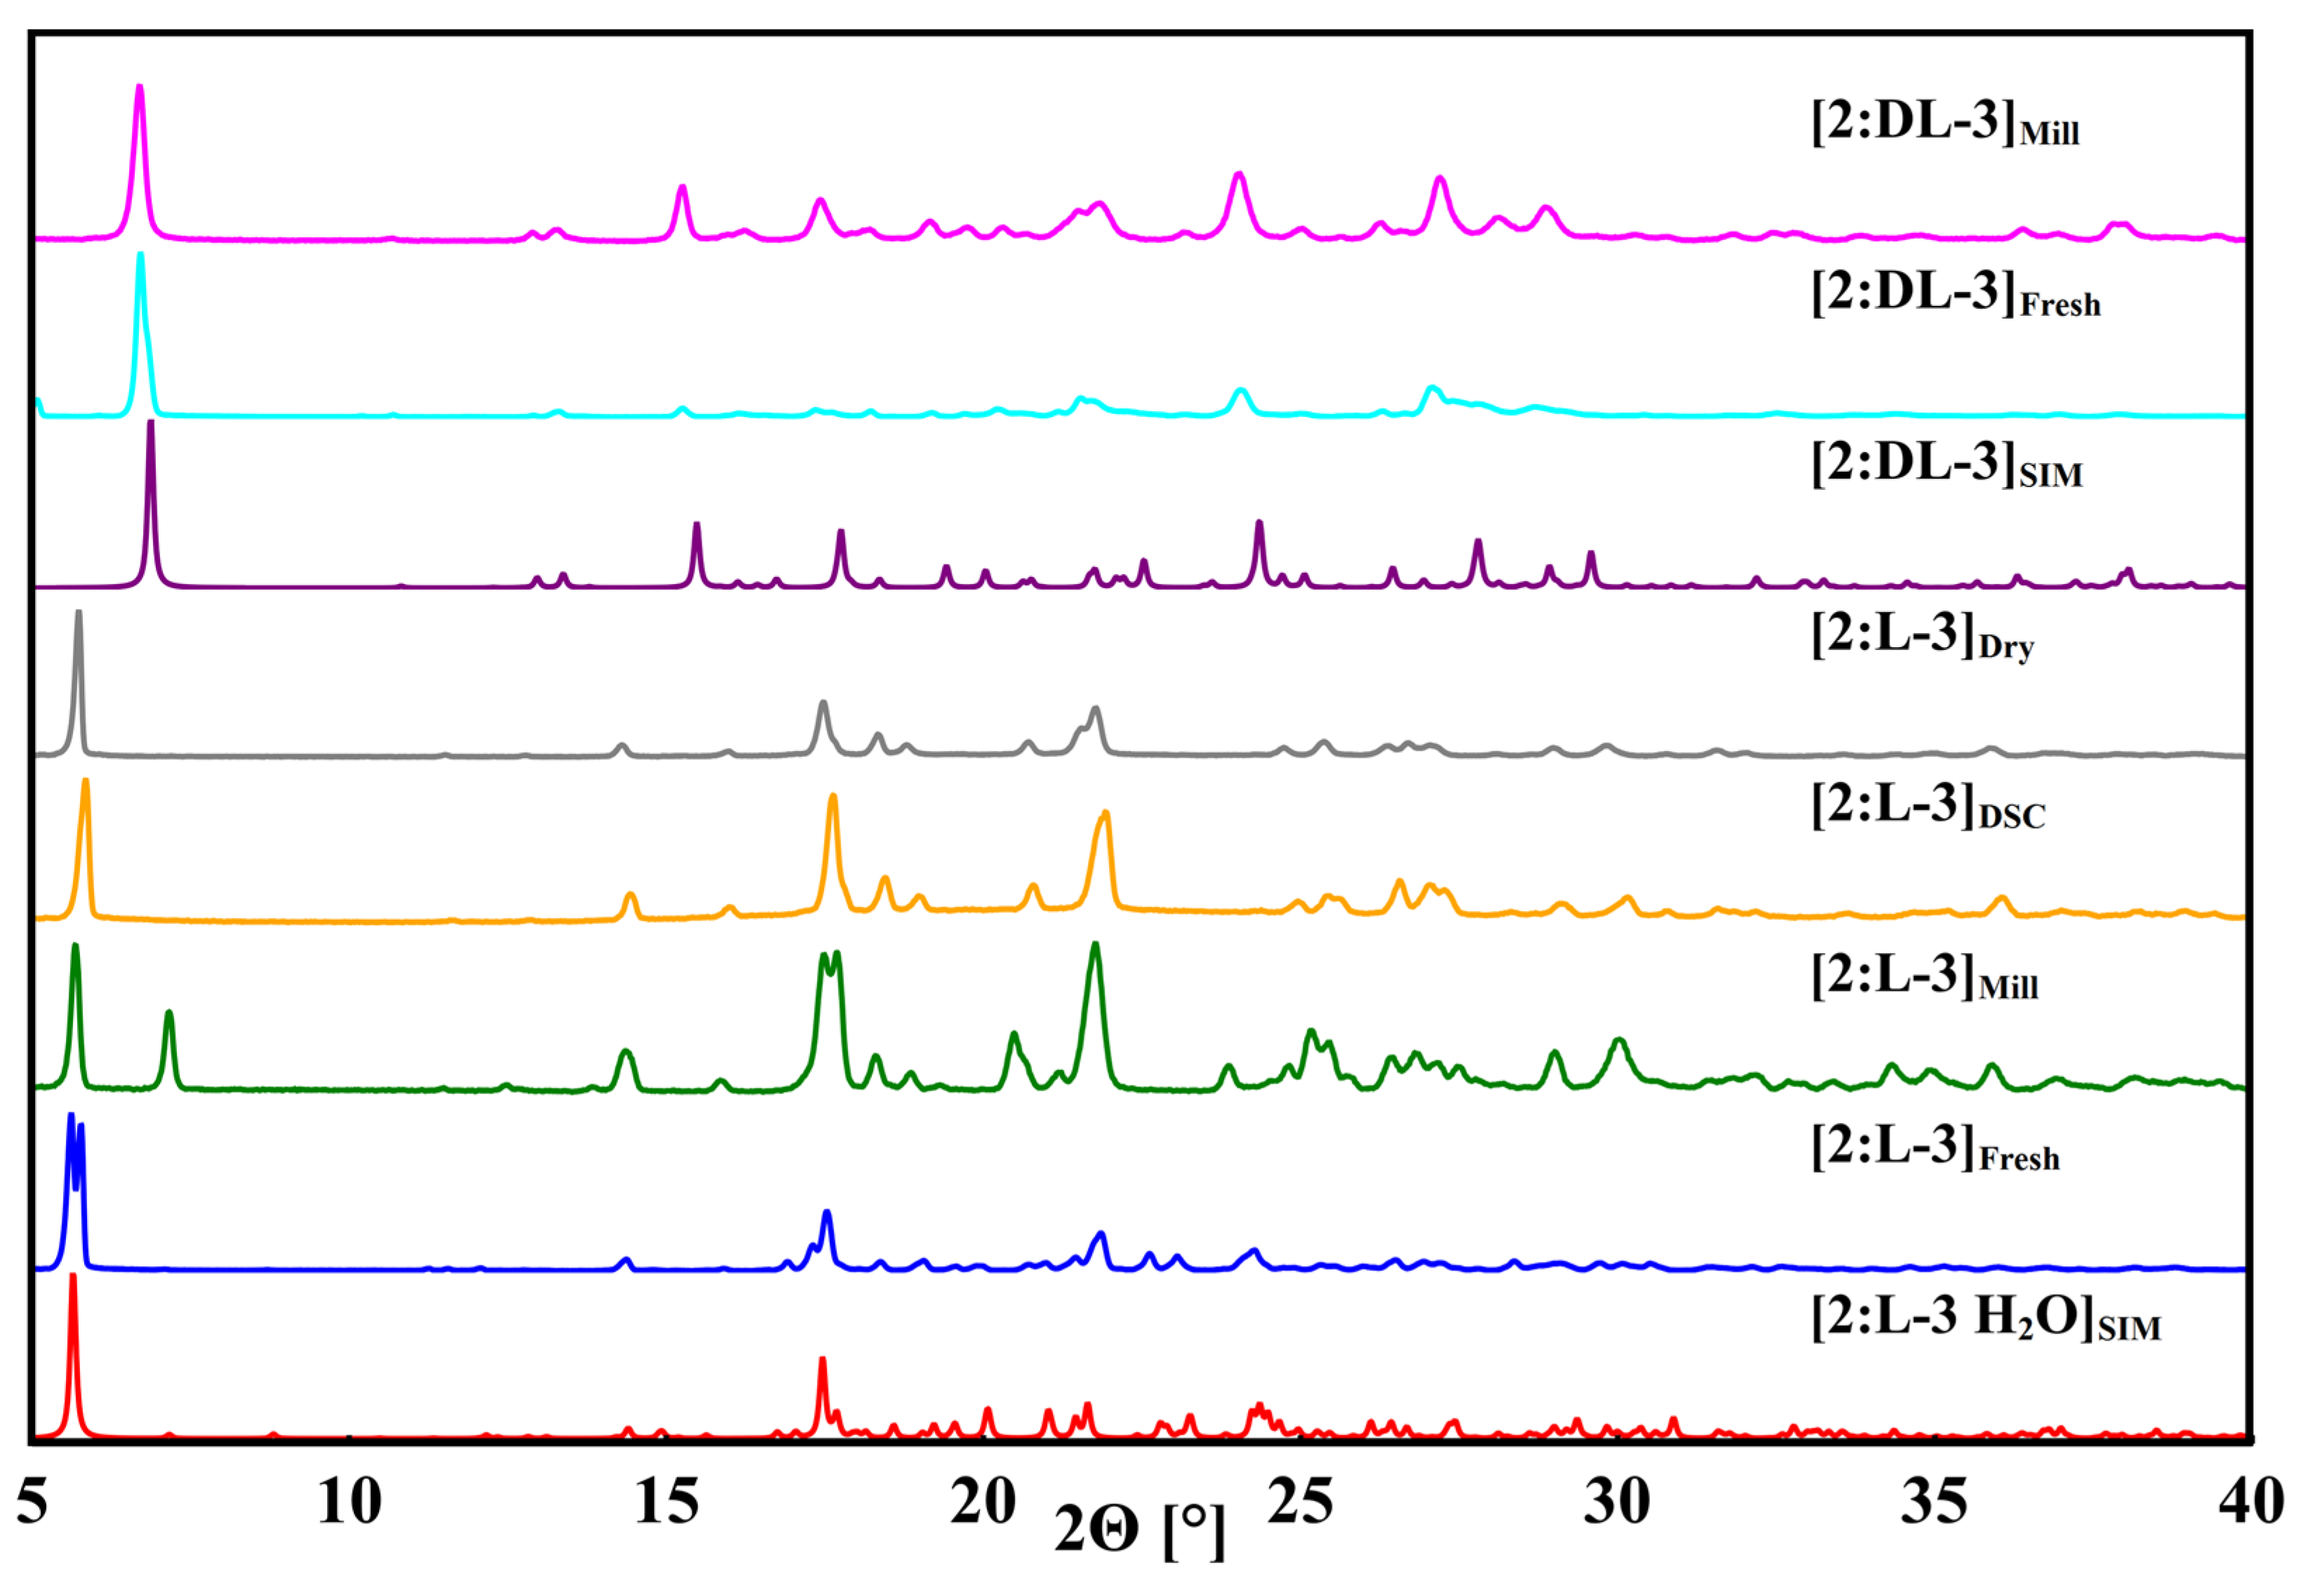
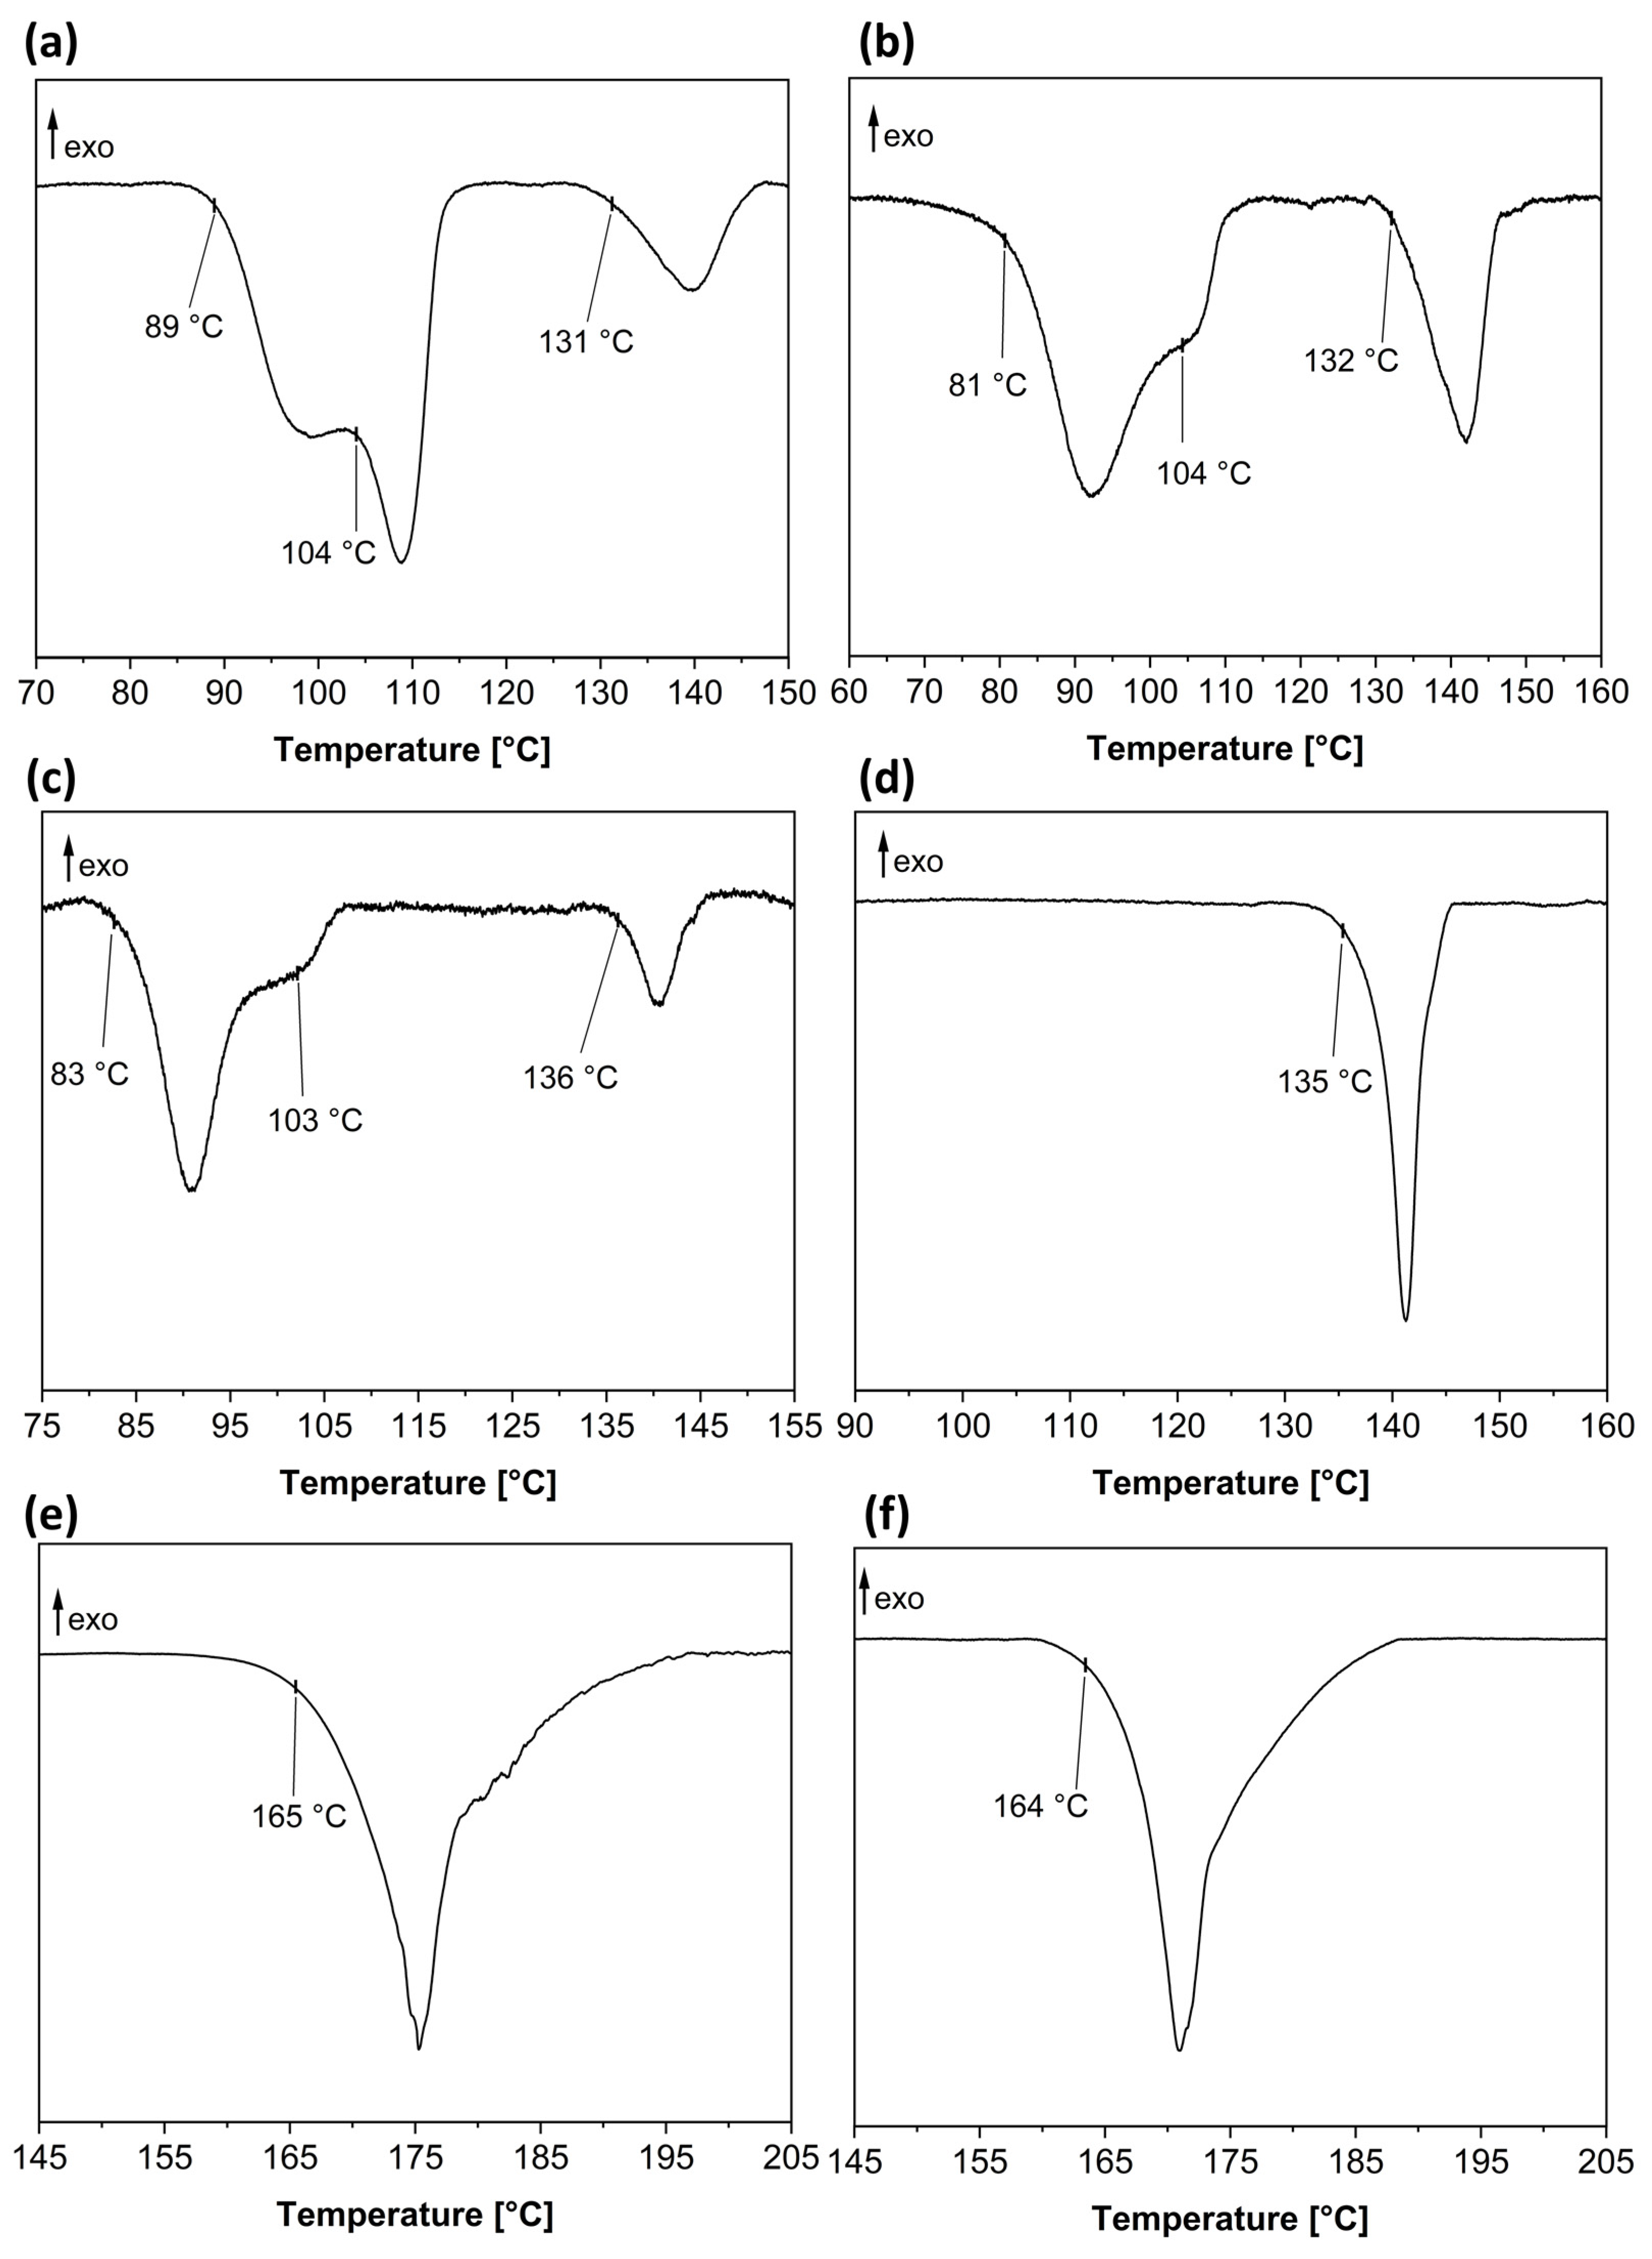
3.4. Phenibut and Tartaric Acid Species

Phenibut and tartaric acid were crystallized in equimolar ratios either through slow evaporation from aqueous solution or by milling crystallization under the addition of 10 μL methanol at 25 Hz for 30 min. Two multicomponent crystalline single-crystal structures were obtained with 2 and two embodiments of 3: the monoclinic 2:L−3 • H2O with the space group P21, as well as the triclinic 2:DL−3 with the space group P 1 ¯ . 2:DL−3 is the only species characterized via SC-XRD, which does not contain any hydrate water in its lattice. It shows a disorder along its GABA subunit on 2 molecules: in half of its occupations, the alignment is akin to an S-chirality of 2, in the other half to an R-chirality. However, its lattice makeup is relatively simple. A single crystallographically independent protonated Phenibut molecule and a single deprotonated DL−3 molecule interact via hydrogen bonds. Rows are formed with 2-phenyl subunits facing away from the HB-network and DL−3 connecting between two 2-GABA subunits. The alignment of the phenyl subunits again makes π-interactions unlikely, considering distances between edges and phenyl-centers-of-gravity. While a similar binding motive is present in 2:L−3 • H2O, some decisive differences occur: The asymmetric unit consists of three crystallographically distinct protonated 2 and three deprotonated L-3 molecules in congruence with two additional hydrate water molecules. The latter are incorporated into the HB network that is formed in a similar manner to 2:DL−3 regarding 2 and 3 molecules. However, in 2:L−3 • H2O, alignment and distance of edges and centers-of-gravity in 2 phenyl subunits would make π-interactions possible. Although no disorder is present in the Phenibut:L-tartaric acid • H2O structure, the multitude of crystallographically-independent molecules results in an overall structure perceived as less ordered, yet retaining some similarity to the anhydrous 2:DL−3 form regarding 2 and 3 positioning and interaction motif. A comparison of both lattices is shown in Figure 8.
Especially compared to the previously discussed Baclofen:malic acid entities 2:3 can be obtained with pleasant reliability by solvent crystallization or the mechanochemical approach, even though phase purity cannot be achieved instantly in all cases (Figure 9).
Concerning 2:3 forms with enantiomerically pure 3 entities, it is evident that phase purity is not obtained by crystallization from solution. This is observable by just comparing the first signal at about 5.6° 2Θ in the pattern simulated from the single crystal data. In the solvent-based sample, two Bragg reflections can be observed there, an additional one at 5.8° 2Θ. Contrary to that, the shown pattern of the milling sample only poses the latter reflection. Furthermore, a strong reflection at 7.2° 2Θ is present. Even though the pattern received from heating the solution-based sample in a DSC chamber or after vacuum drying does not have the 7.2° 2Θ reflection, and the reflection at lower angles seems to be slightly shifted towards higher angles; careful analysis reveals that these patterns have more in common with each other than with the simulated or solvent-based pattern (see Supplementary Materials for larger comparison of the discussed samples). Two possible explanations seem reasonable: Either the milling pattern is a different phase, or it is just better resolved due to higher crystallinity. The slight amorphous course of the baseline in the PXRD pattern recorded after DSC, as well as the worse signal resolution, suggest a lower crystallinity after heating. This could cover up the 7.2° 2Θ signal, which might also be more prevalent in the milling sample due to less preferential directionality from smaller crystallites after milling. Therefore, it seems most likely that milling of 2:L−3 and heating of a solution-based 2:L−3 sample in the DSC lead to the same, presumably anhydrous, product. It is noteworthy that the milling sample prepared from D−3 under the same conditions, and at the same time as its L-analog, led to a pattern akin to the solution product. This led us to the assumption that more water must have still been adsorbed on the milling vessel of the 2:D−3 sample. As methanol from the same batch was used in both cases, impurities contained in solvent can be ruled out as a reason for this behavior. While no obvious impurities occur in 2:DL−3, a small reflection that cannot be observed in the simulated pattern appears at 5° 2Θ when grown from solution. This signal is attributable to a non-incorporated precursor and does not disappear upon aging of the sample (see the Supplementary Materials). However, a mechanochemical approach seems to favor the formation of a pure 2:DL−3 phase as opposed to crystallization from solution. The received pattern matches well with the simulated one. To further confirm phase purity, DSC data were recorded (Figure 10).
Thermal analysis of the discussed compounds containing enantiopure 3 shows that the majority of the obtained samples do not solely contain 2:D−3 or 2:L−3 hydrates. Hydrate decomposition starts between 81 °C and 89 °C and occurs in a wide signal, which contains an additional shoulder at 103 °C or 104 °C. The subsequent melting signal between 131 °C and 136 °C is, in most cases, less intense than its predecessors. This indicates that the phase transition that occurs here does not lead to a more crystalline product, which is further confirmed through the powder pattern received after DSC heating. Here, the crystallinity is lowered, which leads to a less intense melting signal as less energy is released. DSC data analysis further confirms the assumptions regarding the received milling product 2:L−3. No signals occur prior to melting, and the melting signal comes in a well-defined and intense form. Thus, a pure, presumedly anhydrous phase must have been obtained. In the case of 2:DL−3, the received products show no decisive differences; a melting signal occurs at 164 °C or 165 °C.
Phenibut:tartaric acid species tend to form higher purity phases compared to Baclofen:malic acid species and contain smaller amounts of API-hydrate impurities. However, it is challenging to remove hydrate water from 2:D−3 or 2:L−3 species. Drying comes with a great loss of crystallinity, while milling has to be conducted under the exclusion of water to reliably gain the presumedly anhydrous form. The anhydrous 2:DL−3 species appears to be the most easily obtainable within all presented samples. However, solution-based crystallization leads to small impurities. Thus, milling is the authors’ recommendation to obtain Phenibut and tartaric acid multicomponent systems.

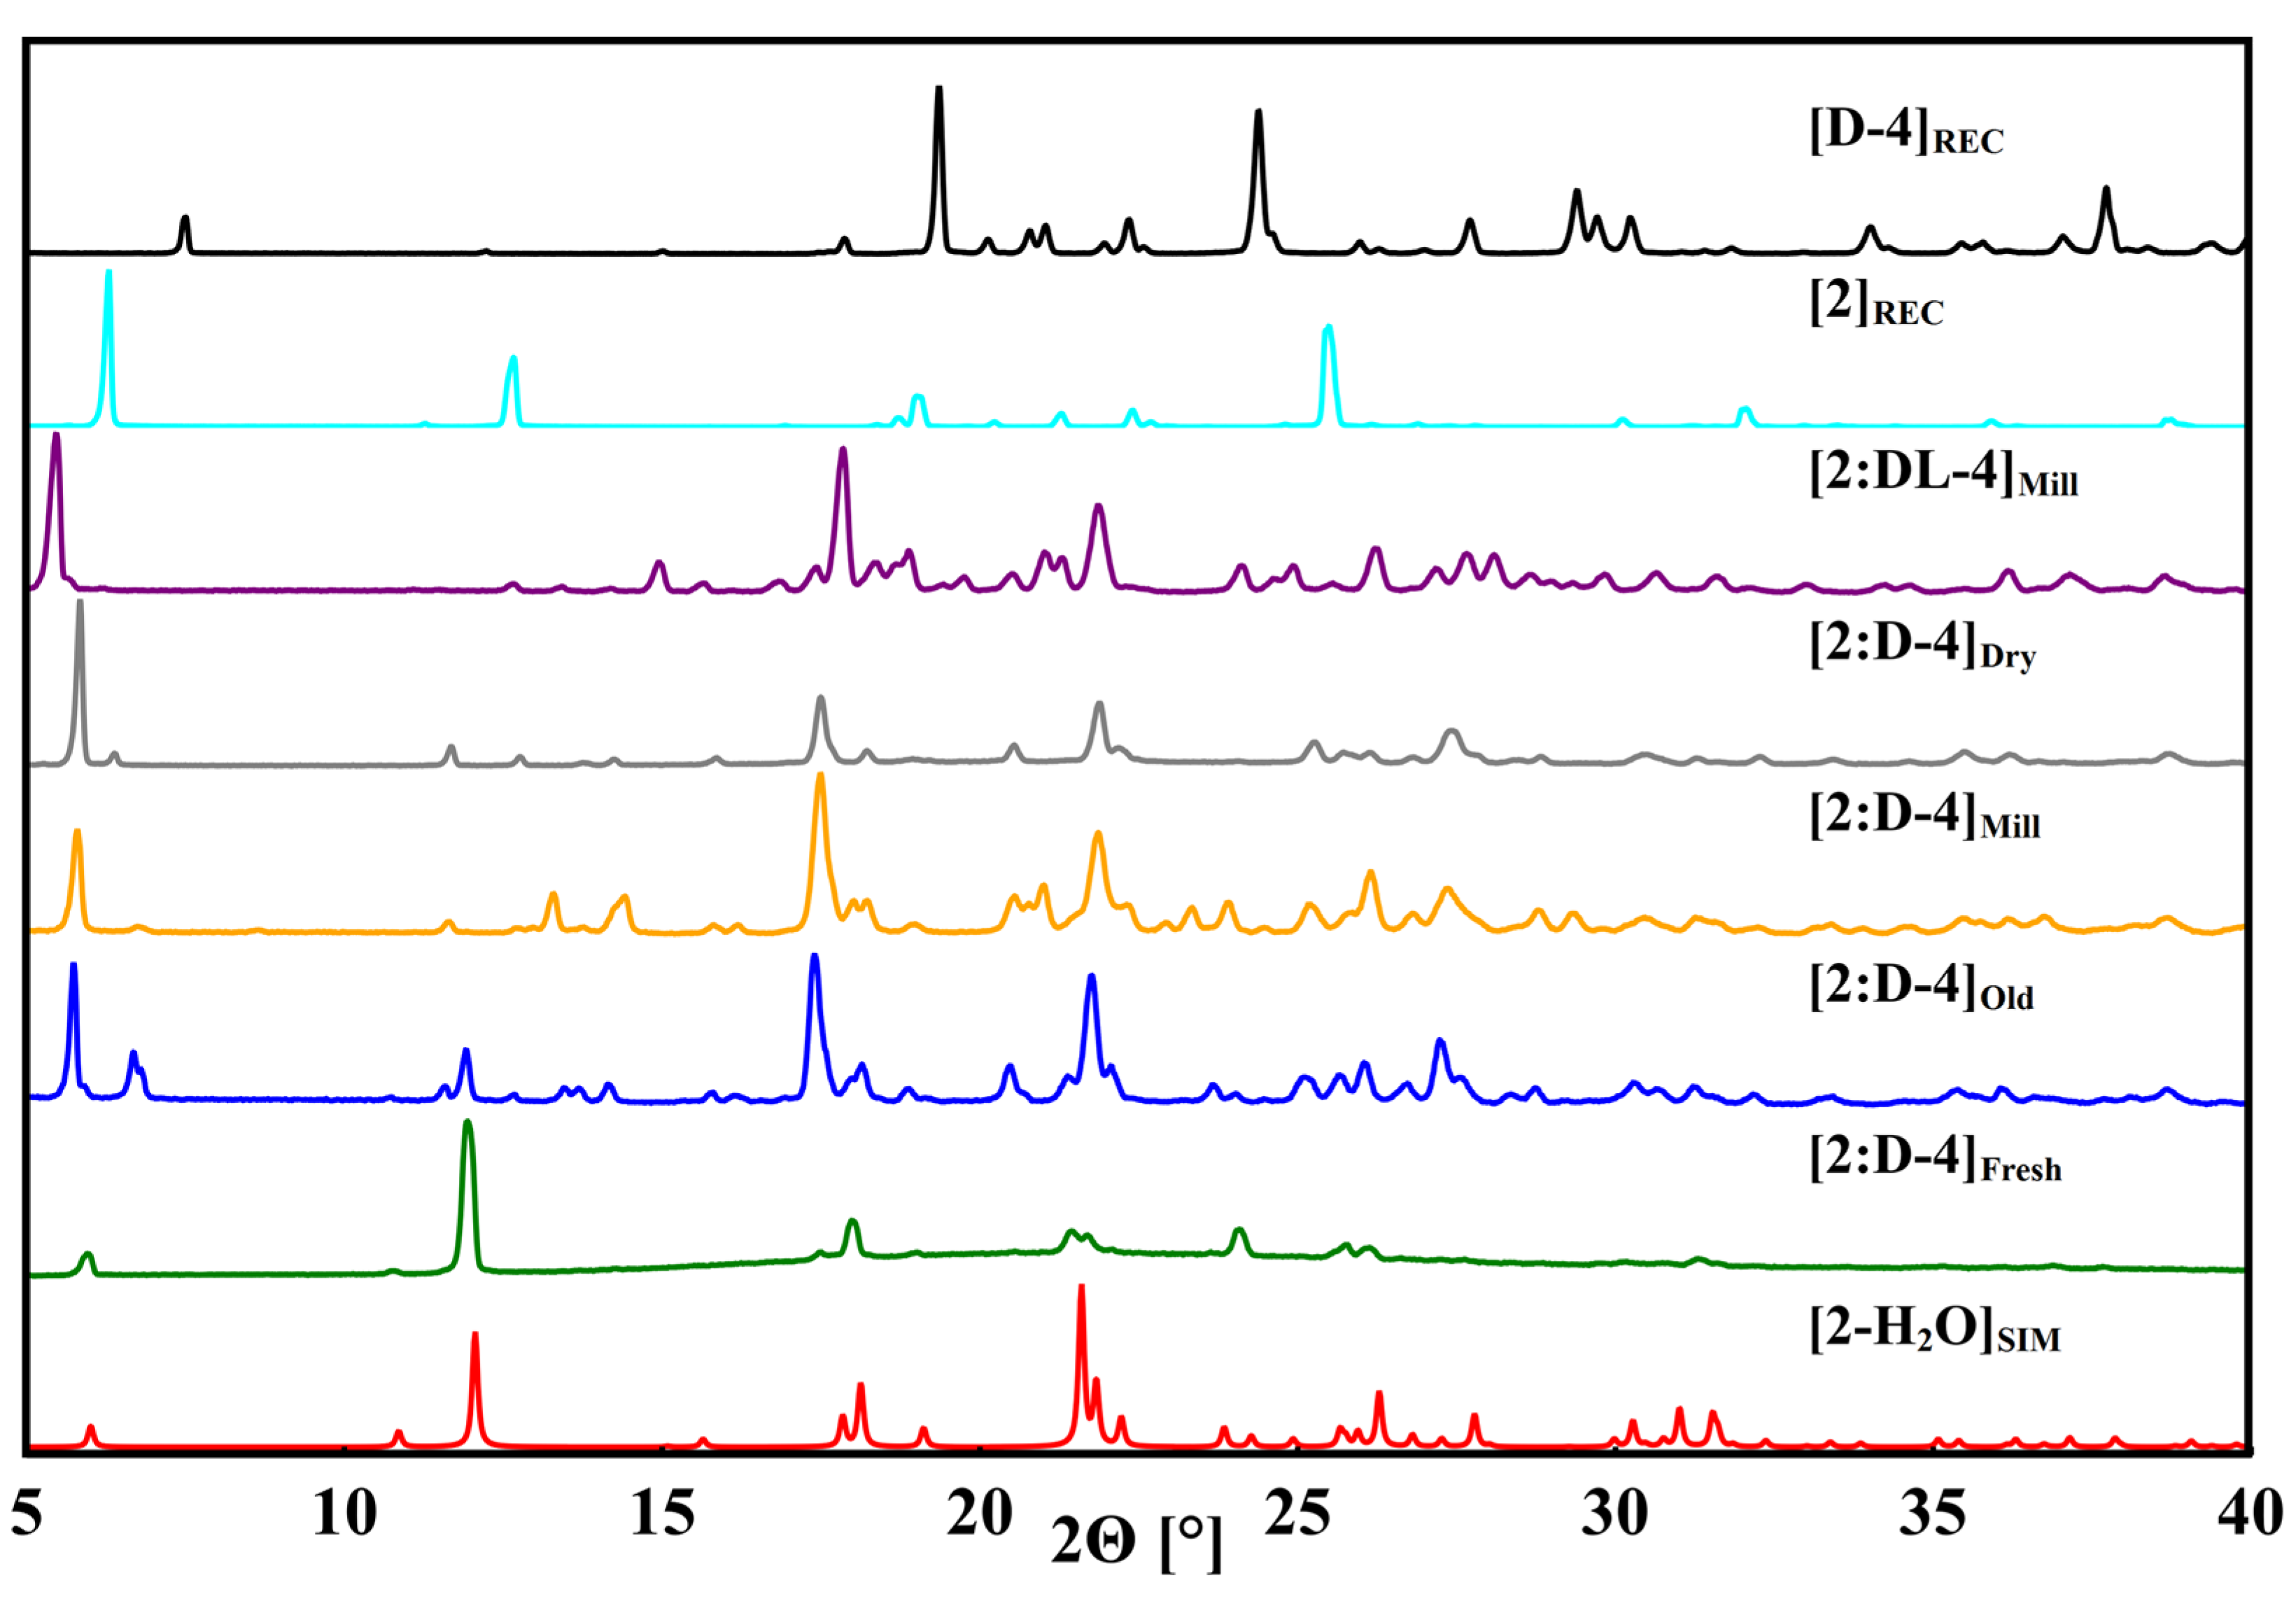
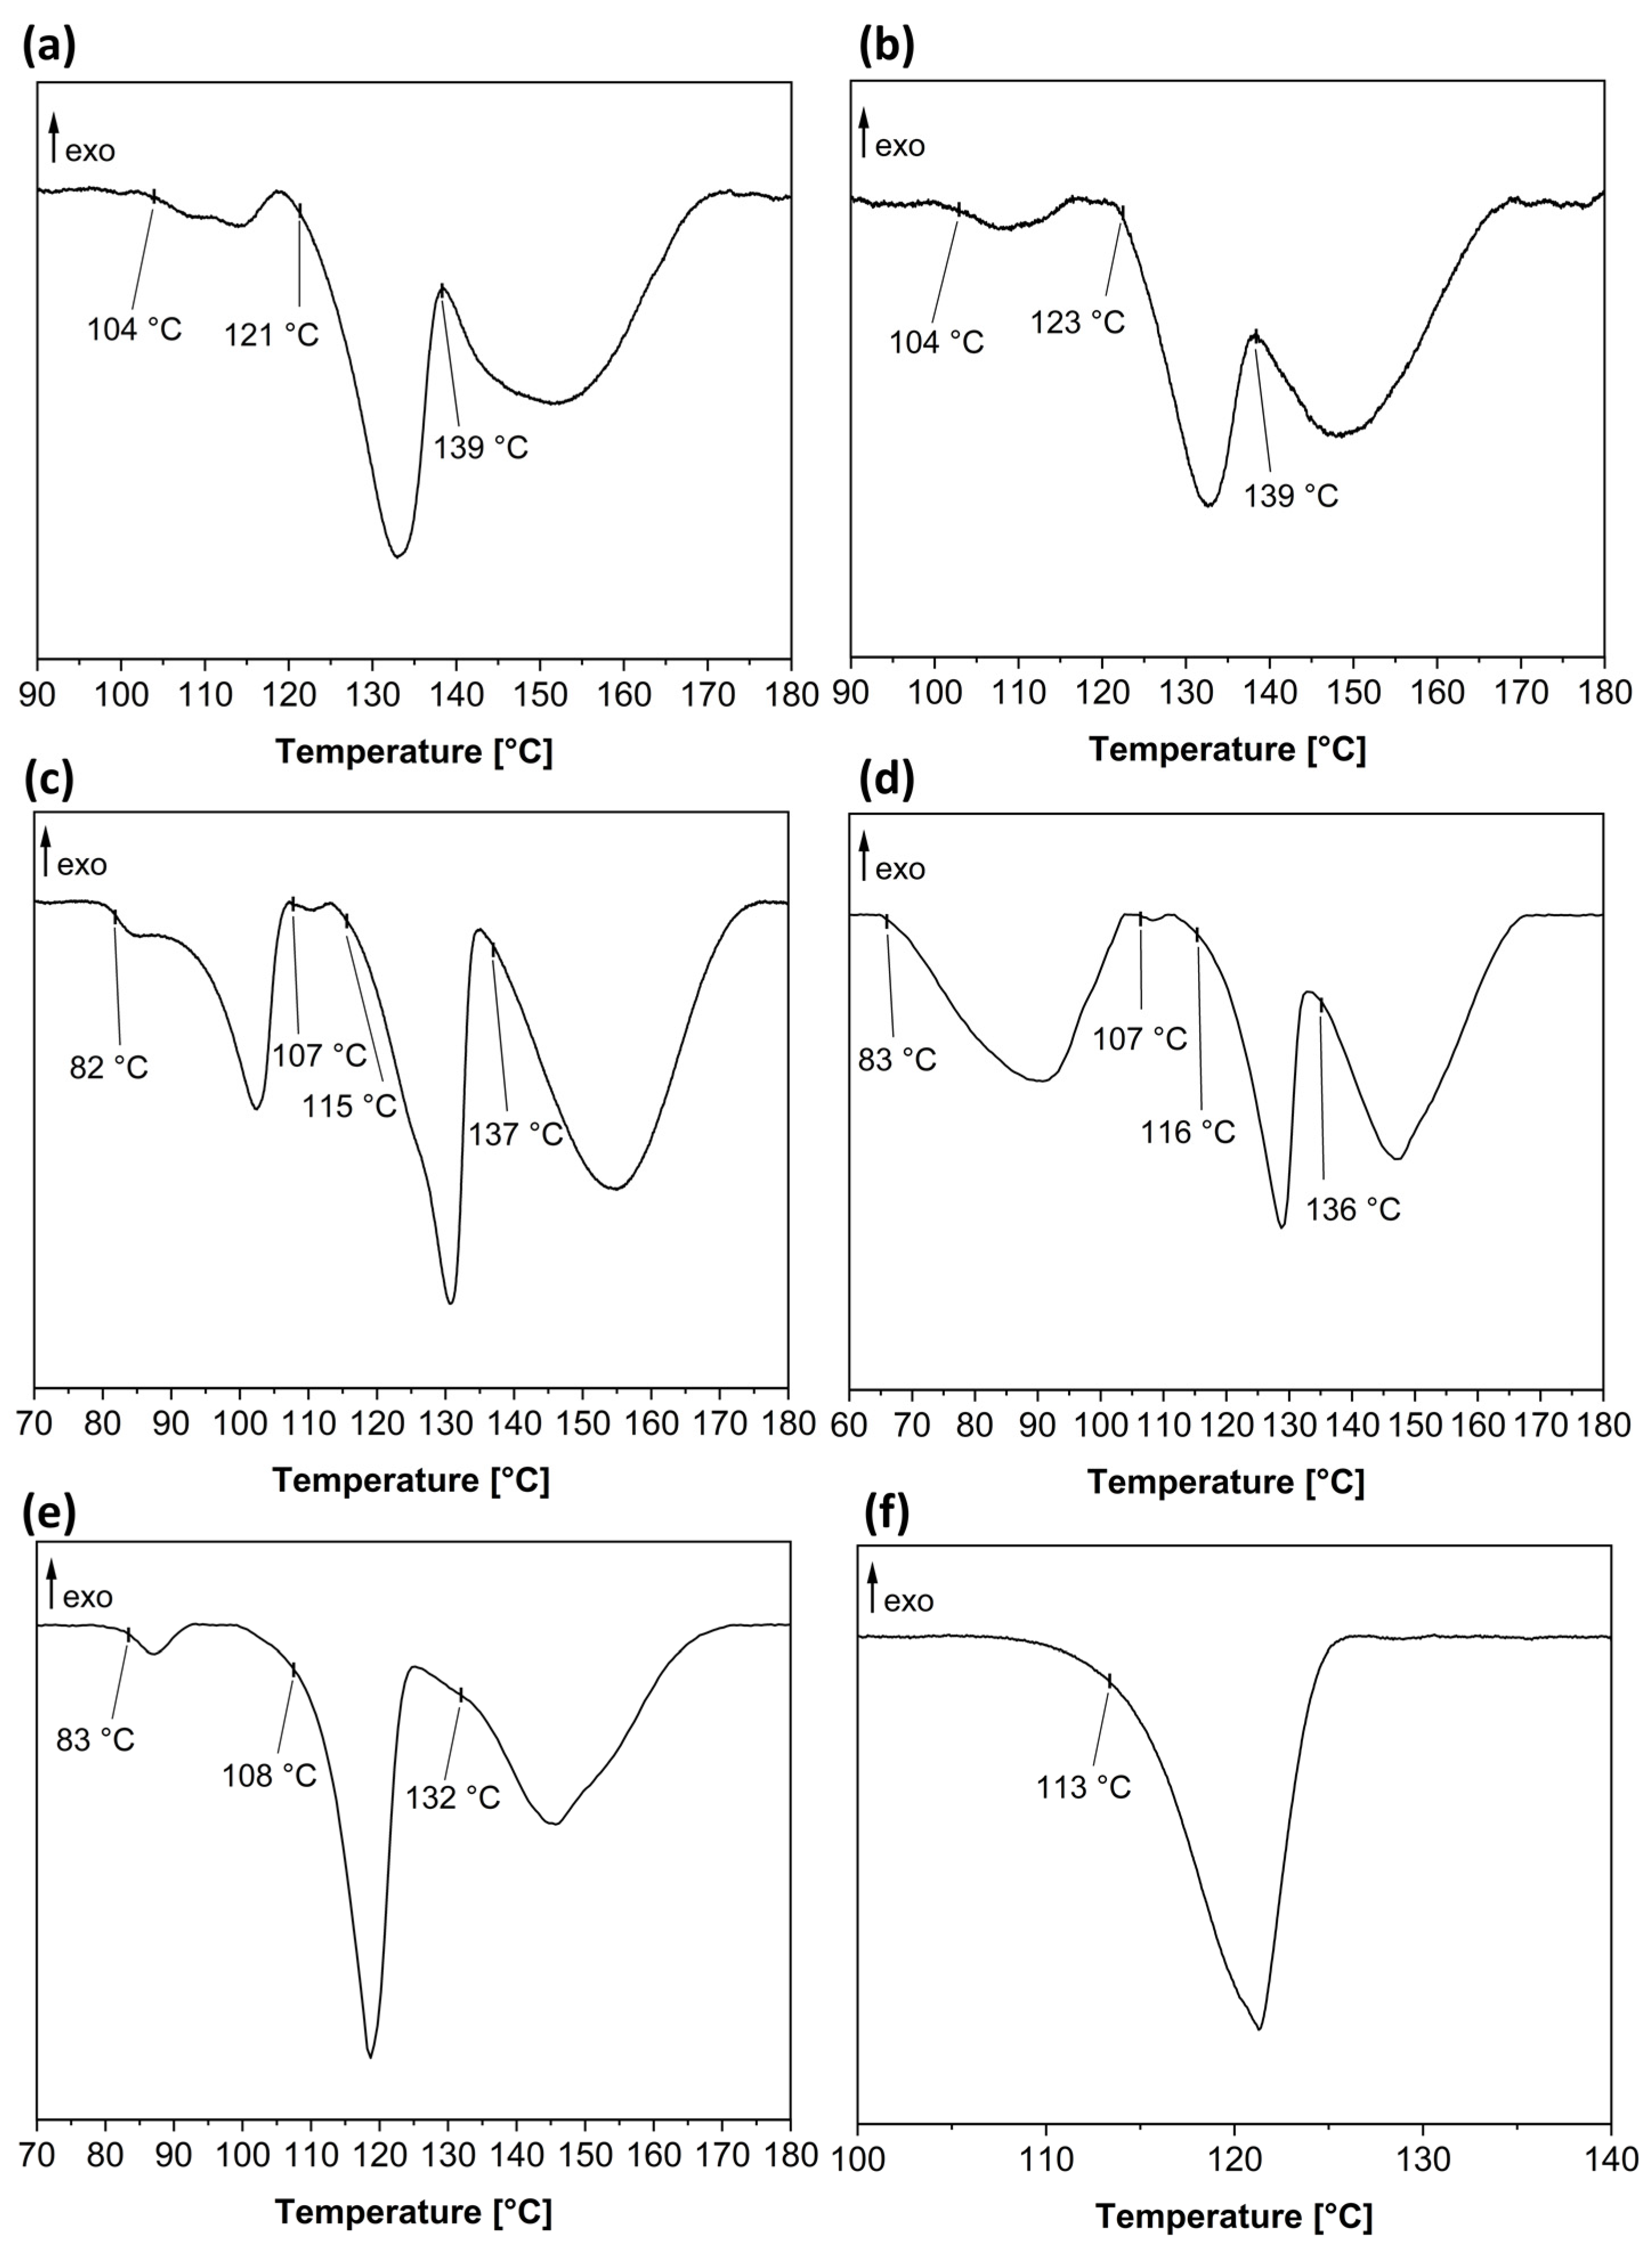
3.5. Phenibut and Malic Acid Species

Attempted crystallization of Phenibut with malic acid proved to be more difficult than with tartaric acid again. Contrary to all other examined combinations, no single crystals suitable for the SC-XRD could be grown during these experiments. However, PXRD data suggest the presence of a multicomponent system of 2 and forms of 4 (Figure 11).
The recorded powder patterns reveal the following: fresh samples received from solution crystallization are identifiable as 2 • H2O for all combinations (see the Supplementary Materials for (rac)−malic acid), and a new phase is received via milling of 2:DL−4 as compared to 2:D−4 or 2:L−4. As freshly prepared samples basically only show reflections attributable to 2 • H2O, obtaining single crystals suitable for SC-XRD proves difficult. Manifold attempts at growing single crystals of the new phase resulted in good quality needle-shaped crystals, which, however, always turned out to be 2 • H2O. In general, Phenibut hydrate formation represents a strong competitive reaction, which impedes multicomponent system crystallization or occurs concomitantly. Powder patterns of 2:4 forms could only be obtained after prolonged drying of samples for weeks at room temperature after all water evaporated or, at least in the presented grey pattern, after vacuum drying. However, it should be noted that attempting to accelerate this process by vacuum leads to transition of the solid crystalline sample to a gooey substance, which does not recrystallize again. The shown pattern was recorded from left-over solid residues taken from said gooey substance. Traces of 2 hydrate remain visible even in the older sample, for example, in the Bragg reflection at 12° 2Θ in the aged 2:D4 sample. This signal is absent from both milling compounds. Furthermore, no patterns could be recorded after DSC-heating. Even though there are two or three visible signals in DSC from solution, they occur in a close range (Figure 12). A viscous substance is received even after the first small DSC step, which is not suitable for PXRD analysis.
Thermal analysis indicates that the phase purity of 2:4 species containing enantiopure co-former was not achieved. Multiple signals were present, especially in the samples obtained via grinding. Even though the resolution was comparatively high, which indicates high crystallinity, no pure product was obtained under the examined conditions. This could explain why no single crystal could be obtained from solution. As no single crystal data were accessible, it can only safely be concluded by PXRD and DSC analysis that two of the received phases must be 2 hydrate and a novel phase containing an embodiment of 2:D or L−4. Judging by the previous received results, a hydrate form of 2:4 seems likely to be formed. The melting point of the presumed anhydrous 2:D or L−4 must be in the range between 137 °C and 139 °C, as this includes the starting point for the final melting step in all recorded DSC data. Contrary to that, just a single melting signal was obtained in 2:DL−4 at 113 °C. This suggests a pure formation of this form.
Phenibut:malic acid species are difficult to obtain in a single crystalline form, the solvent choice being limited to water based on the poor solubility of 2 in other solvents. The results indicate multiple phases for 2 with enantiopure 4 co-formers, possibly including additional hydrate stages. While in conjunction with DL−4, a pure product seems to be obtainable through milling, single crystal growth from solution is still hindered by the formation of 2 hydrate. Without complete drying for prolonged time periods, the discussed phase cannot be obtained from solution, which degrades the quality of single crystals too much to be measured. Attempting to accelerate drying by vacuum or heat results in a gooey substance that might contain some desired product but cannot be analyzed by common solid-state methods. However, if just a quick method to obtain a 2:DL−4 multicomponent system is needed, the authors would recommend grinding, as this system can be regained reliably, at least by comparison of powder patterns, through milling.

4. Discussion

In this study, it was attempted to find similarities or distinctions in the multicomponent crystallization behavior of Baclofen and Phenibut with two simple and similar co-formers, tartaric and malic acid. The goal was to find a feasible method to obtain single crystals as well as pure co-phases for the investigated compounds. The results show that the formation of multicomponent species is possible in all investigated cases. However, a range of difficulties can occur concerning single crystal growth and receiving pure microcrystalline phases. As was shown, the presence of intermediate hydrates is prevalent, be it pure API hydrate forms or multicomponent hydrates, both from solution and liquid-assisted grinding. The zwitterionic GABA moiety present in both APIs offers various HB possibilities to incorporate water into a crystal lattice, same as carboxylic acid or hydroxyl-groups present in the co-formers. Furthermore, as both APIs are nearly insoluble in every solvent except water (where they cannot be considered as “well soluble” either), it becomes obvious why hydrate stages are formed in nearly all cases during crystallization from solution. The stability and predominant formation of the hydrate form become evident, as it occurs even during the grinding process, where water molecules contained in the atmosphere are adsorbed and incorporated into the crystal lattice. The chirality of the investigated compounds brings further complexity into this study. The best results were mainly obtained by milling a racemic API with a racemic co-former, except for Baclofen:tartaric acid systems, where milling as a method should not be preferred. In the case of Phenibut:DL−tartaric acid and Phenibut:DL−malic acid, an anhydrous form could even be received from aqueous solution. Thus, the same chirality on both co-formers seems to be beneficial. An effect of chirality on crystal lattices is visible in Baclofen:D−malic acid hydrate as well as Phenibut:DL−tartaric acid, with the former one being disordered. To compensate for the unfavorable directionality induced by the chiral co-former, the alignment of malic acid shifts by 180° in each position. In the latter, even though chiralities match, the GABA subunit in Phenibut also shifts its alignment constantly to best fit with the corresponding tartaric acid molecule. The formation of the discussed compounds seems to be mostly driven by strong intermolecular interactions. This is also highlighted by the makeup of some other of the received crystalline structures. With the exception of API hydrates and Phenibut:tartaric acid, they all pose a large asymmetric unit consisting of up to eight crystallographically independent molecules. This low symmetry suggests that the raw intermolecular binding force of HB is driving the formation. In Baclofen:DL−tartaric acid hydrate, even the protonation status of Baclofen molecules differs. This could indicate that the formation happens before each Baclofen molecule can be protonated by tartaric acid and just ‘freezes’ in this stage due to beneficial HB interactions. Thus, the formation of hydrates of pure APIs competes with the formation of multicomponent hydrates as well as anhydrous forms. While the exclusion of water via milling is helpful in gaining an anhydrous product, in most cases, it is not an absolute solution. Firstly, single crystals cannot be obtained this way if that is the goal. Secondly, milling must occur under dry conditions to guarantee the formation of anhydrous forms, as was shown. In the case of Baclofen:tartaric acid, solvent-based crystallization is the better solution. However, the product still must be dried by heating, as hydrate traces are persistent even after months. This, on the other hand, leads to loss of crystallinity. Lastly, Phenibut and enantiopure malic acid could not be obtained as a pure phase product in all conducted experiments. Even though not all substances could be received as single crystals, it is highly likely that proton transfer occurs in Phenibut:malic acid species and uncharacterized anhydrous forms as well. Some form of protonation/deprotonation occurs in all investigated species except for the Baclofen and Phenibut hydrates. Furthermore, IR-spectra analysis shows a large variation in carbonyl bands in all multicomponent systems; thus, salts or salt hydrates are probably applicable labels to all of them (see the Supplementary Materials). Regarding reproducibility, the best results can be achieved in the phases described herein, which are obtainable in high purity. The API hydrates can be received reliably through diffusion crystallization. Hydrate forms of Baclofen:tartaric acid forms reliably from aqueous solution; however, the drying product depends on the drying method and crystallinity can vary. The Baclofen:malic acid systems behave differently in that solution-based crystallization is unreliable for them. Crystallization through milling can lead to a product that seems pure at first glance, but as the DSC analysis has shown, the varying distributions of peak areas indicate variations in composition. These problems are also true for Phenibut:D− or Phenibut:L−tartaric acid species, even though Phenibut:DL−tartaric acid is the most reliably receivable system by PXRD as well as DSC analysis. Lastly, Phenibut:malic acid forms are probably the hardest to obtain. It takes a long time to overcome the Phenibut hydrate stage if these systems are attempted to grow from solution. This cannot be forcefully achieved through heat or vacuum drying, as the substance tends to become viscous without recrystallization. While grinding seems to be able to produce a reliable phase by powder pattern comparison, DSC analysis shows that composition varies strongly. Thus, trustworthy reproducibility, as confirmed by the conducted investigations, is only present in API hydrates, Baclofen:tartaric acid hydrates and Phenibut:DL−tartaric acid.
Baclofen and Phenibut, molecularly similar, also pose a similar crystallization behavior. Both tend to form pure hydrates and salt hydrates, representing a favorable competing reaction to the anhydrous phase’s formation, their chirality has a decisive influence on crystal makeup, and it can require effort to obtain a targeted crystallization product.

Supplementary Materials

The following supporting information can be downloaded at: https://www.mdpi.com/article/10.3390/cryst12101393/s1. Table S1: Overview on results obtained by co-crystallization of Baclofen and Phenibut with co-formers tartaric acid and malic acid from solution in solvent water. Table S2: Overview on results obtained by milling co-crystallization of Baclofen and Phenibut with co-formers tartaric acid and malic acid under addition of 10 μL methanol at 25 Hz for 30 min. Table S3: Overview on results obtained by co-crystallization of Baclofen and malic acid in solvent mixtures of ethyl acetate/water and aqueous hexafluoropropan-2-ol. No experiment was carried out with Baclofen and DL-malic acid in aqueous hexaflurorpropan-2-ol. Table S4: Overview on preparation and results of different Baclofen:tartaric acid compounds. 0.5 mmol of Baclofen (107 mg) and 0.5 mmol of tartaric acid (75 mg) were used if not specified otherwise. Table S5: Overview on preparation and results of different Baclofen:malic acid compounds. 0.5 mmol of Baclofen (107 mg) and 0.5 mmol of malic acid (67 mg) were used if not specified otherwise. Table S6: Overview on preparation and results of different Phenibut:tartaric acid compounds. For the preparation of the compounds, 0.5 mmol of Phenibut (90 mg) and 0.5 mmol of tartaric acid (75 mg) were used if not specified otherwise. Table S7: Overview on preparation and results of different Phenibut:malic acid compounds. For the preparation of the compounds, 0.5 mmol of Phenibut (90 mg) and 0.5 mmol of malic acid (67 mg) were used if not specified otherwise. Table S8: Chosen bands corresponding to the carbonyl C=O stretching depicted in Figure S11. Table S9: Chosen bands corresponding to the carbonyl C=O stretching depicted in Figure S12. Table S10: Chosen bands corresponding to the carbonyl C=O stretching depicted in Figure S13. Table S11: Chosen bands corresponding to the carbonyl C=O stretching depicted in Figure S14. Table S12: Chosen bands corresponding to the carbonyl C=O stretching depicted in Figure S15. Figure S1: Recorded powder patterns of Baclofen: tartaric acid systems under different conditions in a range from 5°–40° 2Θ: (blue) a fresh sample of 1:L-3 • H2O, shortly after crystallization, (purple) a sample of the same substance after six months, (green) LAG sample of Baclofen and L-tartaric acid, (grey) a vacuum dried sample of 1:L-3 • H2O, (orange) after heating a fresh sample of 1:L-3 • H2O in a DSC chamber to 140 °C and subsequent cooling before melting occurs, (cyan) 1:D-3 • H2O after six months, (magenta) LAG sample of Baclofen and D-tartaric, (black) after heating a fresh sample 1:D-3 • H2O in a DSC chamber to 140 °C and subsequent cooling before melting occurs. Simulated pattern of 1:L-3 • H2O hydrate is shown in red. Figure S2: Recorded powder patterns of Baclofen:DL-tartaric acid under different conditions in a range from 5°–40° 2Θ. Baclofen and DL-tartaric acid sample after a methanol-assisted grinding (red) and the same sample after heating in a DSC chamber to 115 °C and subsequent cooling before melting occurs (blue). Figure S3: Recorded powder patterns of Baclofen:malic acid systems in a range from from 5°–40° 2Θ: (red) sample of Baclofen and L-malic acid a few days after crystallization occurs; (blue) LAG sample of Baclofen and L-malic acid; (purple) 1:L-4 • H2O obtained from hexafluoro-2-propanol solution contaminated with water six months after crystallization occurs; (green) simulated from single crystal data provided by Córdova-Villanueva et al. [50] (Cambridge Crystal Structure Database Ref. Code YIPLAN) and (cyan) simulated pattern of 1:D-4 • H2O from collected single crystals data. Figure S4: Overview on some recorded patterns of phase mixtures received by co-crystallization of Baclofen and L-malic acid under different conditions in a range from 2°–40° 2Θ: (red) Baclofen; (blue) L-malic acid; (purple) and (green) both samples of Baclofen and L-malic acid shortly after crystallization occurs; (cyan) 1:L-4 sample received from a solvent mixture of ethyl acetate and water shortly after crystallization occurs; (grey) a vacuum dried sample of 1:L-4. Simulated powder patterns from single crystal data provided by Córdova-Villanueva et al. [50] (CCDC Ref. Code YIPLAN) (orange), from single crystal data of 1:D-4 • H2O (magenta) and from single crystal data of 1 • H2O (black) are given for comparison. Figure S5: Recorded patterns of Baclofen:D-malic acid systems under different conditions in a range from 2°-40° 2Θ: Baclofen (red); D-malic acid (blue); different samples of 1:D-4 shortly after crystallization occurs (purple and green); 1:D-4 • H2O after heating to 130 °C in a DSC chamber and subsequent cooling before melting (cyan);. simulated from single crystal data provided by Córdova-Villanueva et al. [50] (CCDC Ref. Code YIPLAN) (orange);. simulated from single crystal data of 1:D-4 • H2O (magenta) and of 1 • H2O (black). Figure S6: Recorded powder patterns of systems Baclofen:DL-malic in a range from 2°-40° 2Θ: (red) Baclofen, (blue) D-malic acid; (purple) 1:DL-4 shortly after crystallization, (green) 1:DL-4 from a solvent mixture of ethyl acetate and water; (cyan) LAG sample of Baclofen and DL-malic; (grey) a vacuum dried 1:DL-4.; (orange) simulated from single crystal data provided by Córdova-Villanueva et al. [45] (CCDC Ref. Code YIPLAN [46]); (magenta) simulated from single crystal data of 1:D-4 • H2O and (black) simulated from single crystal data of 1 • H2O. Figure S7: DSC-data of 1:D-4 (a) and 1:L-4 (b) samples obtained by milling crystallization of Baclofen and D- or L-malic acid under addition of 10 μL methanol at 25 Hz for 30 min. DSC was heated at 5 °C min−1, only important temperature ranges are shown for clarity. Figure S8: Recorded powder patterns of Phenibut:tartaric acid systems in a range from 2°-40° 2Θ: (red) 2:L-3 • H2O pattern simulated from single crystal data; (blue) 2:D-3 • H2O sample shortly after crystallization occurs; (purple) LAG sample of Phenibut and D-tartaric acid; (green) vacuum dried 2:D-3 • H2O sample. Figure S9: Further recorded powder patterns of Phenibut:L-tartaric acid systems under different conditions in a range from 2°-40° 2Θ. Simulated pattern from single crystal data of 2:L-3 • H2O (red) is compared to an LAG sample of Phenibut and L-tartaric acid (blue), 2:L-3 • H2O sample from aqueous solution after heating to 120 °C in a DSC chamber (purple) and a vacuum dried sample of 2:L-3 • H2O (green). Figure S10: Recorded powder patterns of Phenibut:malic acid systems under different conditions in a range from 5°-40° 2Θ: (red) Phenibut; (blue) L-malic acid; (purple and green) different samples of 2:L-4 shortly after crystallization; (cyan) LAG sample of Phenibut and L-malic acid; (grey) a vacuum dried sample of 2:L-4; (orange) 2:DL-4 shortly after crystallization occurs; (magenta) LAG sample of Phenibut and DL-malic acid; (dark-green) a vacuum dried sample of 2:DL-4 and (black) simulated pattern from single crystal data of 2 • H2O. Figure S11: Recorded IR-spectra of used educts (red) Baclofen, (green) Phenibut, (blue) D-tartaric acid, (orange) L-tartaric acid, (purple) D-malic acid and (cyan) L-malic acid in a range from 4000 cm−1 to 400 cm−1. Figure S12: Recorded IR-spectra of Baclofen:tartaric acid systems under different conditions in a range from 4000 cm−1 and 400 cm−1.Samples obtained via crystallization from solution: (red) 1:D-3, (green) 1:L-3, (blue) 1:DL-3 and samples after methanol-assisted grinding: (orange) Baclofen and D-tartaric acid, (purple) Baclofen and L-tartaric acid, (cyan) Baclofen and DL-tartaric acid. Figure S13: Recorded IR-spectra of Baclofen:malic acid systems under different conditions in a range from 4000 cm−1 and 400 cm−1. Sample s from solution crystallization of 1:D-4 • H2O (red), 1:L-4 • H2O (green) and of 1:D-4 (blue) which showed similarities to the published YIPLAN structure in its powder pattern. Samples after LAG experiments: (orange) Baclofen and D-malic acid, (purple) Baclofen and L-malic acid, (cyan) Baclofen and DL-malic acid. Figure S14: Recorded IR-spectra of Phenibut:tartaric acid systems under different conditions in a range from 4000 cm−1 and 400 cm−1. Samples from solution crystallization: (red) 2:D-3, (green) 2:L-3 and (blue) 2:DL-3. Samples from LAG with methanol: (orange) Phenibut and D-tartaric acid, (purple) Phenibut and L-tartaric acid and (cyan) Phenibut and DL-tartaric acid. Figure S15: Recorded IR-spectra of Phenibut:malic acid systems in a range from 4000 cm−1 and 400 cm−1. Samples obtained from solution crystallization: (red) 2:D-4, (green) 2:L-4 and from LAG experiments: (orange) Phenibut and D-malic acid, (purple) Phenibut and L-malic acid, (cyan) Phenibut and DL-malic acid. Figure S16: TGA-data of 1:D-3 • H2O (a), 1:L-3 • H2O (b) and 1:DL-3 • H2O (c). TGA was heated at 10 °C min−1 in a range from 30 °C to 350 °C. Figure S17: TGA-data of a LAG sample of Baclofen and D-tartaric acid with methanol (a), a LAG sample of Baclofen and L-tartaric acid with methanol (b), a LAG sample of Baclofen and DL-tartaric acid with methanol (c), a vacuum dried sample of 1:D-3 • H2O (d), a vacuum dried sample of 1:L-3 • H2O (e) and a vacuum dried sample of 1:DL-3 • H2O (f). TGA was heated with 10 °C min−1 in a range from 30 °C–350 °C. Figure S18: TGA-data of a sample of 1:D-4 (a), a sample of 1:L-4 (b) and a sample of 1:DL-4 (c). TGA was heated at 10 °C min−1 in a range from 30 °C to 350 °C. Figure S19: TGA-data of a LAG sample of Baclofen and D-malic acid with methanol (a), a LAG sample of Baclofen and L-malic acid with methanol (b), a LAG sample of Baclofen and DL-malic acid with methanol (c), a vacuum dried sample of 1:D-4 (d), a vacuum dried sample of 1:L-4 (e) and a vacuum dried sample of 1:DL-4 (f). TGA was heated with 10 °C min−1 in a range from 30 °C–350 °C. Figure S20: TGA-data of a LAG sample of Phenibut and D-tartaric acid with methanol (a), a LAG sample of Phenibut and L-tartaric acid with methanol (b), a LAG sample of Phenibut and DL-tartaric acid with methanol (c), a vacuum dried sample of 2:D-3 • H2O (d), a vacuum dried sample of 2:L-3 • H2O (e) and a vacuum dried sample of 2:DL-3 (f). TGA was heated with 10 °C min−1 in a range from 30 °C–350 °C. Figure S21: TGA-data of a LAG sample of Phenibut and D-malic acid with methanol (a), a LAG sample of Phenibut and L-malic acid with methanol (b) and a LAG sample of Phenibut and DL-malic acid with methanol (c). TGA was heated with 10 °C min−1 in a range from 30 °C–350 °C.

Author Contributions

Conceptualization, V.V. and D.K.; methodology, M.H. and D.K.; validation, M.H. and D.K.; formal analysis, D.K.; investigation, M.H., D.K. and T.S.; resources, V.V.; writing—original draft preparation, D.K.; writing—review and editing, V.V. and M.H.; visualization, D.K.; supervision, V.V.; project administration, V.V.; funding acquisition, V.V. All authors have read and agreed to the published version of the manuscript.

Funding

Funded by the Deutsche Forschungsgemeinschaft (DFG, German Research Foundation)—440366605.

Data Availability Statement

Not applicable.

Acknowledgments

The authors thank Carsten Schauerte, Kevin Grasmik and the SOLID-CHEM GmbH Team for technical support.

Conflicts of Interest

The authors declare no conflict of interest.

References

  1. Morrison, G.; zur Loye, H.-C. Expanding the Chemistry of Salt-Inclusion Materials: Utilizing the Titanyl Ion as a Structure Directing Agent for the Targeted Synthesis of Salt-Inclusion Titanium Silicates. Cryst. Growth Des. 2020, 20, 8071–8078. [Google Scholar] [CrossRef]
  2. Hou, Y.; Sun, X.; Dou, M.; Lu, C.; Liu, J.; Rao, W. Cellulose Nanocrystals Facilitate Needle-like Ice Crystal Growth and Modulate Molecular Targeted Ice Crystal Nucleation. Nano Lett. 2021, 21, 4868–4877. [Google Scholar] [CrossRef]
  3. Uehara, T. Simulation of Polyhedral Crystal Growth Based on the Estimated Surface Energy of Crystallographic Planes. MSA 2021, 12, 519–533. [Google Scholar] [CrossRef]
  4. Wu, C.-S.; Ikeyama, J.; Nakabayashi, S.; Sugiyama, T.; Yoshikawa, H.Y. Growth Promotion of Targeted Crystal Face by Nanoprocessing via Laser Ablation. J. Phys. Chem. C 2019, 123, 24919–24926. [Google Scholar] [CrossRef]
  5. Jain, R.; Mallette, A.J.; Rimer, J.D. Controlling Nucleation Pathways in Zeolite Crystallization: Seeding Conceptual Methodologies for Advanced Materials Design. J. Am. Chem. Soc. 2021, 143, 21446–21460. [Google Scholar] [CrossRef]
  6. Orehek, J.; Teslić, D.; Likozar, B. Continuous Crystallization Processes in Pharmaceutical Manufacturing: A Review. Org. Process Res. Dev. 2021, 25, 16–42. [Google Scholar] [CrossRef]
  7. Tappan, B.A.; Brutchey, R.L. Polymorphic Metastability in Colloidal Semiconductor Nanocrystals. ChemNanoMat 2020, 6, 1567–1588. [Google Scholar] [CrossRef]
  8. Selekman, J.A.; Roberts, D.; Rosso, V.; Qiu, J.; Nolfo, J.; Gao, Q.; Janey, J. Development of a Highly Automated Workflow for Investigating Polymorphism and Assessing Risk of Forming Undesired Crystal Forms within a Crystallization Design Space. Org. Process Res. Dev. 2016, 20, 70–75. [Google Scholar] [CrossRef]
  9. Ostwald, W. Studien über die Bildung und Umwandlung fester Körper. Z. Phys. Chem. 1897, 22U, 289–330. [Google Scholar] [CrossRef]
  10. Ahn, B.; Bosetti, L.; Mazzotti, M. Accounting for the Presence of Molecular Clusters in Modeling and Interpreting Nucleation and Growth. Cryst. Growth Des. 2022, 22, 661–672. [Google Scholar] [CrossRef]
  11. Fu, H.; Gao, X.; Zhang, X.; Ling, L. Recent Advances in Nonclassical Crystallization: Fundamentals, Applications, and Challenges. Cryst. Growth Des. 2022, 22, 1476–1499. [Google Scholar] [CrossRef]
  12. Maurya, R.S.; Jayanthi, S.; Chandaluri, C.G.; Radhakrishnan, T.P. Monitoring Molecular Microparticles through the Amorphous-to-Crystalline Transformation and Fluorescence Enhancement/Tuning. Chem. Mater. 2022, 34, 244–253. [Google Scholar] [CrossRef]
  13. Weber, J.; Bracco, J.N.; Yuan, K.; Starchenko, V.; Stack, A.G. Studies of Mineral Nucleation and Growth Across Multiple Scales: Review of the Current State of Research Using the Example of Barite (BaSO4). ACS Earth Space Chem. 2021, 5, 3338–3361. [Google Scholar] [CrossRef]
  14. Rizvi, A.K.; Roberts, K.J.; Izumi, T. The Influence of Supersaturation and the Presence of Biuret on the Nucleation, Growth and Morphology of Urea Crystallised from Ethanolic Solutions. Isr. J. Chem. 2021, 61, 727–742. [Google Scholar] [CrossRef]
  15. Peng, H.; Tian, N.; Yu, C.; Gao, Y.; Li, K.; Yan, H.; Zhao, P.; Wu, S.; Chen, M.; Gong, J. Insights into the Role of Dipentaerythritol in the Thermodynamics and Nucleation Behavior of a Pentaerythritol–Water System. Cryst. Growth Des. 2022, 22, 449–460. [Google Scholar] [CrossRef]
  16. Ouyang, J.; Xing, X.; Chen, J.; Zhou, L.; Liu, Z.; Heng, J.Y. Effects of solvent, supersaturation ratio and silica template on morphology and polymorph evolution of vanillin during swift cooling crystallization. Particuology 2022, 65, 93–104. [Google Scholar] [CrossRef]
  17. Chen, Y.-M.; Gao, J. Synthesis and characterization of ZnO nanoparticles in n-hexanol solution. Mater. Lett. X 2021, 12, 100106. [Google Scholar] [CrossRef]
  18. Arzig, M.; Künecke, U.; Salamon, M.; Uhlmann, N.; Wellmann, P.J. Influence of the growth conditions on the formation of macro-steps on the growth interface of SiC-Crystals. J. Cryst. Growth 2021, 576, 126361. [Google Scholar] [CrossRef]
  19. Zhang, L.; Xu, Y.; Lou, B.; Qin, X.; Zhang, L.; Liu, X.; Yuan, H.; Zhang, Y.; Rohani, S.; Lu, J. Effect of Additives on Preferential Crystallization for the Chiral Resolution of Citrulline: Experimental, Statistical, and Molecular Dynamics Simulation Studies. Cryst. Growth Des. 2022, 22, 2392–2406. [Google Scholar] [CrossRef]
  20. Hoffmann, J.; Flannigan, J.; Cashmore, A.; Briuglia, M.L.; Steendam, R.R.E.; Gerard, C.J.J.; Haw, M.D.; Sefcik, J.; Horst, J.H. ter. The unexpected dominance of secondary over primary nucleation. Faraday Discuss. 2022, 235, 109–131. [Google Scholar] [CrossRef]
  21. Carpenter, J.E.; Grünwald, M. Pre-Nucleation Clusters Predict Crystal Structures in Models of Chiral Molecules. J. Am. Chem. Soc. 2021, 143, 21580–21593. [Google Scholar] [CrossRef] [PubMed]
  22. Bučar, D.-K.; Lancaster, R.W.; Bernstein, J. Disappearing polymorphs revisited. Angew. Chem. Int. Ed. 2015, 54, 6972–6993. [Google Scholar] [CrossRef] [PubMed] [Green Version]
  23. Liu, Y.; Gabriele, B.; Davey, R.J.; Cruz-Cabeza, A.J. Concerning Elusive Crystal Forms: The Case of Paracetamol. J. Am. Chem. Soc. 2020, 142, 6682–6689. [Google Scholar] [CrossRef] [PubMed]
  24. Malec, L.M.; Gryl, M.; Oszajca, M.T.; Brela, M.Z.; Stadnicka, K.M. Chasing the Co-crystal Disappearing Polymorph with Ab Initio Methods. Cryst. Growth Des. 2021, 21, 6902–6912. [Google Scholar] [CrossRef]
  25. Lapin, I. Phenibut (beta-phenyl-GABA): A tranquilizer and nootropic drug. CNS Drug Rev. 2001, 7, 471–481. [Google Scholar] [CrossRef]
  26. Komisarek, D.; Pallaske, M.; Vasylyeva, V. Crystal Structure and Thermal Properties of Phenibut, Phenibut H2O and Phenibut HCl: A Case for Phase Stability Based on Structural Considerations. Z. Anorg. Allg. Chem. 2021, 647, 984–991. [Google Scholar] [CrossRef]
  27. Belov, F.; Villinger, A.; Langermann, J. von. (R)-Baclofen (R)-4-amino-3-(4-chloro-phen-yl)butanoic acid. Acta Crystallogr. E Crystallogr. Commun. 2022, 78 Pt 1, 33–35. [Google Scholar] [CrossRef]
  28. Gendron, F.-X.; Mahieux, J.; Sanselme, M.; Coquerel, G. Resolution of Baclofenium Hydrogenomaleate By Using Preferential Crystallization. A First Case of Complete Solid Solution at High Temperature and a Large Miscibility Gap in the Solid State. Cryst. Growth Des. 2019, 19, 4793–4801. [Google Scholar] [CrossRef]
  29. Takagi, Y.; Yamada, H.; Ebara, H.; Hayashi, H.; Kidani, S.; Toyooka, K.; Ishino, Y.; Kitano, Y.; Nakanami, A.; Kagechika, K.; et al. Intrathecal baclofen therapy for severe spasticity in an adult with tethered cord syndrome: A case report. J. Med. Case Rep. 2021, 15, 442. [Google Scholar] [CrossRef]
  30. Romito, J.W.; Turner, E.R.; Rosener, J.A.; Coldiron, L.; Udipi, A.; Nohrn, L.; Tausiani, J.; Romito, B.T. Baclofen therapeutics, toxicity, and withdrawal: A narrative review. SAGE Open Med. 2021, 9, 20503121211022197. [Google Scholar] [CrossRef]
  31. Kent, C.N.; Park, C.; Lindsley, C.W. Classics in Chemical Neuroscience: Baclofen. ACS Chem. Neurosci. 2020, 11, 1740–1755. [Google Scholar] [CrossRef] [PubMed]
  32. Agabio, R.; Baldwin, D.S.; Amaro, H.; Leggio, L.; Sinclair, J.M.A. The influence of anxiety symptoms on clinical outcomes during baclofen treatment of alcohol use disorder: A systematic review and meta-analysis. Neurosci. Biobehav. Rev. 2021, 125, 296–313. [Google Scholar] [CrossRef] [PubMed]
  33. Garbutt, J.C.; Kampov-Polevoy, A.B.; Pedersen, C.; Stansbury, M.; Jordan, R.; Willing, L.; Gallop, R.J. Efficacy and tolerability of baclofen in a U.S. community population with alcohol use disorder: A dose-response, randomized, controlled trial. Neuropsychopharmacology 2021, 46, 2250–2256. [Google Scholar] [CrossRef] [PubMed]
  34. Leggio, L.; Litten, R.Z. The GABA-B receptor agonist baclofen helps patients with alcohol use disorder: Why these findings matter. Neuropsychopharmacology 2021, 46, 2228–2229. [Google Scholar] [CrossRef]
  35. Levine, M.; Lovecchio, F. New Designer Drugs. Emerg. Med. Clin. N. Am. 2021, 39, 677–687. [Google Scholar] [CrossRef] [PubMed]
  36. Jouney, E.A. Phenibut (β-Phenyl-γ-Aminobutyric Acid): An Easily Obtainable “Dietary Supplement” with Propensities for Physical Dependence and Addiction. Curr. Psychiatry Rep. 2019, 21, 23. [Google Scholar] [CrossRef] [PubMed]
  37. Doyno, C.R.; White, C.M. Sedative-Hypnotic Agents That Impact Gamma-Aminobutyric Acid Receptors: Focus on Flunitrazepam, Gamma-Hydroxybutyric Acid, Phenibut, and Selank. J. Clin. Pharmacol. 2021, 61 (Suppl. S2), S114–S128. [Google Scholar] [CrossRef]
  38. Kupats, E.; Vrublevska, J.; Zvejniece, B.; Vavers, E.; Stelfa, G.; Zvejniece, L.; Dambrova, M. Safety and Tolerability of the Anxiolytic and Nootropic Drug Phenibut: A Systematic Review of Clinical Trials and Case Reports. Pharmacopsychiatry 2020, 53, 201–208. [Google Scholar] [CrossRef]
  39. Liu, Y.; Wang, Y.; Huang, X.; Li, X.; Zong, S.; Wang, N.; Hao, H. Conformational Selectivity and Evolution Affected by the Desolvation Process. Cryst. Growth Des. 2022, 22, 1283–1291. [Google Scholar] [CrossRef]
  40. Venu, N.; Vishweshwar, P.; Ram, T.; Surya, D.; Apurba, B. (S)-3-(Ammoniomethyl)-5-methylhexanoate (pregabalin). Acta Crystallogr. C Struct. Chem. 2007, 63 Pt 5, o306–o308. [Google Scholar] [CrossRef]
  41. CrysAlisPRO; Oxford Diffraction/Agilent Technologies UK Ltd.: Yarnton, England, 2014.
  42. Sheldrick, G.M. Crystal structure refinement with SHELXL. Acta Crystallogr. Sect. C Cryst. Struct. Commun. 2015, C71, 3–8. [Google Scholar] [CrossRef] [PubMed] [Green Version]
  43. Sheldrick, G.M. A short history of SHELX. Acta. Crystallogr. Sect. A Found. Crystallogr. 2008, 64, 112–122. [Google Scholar] [CrossRef] [PubMed] [Green Version]
  44. Macrae, C.F.; Sovago, I.; Cottrell, S.J.; Galek, P.T.A.; McCabe, P.; Pidcock, E.; Platings, M.; Shields, G.P.; Stevens, J.S.; Towler, M.; et al. Mercury 4.0: From visualization to analysis, design and prediction. J. Appl. Crystallogr. 2020, 53 Pt 1, 226–235. [Google Scholar] [CrossRef] [PubMed] [Green Version]
  45. Dolomanov, O.V.; Bourhis, L.J.; Gildea, R.J.; Howard, J.A.K.; Puschmann, H. OLEX2: A complete structure solution, refinement and analysis program. J. Appl. Cryst. 2009, 42, 339–341. [Google Scholar] [CrossRef]
  46. Ibers, J.A. Gabapentin and gabapentin monohydrate. Acta Crystallogr. C Struct. Chem. 2001, 57 Pt 5, 641–643. [Google Scholar] [CrossRef]
  47. Khandavilli, U.B.R.; Lusi, M.; Frawley, P.J. Plasticity in zwitterionic drugs: The bending properties of Pregabalin and Gabapentin and their hydrates. IUCrJ 2019, 6 Pt 4, 630–634. [Google Scholar] [CrossRef] [Green Version]
  48. Vasudev, P.G.; Aravinda, S.; Ananda, K.; Veena, S.D.; Nagarajan, K.; Shamala, N.; Balaram, P. Crystal structures of a new polymorphic form of gabapentin monohydrate and the e and z isomers of 4-tertiarybutylgabapentin. Chem. Biol. Drug Des. 2009, 73, 83–96. [Google Scholar] [CrossRef]
  49. Wang, Y.; Du, S.; Wu, S.; Li, L.; Zhang, D.; Yu, B.; Zhou, L.; Bekele, H.K.; Gong, J. Thermodynamic and molecular investigation into the solubility, stability and self-assembly of gabapentin anhydrate and hydrate. J. Chem. Thermodyn. 2017, 113, 132–143. [Google Scholar] [CrossRef]
  50. Córdova-Villanueva, E.N.; Rodríguez-Ruiz, C.; Sánchez-Guadarrama, O.; Rivera-Islas, J.; Herrera-Ruiz, D.; Morales-Rojas, H.; Höpfl, H. Diastereomeric Salt Formation by the γ-Amino Acid RS -Baclofen and L -Malic Acid: Stabilization by Strong Heterosynthons Based on Hydrogen Bonds between RNH 3+ and COOH/COO Groups. Cryst. Growth Des. 2018, 18, 7356–7367. [Google Scholar] [CrossRef]
Scheme 1. Overview of the investigated APIs: (a) (rac)−Baclofen 1, (b) (rac)−Phenibut 2 and co-formers (c) tartaric acid 3 and (d) malic acid 4. The dicarboxylic acids were used as racemic mixtures and enantiomerically pure D− and L−forms.
Crystals 12 01393 sch001
Figure 1. Structure comparison of (a) Baclofen • H2O and (b) Phenibut • H2O (re-determined—see Komisarek et al., 2021) [26], view along c-axis. Both compounds are commonly occurring intermediates during attempted crystallizations. Carbon atoms are depicted in grey, hydrogen atoms are depicted in white, oxygen atoms are depicted in red, nitrogen atoms are depicted in blue and chlorine atoms are depicted in green.
Crystals 12 01393 g001
Figure 2. Structure comparison of (a) Baclofen:L−tartaric acid • H2O (view along a-axis), (b) Baclofen:D−tartaric acid • H2O (view along a-axis) and (c) Baclofen:DL−tartaric acid • H2O (view along b-axis). While compounds (a) and (b) behave like mirror images and are composed of hydrate water, single-charged Baclofen and tartaric acid molecules, compound (c) contains additional zwitterionic Baclofen entities. Carbon atoms are depicted in grey, hydrogen atoms are white, oxygen atoms are red, nitrogen atoms are blue and chlorine atoms are green.
Crystals 12 01393 g002
Figure 3. PXRDs of Baclofen:tartaric acid systems under different conditions in a range 2–40° 2Θ. Simulated pattern of 1:D−3 • H2O from single crystal data (red); recorded pattern from (blue) a fresh sample of said substance shortly after crystallization; LAG sample of Baclofen and D−tartaric acid (dark green); heating a fresh sample of 1:D−3 • H2O in a DSC chamber to 140 °C and subsequent cooling prior to melting (orange); a vacuum dried sample of 1:D-3 • H2O (grey). Simulated pattern of Baclofen:DL−tartaric acid hydrate from single crystal data. (cyan) 1:DL−3 • H2O after six months at ambient conditions (purple); after LAG crystallization of Baclofen and DL−tartaric acid (magenta); after heating a fresh sample in a DSC chamber to 135 °C and subsequent cooling prior to melting (black) and a vacuum dried sample of 1:DL−3 • H2O (light green).
Crystals 12 01393 g003
Figure 4. DSC data of the samples grown from aqueous solution. (a) Baclofen:D−tartaric acid hydrate, (b) Baclofen:L−tartaric acid hydrate, (e) Baclofen:DL−tartaric acid hydrate and samples obtained by milling, (c) Baclofen:D−tartaric acid, (d) Baclofen:L−tartaric acid, and (f) Baclofen:DL−tartaric acid. DSC was heated at 5 °C min−1; for clarity, only a temperature range of 70 °C (a,b,e), 80 °C (c,d), and 110 °C (f) is shown.
Crystals 12 01393 g004
Figure 5. Crystal packing of Baclofen: D−malic acid • H2O; view from a-axis. Strongly disordered water molecules accumulate in the pores between Baclofen and malic acid entities. Both malic acid molecules are half occupied and invert their alignment at each position. Carbon atoms are depicted in grey, hydrogen atoms are white, oxygen atoms are red, nitrogen atoms are blue and chlorine atoms are green.
Crystals 12 01393 g005
Figure 6. PXRDs of different Baclofen:malic acid systems obtained as pure phases at least once: freshly synthesized sample of 1:D−4 • H2O (blue) and a six months old sample of 1:L−4 • H2O (green), both obtained from hexafluoro-2-propanol solution contaminated with water; 1:D−4 • H2O sample after heating to 140 °C (orange) or vacuum drying (grey); samples of 1:DL-4 • H2O (purple) and 1:L−4 • H2O (cyan) after methanol-assisted grinding. Simulated patterns of obtained 1:D−4 • H2O (red) and previously reported by Córdova-Villanueva et al. [50] (Crystal Structure Database, Ref. Code YIPLAN) (black) are shown for comparison.
Crystals 12 01393 g006
Figure 7. DSC data of 1:D−4 • H2O (a) and 1:L−4 • H2O (b) samples grown from aqueous hexafluoropropan-2-ol solution; 1:D−4 (c) and 1:DL−4 (d) samples produced by milling. DSC was heated at 5 °C min−1; only important temperature ranges are shown for clarity.
Crystals 12 01393 g007
Figure 8. Structure comparison of (a) Phenibut:DL−tartaric acid (view from a-axis) with a highlighted disorder in the GABA subunit and (b) Phenibut:L−tartaric acid • H2O (view from a-axis). Phenibut occurs in two half-occupied GABA-subunit confirmations in a), as shown through additional atom positions along the chain, which is highlighted between the red and blue colored atoms and bonds on the Phenibut molecule. Carbon atoms are depicted in grey, hydrogen atoms are depicted in white, oxygen atoms are depicted in red and nitrogen atoms are depicted in blue.
Crystals 12 01393 g008
Figure 9. Selected powder patterns received from crystallization experiments involving Phenibut and tartaric acid in a range 2–40° 2Θ are compared to the simulated 2:L−3 • H2O (red) and anhydrous 2:DL−3 (purple) pattern: (blue) freshly prepared sample with L−tartaric acid from aqueous solution; (green) methanol-assisted co-milling sample of Phenibut and L−tartaric acid; (orange) 2:L−3 • H2O sample from aqueous solution after heating to 120 °C in a DSC chamber; (grey) 2:L3 • H2O after vacuum drying; (cyan) fresh 2:DL3 sample from aqueous solution crystallization; (magenta) a co-milling sample of Phenibut and D−tartaric acid, methanol-assisted.
Crystals 12 01393 g009
Figure 10. DSC data collected from Phenibut:tartaric acid samples grown from aqueous solution (a) 2:D−3H2O, (b) 2:L−3H2O, (e) 2:DL−3 and samples obtained by milling (c) 2:D−3H2O, (d) 2:L−3H2O and (f) 2:DL−3. DSC was heated at 5 °C min−1; for clarity, only temperature ranges containing signals are shown.
Crystals 12 01393 g010
Figure 11. Selected PXRDs received from crystallization experiments involving Phenibut and malic acid in a range 2–40° 2Θ are compared to the simulated 2 • H2O (red) and recorded 2 (cyan) and D−4 (black) pattern: (green) freshly prepared sample with D−malic acid from aqueous solution; (blue) six months old sample of Phenibut and D−malic acid from aqueous solution; (orange) 2:D−4 sample produced by methanol-assisted co-milling; (grey) Phenibut and D−malic acid from aqueous solution after vacuum drying; (purple) a co-milling sample of Phenibut and DL−malic acid.
Crystals 12 01393 g011
Figure 12. DSC data collected from samples grown from aqueous solution (a) Phenibut:D−malic acid, (b) Phenibut:L−malic acid, (e) Phenibut:DL−malic acid and samples obtained by milling (c) Phenibut:D−malic acid, (d) Phenibut:L−malic acid and (f) Phenibut:DL−malic acid. DSC was heated at 5 °C min−1; selected temperature ranges are shown for clarity.
Crystals 12 01393 g012
Table 1. Crystallographic data obtained by SC-XRD measurements of 1 • H2O and 2 • H2O.
Parameters1 • H2O2 • H2O
FormulaC10H12ClNO2, H2OC10H13NO2, H2O
Formula Weight [gmol−1]231.67197.23
T [K]100100
Crystal Systemorthorhombicorthorhombic
Space GroupAea 2Aea 2
a [Å]9.5543 (2)9.7521 (3)
b [Å]32.6466 (6)29.3294 (11)
c [Å]7.1995 (1)7.1397 (2)
β [°]9090
V [Å3]2245.64 (7)2042.12 (11)
Z, Z’8, 18, 1
R1, wR2 [%]4.56, 12.114.42, 10.4
Hooft0.003 (16)−0.18 (16)
SourceCu Kα (λ = 1.54184)Cu Kα (λ = 1.54184)
Table 2. Overview of the received single crystalline forms. The depicted compounds containing Baclofen (1), Phenibut (2), tartaric acid (3) or malic acid (4) are sorted by their tendency to transit phases. Products in the left column remain stable only until dried. Products in the mid column remain stable for a longer time upon drying or show transition signals other than melting in the DSC. The product in the right column remains stable after six months under dry conditions and only shows a melting signal in the DSC. Additionally, space group information is given, and some important properties are described.
Quick Phase Transition ≤ 3 dPhase Transition ≥ 3 d or in DSCRemains Stable, DSC Melting Only
1 • H2O, Aea2, only stable in mother liquid1:D−3 • H2O, P1, transition in about 1 week2:DL−3, P 1 ¯ , disorder along GABA subunit
1:L−3 • H2O, P1, transition in about 1 week
1:DL−3 • H2O, P21/n, DSC transition, no decomposition over time
2 • H2O, Aea2, transition upon drying—slower than 1 • H2O1:D−4 • H2O, P 1 ¯ , strongly disordered water molecules; no decomposition over time
2:L−3 • H2O, P21, DSC transition, no decomposition over time
Table 3. Crystallographic data obtained by SCXRD measurements of 1:L−3 • H2O, 1:D−3 • H2O and 1:DL−3 • H2O.
Parameters1:L−3 • H2O1:D−3 • H2O1:DL−3 • H2O
FormulaC10H13ClNO2, C4H5O6, H2OC10H13ClNO2, C4H5O6, H2O(C10H13ClNO2)2, C10H12ClNO2, (C4H5O6)2, (H2O)3
Formula Weight [gmol−1]381.76381.76995.19
T [K]100100100
Crystal Systemtriclinictriclinicmonoclinic
Space GroupP1P1P21/n
a [Å]7.3819 (1)7.3781 (1)19.2882 (4)
b [Å]8.5625 (1)8.5661 (1)7.2929 (3)
c [Å]13.8601 (2)13.8636 (1)32.3679 (10)
α [°]75.551 (1)75.546 (1)90
β [°]88.406 (1)88.339 (1)92.378 (2)
γ [°]89.616 (1)89.529 (19)90
V [Å3]848.02 (2)848.111 (17)4549.2 (3)
Z, Z’2, 22, 24, 1
R1, wR2 [%]2.56, 6.502.76, 7.266.56, 18.38
Hooft−0.003 (6)−0.003 (7)-
SourceCu Kα (λ = 1.54184)Cu Kα (λ = 1.54184)Cu Kα (λ = 1.54184)
Table 4. Crystallographic data obtained by SCXRD measurements of 1:D−4 • H2O.
Parameters1:D−4 • H2O
FormulaC10H12ClNO2, C10H13ClNO2, (C10H13ClNO2)0.5, (H2O)2
Formula Weight [gmol−1]1051.91
T [K]100
Crystal Systemtriclinic
Space Group P 1 ¯
a [Å]6.1571 (1)
b [Å]11.8661 (2)
c [Å]17.6166 (5)
α [°]77.292 (2)
β [°]82.763 (2)
γ [°]76.139 (2)
V [Å3]1215.34 (5)
Z, Z’4, 2
R1, wR2 [%]8.31, 21.28
Hooft-
SourceCu Kα (λ = 1.54184)
Table 5. Crystallographic data obtained by SCXRD measurements of 2:L−3 • H2O and 2:DL−3.
Parameters2:L−3 • H2O2:DL−3
Formula(C10H14NO2)3, (C4H5O6)3, H2OC10H14NO2, C4H5O6
Formula Weight [gmol−1]1023.93329.20
T [K]100100
Crystal Systemmonoclinictriclinic
Space GroupP21 P 1 ¯
a [Å]7.4642 (2)7.2070 (0)
b [Å]20.0354 (6)8.2646 (0)
c [Å]15.8509 (5)13.2223 (3)
α [°]9093.570 (2)
β [°]100.400 (3)103.006 (2)
γ [°]9097.319 (2)
V [Å3]2331.53 (12)757.73 (2)
Z, Z’2, 12, 1
R1, wR2 [%]5.89, 13.855.01, 12.72
Hooft0.1 (2)-
SourceCu Kα (λ = 1.54184)Cu Kα (λ = 1.54184)
Publisher’s Note: MDPI stays neutral with regard to jurisdictional claims in published maps and institutional affiliations.

