Article

Influence of Cooling Scenarios on the Evolution of Microstructures in Nickel-Based Single Crystal Superalloys

1
Department of Engineering Mechanics, Northwestern Polytechnical University, Xi’an 710072, China
2
College of Aeronautical Engineering, Civil Aviation University of China, Tianjin 300300, China
*
Author to whom correspondence should be addressed.
Crystals 2022, 12(1), 74; https://doi.org/10.3390/cryst12010074
Submission received: 10 November 2021 / Revised: 13 December 2021 / Accepted: 18 December 2021 / Published: 6 January 2022
(This article belongs to the Topic Single-Crystal Ni-Based Alloys)

Abstract

:
The reprecipitation and evolution of γ’ precipitates during various cooling approaches from supersolvus temperature are studied experimentally and via phase field simulation in nickel-based single crystal superalloys. The focus of this paper is to explore the influence of cooling methods on the evolution of the morphology and the distribution of γ’ precipitates. It is demonstrated that small and uniform spherical shape γ’ particles formed with air cooling method. When the average cooling rate decreases, the particle number decreases while the average matrix and precipitate channel widths increase. The shape of γ’ precipitates which changed from spherical to cubic and irregular characteristics due to the elastic interaction and elements diffusion are observed with the decrease of the average cooling rate. The phase field simulation results are in good agreement with the experimental results in this paper. The research is a benefit for the study of the rejuvenation heat treatment in re-service nickel-based superalloys.

1. Introduction

As an important high-temperature structural material, nickel-based single crystal superalloys have excellent high-temperature mechanical properties and are widely used as turbine blade materials for modern aviation gas turbine engines [1]. The excellent mechanical properties of this kind of single crystal superalloys mainly come from the precipitation strengthening effect of the γ’ precipitates in the microstructure composed of the L12 type Ni3Al phase (γ’ precipitates) and the fcc Ni-rich phase (γ matrix). A large number of experiments have shown that the characteristic parameters of the γ’ precipitates, such as shape, size, volume fraction and spatial arrangement, play an extremely important role in the mechanical properties of nickel-based single crystal superalloys during application [2,3,4,5]. During the manufacturing and repairing process of turbine blades, the temperature of different parts of the blade will be higher or lower than the solid solution temperature of the γ’ precipitates [6]. Therefore, the dissolution and reprecipitation of the γ’ precipitates will always accompany the heat treatment process. By optimizing the process parameters in the heat treatment process, the mechanical properties of the material can be improved. Therefore, it is very necessary to study the precipitation kinetics of the γ’ precipitates and the morphology of the γ’ precipitates at different cooling rates during the cooling process.
The distribution of the size of the γ’ precipitates is closely related to the cooling rate after solid solution or aging treatment. Babu et al. [7] studied the effect of different cooling rates on the evolution of precipitate morphology during the continuous cooling stage in the welding process. Studies have been shown that the composition of the precipitate is not significantly different at different rates; as the cooling rate increases, the density of the precipitate will increase. Roncery et al. [8] found that nickel-based single crystal turbine blades had large casting pores after uniform heat treatment. Through hot isostatic pressing (HIP) and controlling the cooling rate, a fine and uniformly distributed γ’ precipitates can be obtained. Masoumi et al. [9] studied the reprecipition mechanisms and kinetics of γ’ particles during cooling from supersolvus and subsolvus temperature in AD730TM Ni-based superalloy. With the condition of rapid cooling rate 120 K/min, the γ’ precipitates can maintain a spherical uniform distribution; the γ’ precipitates begin to coarsen and still remain spherical shape at a medium speed of 65 K/min; the γ’ precipitates undergo a transition from sphere to cube when the cooling rate is further reduced to 15 K/min. When the cooling rate drops to 10 K/min, the γ’ precipitates become the irregular shape of “butterfly”. According to the study by Singh et al. [10], the size of the primary and secondary γ’ precipitates decreases with the increasing of the cooling rate after solution treatment, which is due to the limitation of diffusion time and element mobility. When the cooling rate is quite fast, a large amount of fine γ’ precipitates are formed without significant size difference. Changing the cooling rate after the first aging will also affect the performance of the secondary γ’ precipitates, and this performance is different for variable alloy systems. Xue et al. [3] studied the precipitation behavior of the secondary γ’ precipitates of the DD6 single crystal superalloy after the first aging, and showed that there were a large number of small secondary γ’ precipitates in the air-cooled γ matrix channels after aging, but no secondary γ’ precipitates observable after the furnace cooling. During the secondary aging, the secondary γ’ precipitates usually dissolves and disappears with the aging time increases. Sarosi et al. [11] studied the evolution of γ’ precipitates microstructure in different cooling systems through experiments and computer simulations. The study found that a bimodal distribution of γ’ precipitates was obtained at high and low interruption temperatures, while larger γ’ precipitates mono-modal distribution was obtained at intermediate interruption temperatures. In recent years, computer simulation of the precipitation behavior for the γ’ precipitates has become one of the most important approaches to study γ’ precipitation kinetics [12,13,14,15,16,17]. Wen et al. [12] used the phase field method of explicit nucleation algorithm to study the microstructure evolution during continuous cooling at different cooling rates. The results demonstrated that bimodal particle distribution can be achieved at an intermediate cooling rate due to the coupling between diffusion and undercooling. At high cooling rate, the microstructure becomes unimodal because undercooling always exceeds diffusion and the microstructure never reaches soft impingement. Yang et al. [13] studied the effect of different cooling rates on the morphology evolution of the primary and secondary precipitates after the first aging of the nickel-based single crystal superalloys during continuous two step aging with phase field method. The research results show that with the increase of cooling rate, the amount and growth rate of secondary precipitates will increase during the secondary aging process. A number of studies have been performed on the γ’ precipitation behavior for the nickel-based single crystal superalloys, but the research on the kinetic mechanism of precipitation of the γ’ precipitates combined experimental and simulation methods is relatively rare in recent years. Therefore, it is necessary to pay attention to study the behavior of the γ’ precipitates evolution of single crystal superalloys via both experimental and simulation approaches. Furthermore, the studies are extremely important to guide the rejuvenation heat treatment procedure for recover the performance of nickel-based single crystal superalloys turbine blades.

2. Materials and Methods

2.1. Materials

The nickel-based single crystal superalloys samples from Beijing institute of aeronautical materials after standard heat treatment (1290 °C × 1 h + 1300 °C × 2 h + 1315 °C × 4 h/AC + 1120 °C × 4 h/AC + 870 °C × 32 h/AC) was applied in this paper. The chemical compositions of the alloy are listed in Table 1. The volume fraction of the equilibrium γ’ precipitates is close to 70%. The precipitation particle is a regular fcc cubic structure with an average side length of 530 nm, and the average width of the matrix channel before the γ’ precipitates is about 70nm. The microstructure of the original sample is shown in Figure 1.

2.2. Test

All experiments were carried out in a vacuum high-temperature furnace. The size of the sample was 4 mm × 5 mm × 6 mm. As the heating rate has slightly effect on the microstructure of the nickel-based single crystal when heated above the dissolution temperature of the γ’ precipitates, all the experiments were heated to 1608 K at rate of 10 K/min, hold for 4 h, and then different cooling scenarios (air cooling, nitrogen cooling, argon cooling and furnace cooling with the average cooling rate 300, 47, 20, 10 K/min respectively) were used to 1073 K, and finally air cooling to room temperature. The change of temperature was recorded by the display system in the furnace. In the air cooling scheme, the sample was taken out from the furnace with protective clothing. For the nitrogen and argon cooling scenarios, the gas was introduced into the furnace to cooling the samples. The microstructures of all samples were observed by electron scanning microscope (SEM), and the observed surface was selected to be a plane perpendicular to the single crystal axis (that is, parallel to the {001} plane). The sample was first sanded with 800, 1200 and 2000 gradation sandpaper respectively, then polished with 0.5 micron diamond grinding paste to eliminate small scratches, and finally etched for about 40 s in a solution of 20 g CuSO4⋅5H2O, 5 mL H2SO4, 50 mL HCl in 100 mL H2O. Put the corroded samples into the acetone solution and put them together in an ultrasonic cleaner to clean them. The JSM-6390A SEM was used to observe the microstructure and arrangement of the γ’ precipitates and matrix phase on the polished plane of the sample.

2.3. Model

2.3.1. Phase Field Model

In this paper, the phase field model is introduced to simulate the effect of different cooling rates on the microstructure and morphology evolution of nickel-based single crystal superalloys. In order to simulate the microstructure evolution of the γ/γ’ phases, we chose the Ni-Al binary alloy system, ignoring the influence of other elements and also the chemical effect. In nickel-based superalloys, a conservative local concentration field c ( r ,   t ) ( c is expressed as at.%Al, r is the position of the Al atom and t is the evaluation time) and three non-conservative structural order parameters η i = 1 , 2 , 3 ( r ,   t ) are used to describe the model. The concentration field is used to describe the local concentration distribution of different phases in the microstructure. The long-range ordered parametric field is used to describe four possible L 1 2 ordered phases. When η 1 = η 2 = η 3 = 0 , it represents the matrix phase; when, { η 1 , η 2 , η 3 } = η 0 1 , 1 , 1 ,   η 0 1 , - 1 , - 1 ,   η 0 1 , 1 , - 1 , η 0 1 , - 1 , 1 it represents four different phase variants. In the continuous phase field dynamics equations, in order to describe the dynamic evolution of the structural transformations at different stages (nucleation, growth, and coarsening), simplify the complexity of the calculation, and retain the main characteristics of the phase transformation process, the Ginzburg-Landau phenomenological “coarse- grained” free energy functional including concentration and order parameters and characterizing the total free energy of the system is used. The functional usually includes bulk free energy, interface energy and elastic energy.
F = F c h ( c ,   { η i } ) + F e l ( c ,   { η i } ,   ε e l )  
where F c h is chemical free energy, F e l is elastic energy, and   ε e l   is elastic strain tensor.
The chemical free energy which related to the phase transformation includes the bulk free energy and the interface energy and can be written by the Ginzburg-Landau polynomial:
F c h ( c ,   { η i } ) = V f h o m ( c ,   { η i } ) + λ 2 c 2 + β 2 η i 2 d V  
where V is the volume, λ and β are the gradient energy coefficients, f h o m ( c ,   { η i } ) is the free energy density function of the uniform system described by the concentration and order parameters. Generally, it can be approximated by the Landau extended polynomial related to the order parameters. In order to better describe the symmetrical loss of the system from the phase transition process, the simplest extended polynomial is adopted as follows [14]:
f h o m ( c ,   { η i } ) = Δ f 1 2 ( c - c γ ) 2 + B 6 ( c 2 c ) i η i 2 D 3 η 1 η 2 η 3 + E 12 i η i 4  
where Δ f is an energy density scale and c 2 is an arbitrary value between the equilibrium concentration c γ and cγ’. c γ is the equilibrium matrix concentration, and cγ’ is the equilibrium precipitates concentration. B , D and E are the constants related to the equilibrium long-order parameter η 0 , c 2 and the coexisting phases equilibrium concentration c γ and cγ’. In order to ensure that the γ phase and the γ’ phase have the same free energy potential well depth, the values of the constants are:
B = 2 η 0 2 ( c γ c γ ) D = 6 η 0 3 ( c γ c γ ) ( c 2 c γ ) E = 2 η 0 4 ( c γ c γ ) ( c γ + 2 c 2 3 c γ )  
When establishing the realistic kinetic theory of the morphological pattern formation in solid state phase transformations, one key factor to consider is the elastic strain due to the difference in the atomic radius of the solute and the solvent or the lattice mismatch between the new phase and the parent phase. This strain effect is the main factor that controls the morphological evolution of the two-phase system. The interaction between the phases caused by lattice relaxation is quite different from the chemical interaction, it belongs to the long-range interaction. The elastic energy of this long-range interaction is different from the interfacial energy and depends on the volume and morphology of the multiphase mixtures (such as the shape, size, orientation, concentration, structural order parameters, and the mutual position of the new phase particles). According to linear elasticity theory, elastic potential energy can be written in the following form:
F e l ( ε e l ) = F e l a ( ε ¯ ) + 1 2 V C   :   ε e l   :   ε e l d V  
where ε ¯ represents the average strain and F e l a ( ε ¯ ) is the isotropic elastic energy related to the selection of boundary conditions. Without external stress, the value of F e l a ( ε ¯ ) is 0. In the second term on the right side of Equation (5), C represents local elastic tensor which related to the local position and concentration. According to Vegard’s law, C i j k l ( r ) = c ( r ) C i j k l γ + [ 1   -   c ( r ) ] C i j k l γ . According to the Young’s modulus, Shear modulus and Poisson’s ratio given in Ref. [18], the values of the anisotropic elastic tensor can be calculated and shown in the Table 2. It has to be noted that the elastic tensor values were set as constants when the temperature changed in this simulation, which means that the influence of the elastic moduli is neglected.
In small deformation theory, without considering plastic deformation, the total strain can be written as follows:
ε ( r ) = ε e l ( r ) + ε 0 ( r )  
where ε 0 ( r ) is the stress-free strain tensor, which caused by the change in lattice constant during the phase transformation. According to Vegard’s law, the concentration field is used to represent the strain tensor in the stress-free state:
ε 0 ( r ) = ε T Δ c ( r ) E  
where E is the identity matrix, ε T is the diagonal γ γ transformation strain matrix ε i j T = ε T δ i j , ε T = δ / ( c γ - c γ ) and Δ c = c ( r ) - c ( r ) ¯ . The lattice mismatch is related to the lattice constants of the matrix phase and the precipitated phase in the stress-free state. The relationship is as follows:
δ = 2 a γ a γ a γ + a γ  
where a γ and a γ are the lattice constants of γ and γ phases, respectively. According to Vegard’s law of the composition elements in each single phase, the lattice constant can be written as:
a γ = a γ 0 + i Γ i γ x i γ a γ = a γ 0 + i Γ i γ x i γ  
The lattice constants of the two phases at room temperature are a γ 0 = 0.3524   nm and a γ 0 = 0.3570   nm [1]. The vegard coefficients Γ i γ and Γ i γ depend on the position of the added element in the periodic table [19].
According to the small deformation theory, the total strain can be given by the displacement vector U of the material:
ε ( r ) =     U
In this paper, the phase transformation is assumed to be controlled by atomic diffusion. Since the elastic wave relaxes instantaneously with respect to the concentration field, it can be assumed that the system is in a static elasticity (elastic equilibrium), so the sound speed can be considered infinite. For a given boundary condition, the elastic equilibrium solution is obtained by minimizing the elastic energy of the elastic displacement field. The mechanical equilibrium equation can be read as:
· σ = 0
where σ is stress tensor, and σ = C   :   ε e l .
The evolution of the kinetic equation can be obtained by the phenomenological dynamic approaches, assuming that the changing rates of these field variables (concentration field and order parameter fields) are linearly related to the thermodynamic driving forces. Based on the principle of minimum potential energy, the driving force can be expressed by the variation of functional field F to the corresponding field variables. Assuming that the conservative concentration field satisfies the Cahn-Hilliard nonlinear diffusion equation, the non-conservative order parameter field satisfies the Allen-Cahn equation:
c ( r , t ) t = M 2 δ F δ c ( r , t ) + ξ ( r , t ) η i ( r , t ) t = - L δ F δ η i ( r , t ) + ξ i ( r , t )  
where M is the atomic mobility coefficient, which is related to the diffusion rate of atoms; L is the mobility coefficient at the interface, which is related to structural relaxation; ξ ( r , t ) and ξ i ( r , t ) are the random noise terms that satisfy the Gaussian distribution, corresponding to the thermal fluctuation of the molecule. It is assumed here that both mobility coefficients are constant. Referring to [15], it is assumed that the atomic mobility coefficient and the experimentally measured diffusion coefficient D = D 0 exp ( - Δ U / k T ) satisfy the following relationship:
M = D 2 f h o m / c 2 = D   Δ f  
where D 0 = 1.45   ×   10 4   m 2 s 1 and Δ U = 2.8   eVatom 1   [20]. In order to ensure that the structure relaxation is several orders of magnitude faster than the diffusion relaxation, the two mobility coefficients satisfy the following relationship χ ( T ) = M / L d 2 = 1.91   ×   10 10 exp ( - 2.80   ×   10 5 / R T ) in this paper [12]. According to Ref. [16], the energy scale ∆f can be calculated with the express σ e x p = σ d Δ f where σ = 0.66   ×   10 3 and σ e x p = 4   mJ / m 2 [21].
In nickel-aluminum alloys, the steady-state microstructure is asymmetric. When the two phases are in equilibrium, the concentration of aluminum atoms in the precipitated phase is not greatly affected by temperature. Follow Ref. [22], it can be assumed that the equilibrium concentration of the matrix phase at different temperatures satisfies the following relationship:
c γ ( T ) = 1.5   ×   10 4 T   -   0.05095  
In this paper, the Fourier spectrum method is introduced to solve the time-variable system of Günzburg Landau equation. An implicit algorithm is used for the main ellipse operator to reduce the stability-related constraints, and the nonlinear terms are explicit to avoid excessive time spent for solving nonlinear equations [23].

2.3.2. Numerical Inputs

In the numerical simulation, we use dimensionless time τ = μ t and dimensionless space coordinate points r = r / d . In this simulation, we take μ = L Δ f and the mesh grid space d = 5   nm , the number of two-dimensional simulating meshes is 512   ×   512 and the size of the model is 2.56   ×   2.56   μ m 2 . The grid is square, along [01] and [10], respectively. In the Ni-Al binary phase field modeling, assuming that the initial state is a disordered supersaturated solid solution, the concentration value at each position is arbitrary value between the equilibrium concentration of matrix and precipitate. Following the Ni-Al phase diagram results of Ref. [22], we set the concentration value as c ( r ) = 0.2 . The initial state order parameter is η i ( r ) = 0 , where i = 1 ,   2 ,   3 . In this simulation we take η 0 = 1 . Dimensionless coefficients: λ ˜ = λ / ( Δ f d 2 ) , β ˜ = β / ( Δ f d 2 ) where d is the grid spacing. The non-dimension coefficients are chosen as λ ˜ = 0.21 , β ˜ = 9.75   ×   10 - 4 at 1223 K and λ ˜ = 0.28   β ˜ = 1.3   ×   10 - 3 at 1073K and we assume that these two parameters are exponential functions of the temperature. This choice can ensure that there is a sufficiently large diffusion interface and that the anti-phase boundary (APB) energy is two times greater than the interface energy.

3. Results

3.1. Test Result

Reprecipitation from the Ultra-Solid Solution Temperature with Different Cooling Approaches.
Figure 2 demonstrates the microstructure of the nickel-based single crystal superalloys which was heated above the dissolution temperature of the precipitates and then cooled with different cooling methods. The image J software is used to count the number and size of the γ’ particles for the variable cooling approaches and the results are shown in Figure 3 and Figure 4.
During air-cooling (Figure 2a), the precipitates are small-spherical types. The particles are randomly and homogenously distributed in the whole domain, and the size difference between the particles is not significant. For the nitrogen cooling (Figure 2b), the precipitates are mainly elliptical, some of them form a rectangle structure, but the edges and corners are not obvious, and some of them are still spherical. The ratio of length to diameter is from 1.0 to 1.7, which indicates that the precipitates have begun to evolve from spherical to rectangle in some area. For the argon-cooled case (Figure 2c), the precipitate grew further and became cubic. The direction of the wider matrix channels are mostly along <01> direction. In the furnace cooling (Figure 2d), the morphology of the precipitates are mainly cubic, a large part of the precipitates does not have regular geometry, the arrangement of the precipitates are obvious irregular, the difference of the area of the precipitates is further expanded, the area ratio of the large cube precipitate to the small one is 7.05 times. The widths of matrix channels are also very different. The small precipitates can be observed in the wide part of matrix. In some places, the precipitates fused, and the morphology became “L” type. In other places, the matrix channels become “islands”, it seems that the precipitate phase surrounds the matrix phase, that is, the so-called topological structure inversion [24]. When the matrix is relatively wide, the curvature of the interface changes greatly, showing a “wavy” shape. In some domain, as shown in the red rectangular box in Figure 2d, the area of matrix is even larger than the near precipitates.

3.2. Simulation Results

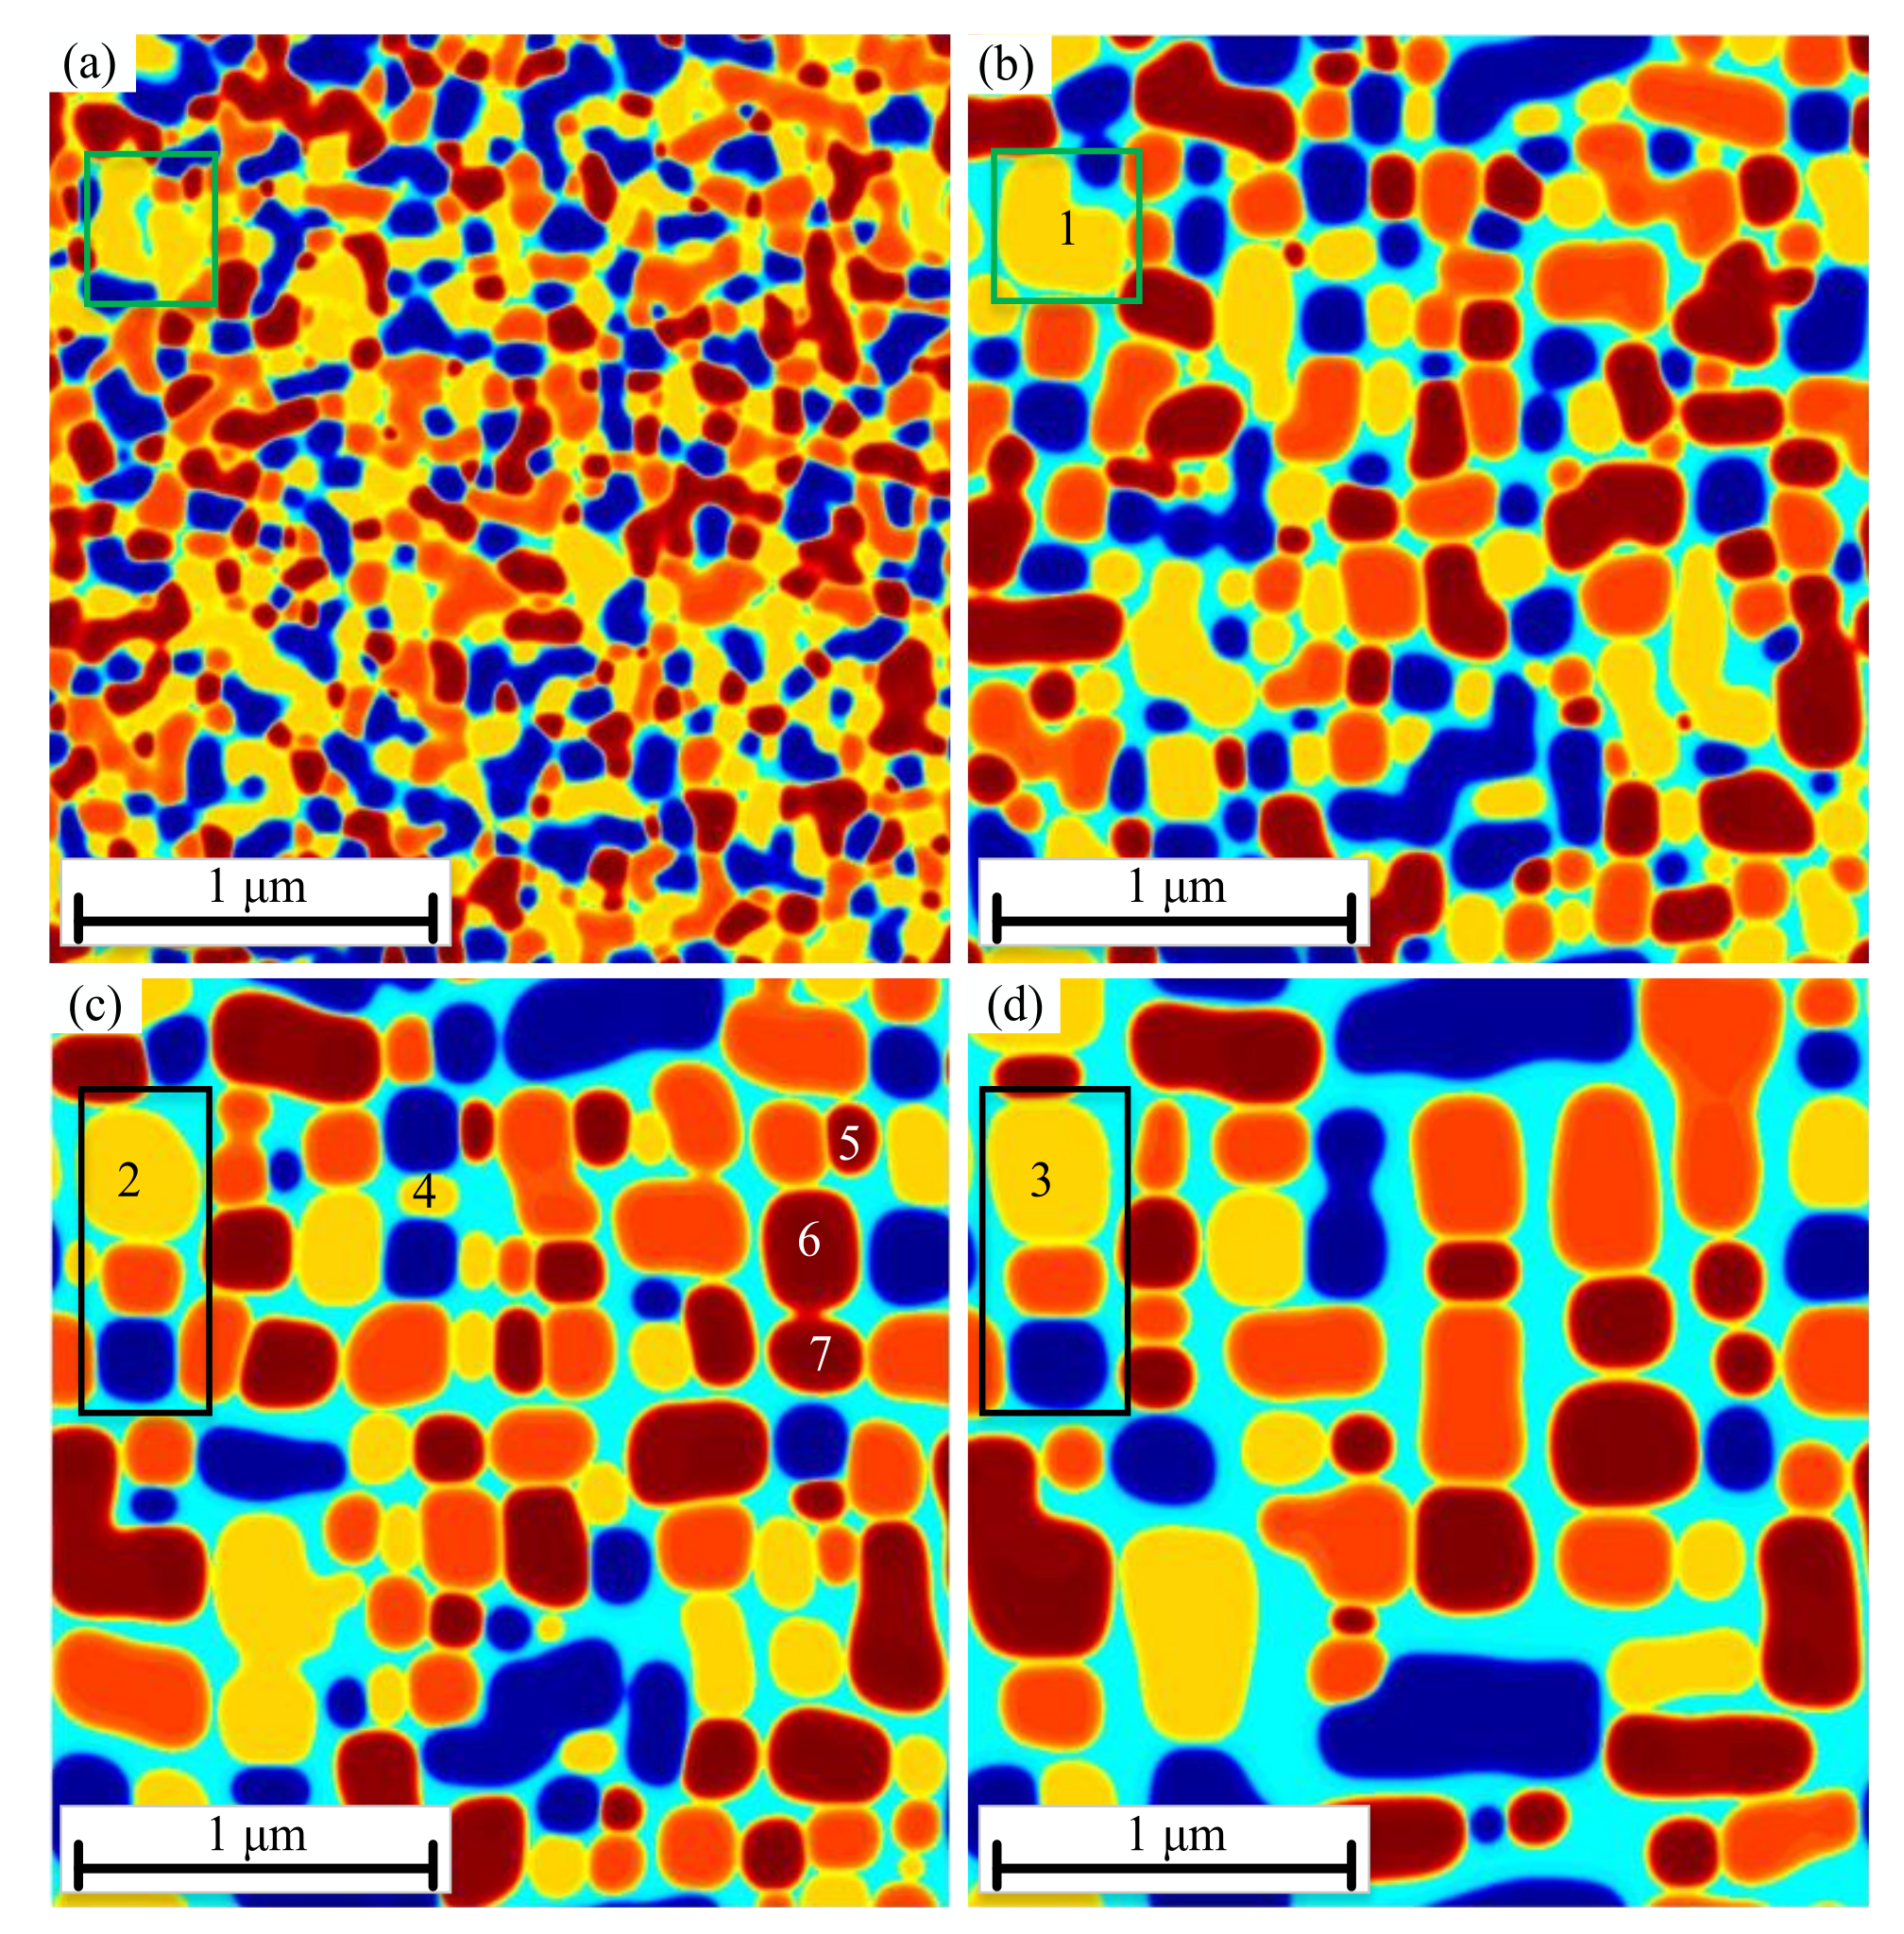
3.2.1. Morphology Microstructure for Different Cooling Approaches

The phase field microstructure morphology diagrams of Ni-Al binary alloy with different cooling methods from the super solid solution temperature to 1073K are shown in Figure 5. The order parameters η i = 1 , 2 , 3 ( r ,   t ) are used to describe the various γ’ variants. The four crystallographic variants of the γ’ phase are distinguished by four colors blue, orange, red and yellow respectively. In order to simulate the evolution of the precipitates for different cooling scenarios, the same concentration and order parameters are introduced for the initial conditions. For the air cooling as shown in Figure 5a, the variants are small enough, and the shapes are irregular. The size will become large and the shapes will become regular with the decrease of the cooling rate as shown in Figure 5b–d. The precipitates of the same variant will fuse together in the process of growing up as the yellow variant in the green box in Figure 5a,b, and different variants of precipitates will not fuse with each other, as the yellow, orange and blue variants in the black box in Figure 5c,d. With the decrease of cooling rate, the precipitates of the same type merge first and then cubic as the variants 1, 2 and 3 shown in Figure 5b,d. With the decrease of cooling rate, the different types of precipitates between the large precipitates do not grow up gradually, but become smaller or even disappear under the action of the large precipitates. The variant 6 and 7 become smaller and the variant number 4 and 5 disappear in Figure 5c compared to these variants in Figure 5d. The statistical characteristic information was demonstrated in Figure 3 and Figure 4.

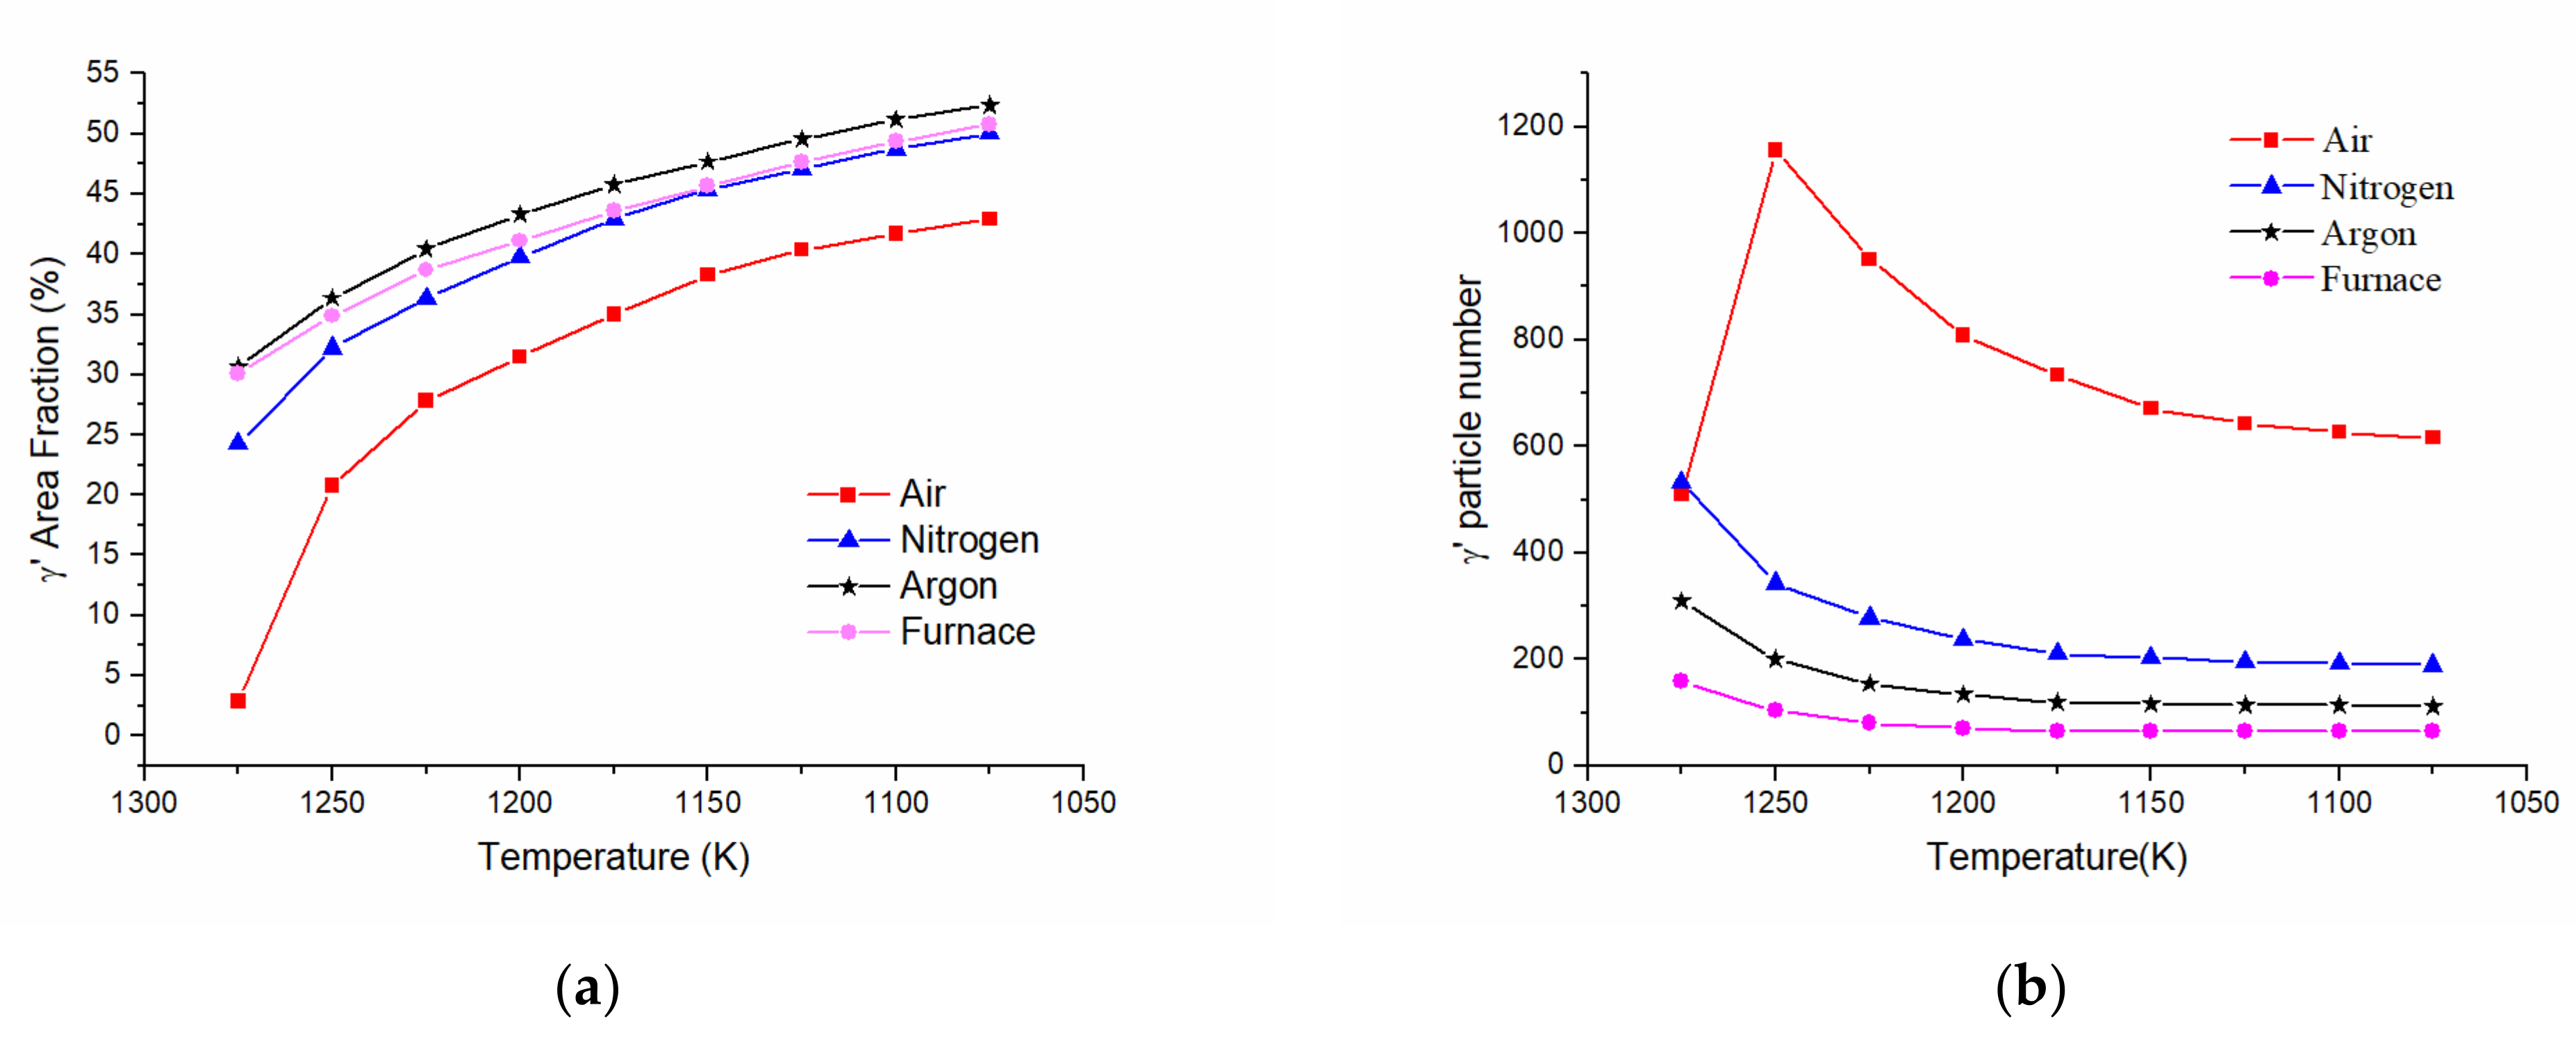
3.2.2. The Particle Sizes and Area Fractions Evolution during the Cooling Process for Various Cooling Approaches

The precipitates numbers and area fractions evolution during the cooling procedure are shown in Figure 6. With the decrease of temperature, the area fraction increases but the number of precipitates decreases gradually (except for the air cooling approach). The number of precipitates in air cooling is obvious higher than other cooling methods, but the area fraction of precipitates is basically the same level at the end of the continuous cooling. With the decrease of cooling rate, the area fraction of precipitates increased gradually. The number of precipitates increase first and then decrease during air-cooled process.

4. Discussion

4.1. Effect of Cooling Approaches on the Particles Distribution

In the Ni-Al binary alloy, the growth of the new precipitates requires the diffusion of solute atoms, which belongs to the growth of diffusion control. During the cooling process, undercooling offers the driving force for precipitation. The relationship between driving force Δ G V and undercooling Δ T can be demonstrated as follows:
Δ G V = Δ H f ( T m T ) T m  
where Δ H f is the latent heat of solution, T m is the solid solution temperature of the precipitates, T is current temperature and undercooling Δ T is equal to T m T .
According to the classical nucleation theory [25] and the knowledge of phase transform dynamics, the critical nucleation radius r c r and activation free energy Δ G c r can be calculated as follows:
r c r = - 2 σ ( Δ G V + Δ G ε ) 1 Δ T Δ G c r = 16 π σ 3 3 ( Δ G V + Δ G ε ) 2  
where σ is the interface free energy between γ and γ . Δ G S is the strain energy for the production of the unit new phase, and it can be read as Δ G S = 4 μ δ 2 .
Combined Equations (15) and (16), it can be seen that critical nucleation radius has the inverse proportion with the undercooling. It means that the nucleation behavior will becomes easier as the decrease of the temperature T .
During air cooling, the cooling rate is the largest and the temperature drops sharply. The supersaturation in the whole domain is at a fairly high level. For the highest cooling rate, the starting of precipitation was delayed [2]. Therefore, the nucleation rate increased faster with the increasing undercooling. When the transform temperature reached, the nucleation behavior happened in the whole domain, and the number of the precipitates is huge. As the nucleation rate is higher than the growth rate, the growth of the precipitates and the irregular growth can be inhibited during the nucleation phase. This is the reason why homogeneous and small precipitates could be observed in the whole domain with the air-cooled procedure. As the decreasing of temperature, the degree of undercooling increases, the diffusion coefficient decreases rapidly, and the ability of particles to diffuse through long-range atoms weakens. The critical length for the transform from spherical to cubic cannot be reached.
In the nitrogen gas cooled procedure, smaller cooling rate compared to air cooling, the precipitates growth and coarsen at the same time. Therefore, it can be observed that the size of the precipitates is larger than that in air cooling. During the phase transformation, the strain energy caused by lattice mismatch and interface energy between the two phases occur. The phase transform will follow the direction of decreasing the two energies. The mutual competition between them has a great influence on the final microstructure of the precipitates. When the nucleus of the new phase is very small, the ratio of surface area to volume of the new phase is very large, and the interface energy plays a major role in the evolution of the microstructure. Due to the isotropic surface tension, the resulting precipitates appear spherical. When the size of the crystal nucleus becomes larger, the strain energy plays an important role in the evolution of the precipitates. Due to the anisotropy of the elastic modulus, the precipitate changes from spherical to cubic or cuboid with the long side perpendicular to the direction of elastic softening. During cooling with nitrogen, some particles changed its shape from spherical to cubic due to the elastic anisotropy. However, the degree of undercooling is still very large, the rate of nucleation was still greater than the rate of growth, and most of the particles are still spherical in Figure 2b.
When argon gas is used for cooling, the growth rate of the crystal nucleus gradually increases due to the further reduction of the cooling rate. With the anisotropy of the elastic modulus, the precipitates have high cubic degree and the area fraction of the precipitates gradually increases. During the phase transform progresses, in order to further reduce the interfacial energy, the precipitates will also merge in the direction of elastic softening <10>, which is also the reason for the difference in the size of the precipitates.
In the furnace cooling approaches, the rate of temperature decrease is the lowest and the rate of nucleation is slow. But after the nucleus is precipitated, it will quickly grow and coarsen, and then cubic. Finally, the microstructure of the precipitates appears irregular due to the non-directional long-range diffusion of solute atoms. Therefore, it can be found that the number of precipitates is lower, the area fraction is larger, and the shape is more irregular. The long holding time at high temperature could cause the movement of edge dislocations, and the phenomenon of dislocation pinning occurs at the interface between the matrix and the precipitation phase, making the coherent absence become a non-coherent interface [2]. Coupled with the elastic interaction between the precipitates and the long-range diffusion of solute atoms, the final microstructure appears irregular. Due to the slower nucleation rate, the total number of crystal nuclei will also decrease, and the width of the matrix could be large in some domain. When the temperature is lowered sufficiently, the undercooling degree in these places reaches the critical crystal nuclei radius value, it will lead to the formation of small secondary precipitates. This phenomenon has been reported in a large number of studies [9,10,11,12,13]. Since the quench temperature is low enough, the secondary precipitates have gradually merged with the primary precipitates and disappeared with time. Finally, the occurrence of secondary precipitates has not been observed in this paper. And it also might be too small to observe by SEM.

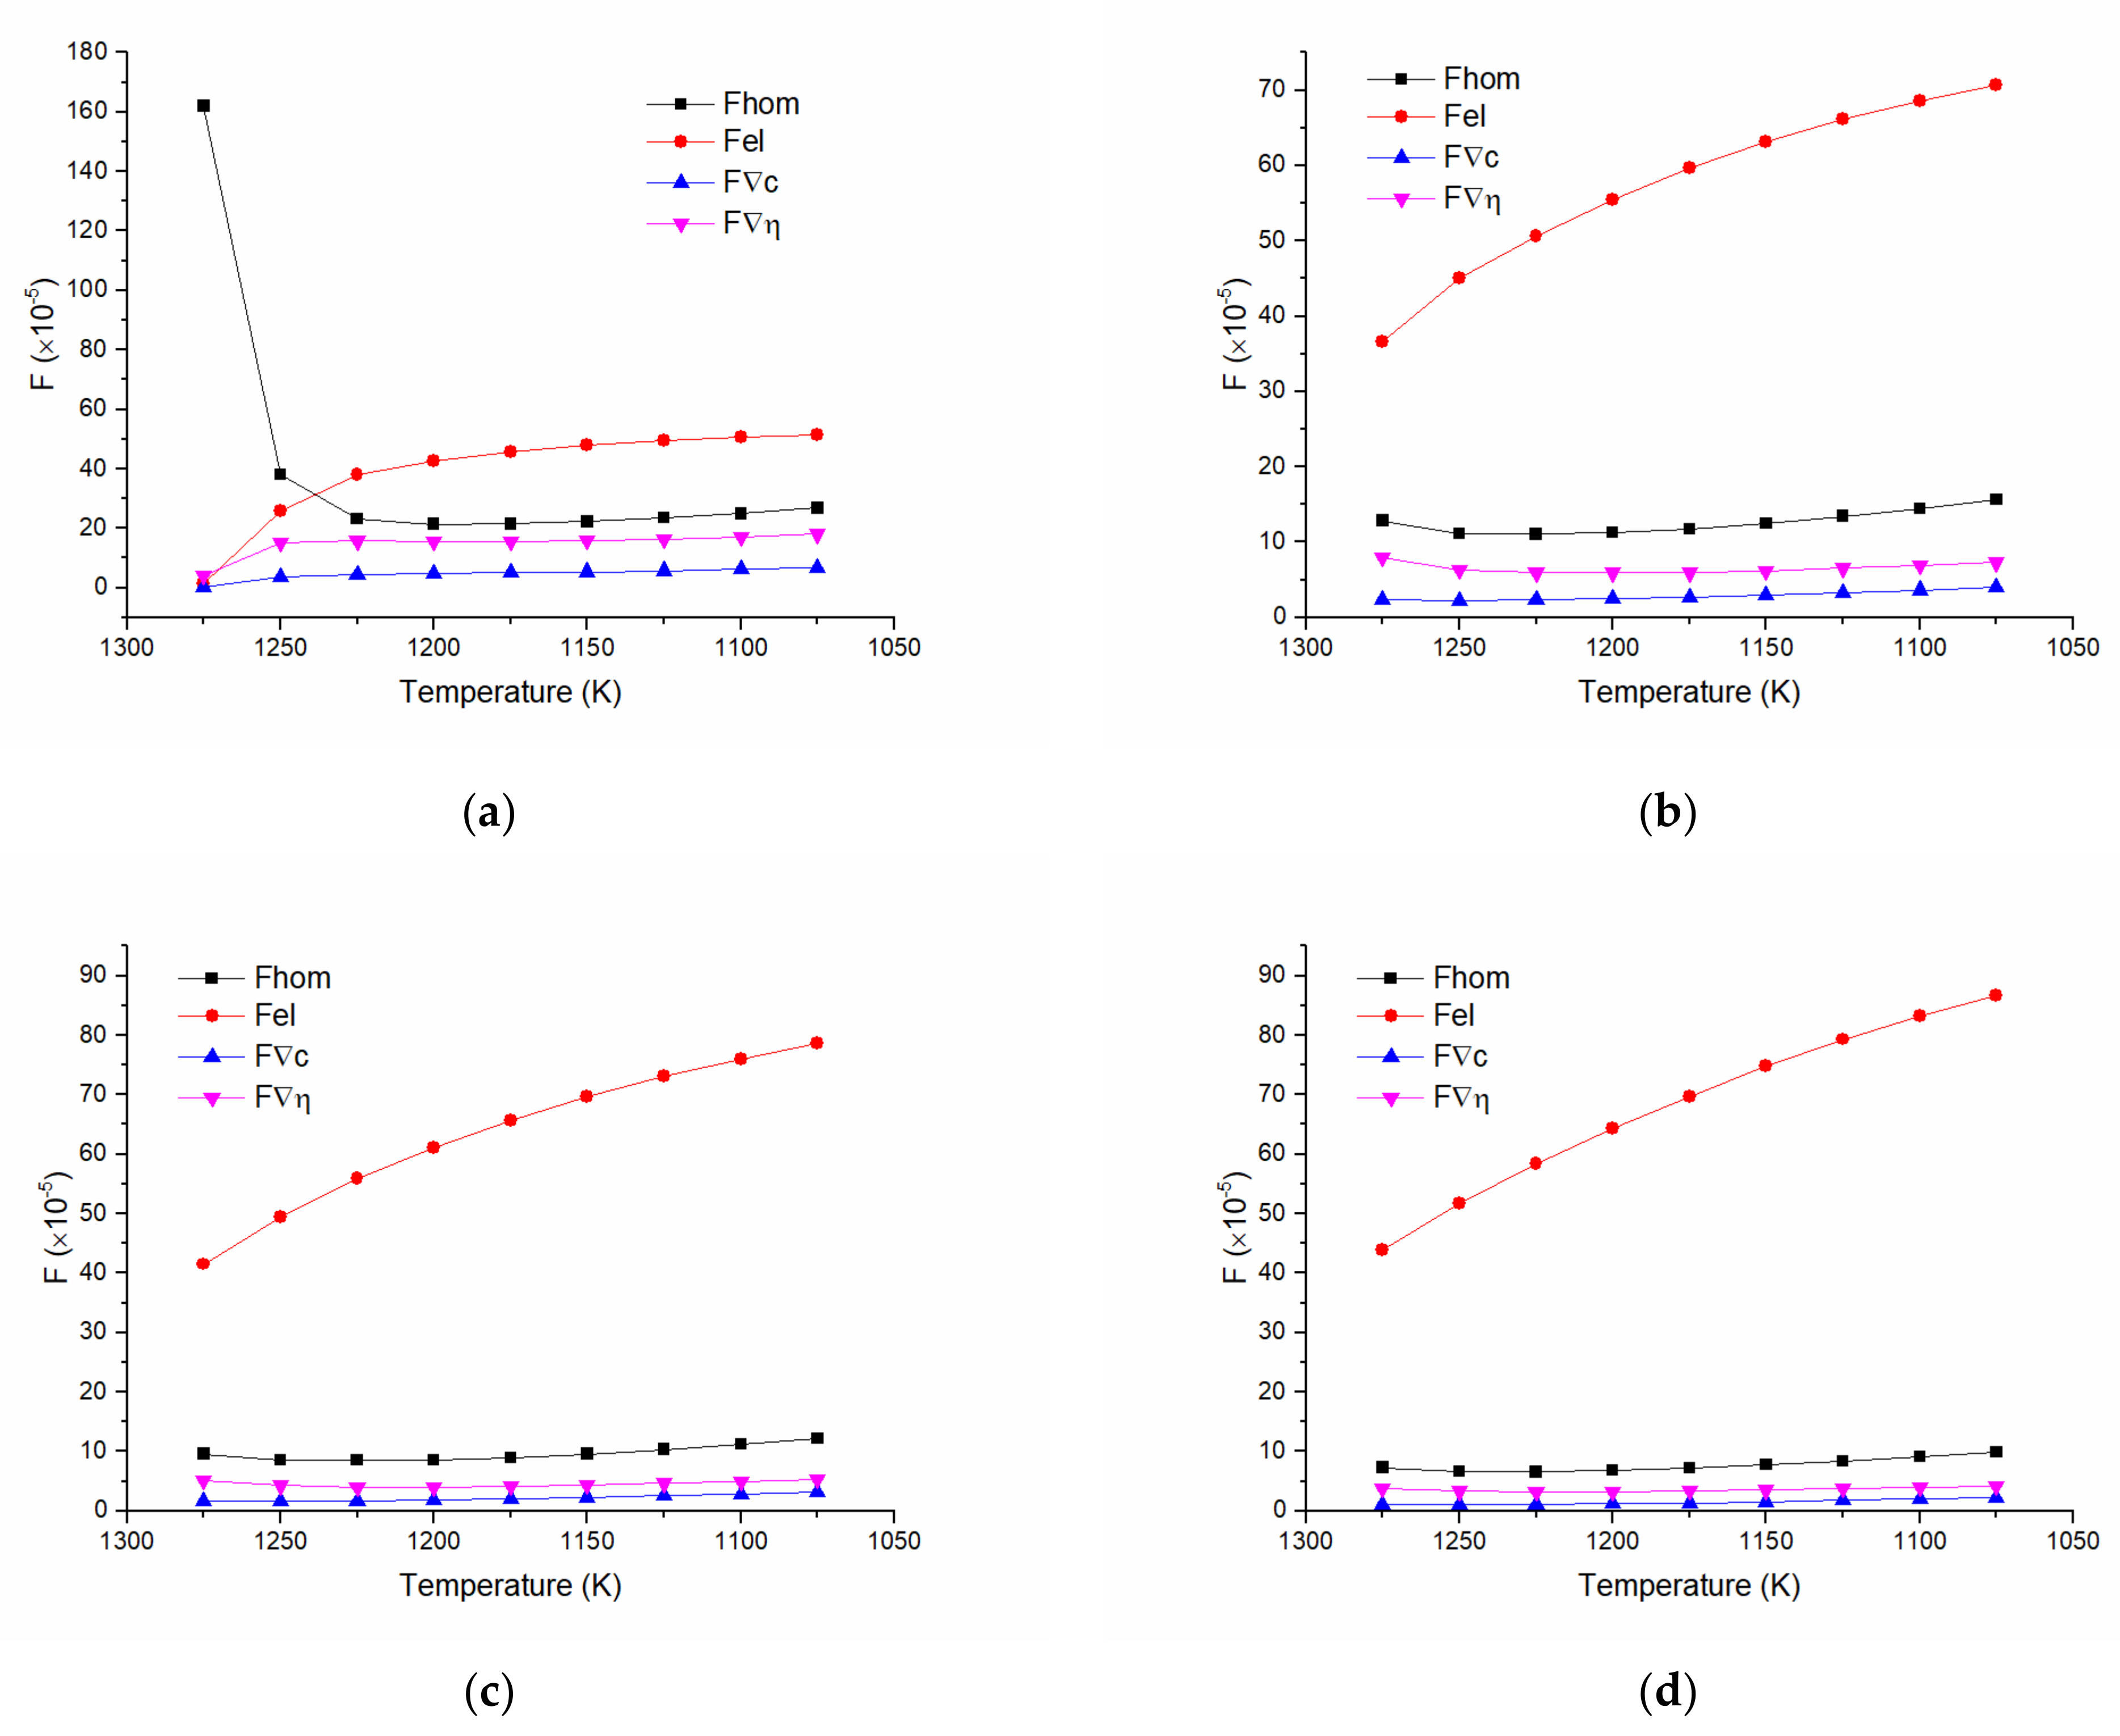
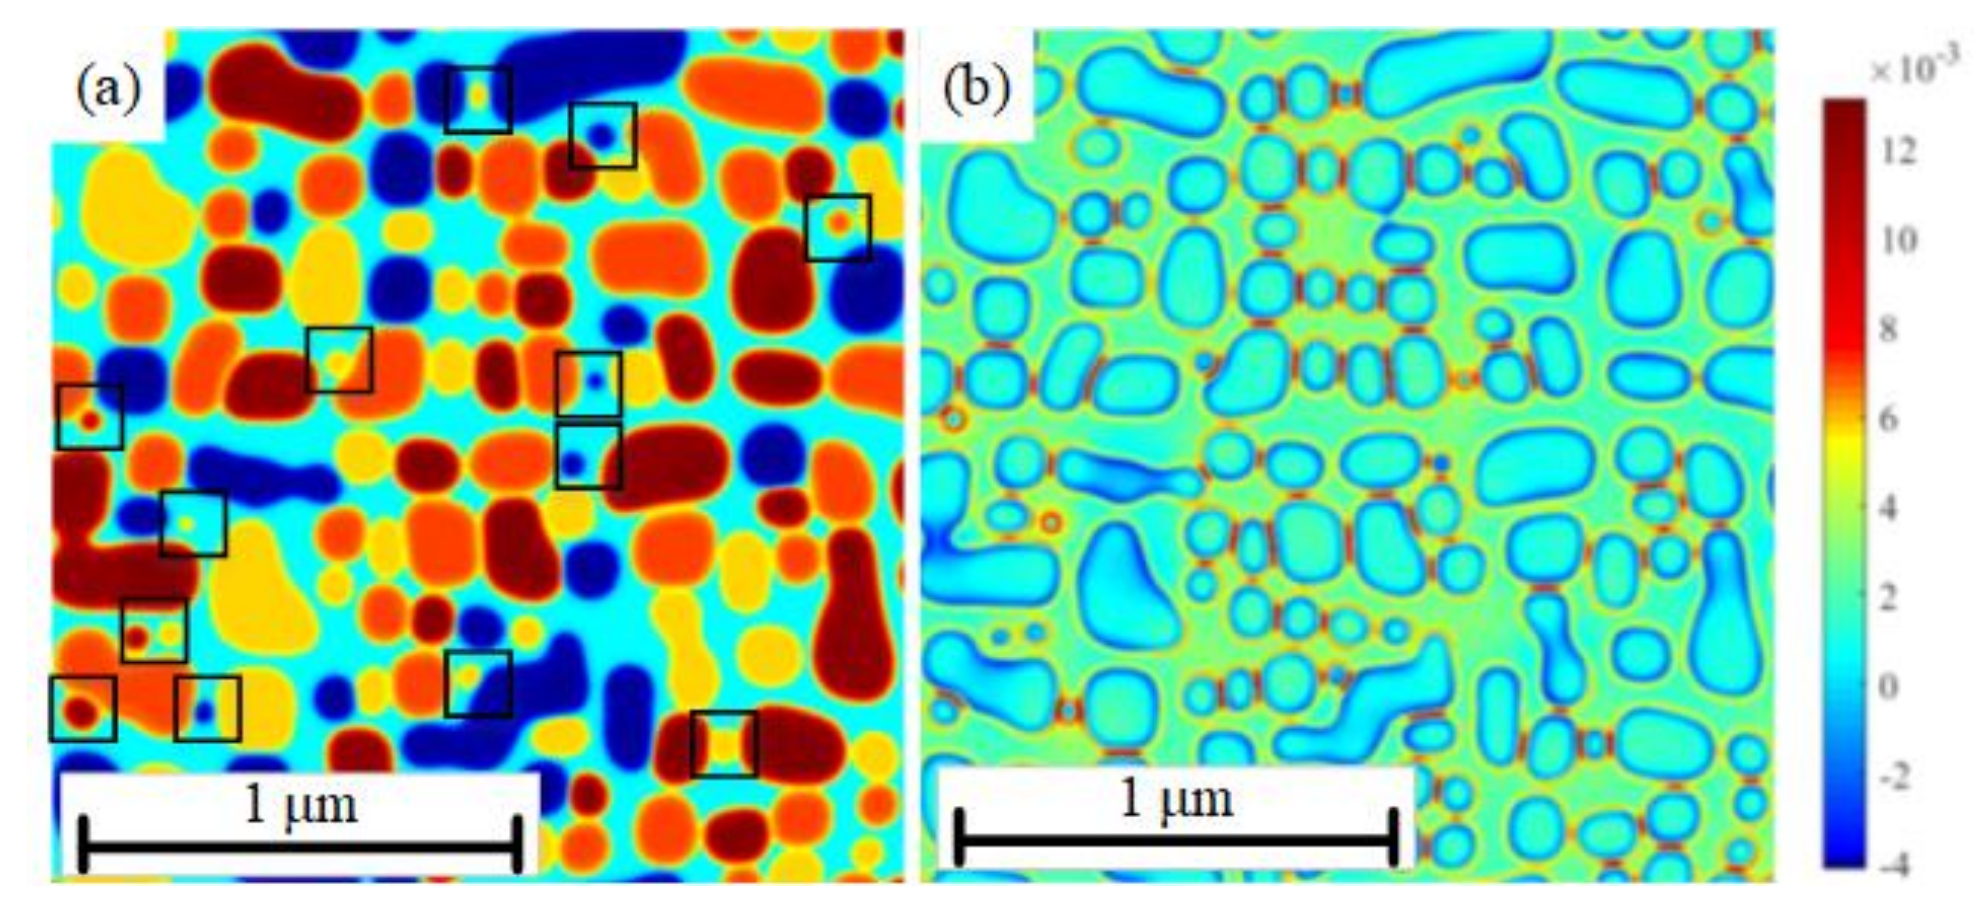
4.2. Effect of Energy Distribution on the Morphology Evolution during Cooling Procedures

Following Figure 6b, it can be found that the temperature range of nucleation is wider than other cooling methods for air cooling. In the process from 1300 K to 1250 K, the increase of the number of precipitates is due to the fact that the supersaturation of the whole field is still large in this temperature range, and the precipitation of precipitates inhibits the growth processes. For other cooling methods, in this temperature range, the growth of precipitates is dominant, small precipitates will gradually disappear, and the number of precipitates will decrease. In Figure 6a, the area fraction increasing rate for air cooling is significantly higher than other cooling methods, which is also because the area fraction increasing in air cooling is mainly caused by continuous nucleation, while the increase of area fraction in other cooling methods is caused by the growth of precipitates.
The energy evolution with temperature is introduced to illustrate the morphology changes in different cooling approaches as shown in Figure 7. It can be found that the change of free energy and elastic energy play the major roles in morphology evolution, and the change of gradient energies has a slight effect. It also can be observed that the homogeneous free energy decreases sharply during the nucleation progress in Figure 7a. And the free energy will be increased slightly during the growth progress. The shape from spherical to cubic is due to the contribution of the elastic energy caused by the lattice misfit in the interface of γ / γ microstructure. As precipitates grow, the part of elastic energy increases and the cubic particles formed. It also can be demonstrated that the surface energy decreases with the decreases of the cooling rate, which is the result of the decrease of the particle numbers. Compared to Figure 5c and Figure 8a, the morphology evolution of γ / γ microstructure from 1200 K to 1073 K with argon cooling procedure can be observed. It can be found that the small particle in the black rectangle boxes will disappear due to higher driven force around the surface and the same type of precipitates could be merged together due to the small energy barrier as shown in Figure 8b. And the anti-phase boundary energy between the different variants is large enough to prevent merging.

4.3. Comparison between the Experiment and Numerical Results

Compared to the experimental and simulation results in Figure 2 and Figure 5, it can be found that the phase field simulation can be used to describe the nucleation and growth process well during the cooling procedure. For the air cooling, the precipitates are almost spherical and homogenous in both experimental and simulation results. The difference of morphologies is that the merging phenomenon of the same variants can be observed in the simulation results, which is mainly because the morphology of the simulation results is presented as order parameters field rather than concentration field. In the process of nitrogen cooling, the particle size begins to change from spherical to cubic; in the process of argon cooling, the cubic degree of particles becomes higher; in the process of furnace cooling, the channel of matrix phase begins to widen. These phenomena can be found in the simulation process and also the experimental SEM figures. All the morphology evolution characteristics are in good agreement with the experimental results. The evolution of the average channel length of matrix and precipitate phase and the area fraction of the precipitates for the four different cooling approaches are demonstrated in Figure 3. It can be clearly seen that as the cooling rate decreases, the average channel lengths of the γ / γ two phases are enlarged. The increasing rate of the average length for the matrix phases is smaller than that for the precipitate phases. The area fraction of the precipitates first increases and then decreases with the decrease of the average cooling rate. All the changing directions are the same between the experimental and simulation cooling procedures. All the changing directions are the same except for the area fraction of the precipitates in the furnace cooling, which is due to the neglect of the diffusion effect of other elements in the simulation model. It also can be observed that the particle numbers decrease and the particle sizes increase with the decrease of the average cooling rate in Figure 4 for both experimental and simulation results. Therefore, the phase field model selected in this paper can well simulate the effect of cooling rate on the evolution of microstructure morphology.

5. Conclusions

In this paper, the effect of cooling rate on the evolution of the microstructure and morphology of nickel-based single crystal superalloys was studied with four different cooling approaches, including air cooling, nitrogen cooling, argon cooling, and high temperature furnace cooling. The phase field model simulation was also introduced to study the characteristic during the evolution with the variable cooling processes. The research found that:
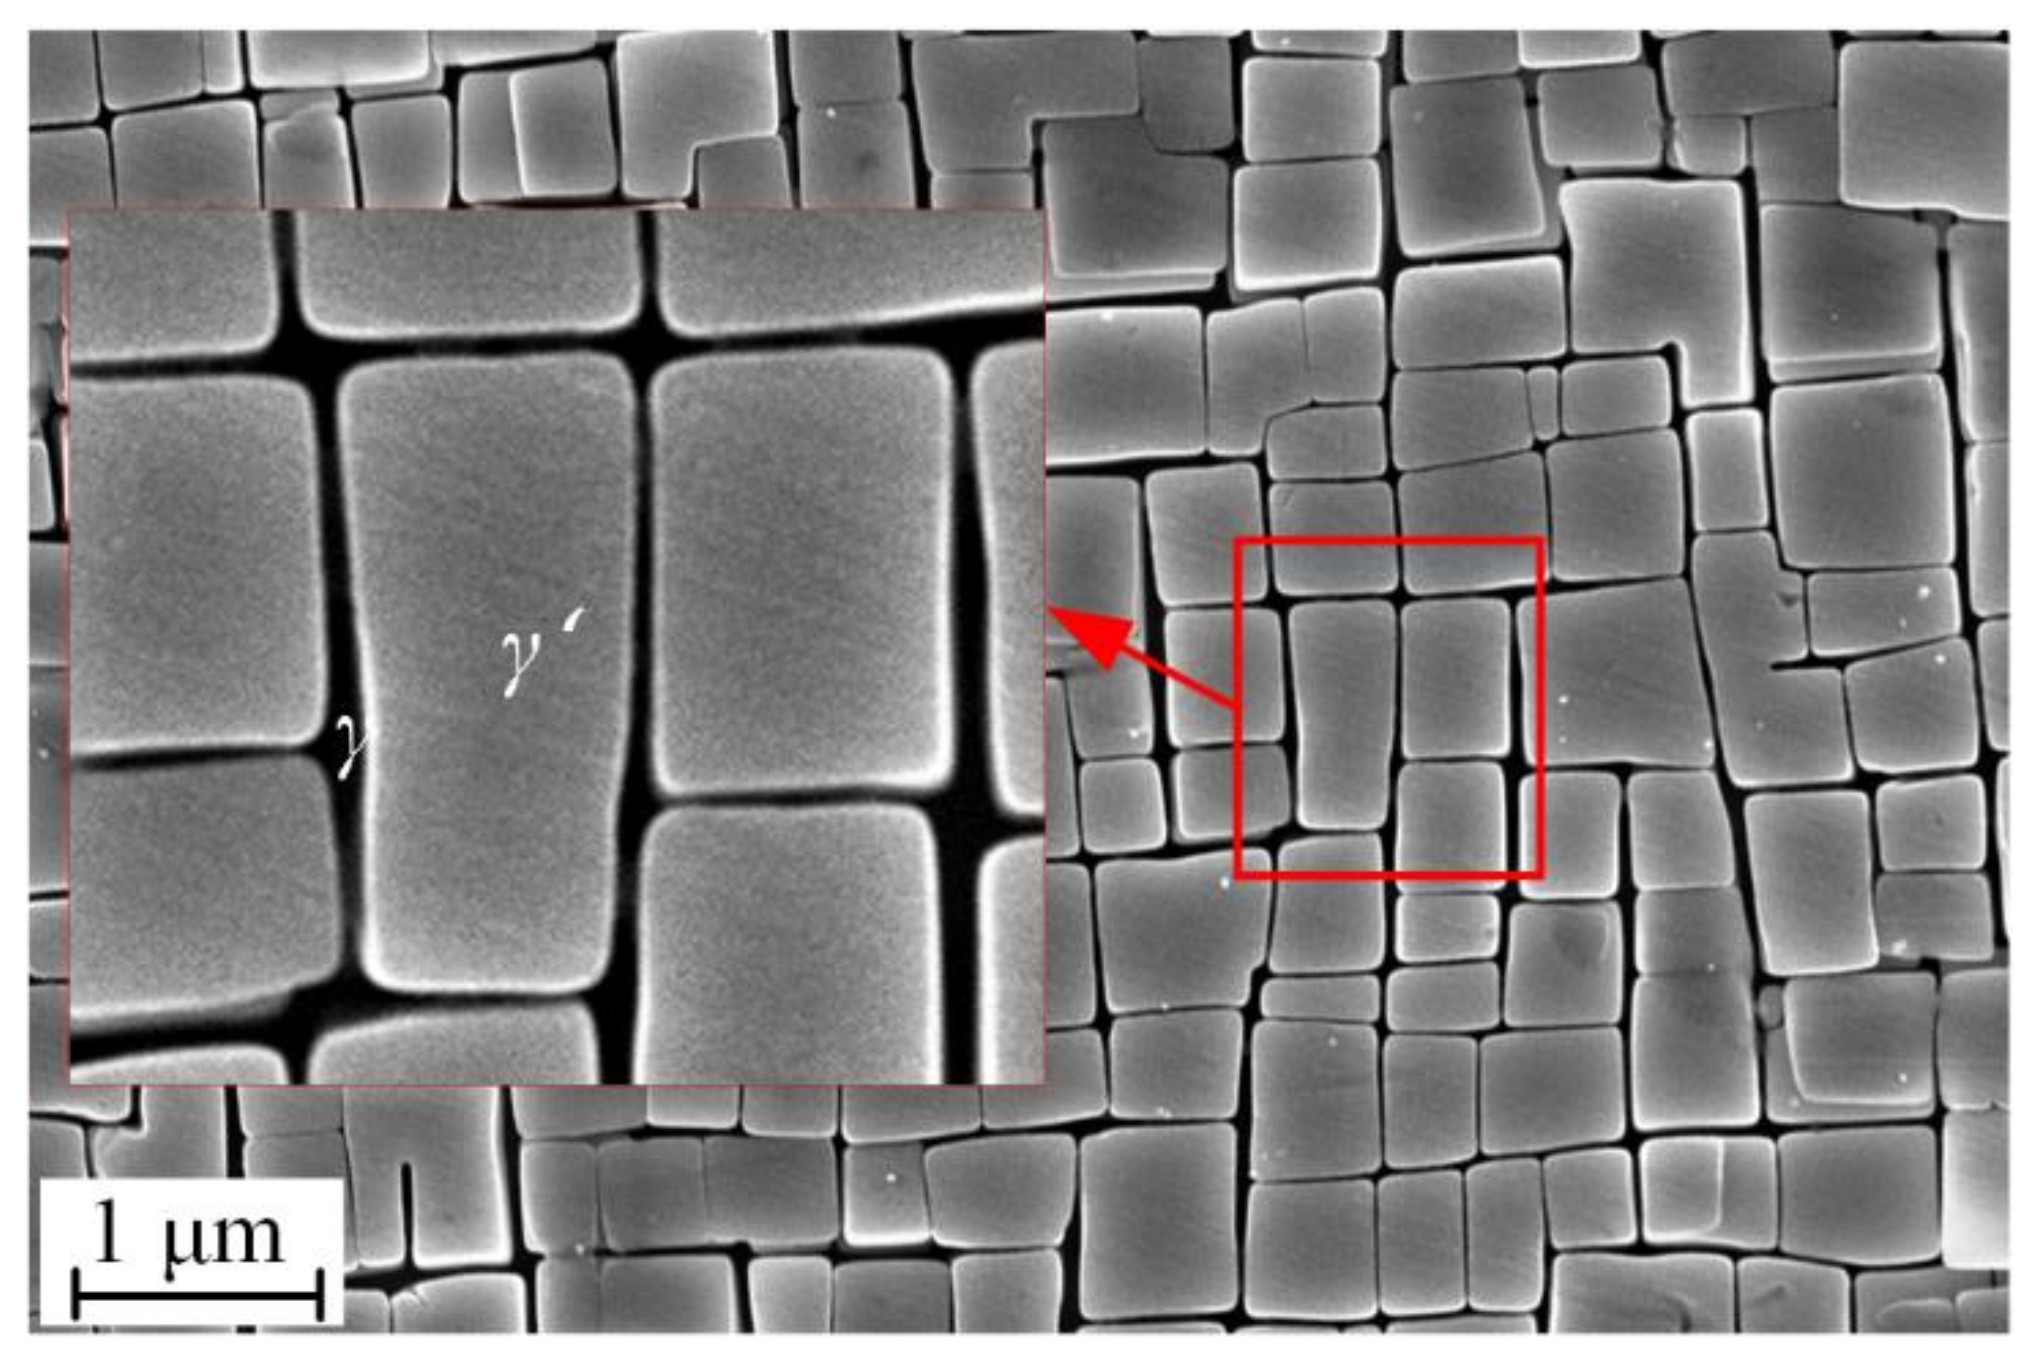
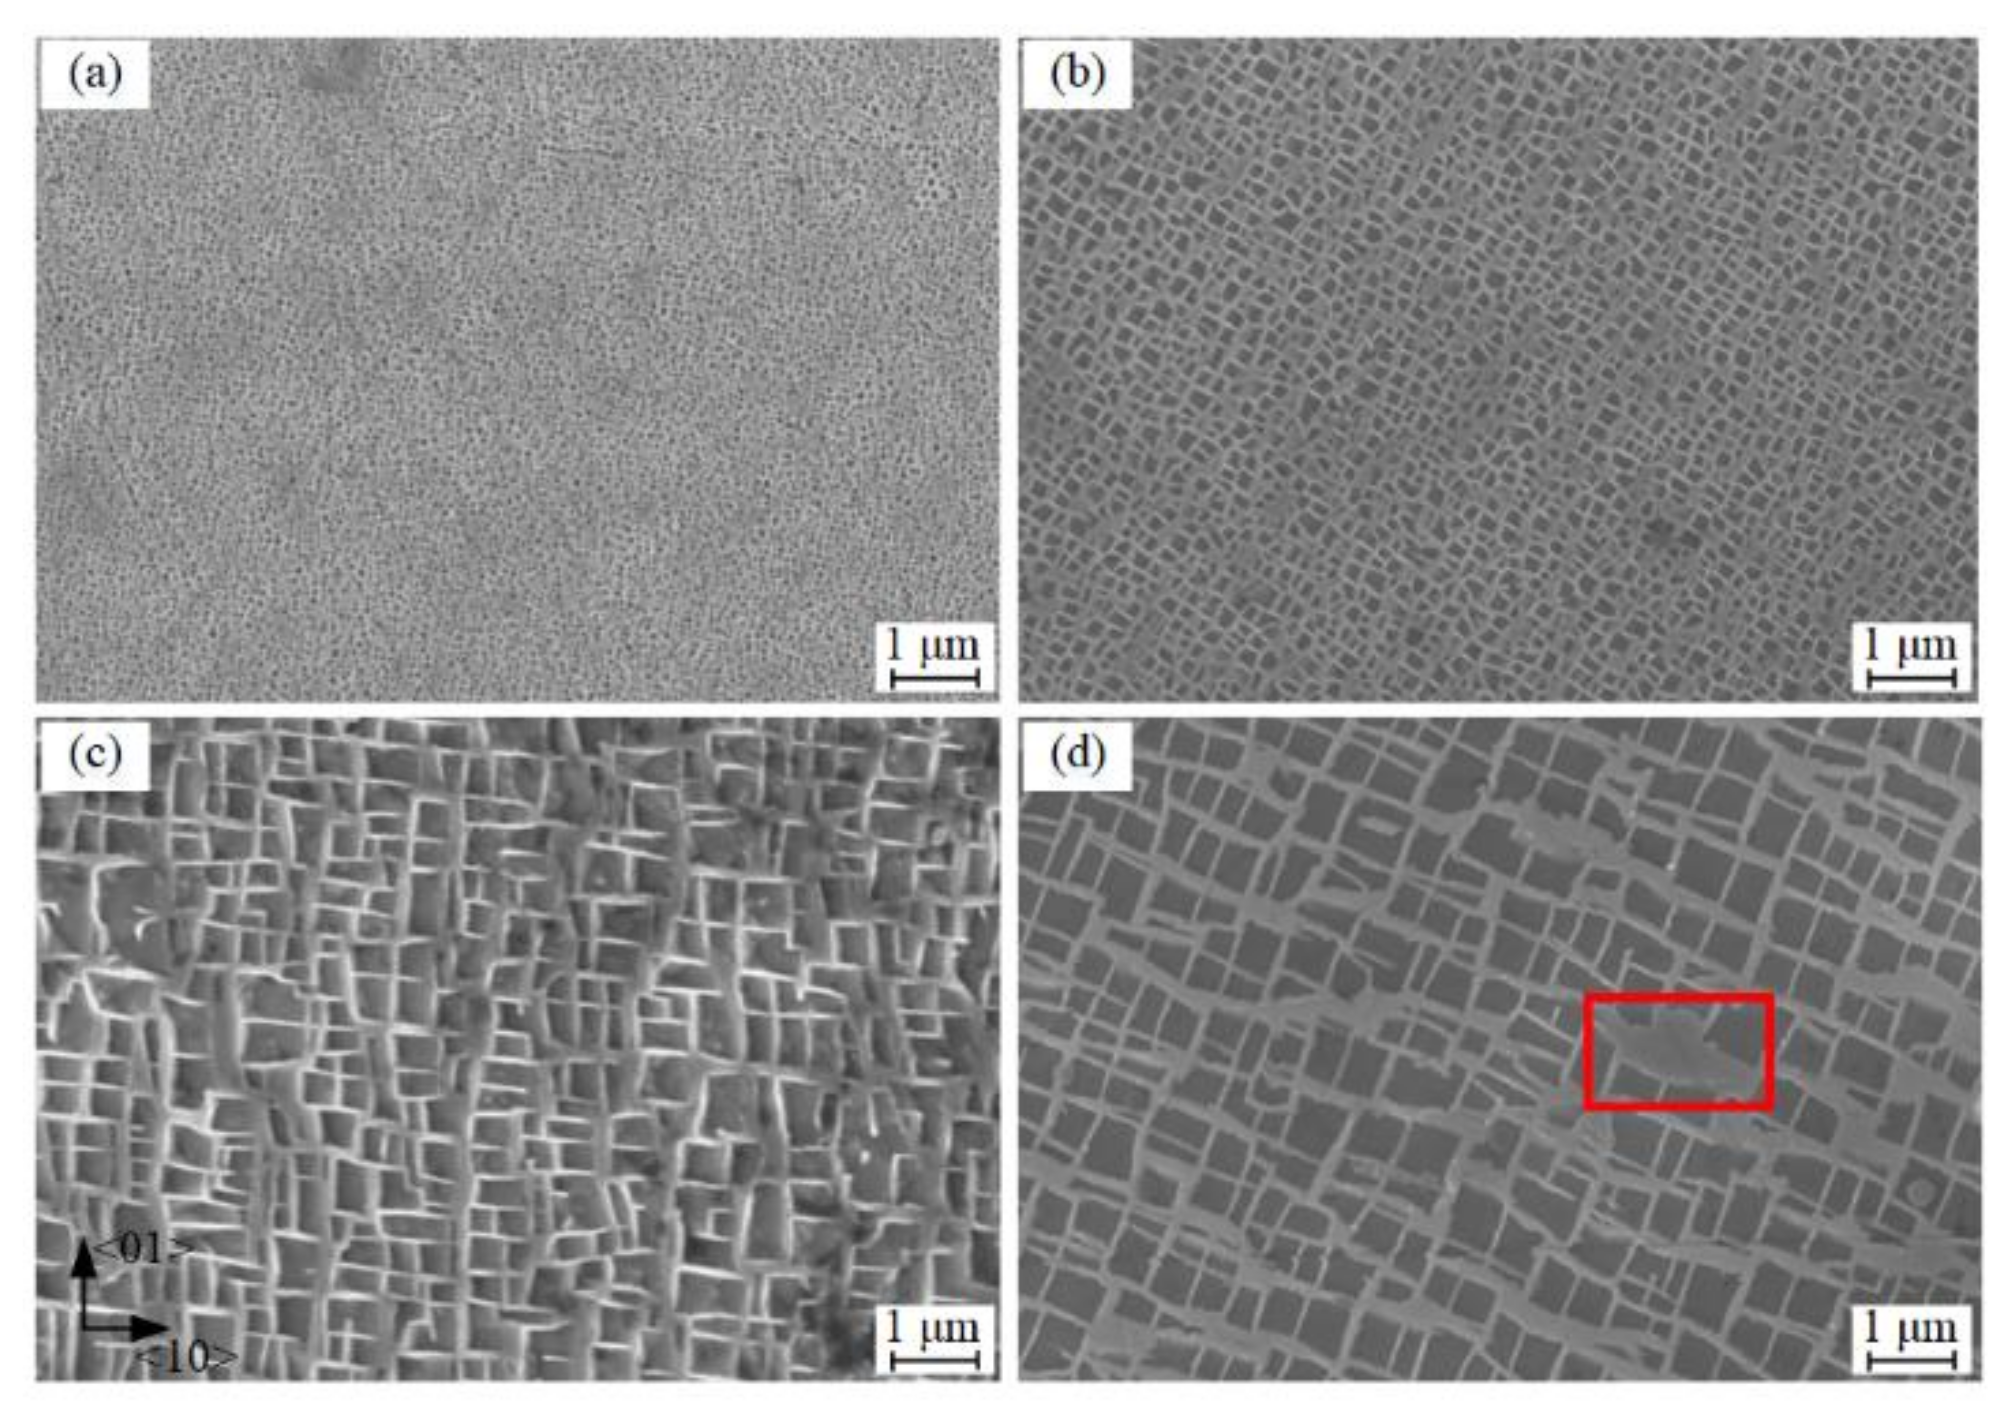
  • The cooling rate has a significant effect on the evolution of the microstructure and morphology of the nickel-based single crystal superalloys. Under the condition of air cooling, the precipitate formed is a uniformly distributed precipitate of small and spherical particles. As the cooling rate decreases, the number of precipitates gradually decreases, and the cubic degree of particulates gradually increases.
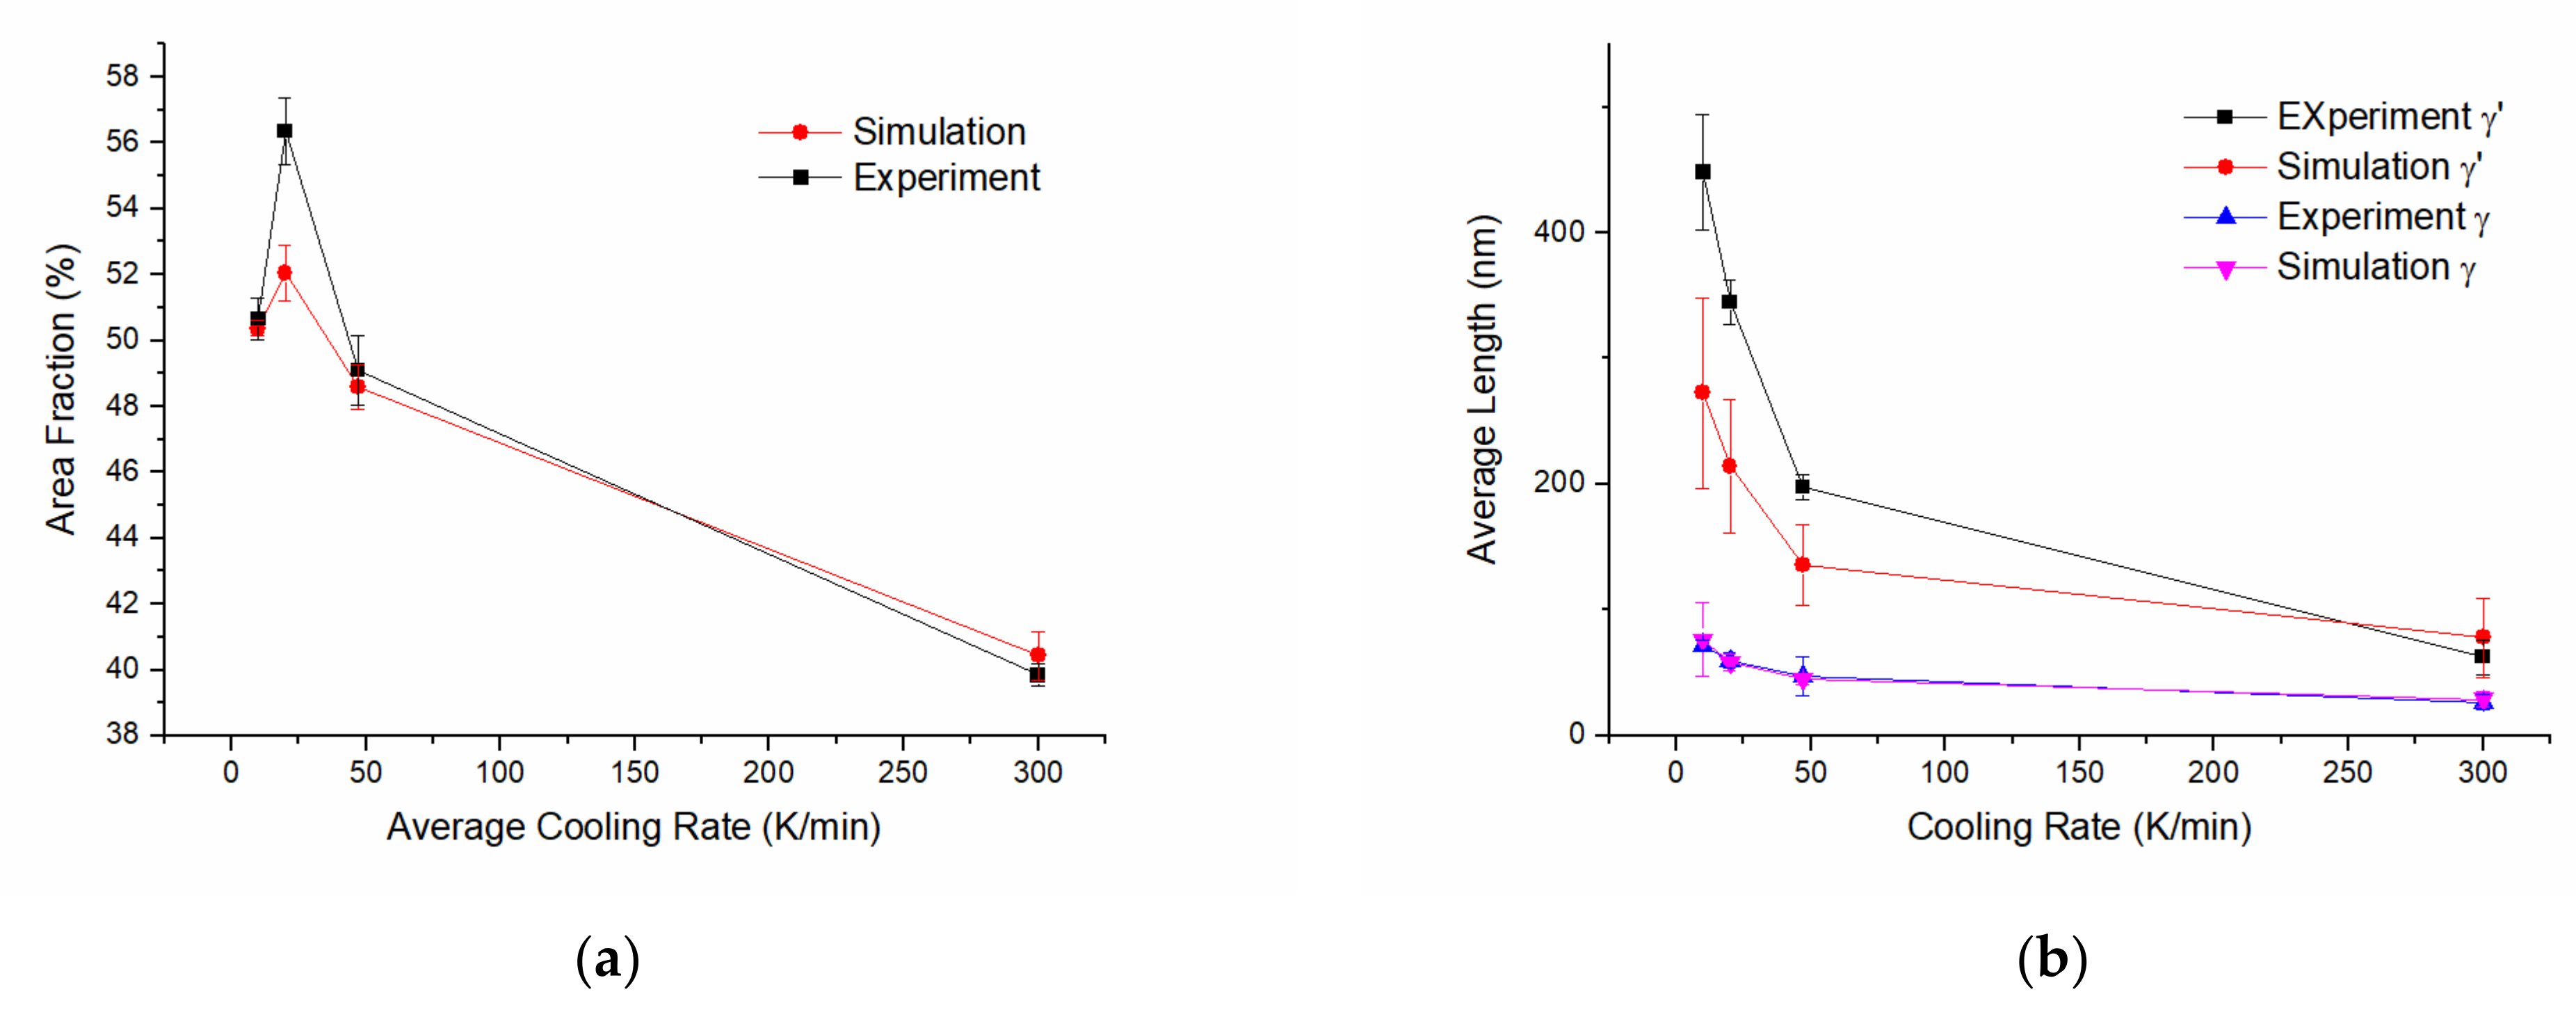
  • By comparing the simulation and experimental results, it is found that the morphological results obtained by the simulation can well correspond to the morphological evolution trend of the microstructure in the experiment. It shows that the numerical model in this paper is effective for simulating the evolution of microstructure morphology with various cooling rates.
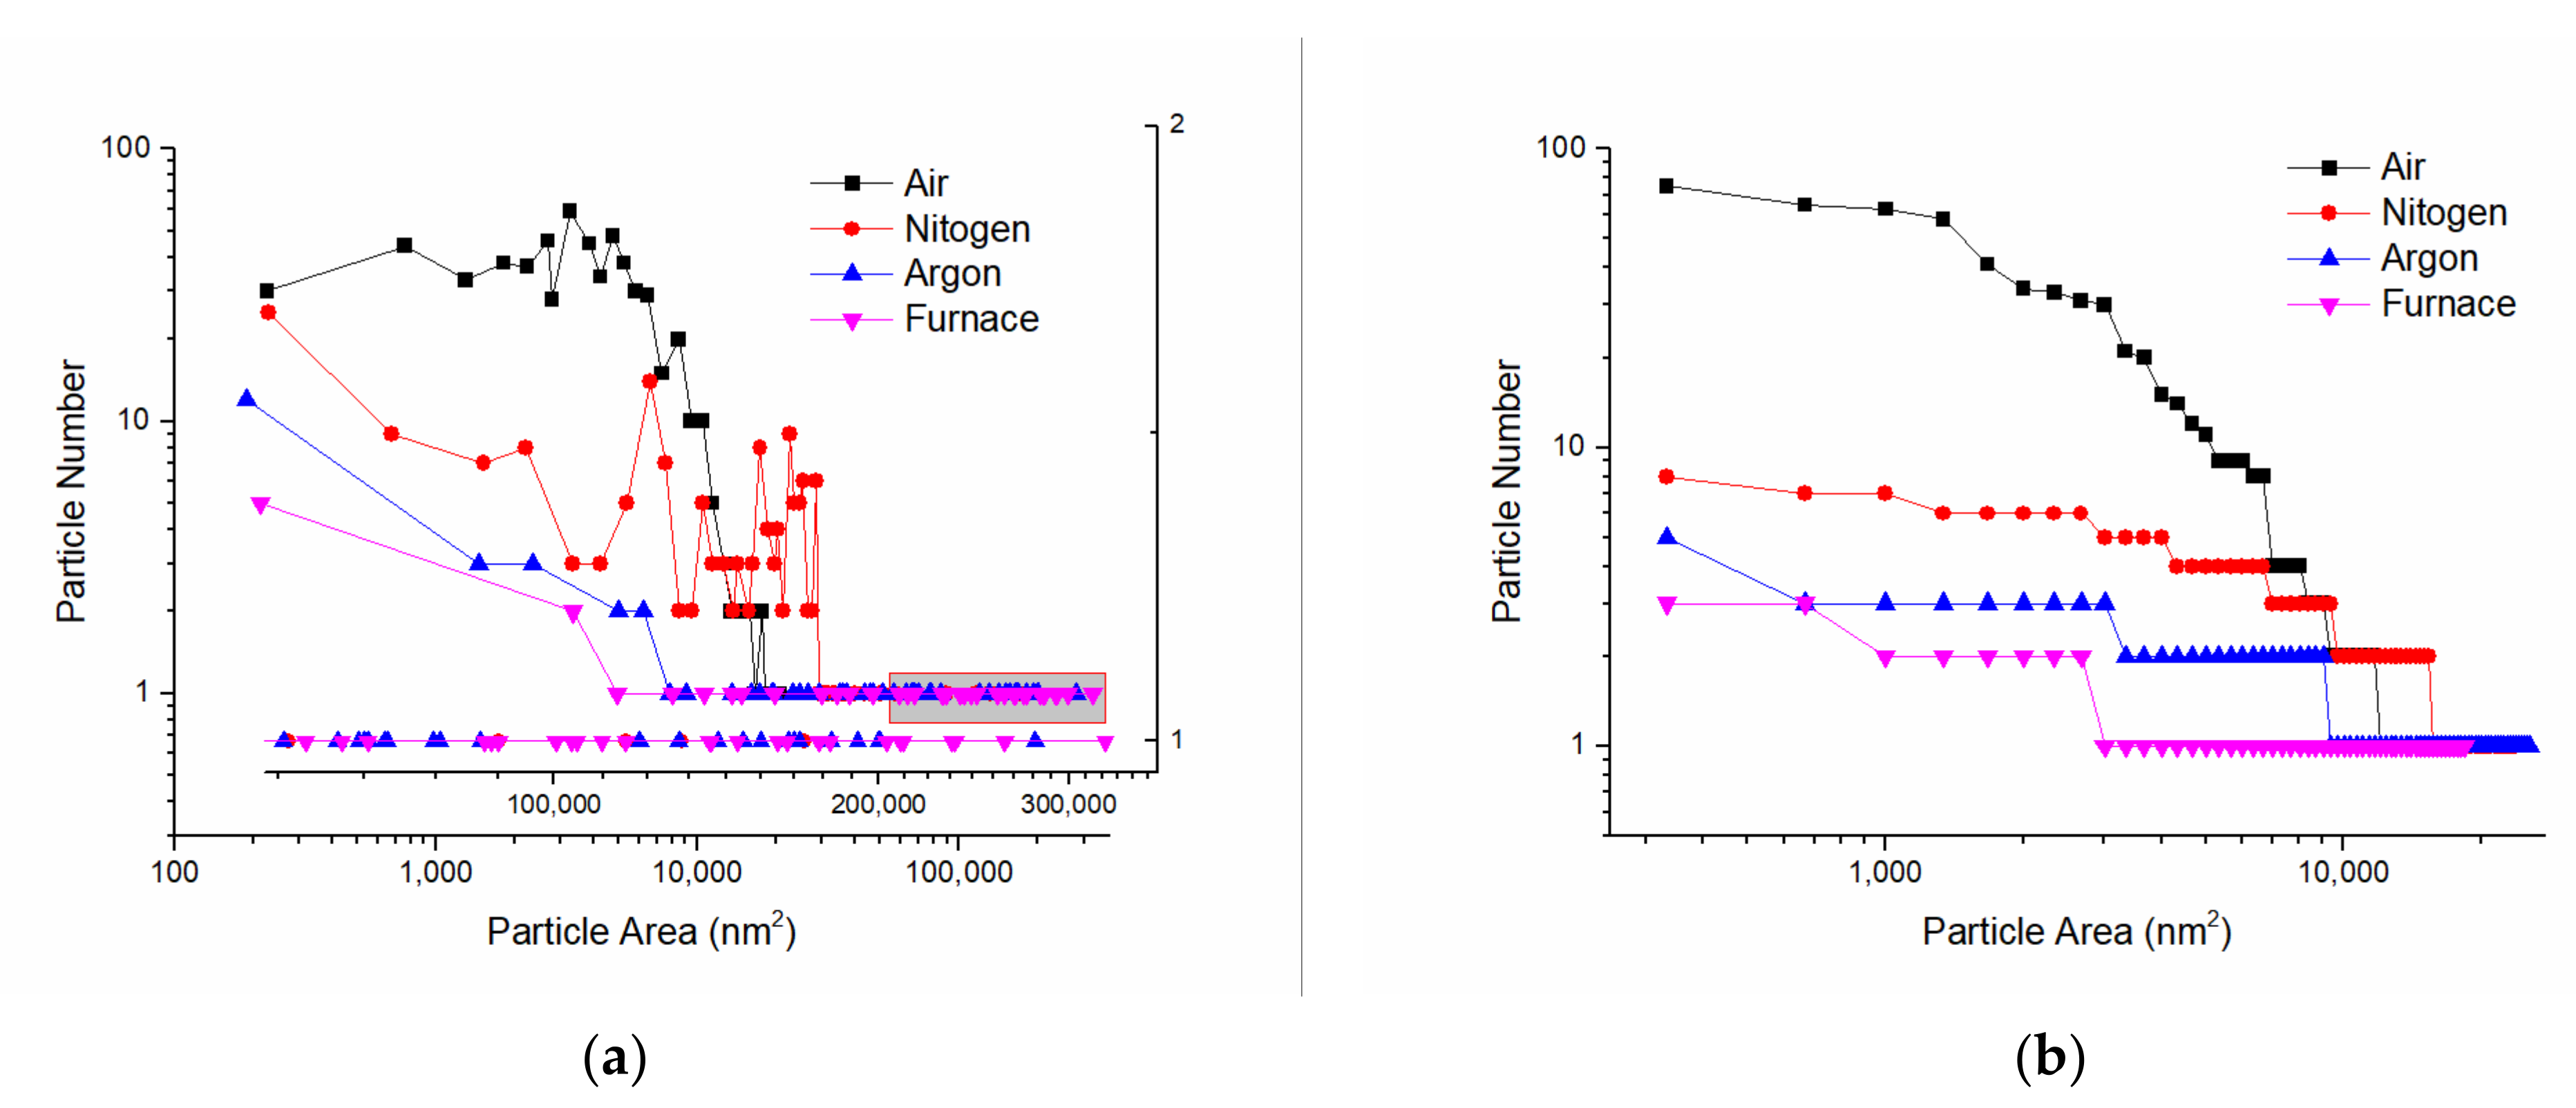
  • As the cooling rate decreases, the size distribution of the precipitates gradually discretized, showing different sizes, which is the result of the evolution of the energy

Author Contributions

Conceptualization, Z.F. and Z.W.; methodology, Z.F.; software, Z.F.; validation, G.L. and Y.Z.; formal analysis, Z.F.; investigation, Z.F.; resources, Z.W.; data curation, Z.F.; writing—original draft preparation, Z.F.; supervision, Z.W.; project administration, Z.W.; funding acquisition, Z.W. All authors have read and agreed to the published version of the manuscript.

Funding

This research was funded by the National Natural Science Foundation of China (NO. 51875462), National Science and Technology Major Project (2017-IV-0003-0040, 2017-V-0003-0052), Natural Science Basic Research Plan in Shanxi Province of China (2020JC-16), Hunan Provincial Natural Science Foundation of China (NO.2019JJ50700), Innovation Foundation of Aero Engine Corporation of China (NO.CXPT-2019-002).

Institutional Review Board Statement

Not applicable.

Informed Consent Statement

Not applicable.

Data Availability Statement

The datasets used or analyzed during the current study are available from the corresponding author on reasonable request.

Acknowledgments

We are grateful for the financial support provided by the National Natural Science Foundation of China (51875462), the Fundamental Research Funds for the Central Universities (3122017027).

Conflicts of Interest

The authors declare no conflict of interest.

References

  1. Reed, R.C. The Superalloys: Fundamentals and Applications; Cambridge University Press: New York, NY, USA, 2006; pp. 46–103. [Google Scholar]
  2. Grosdidier, T.; Hazotte, A.; Simon, A. Precipitation and dissolution processes in γ/γ′ single crystal nickel-based superalloys. Mater. Sci. Eng. A 1998, 256, 183–196. [Google Scholar] [CrossRef]
  3. Xue, Y.; Li, J.; Zhao, J.; Xiong, J. The Precipitation Behavior of γ′ Phase in Single Crystal Ni-Based DD6 Superalloy for Turbine Blade. Mater. Sci. Forum 2017, 898, 534–544. [Google Scholar] [CrossRef]
  4. Zhang, Y.; Wen, Z.; Pei, H.; Li, Z.; Yue, Z. Equivalent method of evaluating mechanical properties of perforated Ni-based single crystal plates using artificial neural networks. Comput. Methods Appl. Mech. Eng. 2020, 360, 112725. [Google Scholar] [CrossRef]
  5. Wen, Z.; Pei, H.; Yang, H.; Wu, Y.; Yue, Z. A combined CP theory and TCD for predicting fatigue lifetime in single-crystal superalloy plates with film cooling holes. Int. J. Fatigue 2018, 111, 243–255. [Google Scholar] [CrossRef]
  6. Shahriari, D.; Sadeghi, M.; Akbarzadeh, A.; Cheraghzadeh, M. The influence of heat treatment and hot deformation conditions on γ′ precipitate dissolution of Nimonic 115 superalloy. Int. J. Adv. Manuf. Technol. 2009, 45, 841. [Google Scholar] [CrossRef]
  7. Babu, S.; Miller, M.; Vitek, J.; David, S. Characterization of the microstructure evolution in a nickel base superalloy during continuous cooling conditions. Acta Mater. 2001, 49, 4149–4160. [Google Scholar] [CrossRef]
  8. Roncery, L.; Galilea, I.; Ruttert, B.; Huth, S.; Theisen, W. Influence of temperature, pressure, and cooling rate during hot isostatic pressing on the microstructure of an SX Ni-base superalloy. Mater. Des. 2016, 97, 544–552. [Google Scholar] [CrossRef]
  9. Masoumi, F.; Shahriari, D.; Jahazi, M.; Cormier, J.; Devaux, A. Kinetics and Mechanisms of γ′ Reprecipitation in a Ni-based Superalloy. Sci. Rep. 2016, 6, 28650. [Google Scholar] [CrossRef] [Green Version]
  10. Singh, A.; Nag, S.; Hwang, J.; Viswanathan, G.; Tiley, J.; Srinivasan, R.; Fraserc, H.; Banerjee, R. Influence of cooling rate on the development of multiple generations of γ′ precipitates in a commercial nickel base superalloy. Mater. Charact. 2011, 62, 878–886. [Google Scholar] [CrossRef]
  11. Sarosi, P.; Wang, B.; Simmons, J.; Wang, Y.; Mills, M. Formation of multimodal size distributions of γ′ in a nickel-base superalloy during interrupted continuous cooling. Scr. Mater. 2007, 57, 767–770. [Google Scholar] [CrossRef]
  12. Wen, Y.; Simmons, J.; Shen, C.; Woodward, C.; Wang, Y. Phase-field modeling of bimodal particle size distributions during continuous cooling. Acta Mater. 2003, 51, 1123–1132. [Google Scholar] [CrossRef]
  13. Yang, M.; Zhang, J.; Wei, H. Influence of cooling rate on the formation of bimodal microstructures in nickel-base superalloys during continuous two-step aging. Comput. Mater. Sci. 2018, 149, 14–20. [Google Scholar] [CrossRef]
  14. Cottura, M.; Le Bouar, Y.; Finel, A.; Appolaire, B.; Ammar, K.; Forest, S. A phase field model incorporating strain gradient viscoplasticity. J. Mech. Phys. Solids 2012, 60, 1243–1256. [Google Scholar] [CrossRef]
  15. Boussinot, G.; Bouar, Y.; Finel, A. Phase-field simulations with inhomogeneous elasticity: Comparison with an atomic-scale method and application to superalloys. Acta Mater. 2010, 58, 4170–4181. [Google Scholar] [CrossRef]
  16. Cottura, M.; Appolaire, B.; Finel, A.; Bouar, Y. Coupling the Phase Field Method for diffusive transformations with dislocation density-based crystal plasticity: Application to Ni-based superalloys. J. Mech. Phys. Solids 2016, 94, 473–489. [Google Scholar] [CrossRef]
  17. Boussinot, G.; Finel, A.; Bouar, Y. Phase-field modeling of bimodal microstructures in nickel-based superalloys. Acta Mater. 2009, 57, 921–931. [Google Scholar] [CrossRef]
  18. Zhao, Y.; Gao, H.; Wen, Z.; Zhang, X.; Yang, Y.; Yue, Z. Combined elastic-plastic energy driving criteria of rafting behavior for nickel-based single crystal superalloys. Mater. Sci. Eng. A 2019, 758, 154–162. [Google Scholar] [CrossRef]
  19. Nash, P. Phase Diagrams of Binary Nickel Alloys; ASM International: Materials Park, OH, USA, 1991; pp. 257–259. [Google Scholar]
  20. Fujiwara, F.; Watanabe, M.; Horita, Z.; Nemoto, N.; Noumi, K.; Simozaki, T. International Conference on Solid-Solid Transformations. In JIMIC-3; Koiwa, M., Otsuka, K., Miyazaki, T., Eds.; Japan Institute of Metals: Kyoto, Japan, 1999. [Google Scholar]
  21. Ardell, A.; Ozolins, V. Trans-interface diffusion-controlled coarsening. Nat. Mater. 2005, 4, 309–316. [Google Scholar] [CrossRef] [PubMed]
  22. Ansara, I.; Dupin, N.; Lukas, H.; Sundman, B. Thermodynamic assessment of the Al-Ni system. J. Alloys Compd. 1997, 247, 20–30. [Google Scholar] [CrossRef]
  23. Chen, L.; Shen, J. Applications of Semi-Implicit Fourier-Spectral Method to Phase Field Equations. Comput. Phys. Commun. 1998, 108, 147–158. [Google Scholar] [CrossRef]
  24. Harikrishnan, R.; Graverend, J. A creep-damage phase-field model: Predicting topological inversion in Ni-based single crystal superalloys. Mater. Des. 2018, 160, 405–416. [Google Scholar] [CrossRef]
  25. Kenneth, C. Nucleation in solids: The induction and steady state effects. Adv. Colloid Interface Sci. 1980, 13, 205–318. [Google Scholar]
Figure 1. The {001} plane γ/γ’ microstructure of single crystal superalloys with standard heat treatment. The grey region is precipitate phases and the black is matrix channel.
Crystals 12 00074 g001
Figure 2. Microstructure of standard heat treatment nickel-based superalloys samples after solution treatment and hold for 4 hours, cooling from super solution temperature (1608 K) to 1073 K continuously in different cooling methods and then air-cooled to environment temperature. (a) Air cooling, (b) Cooling with nitrogen, (c) Cooling with argon, (d) Cooling in a high temperature furnace.
Crystals 12 00074 g002
Figure 3. Statistical characteristics chart of microstructures for experiments and simulations. (a) The precipitates area fractions, (b) The average length of the precipitates and matrix channels.
Crystals 12 00074 g003
Figure 4. Statistical chart of γ’ particle numbers and areas for variable cooling procedures via experimental (a) and simulation (b) approaches.
Crystals 12 00074 g004
Figure 5. Phase field simulated microstructure morphologies for different cooling methods; the four crystallographic variants of the γ’ phase are distinguished by the colors blue, orange, red and yellow. (a) Air cooling, (b) Cooling with nitrogen, (c) Cooling with argon, (d) Cooling in a high temperature furnace. All the simulations are evaluated with the same initial conditions.
Crystals 12 00074 g005
Figure 6. The simulated evolution trend of precipitates area fraction (a) and precipitates number (b) aspect to temperature under different cooling approaches.
Crystals 12 00074 g006
Figure 7. Various dimensionless energy evolution with different cooling approaches. Fhom is homogeneous free energy, Fel is elastic energy, F c and F η are interface energies relate to concentration gradient and orders gradient respectively. (a) Air cooling, (b) Cooling with nitrogen, (c) Cooling with argon, (d) Cooling in a high temperature furnace.
Crystals 12 00074 g007
Figure 8. The microstructure morphology (a) and the deviation of total energy (δF/δc) (b) for argon cooling procedure at 1200 K.
Crystals 12 00074 g008
Table 1. Chemical composition of single crystal superalloys (wt.%).
PhaseAlCrCoNiMoTaWRe
γ’5.184.529.2161.330.797.167.483.09
γ4.645.2110.5760.671.735.318.743.13
Table 2. Values of two-phase stiffness coefficient of anisotropic nickel-based single crystal superalloys.
Phase C 11   ( Gpa ) C 12   ( Gpa ) C 44   ( Gpa )
γ165112114
γ’175117101
Publisher’s Note: MDPI stays neutral with regard to jurisdictional claims in published maps and institutional affiliations.

