1. Introduction
In recent research, the 3595 cm
−1 and 3585 cm
−1 infrared absorption bands were widely used in distinguishing natural and synthetic rock crystal. The IR band at 3595 cm
−1 was assigned to the BOH defect [
1], and was often considered as the diagnostic evidence of natural rock crystal.
The 3585 cm
−1 absorption band is frequently observed in synthetic rock crystal, but not relevant for natural rock crystals [
2]. Only in natural talc was it proven that this band may appear after heating and pressurization at 1.5 Gpa [
3]. Up to now, there has still been some debate on the assignment of this band. Due to its missing correlation to metal impurities, it was accepted as an intrinsic defect. One of the proposed explanations for this band is a hydrogarnet [4H]
Si defect (Si
4+→4H
+) [
4,
5]. However, the polarization of the 3585 cm
−1 band with the strongest absorption parallel to the basal plane, which was described by Chakraborty and Lehmann, and Pankrath and Stünitz et al., did not support this explanation [
6,
7,
8,
9]. The 3585 cm
−1 band was deemed to be caused by structurally bound OH defects inside dislocations, which occurs in dislocations on twin planes of amethyst, citrine, and chalcedony or, probably, as clusters in synthetic crystals [
9,
10,
11,
12]. Jollands et al. suggested that a hydrogarnet defect should lead to four different OH
− stretching bands by density functional theory (DFT) calculations, and the 3585 cm
−1 band should be assigned to isolate OH
− groups with non-local charge compensation rather than the hydrogarnet defect [
13].
However, the authors occasionally found the 3585 cm−1 band in a blue rock crystal sample collected in 2014. Tested by a few peers in different labs, this sample was finally identified as a natural rock crystal treated by Co+ sputter coating technique. Examination under magnification showed that the worn crystal edges were colorless, and several “pin-like” dark blue spots were irregularly distributed on the surface. X-ray fluorescence (XRF) analysis indicated high concentrations of cobalt, suggesting that the blue color was due to radiation stains. In addition, the infrared 3585 cm−1 band of this treated sample surprisingly disappeared when a repeated measurement was performed again in 2020. The above phenomenon led to thinking about the origin and stability of the 3585 cm−1 infrared absorption band of rock crystal.
In this paper, considering that the sputter coating process must be accompanied by the heating process, it is assumed that the absorption band at 3585 cm−1 can be induced by the thermal process of rock crystal. Thus, several natural and synthetic rock crystal samples were heated under different temperature conditions in this study to try to induce the 3585 cm−1 infrared band. Moreover, variations of Fourier transform infrared (FTIR) spectroscopy in the region of X-OH stretching vibrations were investigated to reveal the origin and formation mechanism of the 3585 cm−1 band. In addition, FTIR spectra of natural and synthetic rock crystals were compared to determine the role of the 3585 cm−1 band in separating natural and synthetic rock crystal.
2. Materials and Methods
Two groups of samples purchased from the market were prepared for this study. Group I’s samples include five synthetic rock crystal samples randomly selected from dozens of crystals (SQ-1~SQ-5). Each sample was cut into four sections along the vertical c-axis (SQ-1-a~SQ-1-d), which is 5~10 mm in length and 4~8 mm in thickness (
Figure 1a). Examination under magnification of these samples revealed the typical “breadcrumbs” inclusion and the spike-shaped two-phase (liquid and gas) inclusions (
Figure 1c,d). Group II’s samples consist of 12 natural rock crystal samples (NQ-1~12), which is 30~60 mm in length and 17~30 mm in thickness. These samples are short hexagonal columns and show obvious horizontal stripes on the surface. Because of the numerous secondary fissures in natural crystals, all of Group II’s samples (NQ-1~NQ-12) were first boiled with dilute nitric acid to remove impurities in the fissures, and then washed with pure water and dried.
Heat treatment was conducted in air using the Smart CF-02 ash-blowing furnace jointly developed by Luoyang Tainak High-Temperature Instrument and Equipment Co., Ltd. in Henan province of China and the National Gold and Diamond Testing Center, Jinan City, Shandong province of China. During the heating process, the temperature rise lasted for 3 h, and the temperature was kept constant for 4 h after reaching the set temperature. Finally, the samples were naturally cooled to room temperature. The constant temperatures of Group I’s samples were set to 1073 K (SQ-1-a~SQ-1-d), 773 K (SQ-2-a~SQ-2-d), and 673 K (SQ-3-a~SQ-3-d and SQ-4-a~SQ-4-d), respectively. For comparison, SQ-5-a~SQ-5-d were not heated. Taking into account the limitation of the number of samples, the constant temperatures of the samples of Group II were set to 1073 K (NQ-4~NQ-6) and 673 K (NQ-1~NQ-3), respectively. For contrast, NQ-7 and NQ-10 with great transparency and smooth parallel planes were also not heated.
In National Gold & Diamond Testing Center infrared absorption spectra of both groups of samples, before and after heating, were recorded at room temperature in transmission mode using a Nicolet iZ10 infrared spectrometer (spectral range from 400 to 4000 cm−1 and a resolution of 8 cm−1), by Thermo Fisher Scientific (Waltham, MA, USA). To obtain a high signal-to-noise ratio, multiple scans were collected.
3. Results
IR spectra measurements of both groups of samples were conducted before and after heat treatment. In the mid-infrared spectra, variations of IR bands before and after heating can only be observed in the 3650–3200 cm
−1 region. IR peak locations (cm
−1) and assignments for absorption bands in the 3650~3200 cm
−1 range are presented in
Table 1.
3.1. IR Spectra Characteristics of Synthetic Rock Crystal (Group I) before and after Heat Treatment
IR absorption spectra of synthetic samples (Group I) before heating and after heating at different temperatures are shown in
Figure 2. As shown in
Figure 2a, the absorption bands of synthetic rock crystal before heating are mainly located at 3508 cm
−1, 3482 cm
−1, 3439 cm
−1, 3402 cm
−1, 3380 cm
−1, 3306 cm
−1, and 3195 cm
−1. The most pronounced sharp absorption band at 3482 cm
−1, which is accompanied by two side bands at 3508 cm
−1 and 3402 cm
−1, was assigned as the Li-specific defect and was commonly referred to as LiOH based on H/D exchange experiments and chemical correlations [
1,
13,
14,
15]. Another prominent absorption band occurs at 3380 cm
−1 and is accompanied by two side bands at 3306 cm
−1 and 3439 cm
−1. This triplet has been identified as the OH absorption band by H/D exchange experiments and was assigned as the AlOH defect due to chemical correlations to the Al content [
1,
13,
14,
15]. In Group I’s synthetic samples, the band at 3595 cm
−1 is absent, which has been correlated to boron impurities in the crystal lattice forming by the coupled substitution Si
4+ = B
3+ + H
+ [
1,
13,
16].
Figure 2b reveals that a further absorption band occurs at 3584 cm
−1 in the IR spectra of some samples (3/10) after heating at 673 K. Furthermore, with the occurrence of the absorption band at 3584 cm
−1, the LiOH band at 3402 cm
−1 in these samples disappears.
After heating at 773 K, the band at 3584 cm
−1 can be observed in the IR spectra of all samples. After heating at 1073 K (
Figure 2c), it is more obvious. In addition, as the heating temperature increases, the absorbance of the LiOH band at 3480 cm
−1 is relatively weakened, and the band at 3508 cm
−1 and 3402 cm
−1 gradually disappears. In contrast, the AlOH-related absorption bands at 3427 cm
−1, 3380 cm
−1, and 3310 cm
−1 show comparably high absorbance.
3.2. IR Spectra Characteristics of Natural Rock Crystal (Group II) before and after Heat Treatment
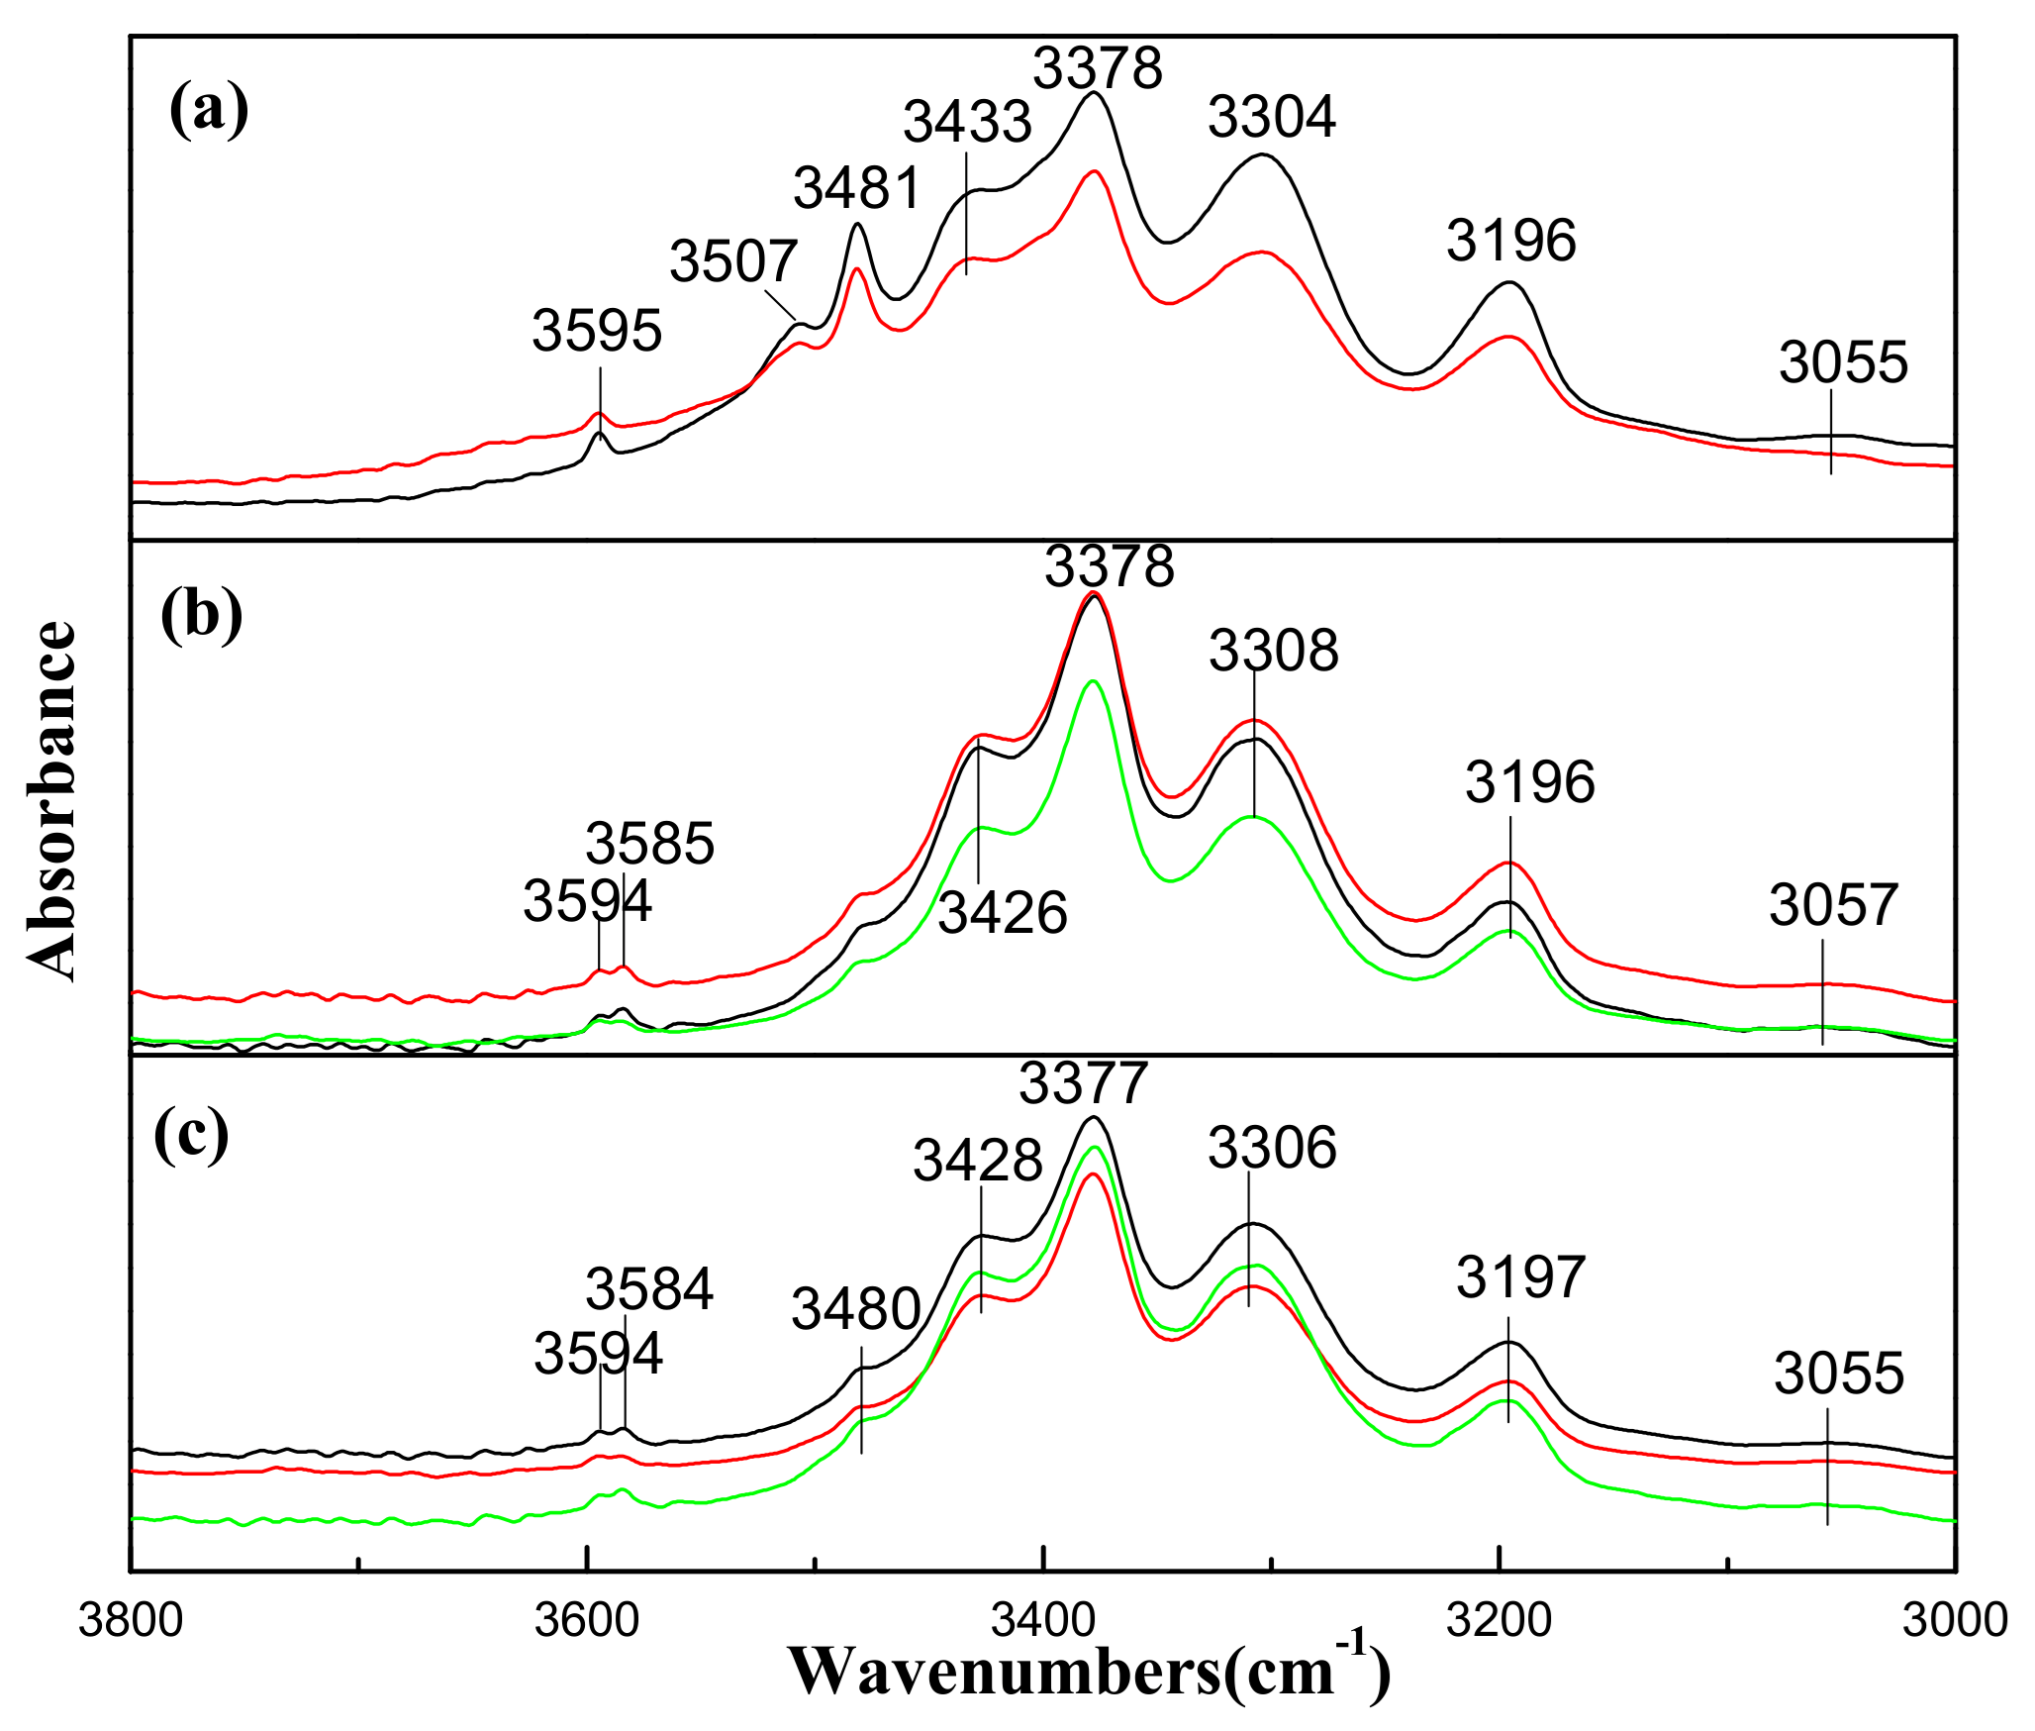
IR absorption spectra of natural samples (Group II) before heating and after heating at different temperatures are shown in
Figure 3. As shown in
Figure 3a, the absorption bands of natural rock crystal before heating are mainly located at 3595 cm
−1, 3507 cm
−1, 3481 cm
−1, 3433 cm
−1, 3378 cm
−1, 3304 cm
−1, 3196 cm
−1. The BOH band at 3595 cm
−1 is obvious in Group II’s natural samples. The AlOH absorption band at 3378 cm
−1 which is accompanied by two side bands at 3304 cm
−1 and 3433 cm
−1 is the dominant absorption feature for Group II’s samples. The Li-specific OH bands at 3507 cm
−1 and 3481 cm
−1 show comparably low absorbance.
After heating at 673 K, the infrared spectra of Group II’s natural samples show an obvious absorption band at 3585 cm
−1 (
Figure 3b), which displays relatively higher absorbance than the 3595 cm
−1 band.
After heating at 1073 K, the absorption bands at 3584 cm−1 and 3595 cm−1 still exist, and the former is relatively stronger. In addition, as the heating temperature increases, the LiOH band at 3480 cm−1 is significantly weakened with the full width at half maximum (FWHM) increases, and finally degenerates into shoulder absorption instead of the sharp absorption band before heating. Moreover, the 3507 cm−1 band disappears after heating.
4. Discussion
By comparing the IR spectra of natural and synthetic rock crystal samples before and after heat treatment, it is clearly found that the thermal process induces the 3585 cm−1 absorption band. Before heating, the 3585 cm−1 band was not detected in both groups of samples, while an atypical 3595 cm−1 absorption band can be observed in the natural samples (Group II). After heating at 673 K and returning to room temperature, all Group II samples showed an absorption band at 3585 cm−1, while only some synthetic samples (Group I) showed this band, which was accompanied by an obvious LiOH bands decrease. Moreover, those synthetic samples in which the 3585 cm−1 band was detected were found to come from the roots of the crystal columns. A reasonable explanation is that unsatisfactory growth conditions at the initial stage of crystal growth lead to more lattice defects. After heating at 1073 K and returning to room temperature, the band at 3585 cm−1 was visible in both groups of samples.
The above results suggest that the thermal process can induce an IR absorption band at 3585 cm−1 in the rock crystal, and the more the lattice defects, the lower the temperature required. As for the blue rock crystal mentioned above, which was treated by Co+ sputter coating technique, a preferred speculation for its 3585 cm−1 band is that the thermal process during the sputter coating process induced the occurrence of the IR absorption band at 3585 cm−1.
The 3585 cm
−1 band is frequently observed in synthetic colorless rock crystal. As for its cause, a more reliable explanation is structurally bound OH defects inside dislocations, rather than the hydrogarnet defect (Si
4+→4H
+) since the 3585 cm
−1 band is polarized [
6,
7,
8,
9]. In the study by Stünitz et al. [
9], the assignment of the structurally bound OH defect was supported. In addition, the 3585 cm
−1 band was mainly present in deformed parts of the samples, and the intensity of this band increased with an increasing degree of local deformation. Thus, this band appears to be associated with dislocations. Jollands et al. revealed that this band is caused by isolated OH groups with non-local charge compensation based on the DFT calculations, but the charge balance cannot be identified [
13].
In this study, it is obvious that the LiOH bands gradually decrease upon heat treatment while AlOH increases, which is a consequence of the low thermal stability of LiOH and the formation of AlLi defects (Si
4+→fAl
3+ + Li
+) [
1,
16,
21,
22]. The increase of AlOH bands may indicate an increasing degree of local deformation [
9]. Therefore, it can be further speculated that the thermal process destroyed the LiOH defects, leading to the formation of a new AlLi defect. In addition, the thermal process possibly increases the local strain of some regions and generates dislocations. The previous OH groups may be left behind in the lattice after the dislocations have slipped through those regions [
9]. These OH groups without an ensured charge compensation at the defect scale meet the structure of the OH
− defect proposed by Jollands et al. [
13], leading to the 3585 cm
−1 IR absorption band.
5. Conclusions
The infrared spectra of natural and synthetic rock crystals before and after heating demonstrate that the thermal process can induce an IR absorption band at 3585 cm−1. The more lattice defects, the lower the temperature required. The induced temperature of natural rock crystal is lower than 673 K. Therefore, the IR band at 3585 cm−1 cannot be used as diagnostic evidence for synthetic rock crystal alone.
The correlation between the AlOH band, LiOH band, and the 3585 cm−1 band suggests that the thermal process destroyed the LiOH defects, leading to the formation of a new AlLi defect. And the isolated OH− defect inside dislocations generated upon thermal process is considered to be the exact cause of the 3585 cm−1 band.
Author Contributions
Conceptualization, J.L.; Data curation, Y.W.; Formal analysis, Y.Z. and X.Y.; Funding acquisition, J.L.; Investigation, J.L., Y.Z., X.L. and G.L.; Methodology, J.L. and X.Y.; Resources, H.L. (Hejun Li), H.L. (Haibin Liu), G.S., T.L., X.D., X.Z., Z.H., R.D., M.T., F.Y. and B.S.; Supervision, X.Y.; Validation, H.L. (Hejun Li), G.S., T.L., X.D., X.Z., Z.H., R.D., M.T., F.Y. and B.S.; Writing—original draft, J.L. and Y.Z.; Writing—review, X.Y. All authors have read and agreed to the published version of the manuscript.
Funding
This research was funded by National Standard Project of China grant number [20205111-T-334].
Institutional Review Board Statement
Not applicable.
Informed Consent Statement
Not applicable.
Conflicts of Interest
The authors declare no conflict of interest.
References
- Stalder, R. OH point defects in quartz–a review. Eur. J. Mineral. 2021, 33, 145–163. [Google Scholar] [CrossRef]
- Stalder, R. OH-defect content in detrital quartz grains as an archive for crystallization conditions. Sediment. Geol. 2014, 307, 1–6. [Google Scholar] [CrossRef]
- Kekulawala, K.R.S.S.; Paterson, M.S.; Boland, J.N. An Experimental Study of the Role of Water in Quartz Deformation. In Mechanical Behavior Crustal Rocks: The Handin Volume; Carter, N.L., Friedman, M., Logan J.M., D.W., Stearns, D.W., Eds.; AGU Publication: Washington, DC, USA, 1981; Volume 24, pp. 49–60. [Google Scholar] [CrossRef]
- Aines, R.D.; Kirby, S.H.; Rossman, G.R. Hydrogen speciation in synthetic quartz. Phys. Chem. Miner. 1984, 11, 204–212. [Google Scholar] [CrossRef]
- Stalder, R.; Konzett, J. OH-defects in quartz in the system quartz–albite–water and granite–water between 5 and 25 kbar. Phys. Chem. Miner. 2012, 39, 817–827. [Google Scholar] [CrossRef]
- Chakraborty, D.; Lehmann, G. Distribution of OH in synthetic and natural quartz crystals. J. Solid State Chem. 1976, 17, 305–311. [Google Scholar] [CrossRef]
- Chakraborty, D.; Lehmann, G. On the structures and orientations of hydrogen defects in natural and synthetic quartz crystals. Phys. Status Solid 1976, 34, 467–474. [Google Scholar] [CrossRef]
- Pankrath, R. Polarized IR spectra of synthetic smoky quartz. Phys. Chem. Miner. 1991, 17, 681–689. [Google Scholar] [CrossRef]
- Stünitz, H.; Thust, A.; Heilbronner, R.; Behrens, H.; Kilian, R.; Tarantola, A.; Fitz Gerald, J.D. Water redistribution in experimentally deformed natural milky quartz single crystals-Implications for H2O-weakening processes. J. Geophys. Res. Solid Earth 2017, 122, 866–894. [Google Scholar] [CrossRef] [Green Version]
- Frondel, C. Structural hydroxyl in chalcedony (type B quartz). Am. Mineral. 1982, 67, 1248–1257. [Google Scholar]
- McLaren, A.C.; Cook, R.F.; Hyde, S.T.; Tobin, R.C. The mechanisms of the formation and growth of water bubbles and associateddislocation loops in synthetic quartz. Phys. Chem. Miner. 1983, 9, 79–94. [Google Scholar] [CrossRef]
- McLaren, A.C.; Gerald, J.D.F.; Gerretsen, J. Dislocation nucleation and multiplication in synthetic quartz: Relevance to waterweakening. Phys. Chem. Miner. 1989, 16, 465–482. [Google Scholar] [CrossRef]
- Jollands, M.C.; Blanchard, M.; Balan, E. Structure and theoretical infrared spectra of OH defects in quartz. Eur. J. Mineral. 2020, 32, 311–323. [Google Scholar] [CrossRef]
- Kats, A. Hydrogen in alpha quartz. Philips Res. Rep. 1962, 17, 133–279. [Google Scholar]
- Aines, R.D.; Rossman, G.R. Water in minerals? A peak in the infrared. J. Geophys. Res. 1984, 89, 4059–4071. [Google Scholar] [CrossRef]
- Müller, A.; Koch-Müller, M. Hydrogen speciation and trace element contents of igneous, hydrothermal and metamorphic quartz from Norway. Mineral. Mag. 2009, 73, 569–583. [Google Scholar] [CrossRef]
- Li, J.J.; Liu, X.W.; Wang, Y.; Fan, C.X.; Ye, H.; Cheng, Y.F.; Liu, D.Z. Infrared spectral features of Sio2 with different crystallinity and their implications. Infrared 2010, 31, 31–35. [Google Scholar]
- Ng-Pooresatien, N. Synthetic rock crystal quartz bangle with unusual inclusions. GEMS Gemol. 2015, 51, 439–440. [Google Scholar]
- Biró, T.; Kovács, I.J.; Király, E.; Falus, G.; Karátson, D.; Bendö, Z.; Fancsik, T.; Sándorné, J.K. Concentration of hydroxyl defects in quartz from various rhyolitic ignimbrite horizons: Results from unpolarized micro-FTIR analyses on unorientedphenocryst fragments. Eur. J. Mineral. 2016, 28, 313–327. [Google Scholar] [CrossRef]
- Cao, P.; Yu, L.; Zu, E.D. Study on near infrared spectrum of natural crystals and synthetic crystals by hydrothemal method. J. Light Scatt. 2017, 29, 177–180. [Google Scholar]
- Miyoshi, N.; Yamaguci, Y.; Maino, K. Successive zoning of Al and H in hydrothermal vein quartz. Am. Mineral. 2005, 90, 310–315. [Google Scholar] [CrossRef]
- Stalder, R.; Potrafke, A.; Billström, K.; Skogby, H.; Meinhold, G.; Gögele, C.; Berberich, T. OH defects in quartz as monitor for igneous, metamorphic and sedimentary processes. Am. Mineral. 2017, 102, 1832–1842. [Google Scholar] [CrossRef]
| Publisher’s Note: MDPI stays neutral with regard to jurisdictional claims in published maps and institutional affiliations. |
© 2021 by the authors. Licensee MDPI, Basel, Switzerland. This article is an open access article distributed under the terms and conditions of the Creative Commons Attribution (CC BY) license (https://creativecommons.org/licenses/by/4.0/).


 ,
, 


