Article

Control of Crystallographic Texture and Mechanical Properties of Hastelloy-X via Laser Powder Bed Fusion

1
Division of Materials and Manufacturing Science, Graduate School of Engineering, Osaka University, 2-1, Yamadaoka, Suita, Osaka 565-0871, Japan
2
Technical Institute, Kawasaki Heavy Industries, Ltd., 1-1, Kawasaki-cho, Akashi, Hyogo 673-8666, Japan
3
Anisotropic Design & Additive Manufacturing Research Center, Osaka University, 2-1, Yamadaoka, Suita, Osaka 565-0871, Japan
*
Authors to whom correspondence should be addressed.
Crystals 2021, 11(9), 1064; https://doi.org/10.3390/cryst11091064
Submission received: 19 August 2021 / Revised: 27 August 2021 / Accepted: 30 August 2021 / Published: 3 September 2021

Abstract

:
The influence of various laser powder bed fusion (LPBF) process parameters on the crystallographic textures and mechanical properties of a typical Ni-based solid-solution strengthened alloy, Hastelloy-X, was examined. Samples were classified into four groups based on the type of crystallographic texture: single crystalline-like microstructure with <100>//build direction (BD) (<100>-SCM), single crystalline-like microstructure with <110>//BD (<110>-SCM), crystallographic lamellar microstructure (CLM), or polycrystalline microstructure (PCM). These four crystallographic textures were realized in Hastelloy-X for the first time here to the best of our knowledge. The mechanical properties of the samples varied depending on their texture. The tensile properties were affected not only by the Schmid factor but also by the grain size and the presence of lamellar boundaries (grain boundaries). The lamellar boundaries at the interface between the <110>//BD oriented main layers and the <100>//BD-oriented sub-layers of CLM contributed to the resistance to slip transmission and the increased proof stress. It was possible to control a wide range of crystallographic microstructures via the LPBF process parameters, which determines the melt pool morphology and solidification behavior.

1. Introduction

Metal additive manufacturing (AM) is a highly promising manufacturing method that enables the production of arbitrary three-dimensional shapes [1,2,3,4]. Many studies employing this technique have used a variety of metallic materials, including stainless steels [5,6,7,8,9], Al alloys [5,10], Ti alloys [5,11,12,13], Ni-based superalloys [14,15], high-entropy alloys [16,17], metallic glasses [18], and intermetallic compounds [19,20]. Laser powder bed fusion (LPBF), a typical metal AM process, is characterized by fast cooling rates and large temperature gradients [21], and it has been reported that anisotropic microstructures evolve based on the cooling direction within a melt pool [22,23]. Certain process parameters (laser power, scan speed, hatch distance, layer thickness, scanning strategy, etc.) result in a variety of distinct microstructures, including single crystalline-like microstructures, crystallographic lamellar microstructures, and polycrystalline microstructures [24,25,26,27].
In terms of Ni-based superalloys, the LPBF process has been investigated for various alloys with different strengthening mechanisms, such as the solid-solution strengthened alloy Hastelloy-X [28], the γ’’ (typically Ni3Nb) precipitation strengthened alloy IN718 [15], and the γ’ (typically Ni3Al) precipitation strengthened alloy IN939 [29]. The major applications of Ni-based superalloys include aircraft engines and industrial gas turbines. Generally, solid-solution strengthened alloys are widely used in combustor components that require good formability for complex shapes and oxidation resistance [30]. γ’’ precipitation strengthened alloys are utilized for many components, such as shafts and disks, which are not directly exposed to combustion gases and require excellent mechanical properties in the medium-temperature range, up to 700 °C [31]. γ′ precipitation strengthened alloys are generally utilized for turbine components that require excellent creep properties [32].
Solid-solution strengthened alloys are useful for practical applications for the following reasons: (1) the required mechanical properties are less than that of precipitation strengthened alloys, (2) they do not require various steps of heat treatment, and (3) the LPBF process can manufacture complex parts which are useful for their application in combustor components. For practical use, it is necessary to investigate a wide range of process parameters and determine the appropriate process window. However, previous studies have focused only on examining the effects of a limited number of process parameters on the microstructure and mechanical properties [33,34,35], understanding precipitates and recrystallization during heat treatment [36,37], analyzing the factors that cause micro-cracks [38,39,40,41], and improving mechanical properties by dispersion of TiC particles [42]. Therefore, a sufficient understanding of the effects of a wider range of process parameters on crystallographic textures and their relation to mechanical properties has not been established.
In this study, we examined the influence of a wide range of process parameters on the crystallographic textures and mechanical properties of a typical solid-solution strengthened alloy, Hastelloy-X. The microstructural evolution is also discussed by focusing on the melt pool shape, which is a microscopic melting unit, in order to obtain a guideline for determining the optimal process parameters for obtaining desired microstructural characteristics.

2. Materials and Methods

2.1. Fabrication of Hastelloy-X Samples via LPBF Process

Gas-atomized Hastelloy-X powder (EOS, Krailling, Germany) with the chemical composition included in Table 1 was used in this study. A field-emission scanning electron microscopy (FE-SEM; JIB-4610F, JEOL, Tokyo, Japan) image of the Hastelloy-X powder is displayed in Figure 1a. The particle size distribution was determined as D10 = 17.4 μm, D50 = 33.9 μm, and D90 = 63.1 μm, using a Mastersizer 3000 (Malvern Panalytical, Malvern, UK). The flowability, measured by a Revolution (Mercury Scientific, Newtown, CT, USA), was 14.68 mJ/kg for the avalanche energy, 45.1° for the avalanche angle, 34.3° for the rest angle, and 1.87 for the surface fractal.
An EOS M 290 (EOS, Krailling, Germany) was used for LPBF, and samples with dimensions of 10 mm (x direction), 10 mm (y direction), and 50 mm (z direction; building direction (BD)) (Figure 1b) were produced. The building platform was heated to 80 °C, and the building atmosphere was maintained at an oxygen content of less than 100 ppm by Ar gas. The layer thickness tL was 0.06 mm, the laser power P was 180–360 W (in 60 W steps), the scan speed v was 600–1400 mm/s (in 200 mm/s step), and the hatch distances d were 0.08 and 0.10 mm. The volumetric energy density Evol [J/mm3] can be calculated using Equation (1). Two scan strategies, X scan and XY scan [22], were employed. To investigate a wide range of process parameters, 80 parameter conditions were considered.
E vol = P v d t L

2.2. Microstructure Characterization

The y–z cross-sections were cut out, embedded in resins, and polished with emery paper up to #4000 and colloidal silica carried out as part of the initial preparation for microstructure observation. An optical microscope (OM; BX60, Olympus, Tokyo, Japan) was used to observe internal defects. FE-SEM observations were conducted to determine the shape of the melt pool after etching with a HF:HNO3:H2O = 35:55:100 solution at 50–60 °C for 90 min. Electron backscatter diffraction (EBSD), which the FE-SEM was equipped for, was used to identify the crystallographic textures under an acceleration voltage of 20 kV, a current of 16 nA, and a step size of 2 μm at 100× magnification. Inverse pole figure (IPF) maps, pole figures, grain boundary maps, and Euler angles were obtained using analysis software (AztecHKL 3.0, Oxford Instruments, High Wycombe, UK). For quantitative evaluation, the degree of orientation p h k l with respect to the observation direction <hkl> was obtained using the Euler angles of every measurement point analyzed by the HKL Channel 5 software (Oxford Instruments, High Wycombe, UK), according to Equation (2). Here, α h k l is the smallest angle between the observation direction and the equivalent orientations of <hkl>.
p h k l = cos 2 α h k l  

2.3. Mechanical Property Tests

The Young’s modulus was determined using the free resonance elastic modulus measuring method (JE2-C1/JE2-RT, Nihon Techno-Plus, Osaka, Japan), using small samples cut to 2 mm thickness (x direction), 8 mm width (y direction), and 40 mm length (z direction) from the built samples. The Young’s modulus E [GPa] was calculated using Equation (3), employing the measured resonance frequency f [Hz], the specimen length l [mm], specimen thickness ts [mm], and specimen density ρ [g/cm3]. The density was measured using the Archimedes method with an analytical balance (AUX 220, Shimadzu, Kyoto, Japan).
E = 9.463 × 10 13 × l 4 ρ t s 2 × f 2  
Tensile samples were cut to 0.8 mm thickness (x direction), 2 mm width (y direction), and 5 mm gauge length (z direction) from the built samples, with tensile properties obtained using an autograph (AGX-V, Shimadzu, Kyoto, Japan) and analyzed using TrapeziumX–V software (Shimadzu, Kyoto, Japan). The initial strain rate was set to 1%/min with the test environment at room temperature in a vacuum atmosphere.

3. Results

3.1. Microstructure Characterization
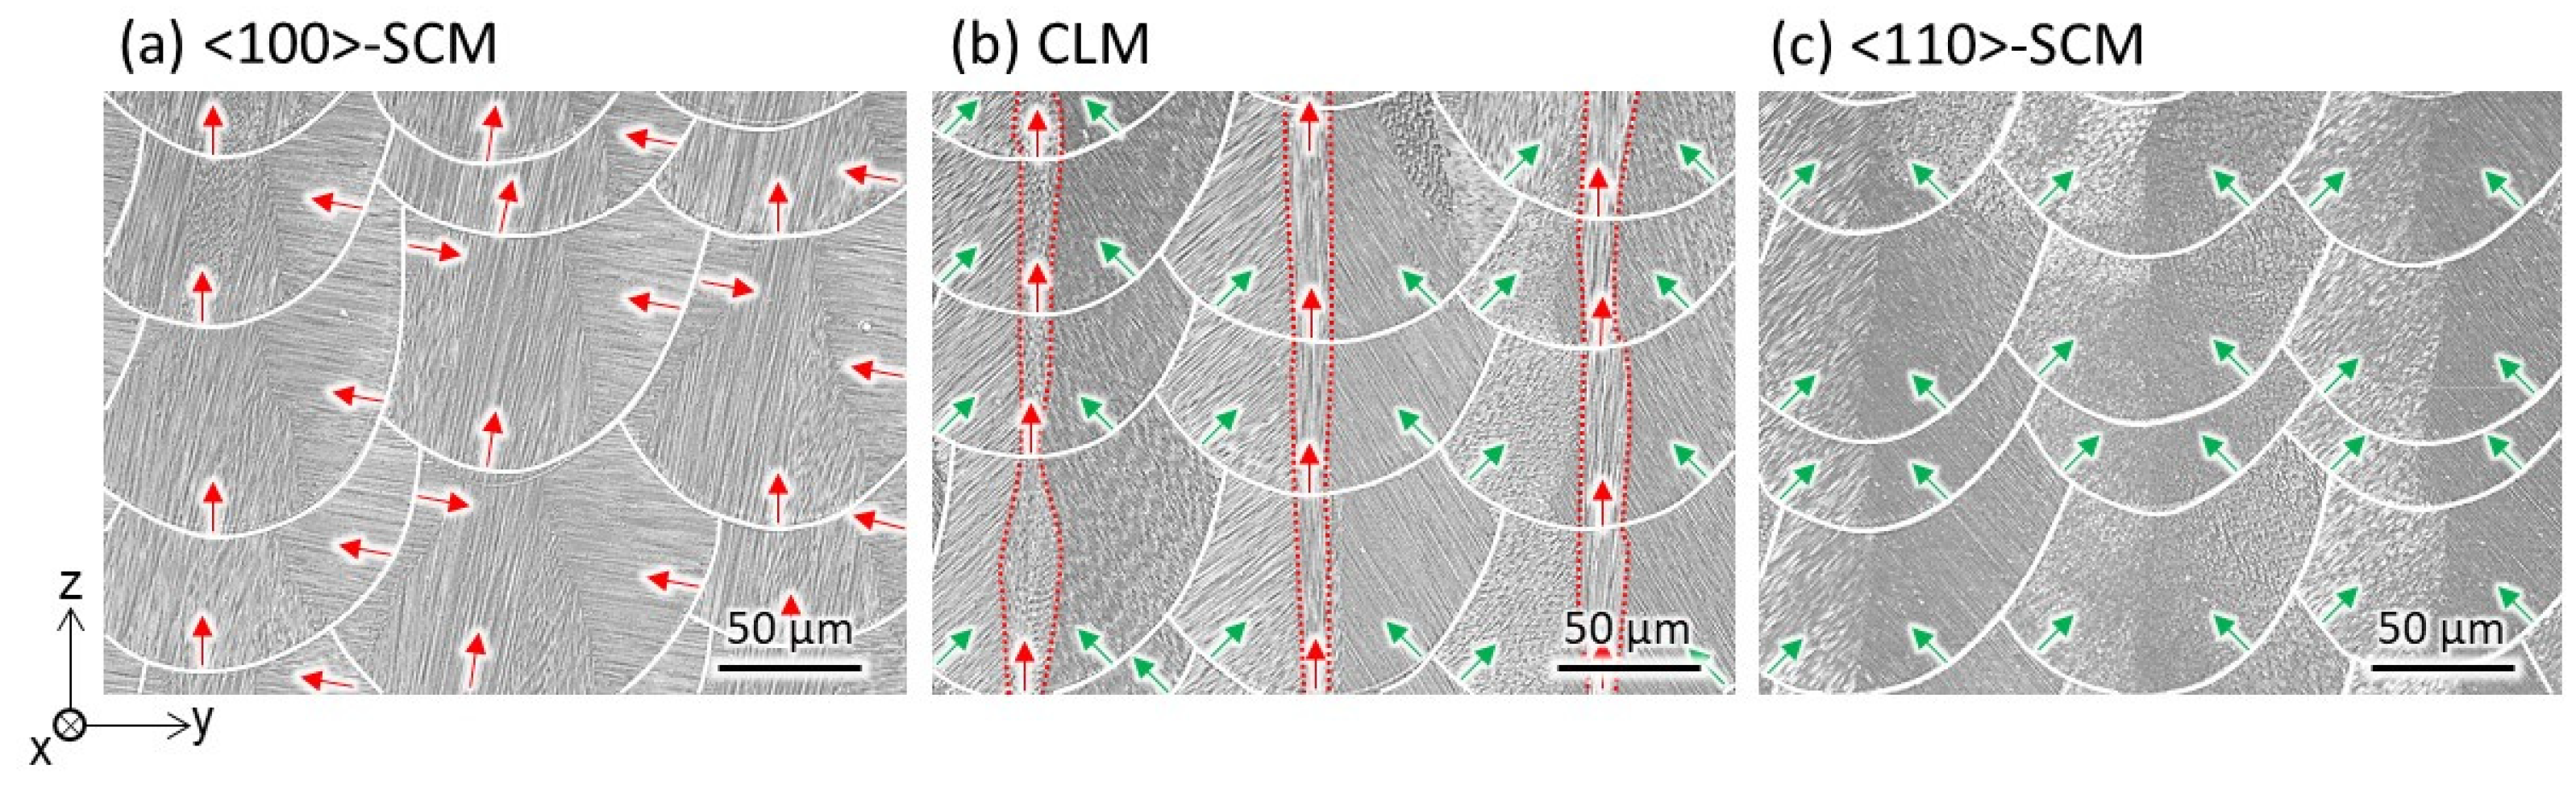
The effect of Evol on the density of the samples is displayed in Figure 2 including representative OM images of the y–z cross-section. The highest density was observed at Evol = 50 J/mm3. When Evol was less than 35 J/mm3, the density decreased rapidly and lack-of-fusion defects were observed. When Evol exceeded approximately 95 J/mm3, the density decreased more gradually, and keyhole-type spherical defects (gas porosities) were observed. These two types of defects are widely recognized as part of the LPBF process [43]. Based on these preliminary experiments, the optimum process parameter determined for densification of the samples of Hastelloy-X was Evol in the range of 35–95 J/mm3.
IPF maps and pole figures under typical process parameters with d = 0.10 mm for the X-scan strategy are displayed in Figure 3 with the results for Evol < 35 J/mm3 and Evol > 95 J/mm3 indicated with crosses. The grains elongated along the BD were observed for a wide range of process parameters. Additionally, the crystallographic textures strongly depended on the process parameters. Subsequently, as illustrated in Figure 3A–D, they were classified into four distinct groups of crystallographic textures: (A) single crystalline-like microstructure with <100>//BD (<100>-SCM), (B) crystallographic lamellar microstructure (CLM), (C) single crystalline-like microstructure with <110>//BD (<110>-SCM), and (D) polycrystalline microstructure with a randomized orientation (PCM). The crystallographic characteristics of the four groups are described in detail below.
(A)
<100>-SCM has a crystallographic texture in which <100> orients in the x, y, and z directions.
(B)
CLM contains alternating layers of <110>//BD oriented main layers and <001>//BD oriented sub-layers. The period of lamellar structure is 0.08–0.10 mm, corresponding to the hatch distance.
(C)
<110>-SCM contains crystallographic textures with <110> orientation in the y and z directions, and <100> orientation in the x direction.
(D)
PCM has a randomized crystallographic orientation, and contains smaller and less elongated grains compared to the other microstructures.

3.2. Effect of Crystallographic Texture on the Young’s Modulus

The Young’s modulus was measured to investigate the effect of the crystallographic textures obtained by the LPBF process on the sample’s mechanical properties. The Young’s modulus of a single crystal with respect to an arbitrary orientation < l m n > is obtained using Equation (4) with the elastic stiffness constants c 11 ,   c 12 , and c 44 . As c 11 ,   c 12 , and c 44 of Hastelloy-X are 230.40, 156.12, and 121.77 GPa, respectively [44], the theoretical Young’s modulus of the <100>, <110> and <111> orientations were calculated as 104.28, 203.62, and 298.36 GPa, respectively.
E   = { c 11 + c 12 ( c 11 c 12 ) ( c 11 + 2 c 12 ) + ( 1 c 44 2 c 11 c 12 ) ( l 2 m 2 + m 2 n 2 + n 2 l 2 ) } 1
The two methods of averaging the Young’s modulus of polycrystallines are known as the Voigt average EV (Equation (5)) [45], assuming the same strain state of each crystal, and the Reuss average ER (Equation (6)) [46], assuming the same stress state of each crystal. Then, the Voigt–Reuss–Hill approximation EH (Equation (7)) [47], taking the average of EV and ER, is typically employed. Here, s 11 ,   s 12 , and s 44 are the elastic compliance constants, calculated using c 11 ,   c 12 , and c 44 . Therefore, the theoretical Young’s modulus of polycrystalline Hastelloy X was calculated as 199.01 GPa.
E V = ( c 11 c 12 + 3 c 44 ) ( c 11 + 2 c 12 ) 2 c 11 + 3 c 12 + c 44
E R = 5 3 s 11 + 2 s 12 + s 44
E H = E V + E R 2
The relationship between the degree of orientation and the measured Young’s modulus is illustrated in Figure 4. The maximum value of p h k l is 1 for a single crystal whose orientation coincides perfectly with the observation direction <hkl>. In a completely random polycrystalline structure, p 100 is 0.701, and p 110 is 0.835 [48]. It was confirmed that the Young’s modulus decreases as p 100 increases, and that <100>-SCM has a theoretical Young’s modulus in the <100> orientation of 104.28 GPa. Similarly, the Young’s modulus increased as p 110 increased, and <110>-SCM demonstrated a Young’s modulus of 203.62 GPa, close to the theoretical value. Therefore, the crystallographic textures uniquely obtained via the LPBF process demonstrated a Young’s modulus comparable to the theoretical value, corresponding to the orientation. That is, desired mechanical properties may be obtained by controlling the process parameters.

3.3. Impact of Crystallographic Textures on Tensile Properties

The true stress–true strain curves of the four groups of crystallographic textures are shown in Figure 5. Additionally, Table 2 summarizes the mean values of the tensile properties with standard deviations.
The Schmid factors (SF) for the loading axes <100> and <110> were both 0.408. As CLM can be regarded as a composite microstructure consisting of main layers with <110>//BD orientation and sub-layers with <100>//BD orientation, the theoretical SF is also 0.408. Here, the 0.2% proof stresses of <100>-SCM and <110>-SCM were 419.2 ± 3.5 and 419.9 ± 13.5 MPa, respectively, which is consistent with the identical SFs. The higher work-hardening rate for <100>-SCM may be due to the higher frequency of dislocation pile-up associated with multiple slips, as the loading axis parallel to <100> is not accompanied by crystal rotation, but by an 8-fold multiple slip during tensile testing [49,50]. However, the 0.2% proof stress of CLM was 434.1 ± 12.2 MPa, higher than that of the <100>-SCM and <110>-SCM, despite the theoretically identical SF. PCM demonstrated the highest 0.2% proof stress of 493.1 ± 13.3 MPa. As illustrated in the grain boundary maps of Figure 6d, it was determined that the proof stress obeys the Hall–Petch relationship.
The required values of 0.2% proof stress, UTS, and elongation for cast Hastelloy-X specified in AMS5390 are 240 MPa, 379 MPa, and 8%, respectively (Table 2). Those of the Hastelloy-X sheets specified in ASTM B435-06 are 240 MPa, 655 MPa, and 35%, respectively (Table 2). The tensile properties of all four groups exceeded the specifications of AMS5390, indicating the feasibility of part manufacturing utilizing the crystallographic textures unique to the LPBF process. With respect to ASTM B435-06, PCM satisfied the requirements for all specified values. By changing the crystallographic orientation and grain boundary density via fabrication using LPBF, the proof stress, UTS, and elongation can be chosen according to the mechanical requirements.

4. Discussion

4.1. Microstructure Evolution during LPBF

Among the four groups of crystallographic textures obtained in this study, <100>-SCM, CLM, and <110>-SCM, which were presumed to have been obtained by characteristic solidification phenomena in the LPBF process, are discussed with a focus on the melt pool, which is a basic unit of solidification.
The SEM images of the melt pool visualized by etching are displayed in Figure 7. Fine cells were observed in the melt pool, indicating that cell growth occurred in all cases. The elongation direction of the cells is known to coincide with <100>, which is the prior growth direction of FCC metals. Here, a remarkable difference was observed in the elongation direction of the cells. Those in the <100>-SCM developed from the bottom of the melt pool in the BD and from the side of the melt pool in the horizontal direction. However, in <110>-SCM, cell growth on a 45° incline to the BD was observed from the bottom to the side of the melt pool. Regarding CLM, the main layers in which the cells grow with a 45° tilt to the BD from the side of the melt pool, and the sublayers in which the cells grow parallel to the BD from the bottom of the melt pool, are alternately arranged.
The relationship between the cell growth direction and melt pool shape was examined in detail. As a representative value for the shapes of the melt pool, the radius of curvature r [µm] at the melt pool bottom was calculated according to Equation (8) [25]. Here, the shapes of the melt pool in the y–z plane were approximated by a function f ( a ) . The calculated radii of curvature were 61.1 ± 9.41, 50.9 ± 6.56, and 39.2 ± 2.96 μm for <100>-SCM, CLM, and <110>-SCM, respectively. As the bottom of the melt pool became flatter (r increased), the <100>//BD growth became dominant, resulting in <100>-SCM evolution.
r = ( 1 + f ( a ) 2 ) 3 2 | f ( a ) |

4.2. Expectations for the Crystallographic Textures on Mechanical and Oxidation Properties

Expectations for the crystallographic texture control in Hastelloy-X are described in terms of the mechanical properties and oxidation resistance.
The tensile properties of the PCM obtained in this study were approximately equivalent to those reported in the literature [32,35,36,39]. However, this study reports on the <100>-SCM, CLM, and <110>-SCM of Hastelloy-X developed via the LPBF process for the first time. Among these, the <100> orientation in single-crystalline Ni-based superalloys is important not only for its excellent creep properties as compared with other orientations [29], but also due to its excellent low-cycle fatigue properties [51]. Furthermore, it has been reported that in pure chromium (Cr) developed via the LPBF process, <100>-oriented Cr demonstrated superior oxidation resistance compared to randomly oriented Cr [52]. This is explained by the anisotropy of the diffusion coefficient of Cr2O3. Hastelloy-X, which forms the same Cr2O3 oxide film, could exhibit a similar advantage based on the crystallographic texture.
The 0.2% proof stress of CLM was significantly higher than that of SCM, despite the identical SF, with the presence of a lamellar boundary being the microstructural difference between the CLM and SCM. This lamellar boundary consists of grain boundaries with an angular difference of 45 ° and is likely to be the source of the higher proof stress. As proposed for bicrystals, the boundary between single crystals can be a resistant to slip transmission [53]. The ideal transmission coefficient calculated at the CLM boundary was 0.82 [26], where the value for a single crystal is 1. It was suggested that the transmission coefficient is less than 1, but moderately high, which gives the CLM good elongation and higher proof stress compared to SCM.
As Hastelloy-X is a solid-solution strengthened Ni-based superalloy, solution treatments and aging treatments are not necessarily required. That is, Hastelloy-X can be used without recrystallization, while also utilizing crystallographic textures uniquely created by the LPBF process. Therefore, improving our understanding of the textures of Hastelloy-X was important, and the utilization of the LPBF process should be more widely adopted in the future based on the relationship between process parameters, crystallographic textures, and mechanical properties.

5. Conclusions

In this study, we examined the influence of a wide range of process parameters on the crystallographic textures and mechanical properties of a typical solid-solution strengthened alloy, Hastelloy-X. The following conclusions were drawn:
(1)
Among a wide range of process parameters, dense samples were obtained at a volumetric energy density of 35–95 J/mm3. They were classified into four groups, <100>-SCM, CLM, <110>-SCM, and PCM, based on the crystallographic textures.
(2)
The Young’s modulus of the samples constructed via the LPBF process showed anisotropy close to the theoretical value depending on the degree of orientation. It was suggested that the desired mechanical properties could be obtained by controlling the process parameters.
(3)
The tensile properties were affected not only by the SF, but also by the grain size and the presence of grain boundaries (lamellar boundaries). PCM with smaller grains showed a higher 0.2% proof stress than the other groups. Grain boundaries at the interface between the <110>//BD main layers and the <100>//BD sub-layers of CLM played a role in the resistance to slip transmission and contributed to the increase in proof stress.
(4)
By controlling the radius of curvature at the bottom of the melt pool using the process parameters, it is possible to control a wide range of microstructures, including <100>-SCM, <110>-SCM, and CLM, which is a microstructure uniquely obtained via the LPBF process.
It was demonstrated that it is possible to control the crystallographic textures using the LPBF process by appropriately choosing the process parameters, and the mechanical properties corresponding to the crystallographic textures can be designed and obtained. Microstructure control is expected to have a positive impact on other properties, such as creep resistance, fatigue resistance, and oxidation resistance.

Author Contributions

Conceptualization, S.H., K.I., and T.N.; data curation, S.H. and T.T.; investigation, S.H., T.T., T.I., O.G., and Y.K.; methodology, T.T., T.I., and O.G.; project administration, K.I. and T.N.; supervision, T.I., K.I., and T.N.; validation, T.T. and T.I.; visualization, S.H. and T.T.; writing—original draft, S.H.; writing—review and editing, T.I. and T.N. All authors have read and agreed to the published version of the manuscript.

Funding

This work was supported by Grants-in-Aid for Scientific Research (JP18H05254, JP 21H05018) from the Japan Society for the Promotion of Science (JSPS). This work was also supported by the Council for Science, Technology and Innovation(CSTI), Cross-ministerial Strategic Innovation Promotion Program (SIP), “Materials Integration” for the Revolutionary Design System of Structural Materials (Funding Agency: JST).

Institutional Review Board Statement

Not applicable.

Informed Consent Statement

Not applicable.

Data Availability Statement

The data that support the findings of this study are available from the corresponding author upon reasonable request.

Conflicts of Interest

The authors declare that they have no known competing financial interest or personal relationships that could have influenced the work reported in this paper.

References

  1. Plocher, J.; Panesar, A. Review on design and structural optimisation in additive manufacturing: Towards next-generation lightweight structures. Mater. Des. 2019, 183, 108164. [Google Scholar] [CrossRef]
  2. Bai, L.; Gong, C.; Chen, X.H.; Sun, Y.X.; Zhang, J.F.; Cai, L.C.; Zhu, S.Y.; Xie, S.Q. Additive manufacturing of customized metallic orthopedic implants: Materials, structures, and surface modifications. Metals 2019, 9, 1004. [Google Scholar] [CrossRef] [Green Version]
  3. Wang, P.; Li, X.W.; Jiang, Y.; Nai, M.L.S.; Ding, J.; Wei, J. Electron beam melted heterogeneously porous microlattices for metallic bone applications: Design and investigations of boundary and edge effects. Addit. Manuf. 2020, 36, 101566. [Google Scholar] [CrossRef]
  4. Ikeo, N.; Fukuda, H.; Matsugaki, A.; Inoue, T.; Serizawa, A.; Matsuzaka, T.; Ishimoto, T.; Ozasa, R.; Gokcekaya, O.; Nakano, T. 3D puzzle in cube pattern for anisotropic/isotropic mechanical control of structure fabricated by metal additive manufacturing. Crystals 2021, 11, 959. [Google Scholar] [CrossRef]
  5. Mower, T.M.; Long, M.J. Mechanical behavior of additive manufactured, powder-bed laser-fused materials. Mater. Sci. Eng. A 2016, 651, 198–213. [Google Scholar] [CrossRef]
  6. Garibaldi, M.; Ashcroft, I.; Simonelli, M.; Hague, R. Metallurgy of high-silicon steel parts produced using selective laser melting. Acta Mater. 2016, 110, 207–216. [Google Scholar] [CrossRef]
  7. Stornelli, G.; Faba, A.; di Schino, A.; Folgarait, P.; Ridolfi, M.; Cardelli, E.; Montanari, R. Properties of additively manufactured electric steel powder cores with increased Si content. Materials 2021, 14, 1489–1506. [Google Scholar] [CrossRef]
  8. Tsutsumi, Y.; Ishimoto, T.; Oishi, T.; Manaka, T.; Chen, P.; Ashida, M.; Doi, K.; Katayama, H.; Hanawa, T.; Nakano, T. Crystallographic texture- and grain boundary density-independent improvement of corrosion resistance in austenitic 316L stainless steel fabricated via laser powder bed fusion. Addit. Manuf. 2021, 45, 102066. [Google Scholar] [CrossRef]
  9. Ishimoto, T.; Wu, S.; Ito, Y.; Sun, S.-H.; Amano, H.; Nakano, T. Crystallographic orientation control of 316L austenitic stainless steel via selective laser melting. ISIJ Int. 2019, 60, 1758–1764. [Google Scholar] [CrossRef] [Green Version]
  10. Liu, M.; Wada, T.; Suzuki, A.; Takata, N.; Kobashi, M.; Kato, M. Effect of annealing on anisotropic tensile properties of Al-12%Si alloy fabricated by laser powder bed fusion. Crystals 2020, 10, 1007. [Google Scholar] [CrossRef]
  11. Takase, A.; Ishimoto, T.; Suganuma, R.; Nakano, T. Lattice distortion in selective laser melting (SLM)-manufactured unstable β-type Ti-15Mo-5Zr-3Al alloy analyzed by high-precision X-ray diffractometry. Scr. Mater. 2021, 201, 113953. [Google Scholar] [CrossRef]
  12. Takase, A.; Ishimoto, T.; Suganuma, R.; Nakano, T. Surface residual stress and phase stability in unstable β-type Ti-15Mo-5Zr-3Al alloy manufactured by laser and electron beam powder bed fusion technologies. Addit. Manuf. 2021, 47, 102257. [Google Scholar] [CrossRef]
  13. Takase, A.; Ishimoto, T.; Morita, N.; Ikeo, N.; Nakano, T. Comparison of phase characteristics and residual stresses in Ti-6Al-4V alloy manufactured by laser powder bed fusion (L-PBF) and electron beam powder bed fusion (EB-PBF) techniques. Crystals 2021, 11, 796. [Google Scholar] [CrossRef]
  14. Tian, Z.H.; Zhang, C.Q.; Wang, D.Y.; Liu, W.; Fang, X.Y.; Wellmann, D.; Zhao, Y.T.; Tian, Y.T. A Review on laser powder bed fusion of Inconel 625 Nickel-based alloy. Appl. Sci. 2020, 10, 81. [Google Scholar] [CrossRef] [Green Version]
  15. Hosseini, E.; Popovich, V.A. A review of mechanical properties of additively manufactured Inconel 718. Addit. Manuf. 2019, 30, 100877. [Google Scholar] [CrossRef]
  16. Ishimoto, T.; Ozasa, R.; Nakano, K.; Weinmann, M.; Schnitter, C.; Stenzel, M.; Matsugaki, A.; Nagase, T.; Matsuzaka, T.; Todai, M.; et al. Development of TiNbTaZrMo bio-high entropy alloy (BioHEA) super-solid solution by selective laser melting, and its improved mechanical property and biocompatibility. Scr. Mater. 2021, 194, 113658. [Google Scholar] [CrossRef]
  17. Ikeda, T.; Yonehara, M.; Ikeshoji, T.T.; Nobuki, T.; Hatate, M.; Kuwabara, K.; Otsubo, Y.; Kyogoku, H. Influences of process parameters on the microstructure and mechanical properties of CoCrFeNiTi based high-entropy alloy in a laser powder bed fusion process. Crystals 2021, 11, 549. [Google Scholar] [CrossRef]
  18. Liu, H.S.; Jiang, Q.; Huo, J.T.; Zhang, Y.; Yang, W.M.; Li, X.P. Crystallization in additive manufacturing of metallic glasses: A review. Addit. Manuf. 2020, 36, 101568. [Google Scholar] [CrossRef]
  19. Cho, K.; Kawabata, H.; Hayashi, T.; Yasuda, H.; Nakashima, H.; Takeyama, M.; Nakano, T. Peculiar microstructural evolution and tensile properties of β-containing γ-TiAl alloys fabricated by electron beam melting. Addit. Manuf. 2021, 46, 102091. [Google Scholar]
  20. Hagihara, K.; Ishimoto, T.; Suzuki, M.; Ozasa, R.; Matsugaki, A.; Wang, P.; Nakano, T. Factor which governs the feature of texture developed during additive manufacturing; clarified from the study on hexagonal C40-NbSi2. Scr. Mater. 2021, 203, 114111. [Google Scholar] [CrossRef]
  21. Nie, P.L.; Ojo, O.A.; Li, Z.G. Numerical modeling of microstructure evolution during laser additive manufacturing of a nickel-based superalloy. Acta Mater. 2014, 77, 85–95. [Google Scholar] [CrossRef]
  22. Ishimoto, T.; Hagihara, K.; Hisamoto, K.; Sun, S.H.; Nakano, T. Crystallographic texture control of beta-type Ti-15Mo-5Zr-3Al alloy by selective laser melting for the development of novel implants with a biocompatible low Young’s modulus. Scr. Mater. 2017, 132, 34–38. [Google Scholar] [CrossRef]
  23. Kok, Y.; Tan, X.P.; Wang, P.; Nai, M.L.S.; Loh, N.H.; Liu, E.; Tor, S.B. Anisotropy and heterogeneity of microstructure and mechanical properties in metal additive manufacturing: A critical review. Mater. Des. 2018, 139, 565–586. [Google Scholar] [CrossRef]
  24. Sun, S.H.; Ishimoto, T.; Hagihara, K.; Tsutsumi, Y.; Hanawa, T.; Nakano, T. Excellent mechanical and corrosion properties of austenitic stainless steel with a unique crystallographic lamellar microstructure via selective laser melting. Scr. Mater. 2019, 159, 89–93. [Google Scholar] [CrossRef]
  25. Sun, S.H.; Hagihara, K.; Nakano, T. Effect of scanning strategy on texture formation in Ni-25 at.% Mo alloys fabricated by selective laser melting. Mater. Des. 2018, 140, 307–316. [Google Scholar] [CrossRef]
  26. Gokcekaya, O.; Ishimoto, T.; Hibino, S.; Yasutomi, J.; Narushima, T.; Nakano, T. Unique crystallographic texture formation in Inconel 718 by laser powder bed fusion and its effect on mechanical anisotropy. Acta Mater. 2021, 212, 116876. [Google Scholar] [CrossRef]
  27. Gokcekaya, O.; Ishimoto, T.; Todo, T.; Suganuma, R.; Fukushima, R.; Narushima, T.; Nakano, T. Effect of scan length on densification and crystallographic texture formation of pure chromium fabricated by laser powder bed fusion. Crystals 2021, 11, 9. [Google Scholar] [CrossRef]
  28. Tomus, D.; Tian, Y.; Rometsch, P.A.; Heilmaier, M.; Wu, X.H. Influence of post heat treatments on anisotropy of mechanical behaviour and microstructure of Hastelloy-X parts produced by selective laser melting. Mater. Sci. Eng. A 2016, 667, 42–53. [Google Scholar] [CrossRef]
  29. Kanagarajah, P.; Brenne, F.; Niendorf, T.; Maier, H.J. Inconel 939 processed by selective laser melting: Effect of microstructure and temperature on the mechanical properties under static and cyclic loading. Mater. Sci. Eng. A 2013, 588, 188–195. [Google Scholar] [CrossRef]
  30. HASTELLOY® X Alloy. Available online: https://www.haynesintl.com/alloys/alloy-portfolio_/High-temperature-Alloys/HASTELLOY-X-alloy (accessed on 25 July 2021).
  31. Paulonis, F.D.; Schirra, J.J. Alloy 718 at Pratt & Whitney: Historical Perspective and Future Challenges. In International Symposium on Superalloys 718, 625, 706 and Various Derivatives, Pittsburgh, PA, USA, 17–20 June 2001; The Minerals, Metals & Materials Society (TMS): Pittsburgh, PA, USA, 2001; pp. 13–23. [Google Scholar]
  32. Versnyde, F.; Shank, M.E. Development of columner grain and single crystal high temperature materials through directional solidification. Mater. Sci. Eng. 1970, 6, 213–247. [Google Scholar] [CrossRef]
  33. Esmaeilizadeh, E.; Keshavarzkermani, A.; Ali, U.; Mahmoodkhani, Y.; Behravesh, B.; Jahed, H.; Bonakdar, A.; Toyserkani, E. Customizing mechanical properties of additively manufactured Hastelloy X parts by adjusting laser scanning speed. J. Alloy. Compd. 2020, 812, 152097. [Google Scholar] [CrossRef]
  34. Esmaeilizadeh, R.; Keshavarzkermani, A.; Ali, U.; Behravesh, B.; Bonakdar, A.; Jahed, H.; Toyserkani, E. On the effect of laser powder-bed fusion process parameters on quasi-static and fatigue behaviour of Hastelloy X: A microstructure/defect interaction study. Addit. Manuf. 2021, 38, 101805. [Google Scholar] [CrossRef]
  35. Wang, H.; Chen, L.; Dovgyy, B.; Xu, W.Y.; Sha, A.X.; Li, X.W.; Tang, H.P.; Liu, Y.; Wu, H.; Pham, M.S. Micro-cracking, microstructure and mechanical properties of Hastelloy-X alloy printed by laser powder bed fusion: As-built, annealed and hot-isostatic pressed. Addit. Manuf. 2021, 39, 101853. [Google Scholar] [CrossRef]
  36. Montero-Sistiaga, M.L.; Liu, Z.Z.; Bautmans, L.; Nardone, S.; Ji, G.; Kruth, J.P.; Van Humbeeck, J.; Vanmeensel, K. Effect of temperature on the microstructure and tensile properties of micro-crack free Hastelloy X produced by selective laser melting. Addit. Manuf. 2020, 31, 100995. [Google Scholar] [CrossRef]
  37. Keshavarzkermani, A.; Esmaeilizadeh, R.; Enrique, P.D.; Asgari, H.; Zhou, N.R.Y.; Bonakdar, A.; Toyserkani, E. Static recrystallization impact on grain structure and mechanical properties of heat-treated Hastelloy X produced via laser powder-bed fusion. Mater. Charact. 2021, 173, 110969. [Google Scholar] [CrossRef]
  38. Harrison, N.J.; Todd, I.; Mumtaz, K. Reduction of micro-cracking in nickel superalloys processed by Selective Laser Melting: A fundamental alloy design approach. Acta Mater. 2015, 94, 59–68. [Google Scholar] [CrossRef] [Green Version]
  39. Tomus, D.; Rometsch, P.A.; Heilmaier, M.; Wu, X.H. Effect of minor alloying elements on crack-formation characteristics of Hastelloy-X manufactured by selective laser melting. Addit. Manuf. 2017, 16, 65–72. [Google Scholar] [CrossRef]
  40. Han, Q.Q.; Mertens, R.; Montero-Sistiaga, M.L.; Yang, S.F.; Setchi, R.; Vanmeensel, K.; Van Hooreweder, B.; Evans, S.L.; Fan, H.Y. Laser powder bed fusion of Hastelloy X: Effects of hot isostatic pressing and the hot cracking mechanism. Mater. Sci. Eng. A 2018, 732, 228–239. [Google Scholar] [CrossRef]
  41. Marchese, G.; Basile, G.; Bassini, E.; Aversa, A.; Lombardi, M.; Ugues, D.; Fino, P.; Biamino, S. Study of the microstructure and cracking mechanisms of Hastelloy X produced by laser powder bed fusion. Materials 2018, 11, 106. [Google Scholar] [CrossRef] [Green Version]
  42. Han, Q.Q.; Gu, Y.C.; Setchi, R.; Lacan, F.; Johnston, R.; Evans, S.L.; Yang, S.F. Additive manufacturing of high-strength crack-free Ni-based Hastelloy X superalloy. Addit. Manuf. 2019, 30, 100919. [Google Scholar] [CrossRef]
  43. Guraya, T.; Singamneni, S.; Chen, Z.W. Microstructure formed during selective laser melting of IN738LC in keyhole mode. J. Alloy. Compd. 2019, 792, 151–160. [Google Scholar] [CrossRef]
  44. Canistraro, H.A.; Jordan, E.H.; Shi, S.X.; Favrow, L.H.; Reed, F.A. Elastic constants of single crystal Hastelloy X at elevated temperatures. J. Eng. Mater. Technol. 1998, 120, 242–247. [Google Scholar] [CrossRef]
  45. Voigt, W. Ueber die Beziehung zwischen den beiden Elasticitätsconstanten isotroper Körper. Ann. Der Phys. 1889, 274, 573–587. [Google Scholar] [CrossRef] [Green Version]
  46. Reuss, A. Account of the liquid limit of mixed crystals on the basis of the plasticity condition for single crystal. Z. Fur Angew. Math. Mech. 1929, 9, 49–58. [Google Scholar] [CrossRef]
  47. Hill, R. The elastic behaviour of a crystalline aggregate. Proc. Phys. Soc. A 1952, 65, 349–355. [Google Scholar] [CrossRef]
  48. Ishimoto, T.; Hagihara, K.; Hisamoto, K.; Nakano, T. Stability of crystallographic texture in laser powder bed fusion: Understanding the competition of crystal growth using a single crystalline seed. Addit. Manuf. 2021, 43, 102004. [Google Scholar] [CrossRef]
  49. Takeuchi, T. Work-hardening of copper single-crystals with multiple glide orientations. Trans. Jpn. Inst. Met. 1975, 16, 629–640. [Google Scholar] [CrossRef] [Green Version]
  50. Luis, Z.-R.; Alexander, S.; Tomas, O.; Nicolas, B.; Nathan, B.; Rodrigo, F.; Vasily, B. Metal Hardening in Atomistic Detail. 2019. Available online: https://www.researchgate.net/publication/335651166 (accessed on 9 August 2021).
  51. Zhang, L.; Zhao, L.G.; Roy, A.; Silberschmidt, V.V.; McColvin, G. Low-cycle fatigue of single crystal nickel-based superalloy mechanical testing and TEM characterisation. Mater. Sci. Eng. A 2019, 744, 538–547. [Google Scholar] [CrossRef]
  52. Gokcekaya, O.; Hayashi, N.; Ishimoto, T.; Ueda, K.; Narushima, T.; Nakano, T. Crystallographic orientation control of pure chromium via laser powder bed fusion and improved high temperature oxidation resistance. Addit. Manuf. 2020, 36, 101624. [Google Scholar] [CrossRef]
  53. Livingston, J.D.; Chalmers, B. Multiple slip in bicrystal deformation. Acta Metall. 1957, 5, 322–327. [Google Scholar] [CrossRef]
Figure 1. (a) A scanning electron microscopy image of Hastelloy-X powder and (b) a picture of a sample piece.
Crystals 11 01064 g001
Figure 2. Relationship between the volumetric energy density and sample density. Optical microscopy images of the y–z cross-section of samples with the highest density, lack-of-fusion defects, and keyhole defects are also shown.
Crystals 11 01064 g002
Figure 3. (a) IPF maps and (b) pole figures obtained for typical process parameters (d = 0.10 mm for X-scan). The IPF maps are colorized according to the crystallographic orientation in the z direction. (A–D) shows the typical crystallographic textures, with (A) <100>-SCM, (B) CLM, (C) <110>-SCM, and (D) PCM.
Crystals 11 01064 g003
Figure 4. Relationships between the orientation parameter and Young’s modulus. The points indicated by the arrows (a–d) correspond to the IPF maps (a–d) on the right, respectively.
Crystals 11 01064 g004
Figure 5. True stress–true strain curves of the four typical crystallographic textures.
Crystals 11 01064 g005
Figure 6. Grain boundary maps obtained by EBSD measurements of the four typical crystallographic textures.
Crystals 11 01064 g006
Figure 7. SEM images displaying the melt pool shapes and the direction of cell growth.
Crystals 11 01064 g007
Table 1. Chemical composition of Hastelloy-X powder.
ElementNiCrFeMoWCoCSiMnBON
Composition
(mass%)
Bal.20.9317.898.730.841.460.010.180.01<0.0030.0190.009
Table 2. Tensile properties of the four typical crystallographic textures and the requirement values in Hastelloy-X castings (AMS5390) and Hastelloy-X sheets (ASTM B435-06).
Microstructure Type 0.2% Proof Stress [MPa]Ultimate Tensile Stress [MPa]Plastic Elongation [%]
<100>-SCM419.2 ± 3.5582.1 ± 10.736.8 ± 0.3
CLM434.1 ± 12.2604.8 ± 22.456.8 ± 1.8
<110>-SCM419.9 ± 13.5563.8 ± 23.449.6 ± 0.05
PCM493.1 ± 13.3683.8 ± 21.239.6 ± 1.5
Castings (AMS5390)>240>379>8
Sheets (ASTM B435-06)>240>655>35
Publisher’s Note: MDPI stays neutral with regard to jurisdictional claims in published maps and institutional affiliations.

