1. Introduction
Thermochromic liquid crystal (TLC) inks respond to temperature change with a change of colour [
1]. In order to achieve numerous possible applications, the TLC functional material is usually microencapsulated, so as to protect its unique properties and to “pigment” the ink or some other host material. The TLC material inside the microcapsules determines the colour, mechanism of colour change, and temperature at which the change occurs, but the binder of the ink defines its printing and curing technology [
2,
3].
TLC inks are coloured within the temperature activation range of several degrees, also referred to as the “bandwidth” or “colour play interval” [
4,
5]. At temperatures below or above the activation range, the TLC ink is colourless. During heating, at the point of reaching the activation temperature, the red colour appears first, followed by orange, yellow, green, blue, and violet. This effect is referred to as “colour play” [
4,
6]. Each of the colours is limited to a narrow temperature interval [
3]. Above the upper threshold of the activation range, the violet colour disappears and the TLC ink becomes colourless again. The temperature required to reach the colourless stage is called the “clearing point” [
4,
7,
8]. Our previous experiments have shown the colour cycles of TLC inks to be reversible.
Microcapsules are the functional pigments and can be used in a number of different applications. They are usually contained in a binder system and are incorporated in various places including wearable devices [
9,
10,
11]. In this study, we used the TLC inks in which the binder of the ink defines the printing and curing technology, whereas the pigment defines the thermochromic functionality [
2,
3]. Such inks can be used to print arbitrary designs on various surfaces, including direct printing on curved ones. In this special state, the adjacent sheets of equally oriented molecules twist and the corresponding director (i.e., the direction of the long axis of the molecules) traces a helical path. The distance required for the director to complete a 360° turn is called the pitch length. The thermochromic effect of TLCs results from the temperature-dependent pitch. With an increase in temperature, the helical pitch shrinks, leading to reflections of light with shorter wavelengths [
12,
13].
The “colour play effect” of TLC inks is only clearly visible when the ink is printed on a black substrate [
7,
14]. The reflection of light from the helical structure is nearly imperceptible, because most of the light passes through the ink layer and hits the substrate. On a white substrate, most of this light is backscattered, virtually obscuring the low light intensity reflected from the molecular pitch [
7]. To prevent this obscuring effect, TLCs should be deposited on a black substrate, which can absorb the greatest part of the light transmitted through the ink layer. Under such circumstances, the weak spectral reflection prevails, making the iridescent colours clearly visible [
15,
16]. Our previous studies have shown that the colour play effect of TLC ink can be observed when it is printed on a grey substrate with an optical density of at least 0.72 [
15].
TLC inks are best known as temperature indicators, especially for packaging, security printing and brand protection [
2,
4,
12]. In electronics, liquid crystals can be used to detect electrical shorts in circuits, open circuits, and non-functional devices [
12]. Temperature changes of TLCs can be a great advantage in monitoring and mapping the temperature of a significant surface area of almost any shape to detect a temperature fault or locate thermal activity [
4,
5,
17,
18]. The unique thermochromic effect of TLCs possesses the potential for an increased application in security printing.
The thermoreactive properties of TLC inks must be measured using integrating spheres, which spatially integrate the radiant flux reflected on a sample in each direction. Our previous studies have shown that larger diameter spheres give better results than smaller ones [
7].
To date, no detailed optical analysis of the colour play effect has been performed to show how this effect can be assessed independently of measurement devices, layer thickness, properties of the substrate and the differences between samples obtained from different producers. Therefore, the goal of this research was to analyse how these parameters could be experimentally quantified. We have chosen to call this set of parameters the communication mechanism. It is an intrinsic property of the functional TLC material and is fully independent of application and measurement conditions.
2. Materials and Methods
In the research, we used the water-based TLC ink formulation by Printcolor, Switzerland. According to manufacturer’s data, the ink activates at 25 °C (TA, activation temperature) and the clearing point is at 44 °C. At 25 °C the ink turns red, at 26 °C to green, proceeding to blue at 30 °C. Below TA and above the cleating point, the ink is colourless.
Two types of printing substrates were used: black coated paper (260 g/m
2, BYK, Geretsried, Germany) and black uncoated paper (160 g/m
2, Hahnemühle, Dassel, Germany). Black coated paper has a thickness of 350 µm, while black uncoated paper is 232 µm thick. The TLC ink was screen-printed over the black substrates with single, double and triple layers (wet over dry), using a semiautomatic screen-printing machine. The SEFAR
® PET 1500 43/110-80 W polyester mesh (Sefar AG, Heiden, Germany) with 149 µm openings was used [
19]. The prints were dried inside a hot air tunnel at about 75 °C.
Temperature-dependent optical properties of TLC prints were measured in a temperature range from 26 to 79 °C, using two different spectrometers, a full-size scientific device, mostly used in basic research and a fibre-based portable one typical for various spectrometric analyses. Both instruments have an integrating sphere measurement cell with (8°:di) measuring geometry. The full-size spectrometer was Lambda 950 UV-VISNIR (Perkin Elmer, Hopkinton, MA, USA) equipped with a 150 mm wide integrating sphere with a 25 mm sampling port diameter. The fibre-based USB 2000+ spectrometer (Ocean Optics, Orlando, FL, USA) has a 50 mm wide integrating sphere (ISP-50-8-R-GT) and an 8 mm sampling port diameter. SpectraSuite software by Ocean Optics was used to calculate the CIELAB L*, a*, b* values taking into account the D50 illuminant and 2° standard observer. At each individual temperature degree, the reflectance spectra of the samples were measured with 1 nm step in the 350–850 nm spectral region.
Temperature control of the printed samples was carried out using the surface of a water block (EK Water Blocks; EKWB d.o.o., Ljubljana, Slovenia). Thermostatically controlled water circulates through very thin acrylic channels inside the base plate. The heat from the water quickly transfers from thin channels through highly polished copper-nickel plate to the sample. The applied thermostatic circulator allows a heating rate of about 3.7 °C min
−1, and the water temperature is accurate up to a tenth of a degree [
7,
20]. Spectrometric measurements were performed at a steady temperature of the samples. This approach follows the uniform surface temperature method used in liquid crystal thermography [
18,
20]. Steady temperature of the measured sample is very important to ensure that the temperature of the sample remains constant throughout the sampling of each reflectance spectrum in both measuring devices used.
3. Results and Discussion
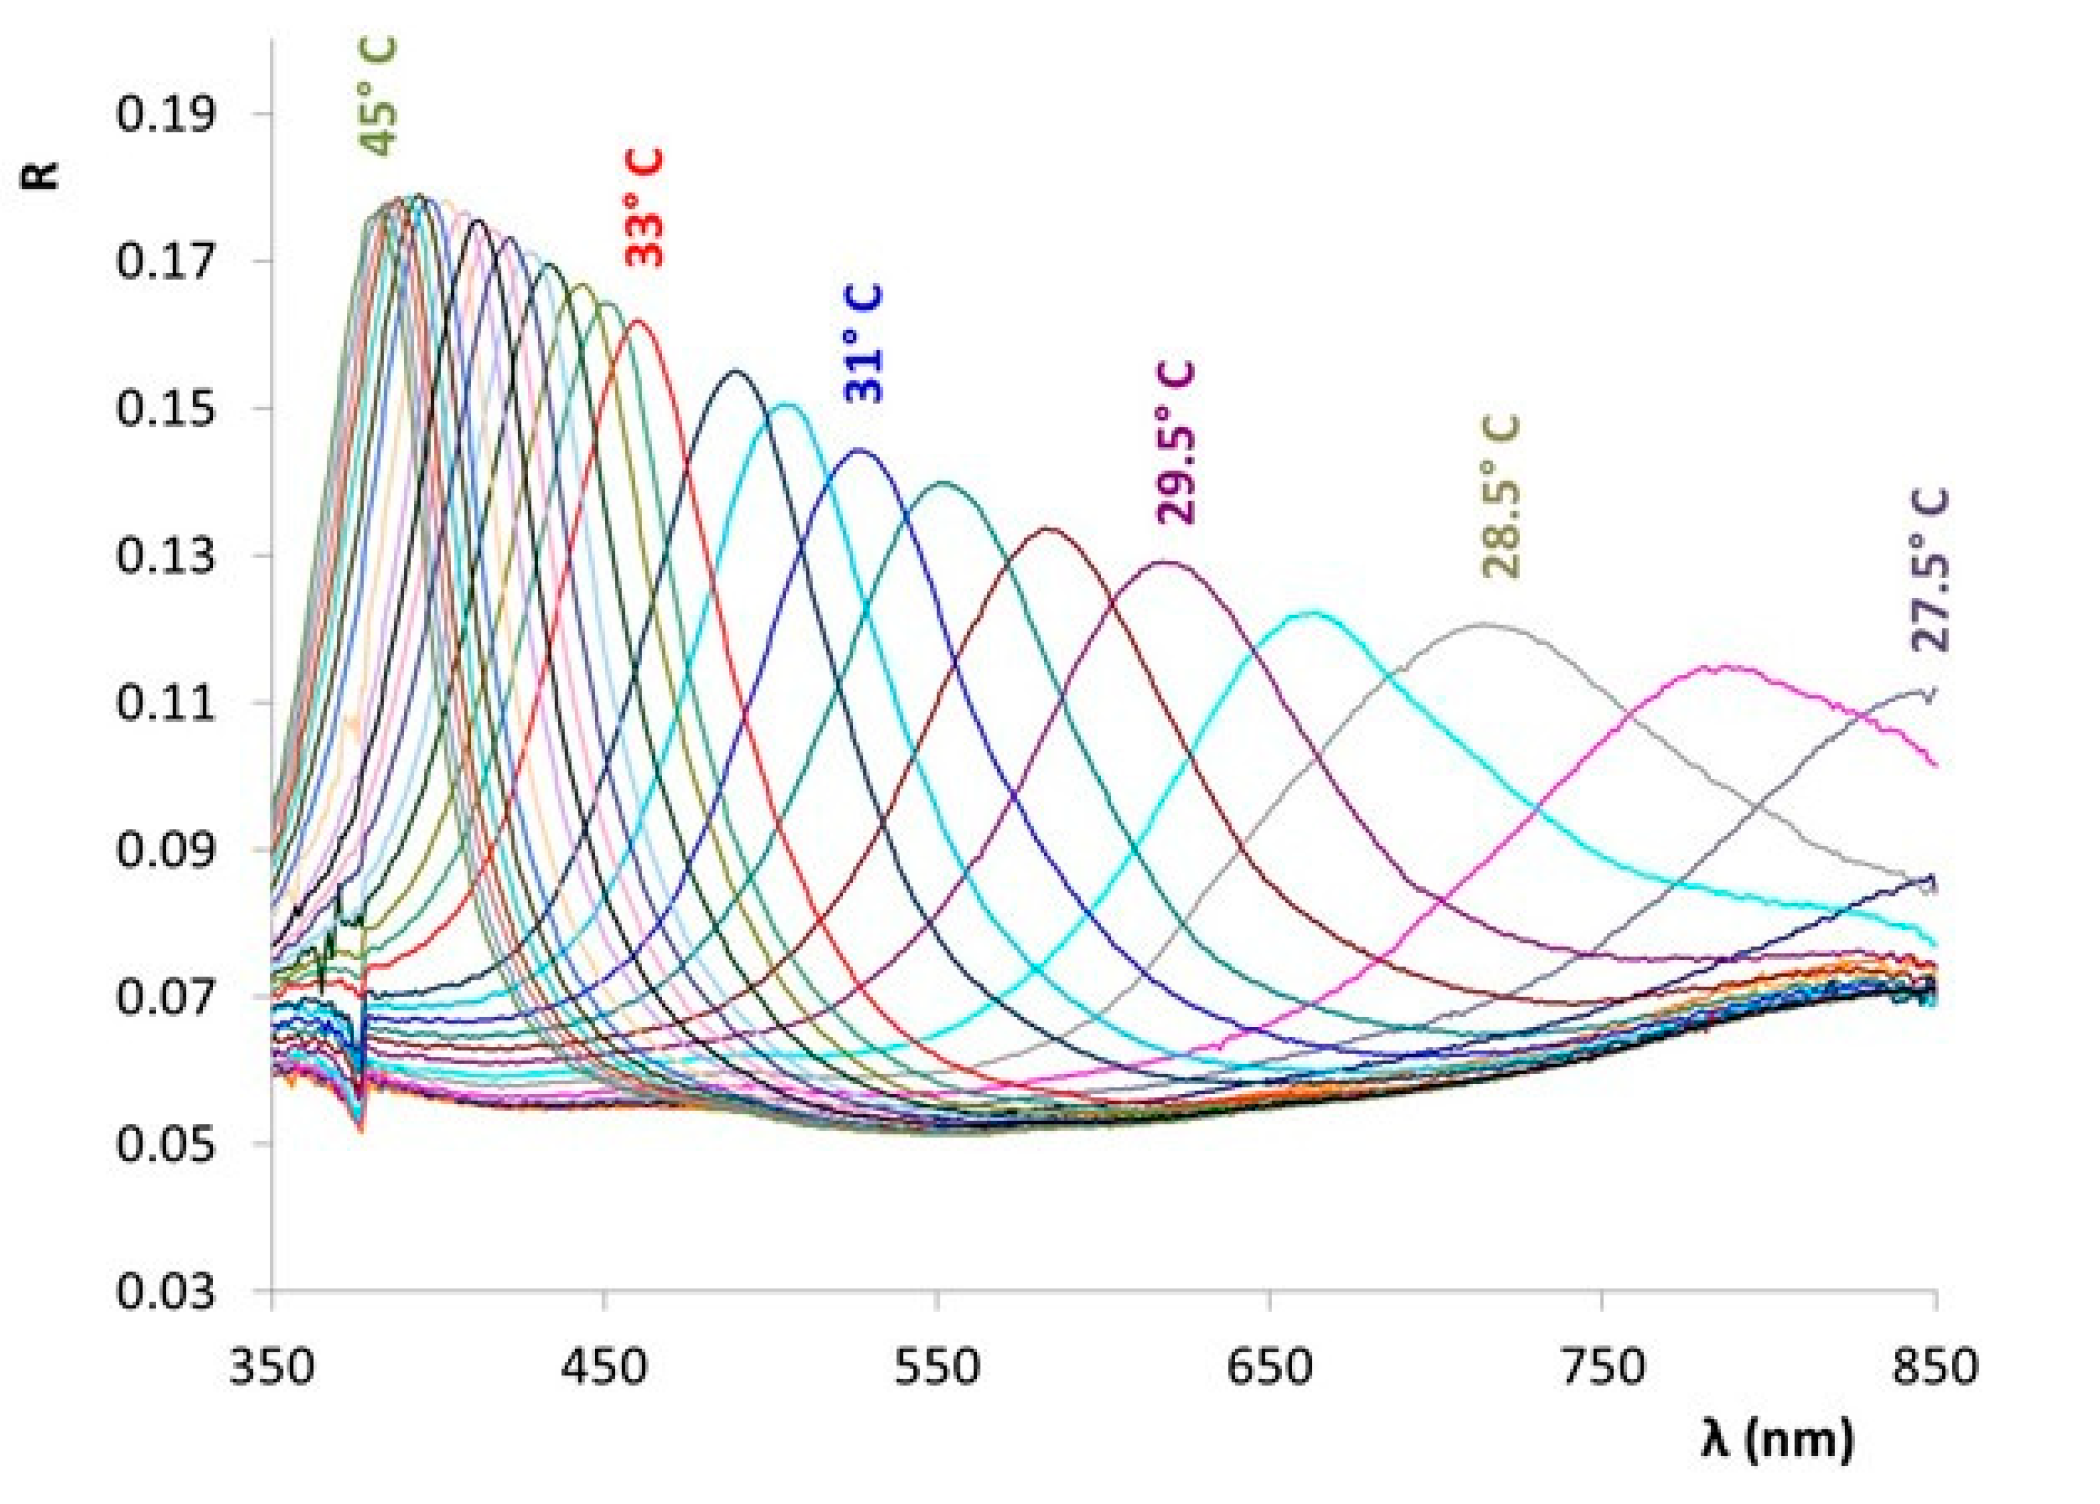
The reflectance spectra of the TLC samples prepared on black uncoated paper and measured with the Lambda 950 spectrometer are shown in
Figure 1. The spectral characteristic of the colour play effect is a single reflection peak that occurs when the functional material inside the “pigments” is in the chiral nematic/cholesteric phase. This peak moves across the visible range as a function of the temperature. In the example shown, the chiral nematic phase of the liquid crystalline material is formed at 27 °C, where a low and broad reflectance peak appears at the long wavelength limit of the visible (780 nm) (
Figure 1). At 28.5 °C, this peak shifts to 713 nm and the sample appears reddish. A further increase in temperature shifts the peak throughout the visible spectrum to shorter wavelengths, making it narrower and more intense. These changes are not linearly dependent on the temperature, so that the blue part of the spectrum remains visible most of the time. Here, the reflectance peak is the narrowest, highly intense, and necessitates more heating to shift to even smaller wavelengths. This corresponds to the visual perception of the sample—its appearance is very distinctly blue and remains as such over the widest temperature range. As the temperature rises above 46 °C, the peak shifts outside of the visible region (below 380 nm) and disappears completely above 75 °C, because the TLC turns into isotropic liquid. This temperature is commonly referred to as the clearing point [
7]. It is important to note, however, that the result we obtained is higher than 44 °C as declared by the producer. Therefore, in the studied TLC, both activation and clearing temperatures are outside of the visible spectral range and the activation range is wider than visible.
Figure 1 presents the spectra with reflectance peak positioned inside the visible spectral range.
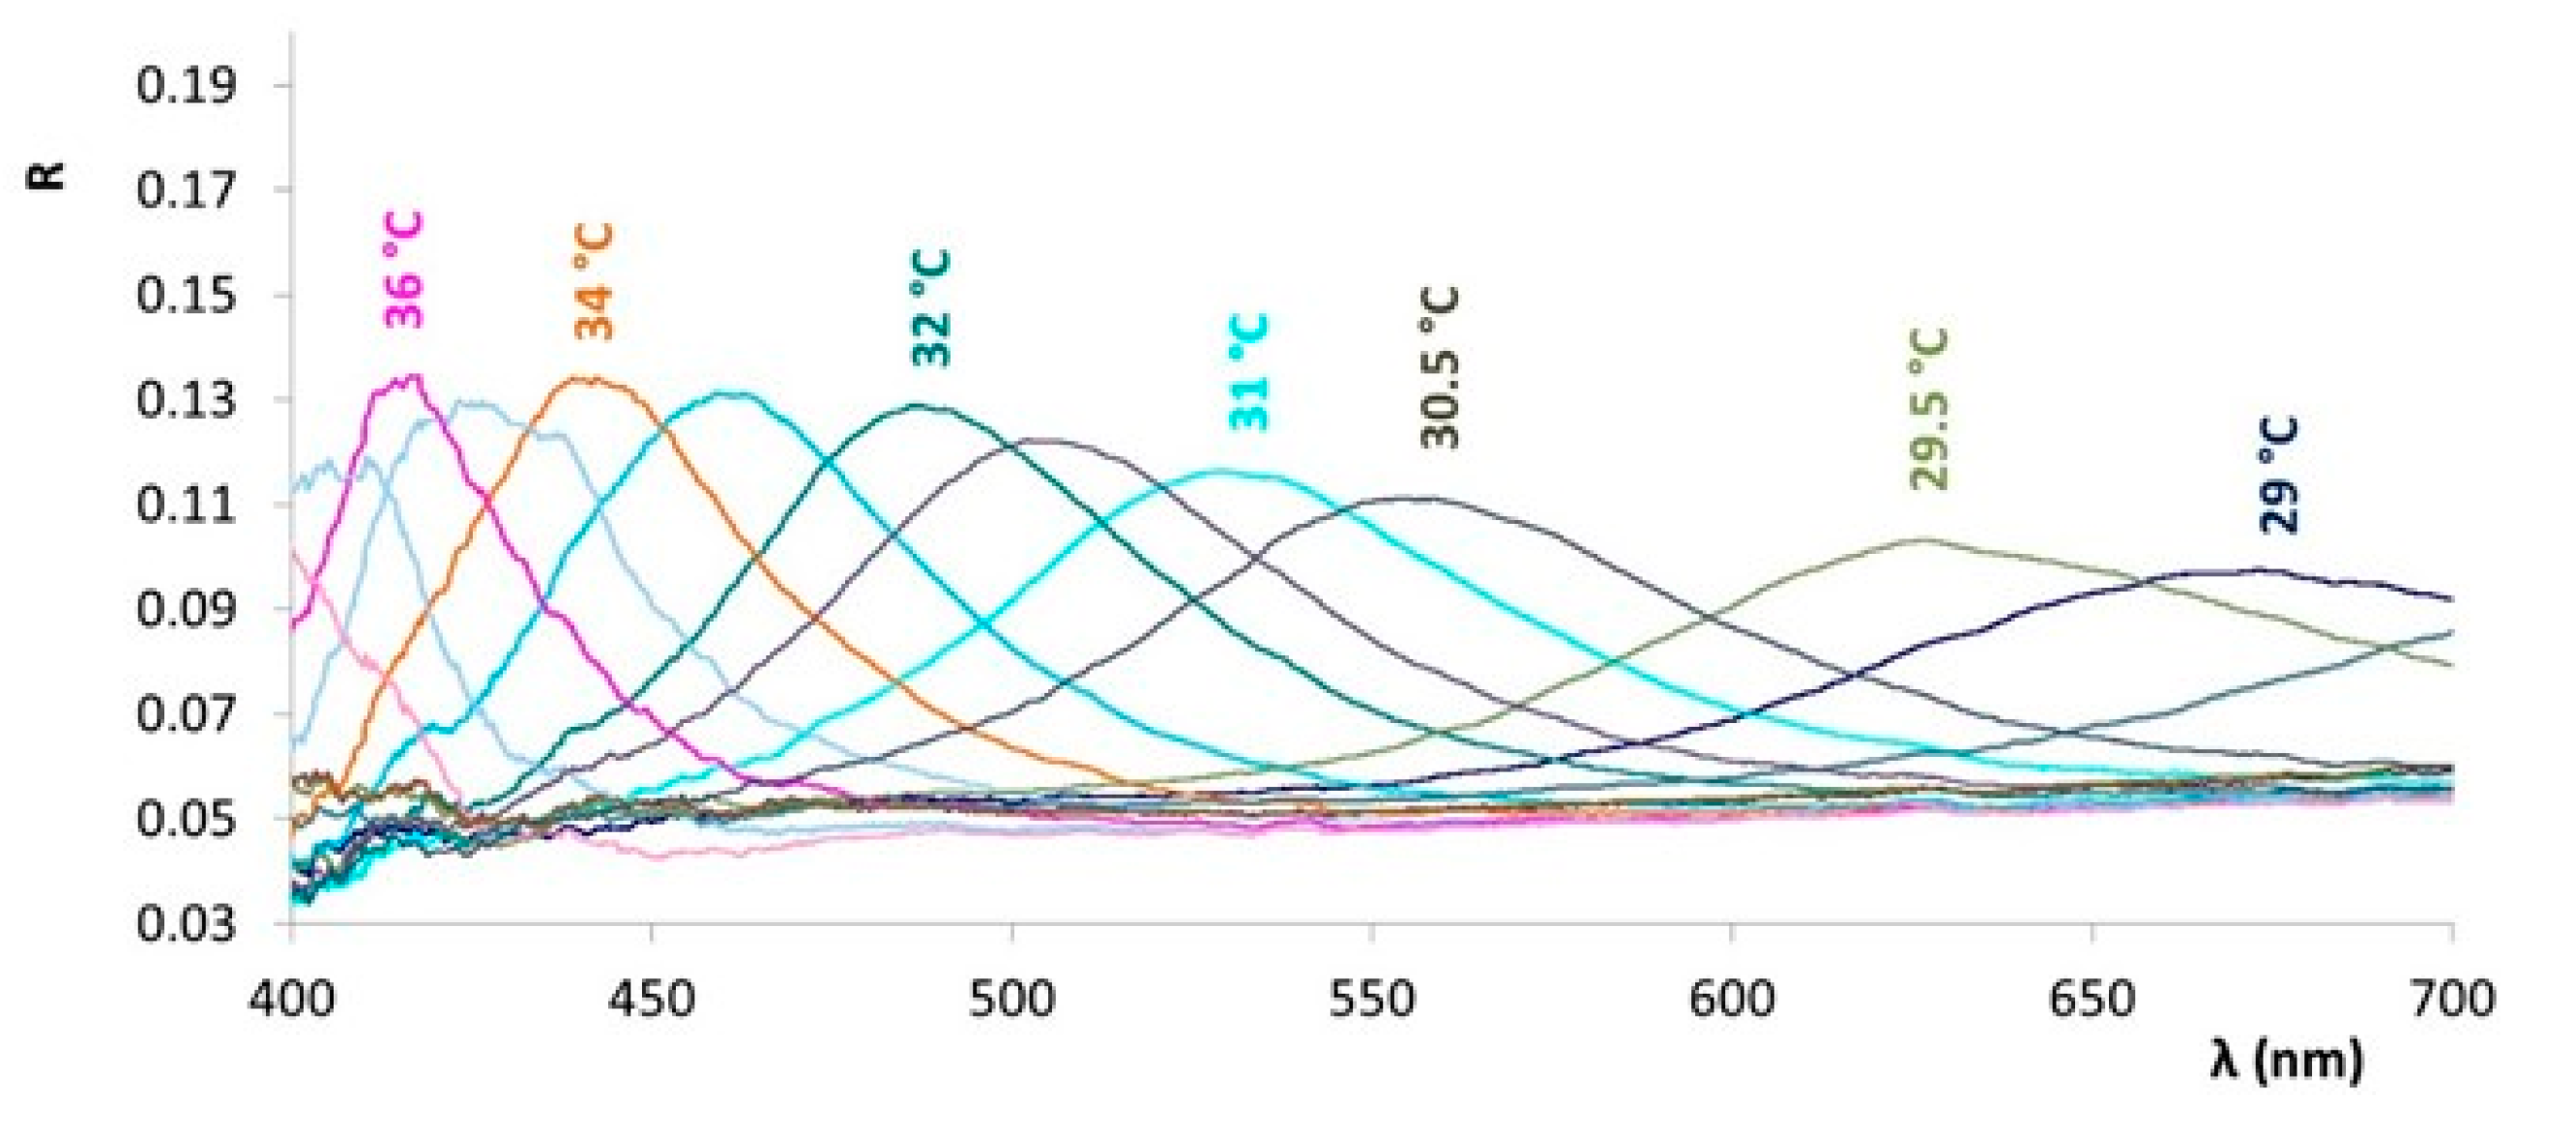
The same sample was also measured with the fibre-optic spectrometer, and the obtained spectra are shown in
Figure 2. The results are slightly different from those measured with the Lambda 950 spectrometer (
Figure 1), but the basic characteristics of the reflection appear very similar in measurements performed with both instruments.
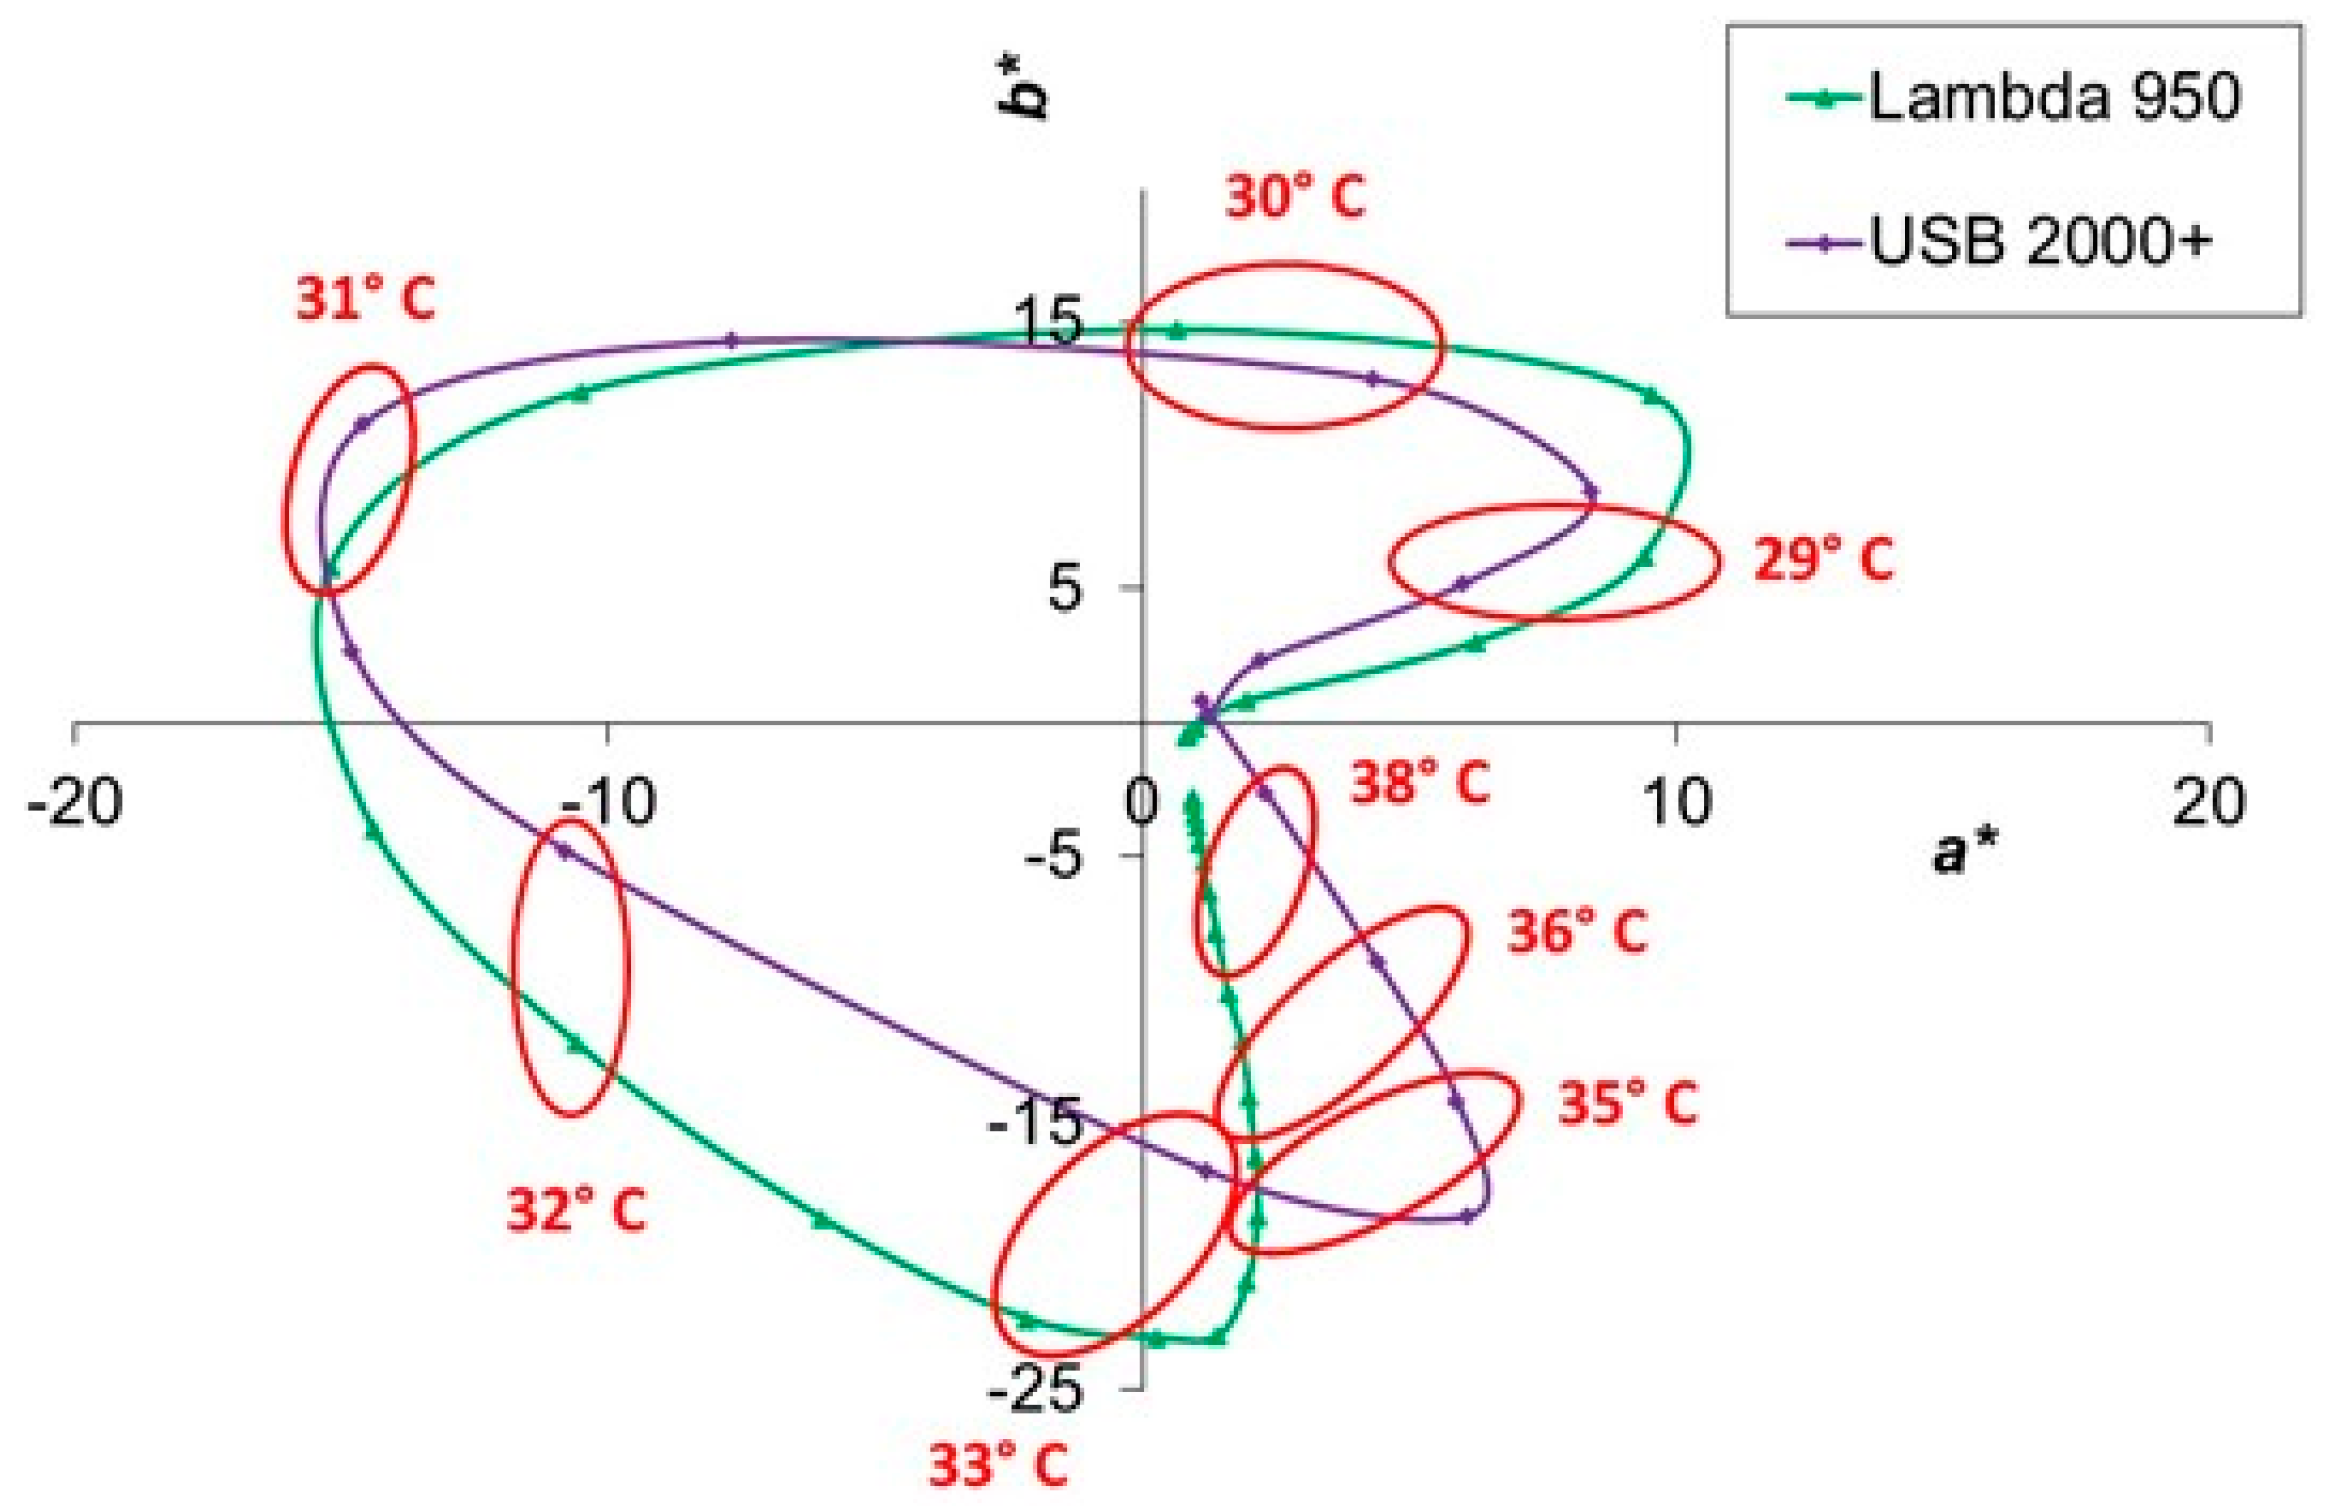
More commonly applicable results were investigated by colorimetric analysis, as shown in
Figure 3. The CIELAB colour values were calculated from the corresponding reflectance spectra measured on the same sample with both spectrometers (
Figure 1 and
Figure 2). The red-green (
a*) and yellow-blue (
b*) values start and end at almost the same points of the (
a*,
b*) graph, showing the colour of the sample in isotropic phase of the TLC, where no colour is developed. At intermediate temperatures, where the chiral-nematic/cholesteric phase produces the single reflection peak, the entire loop is formed, exhibiting the thermochromic effect. Similar loops were obtained for both measurements. However, some differences do occur, especially in green and blue part of the CIELAB colour space. We assume that these differences are attributable to different measuring equipment used, specifically by the amount of light available in the short wavelength spectral region and the characteristics of the integrating sphere used in both spectrometers. In addition, the fibre-optic spectrometer USB 2000+ (Ocean Optics, Orlando, FL, USA) was used to measure lesser temperature values.
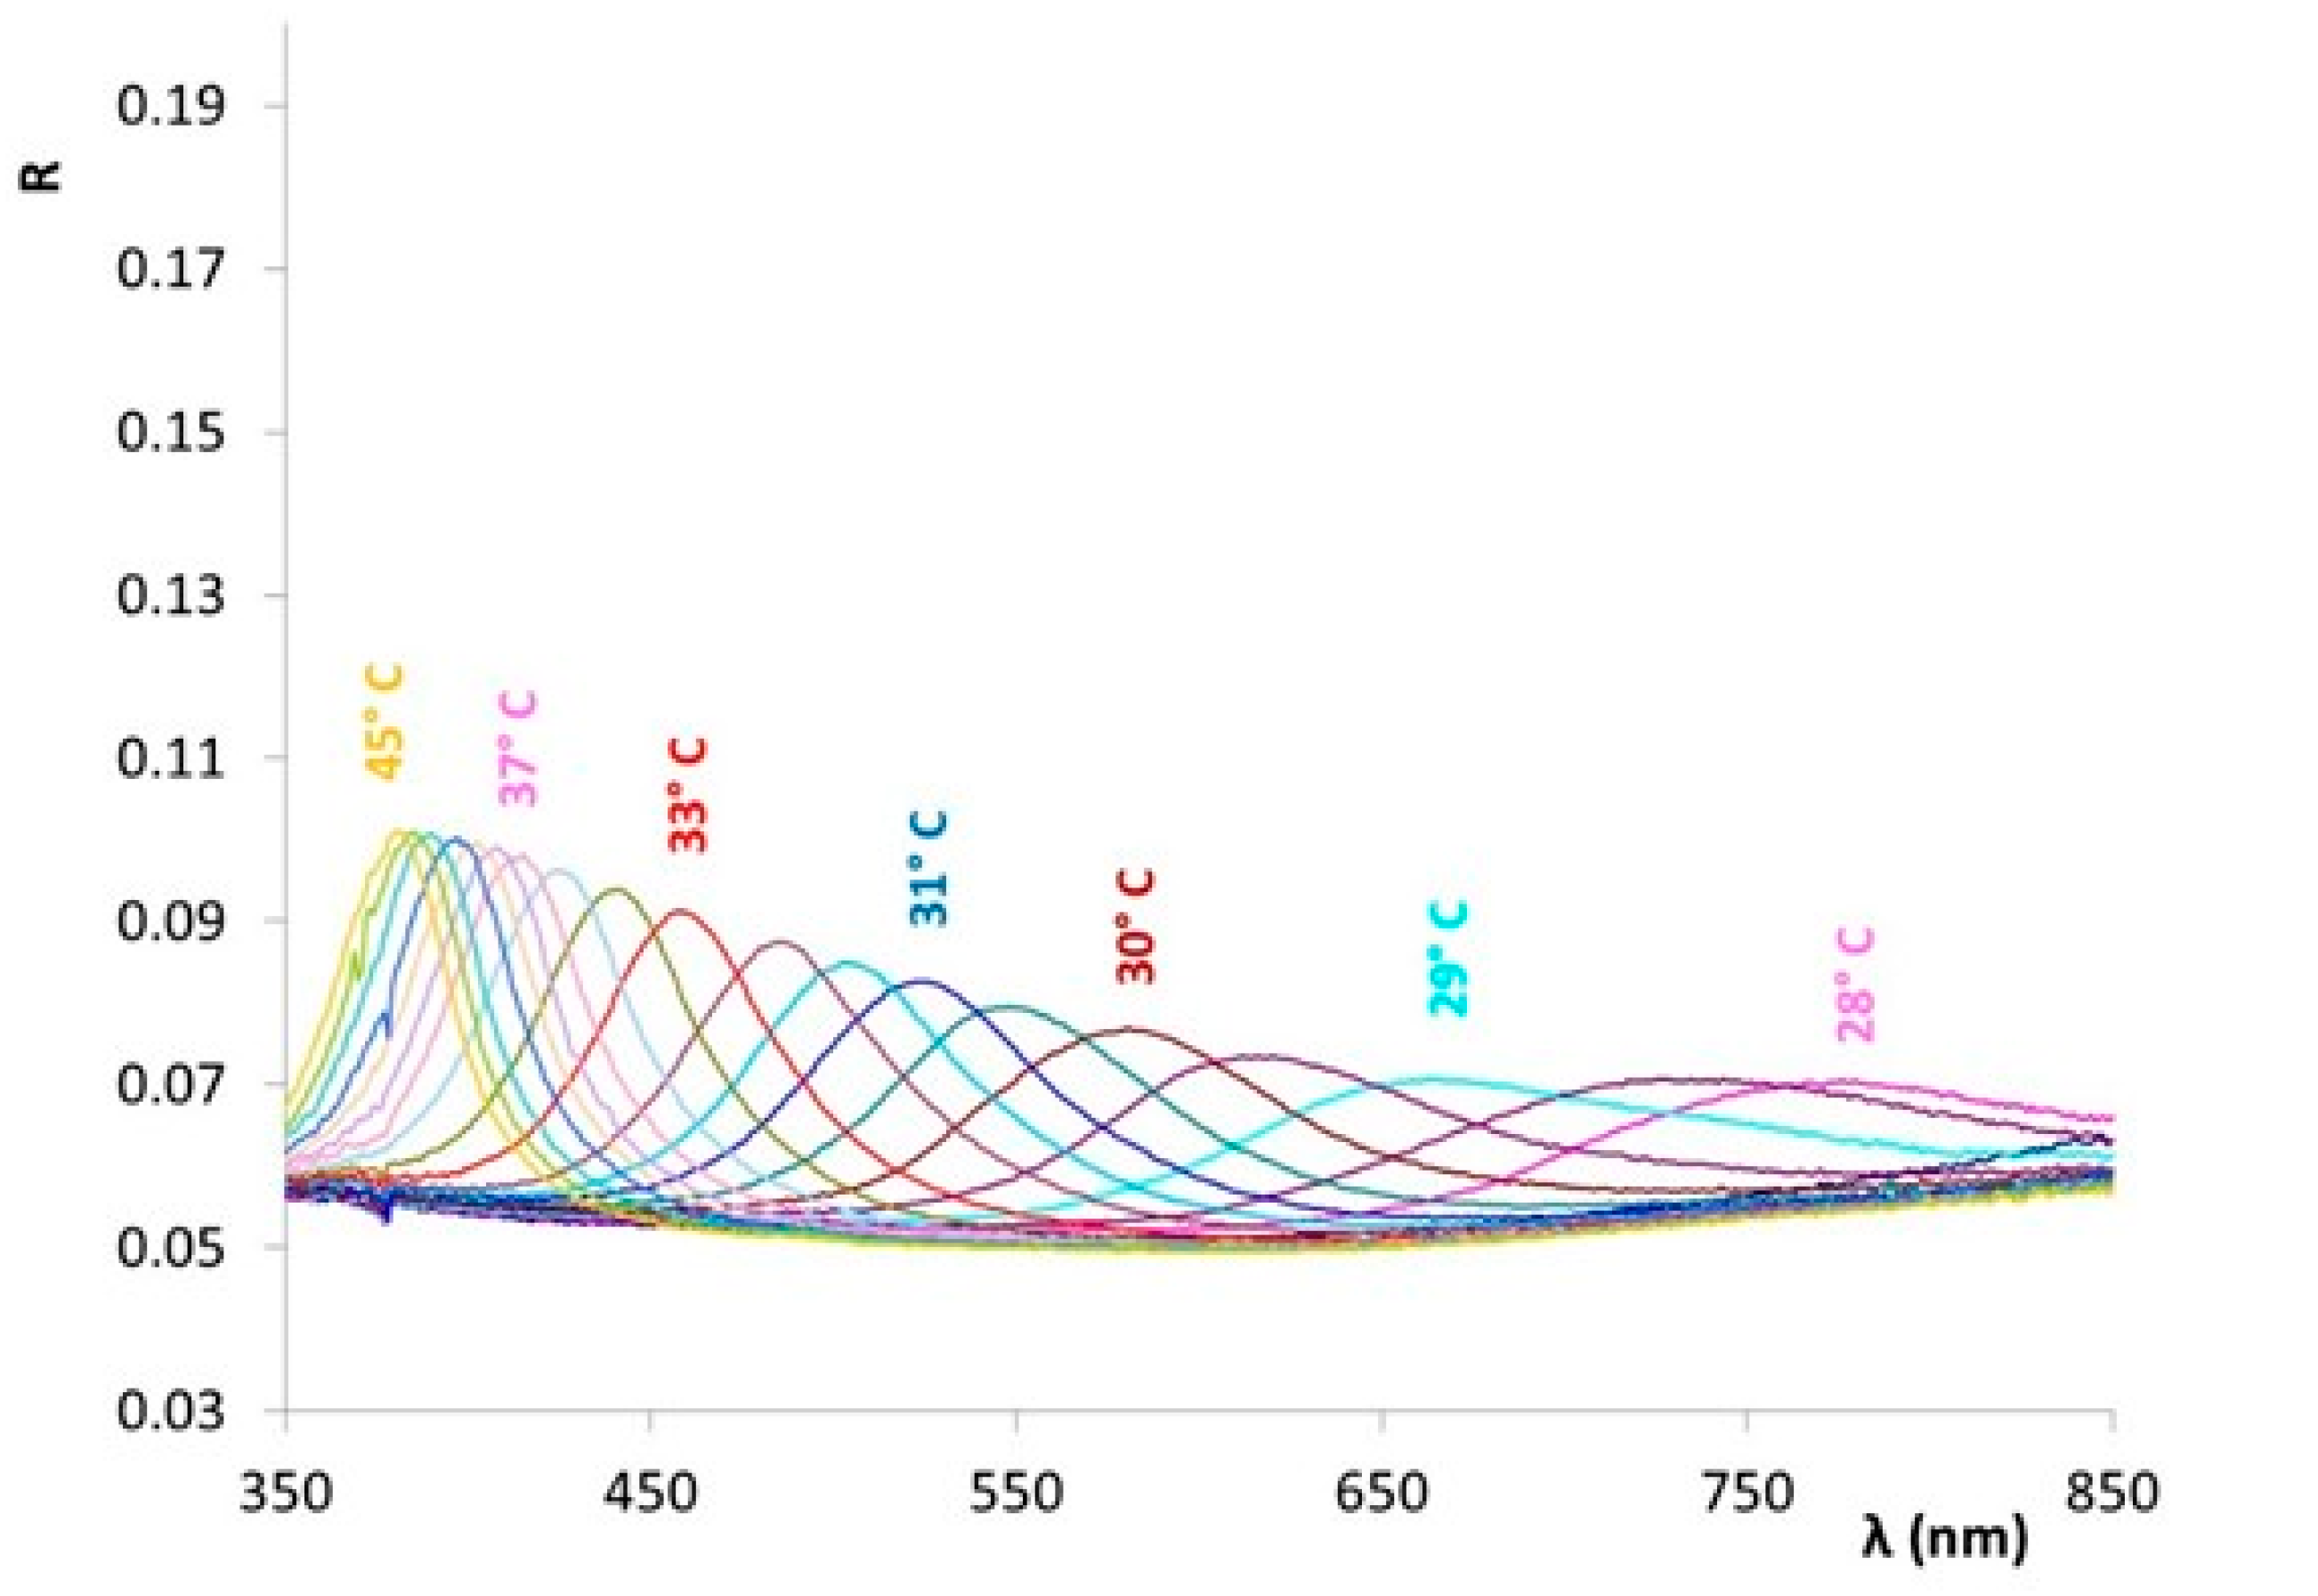
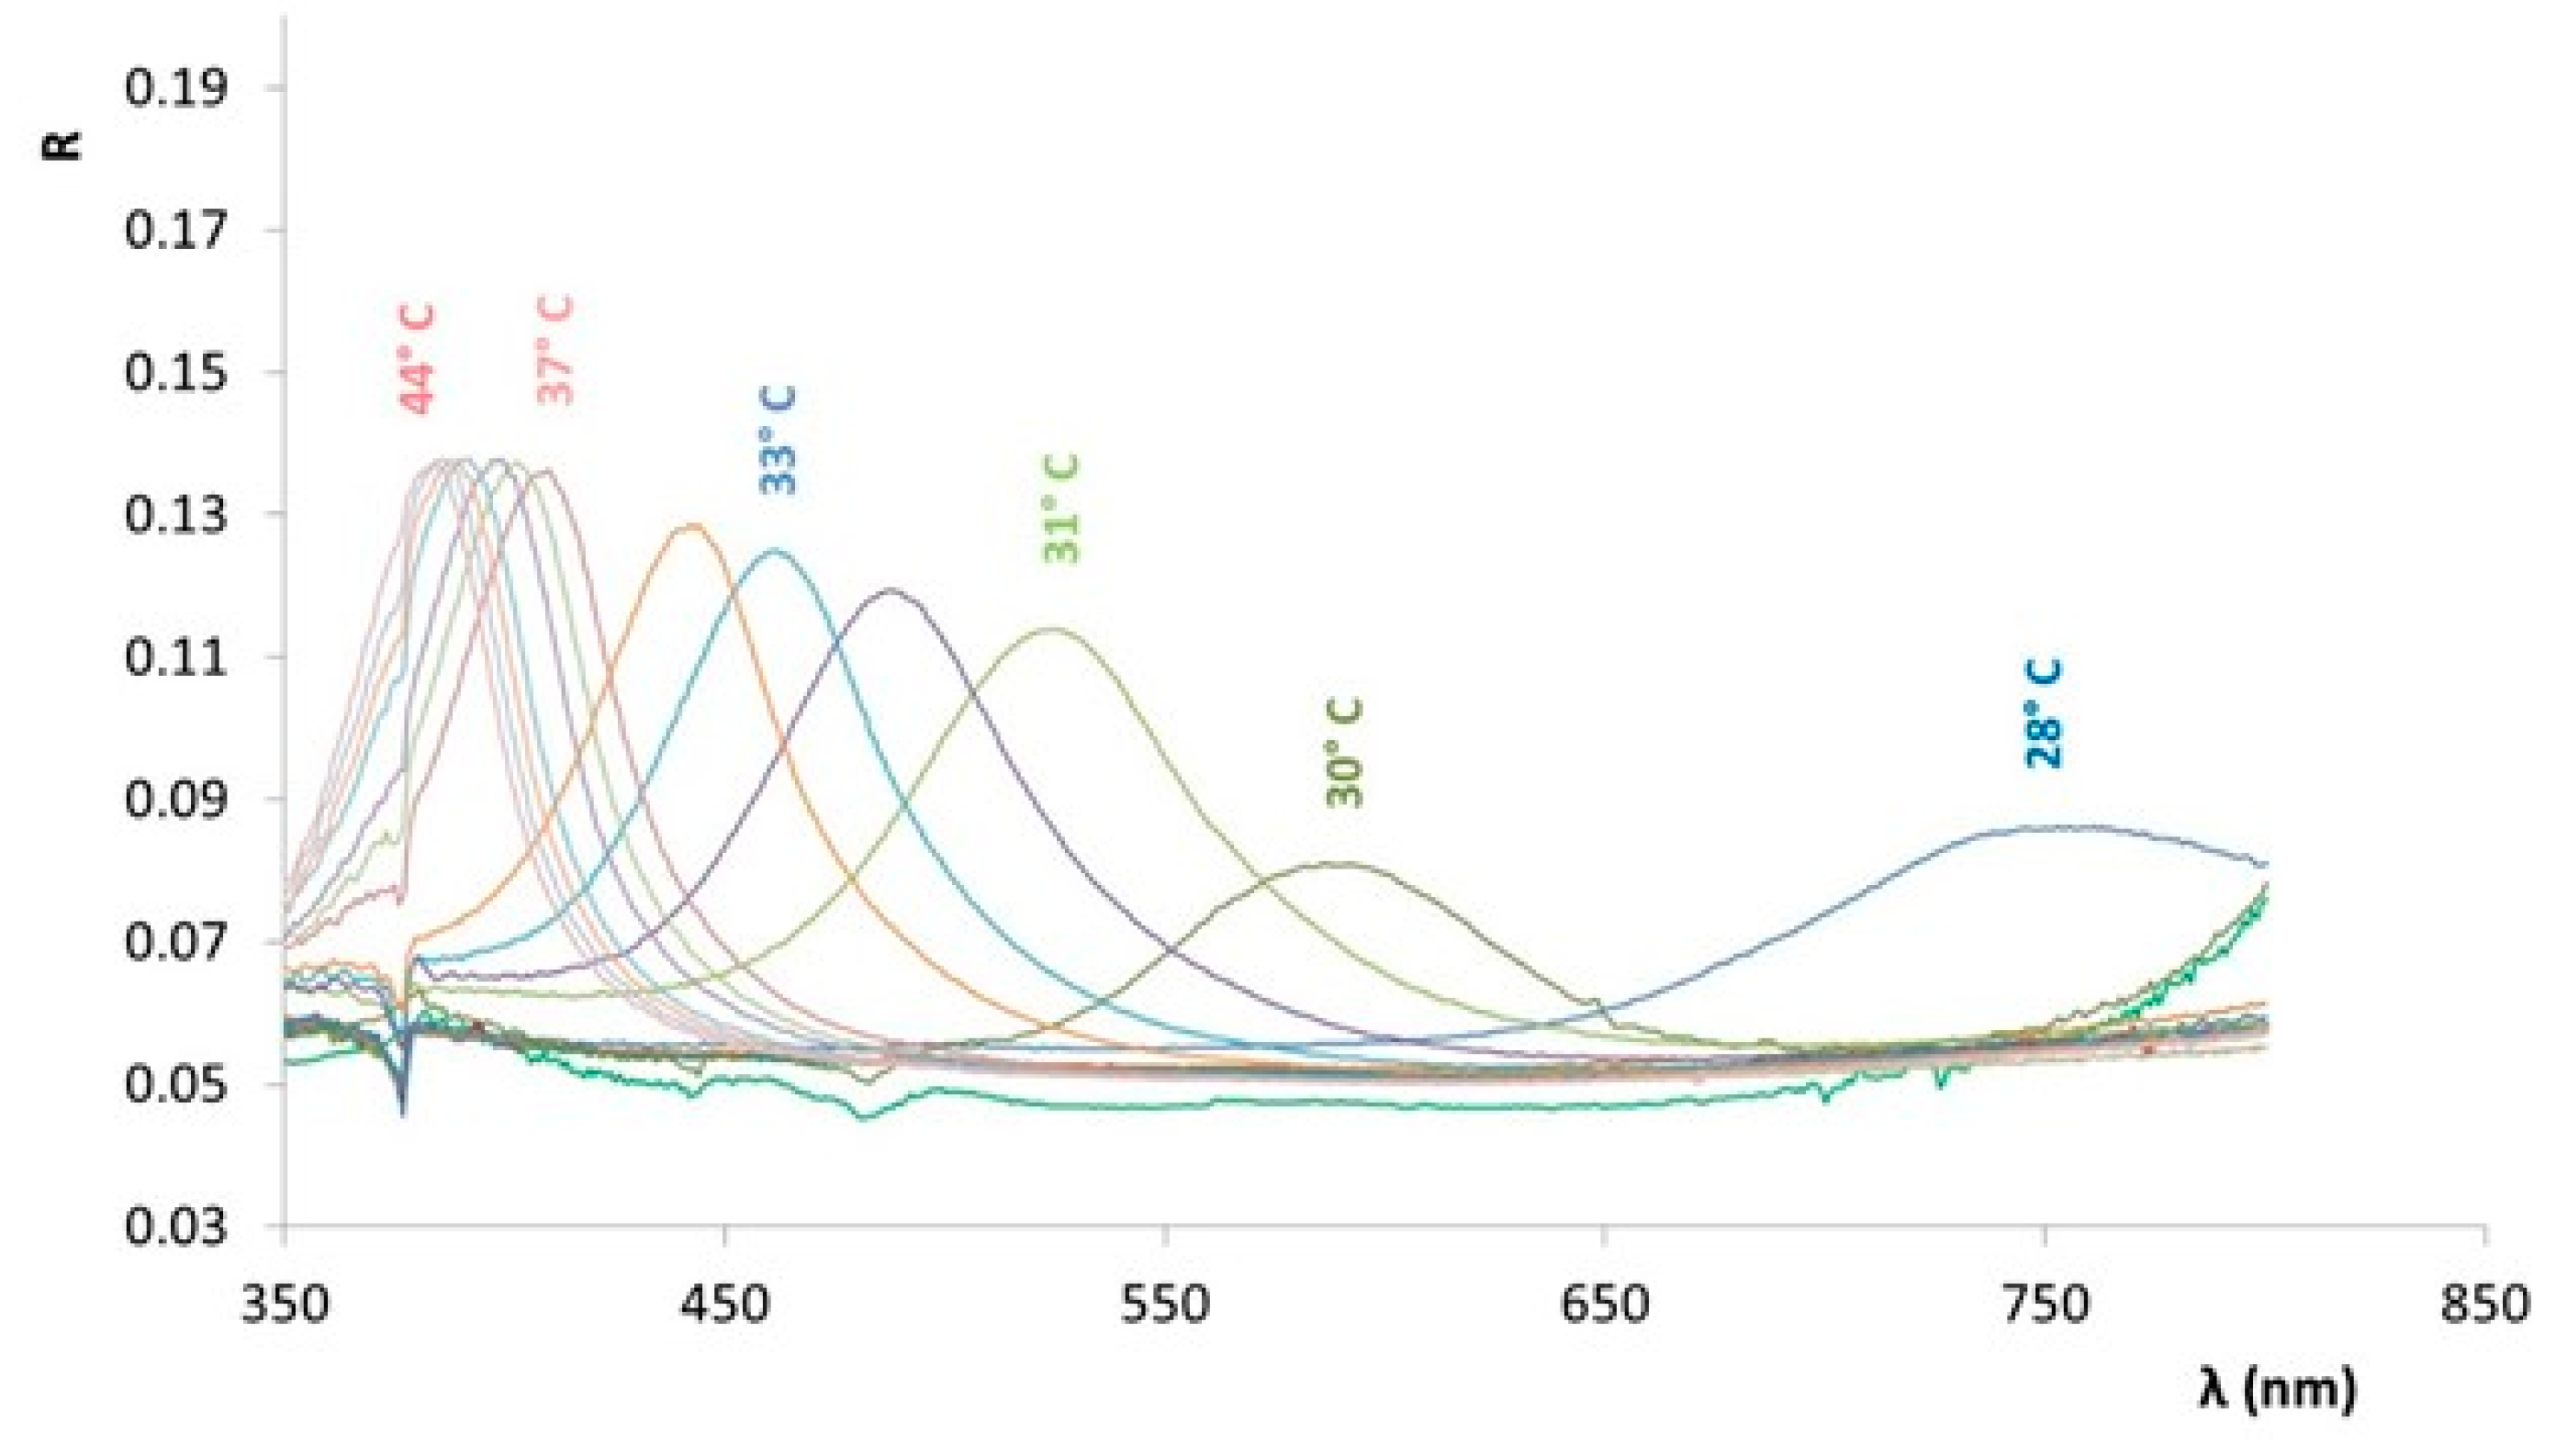
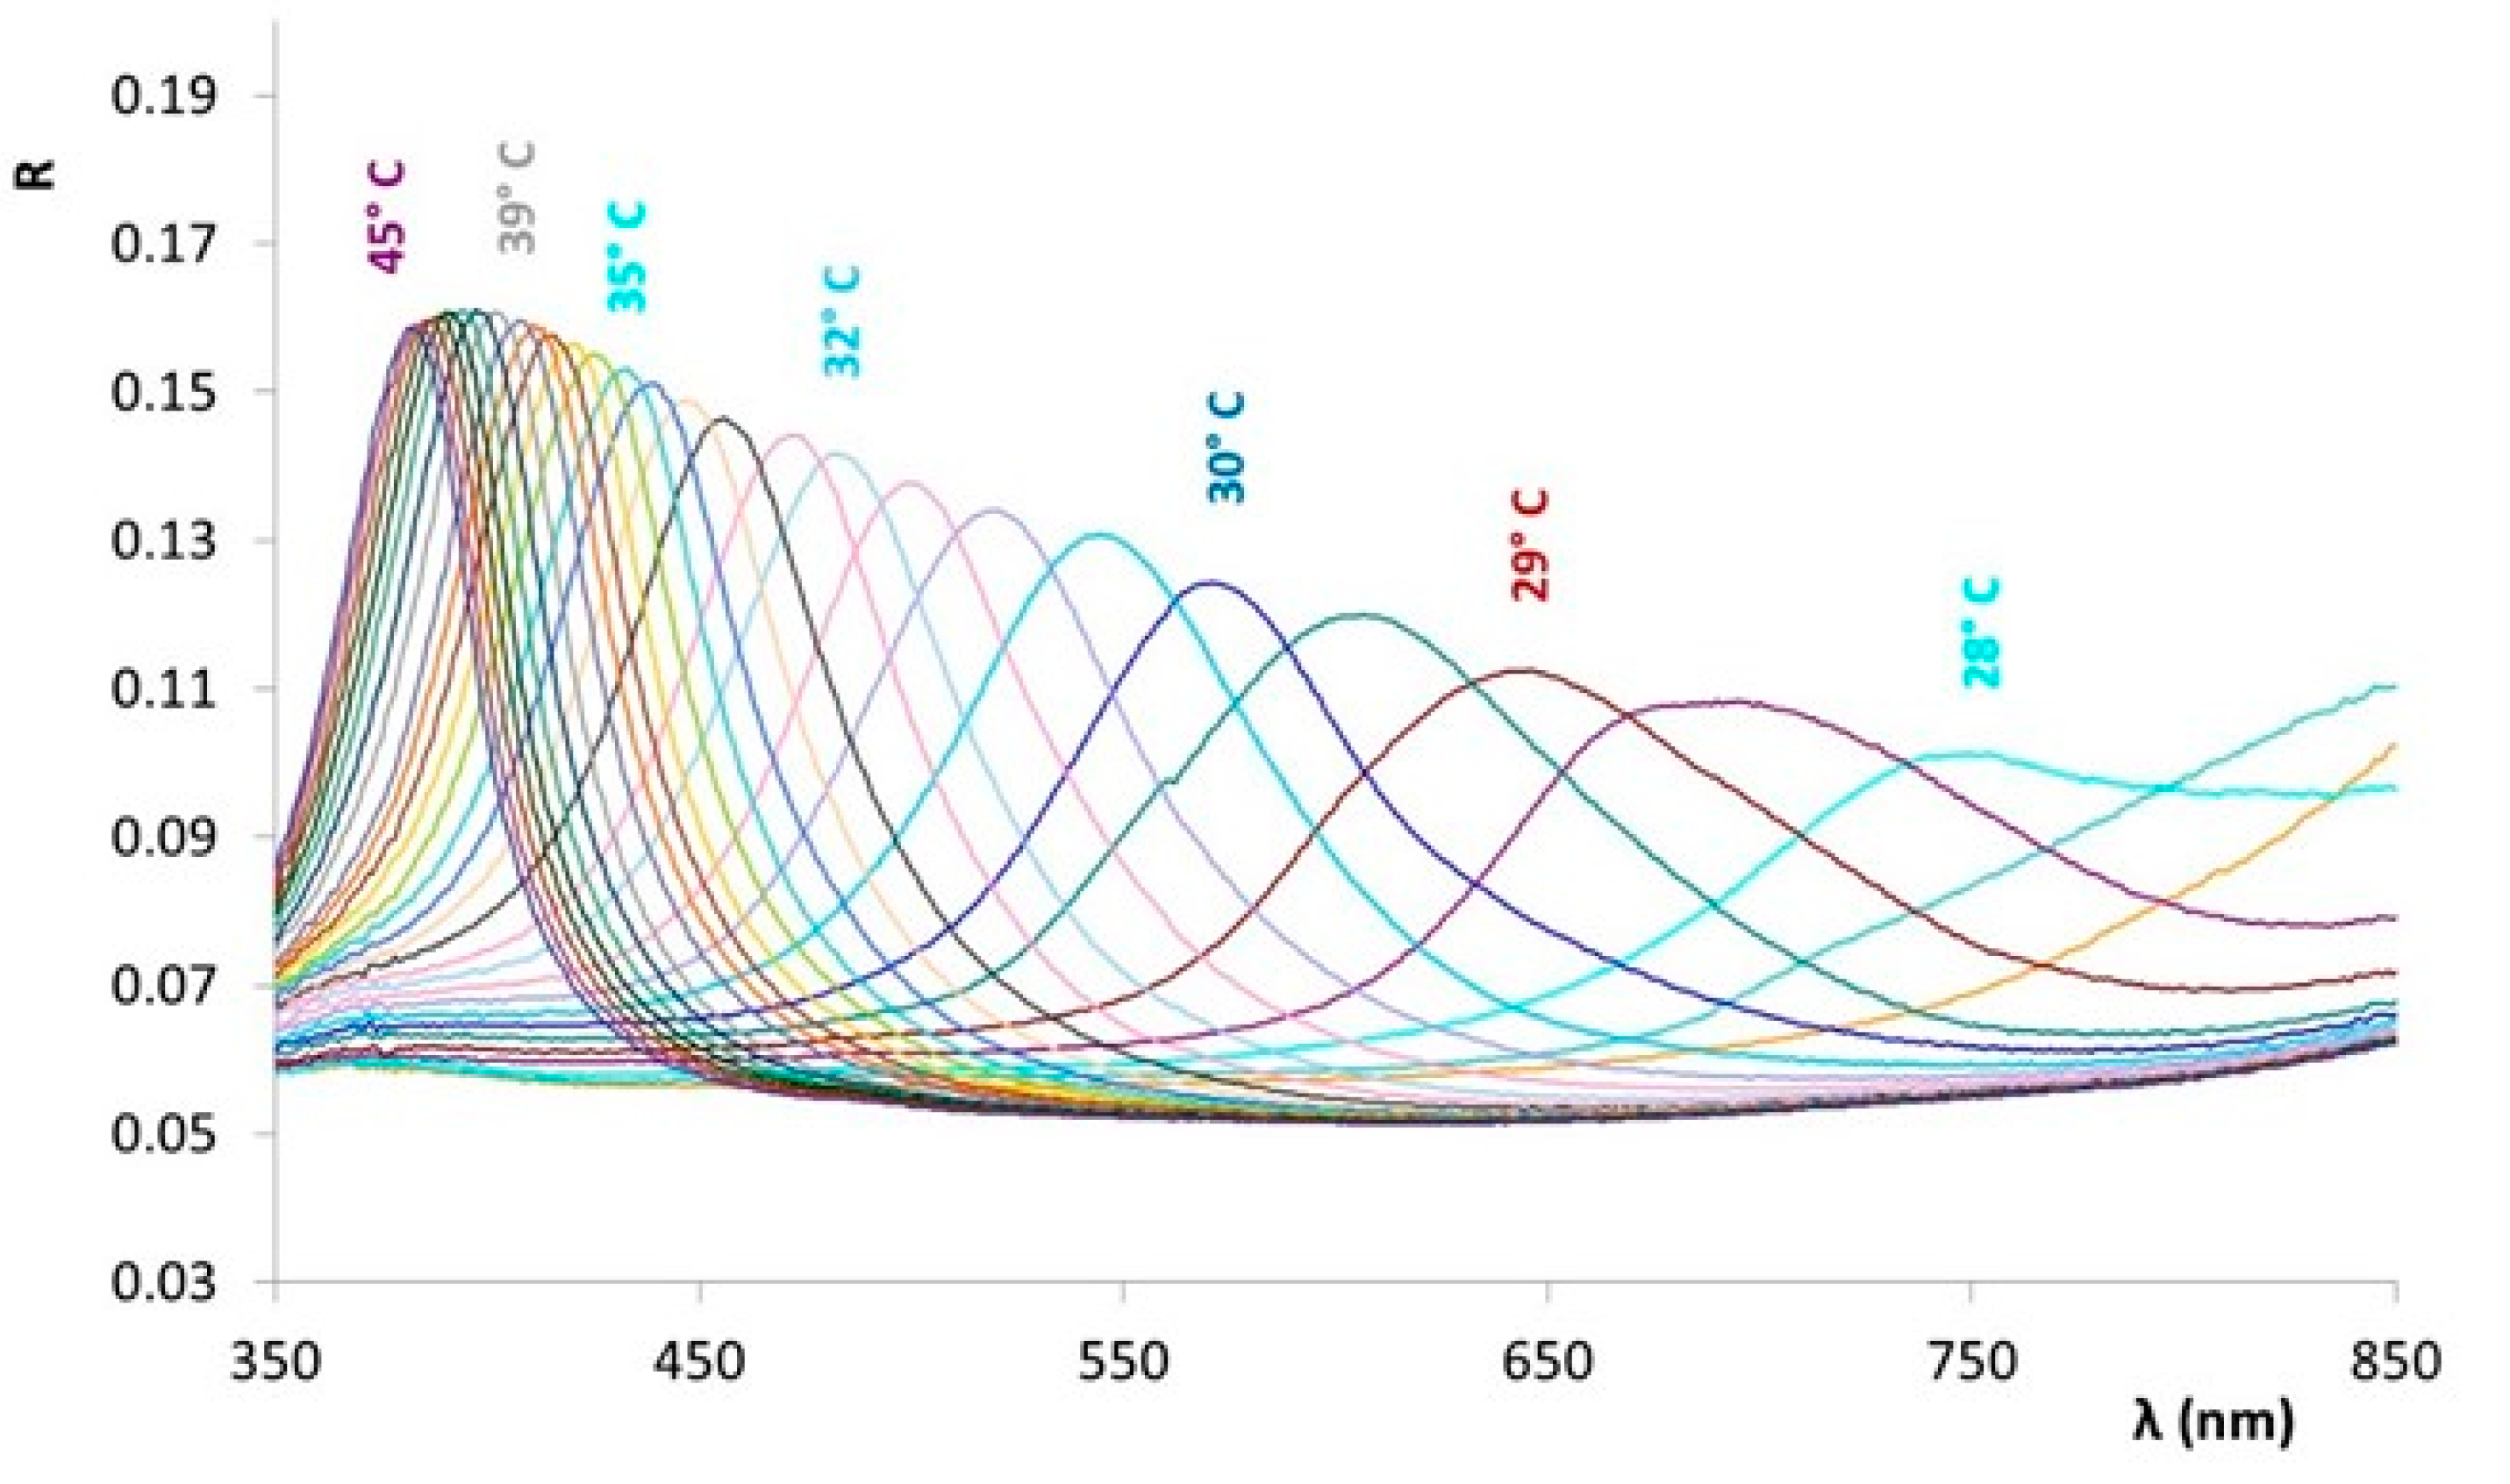
The optical effects of the TLC ink were further analysed as a function of layer thickness. Test samples were prepared by applying single-, double- and triple-printed TLC layers on the coated black paper. The thickness of these samples, as measured by micrometre were 27.6, 34.2 and 46.8 µm for single-, double-, and triple-printed samples, respectively.
The reflectance spectra of these three samples, measured with the Lambda 950 spectrometer, are shown in
Figure 4,
Figure 5 and
Figure 6. In general, the intensity of the reflection peak is the lowest for the single-printed sample (
Figure 4) and the highest for the triple-printed one (
Figure 6). More specifically, the highest reflectance peak (0.10) was demonstrated at 45 °C for the single-printed layer, the value of 0.13 appeared in the double-printed one at 39 °C and increased to 0.16 in the triple-printed sample at 41 °C. Thicker layers contain more thermochromic pigments, resulting in a stronger optical effect.
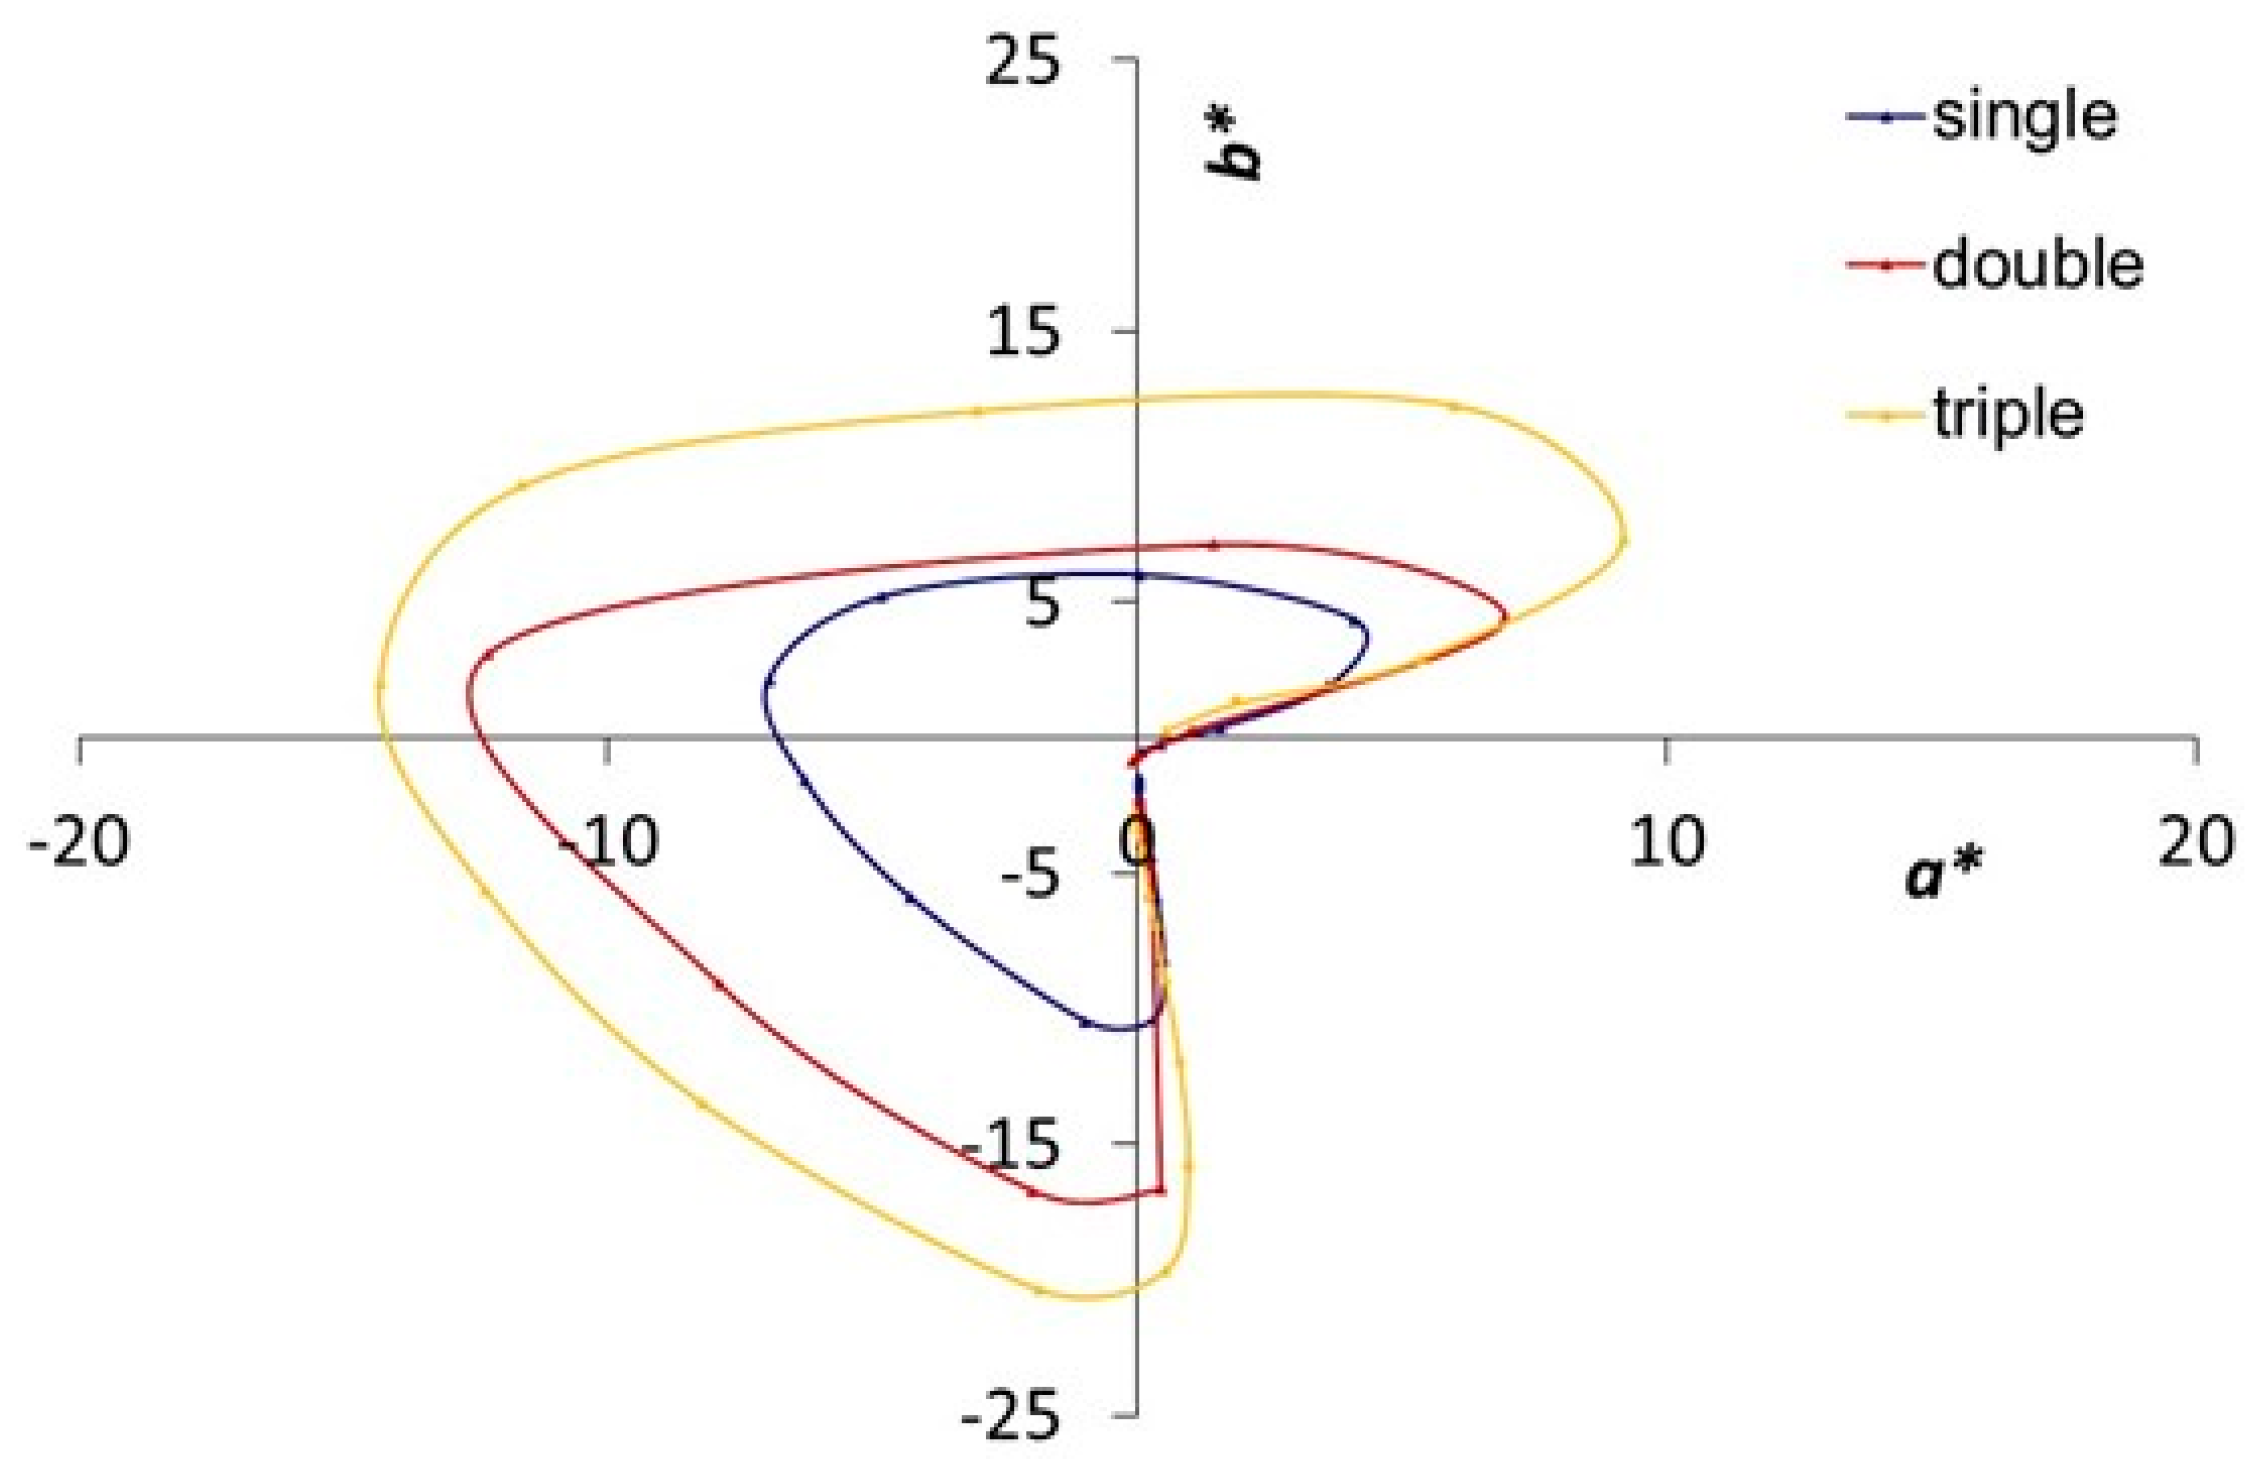
These measurements were evaluated in CIELAB colour space using the (
a*,
b*) plot (
Figure 7). The full loop was obtained for all three samples. As expected, the colour play effect is the faintest for the single-printed sample and the strongest for the triple-printed one. This is shown by difference in size of the corresponding colour loops in the (
a*,
b*) plot. The differences between the three samples are the greatest in the green-blue part (
a* < 0), where they occur for all the temperatures in the corresponding range. In addition, the triple-printed sample also yields substantial effects in the yellow (
b* > 0) parts of the (
a*,
b*) graph (
Figure 7).
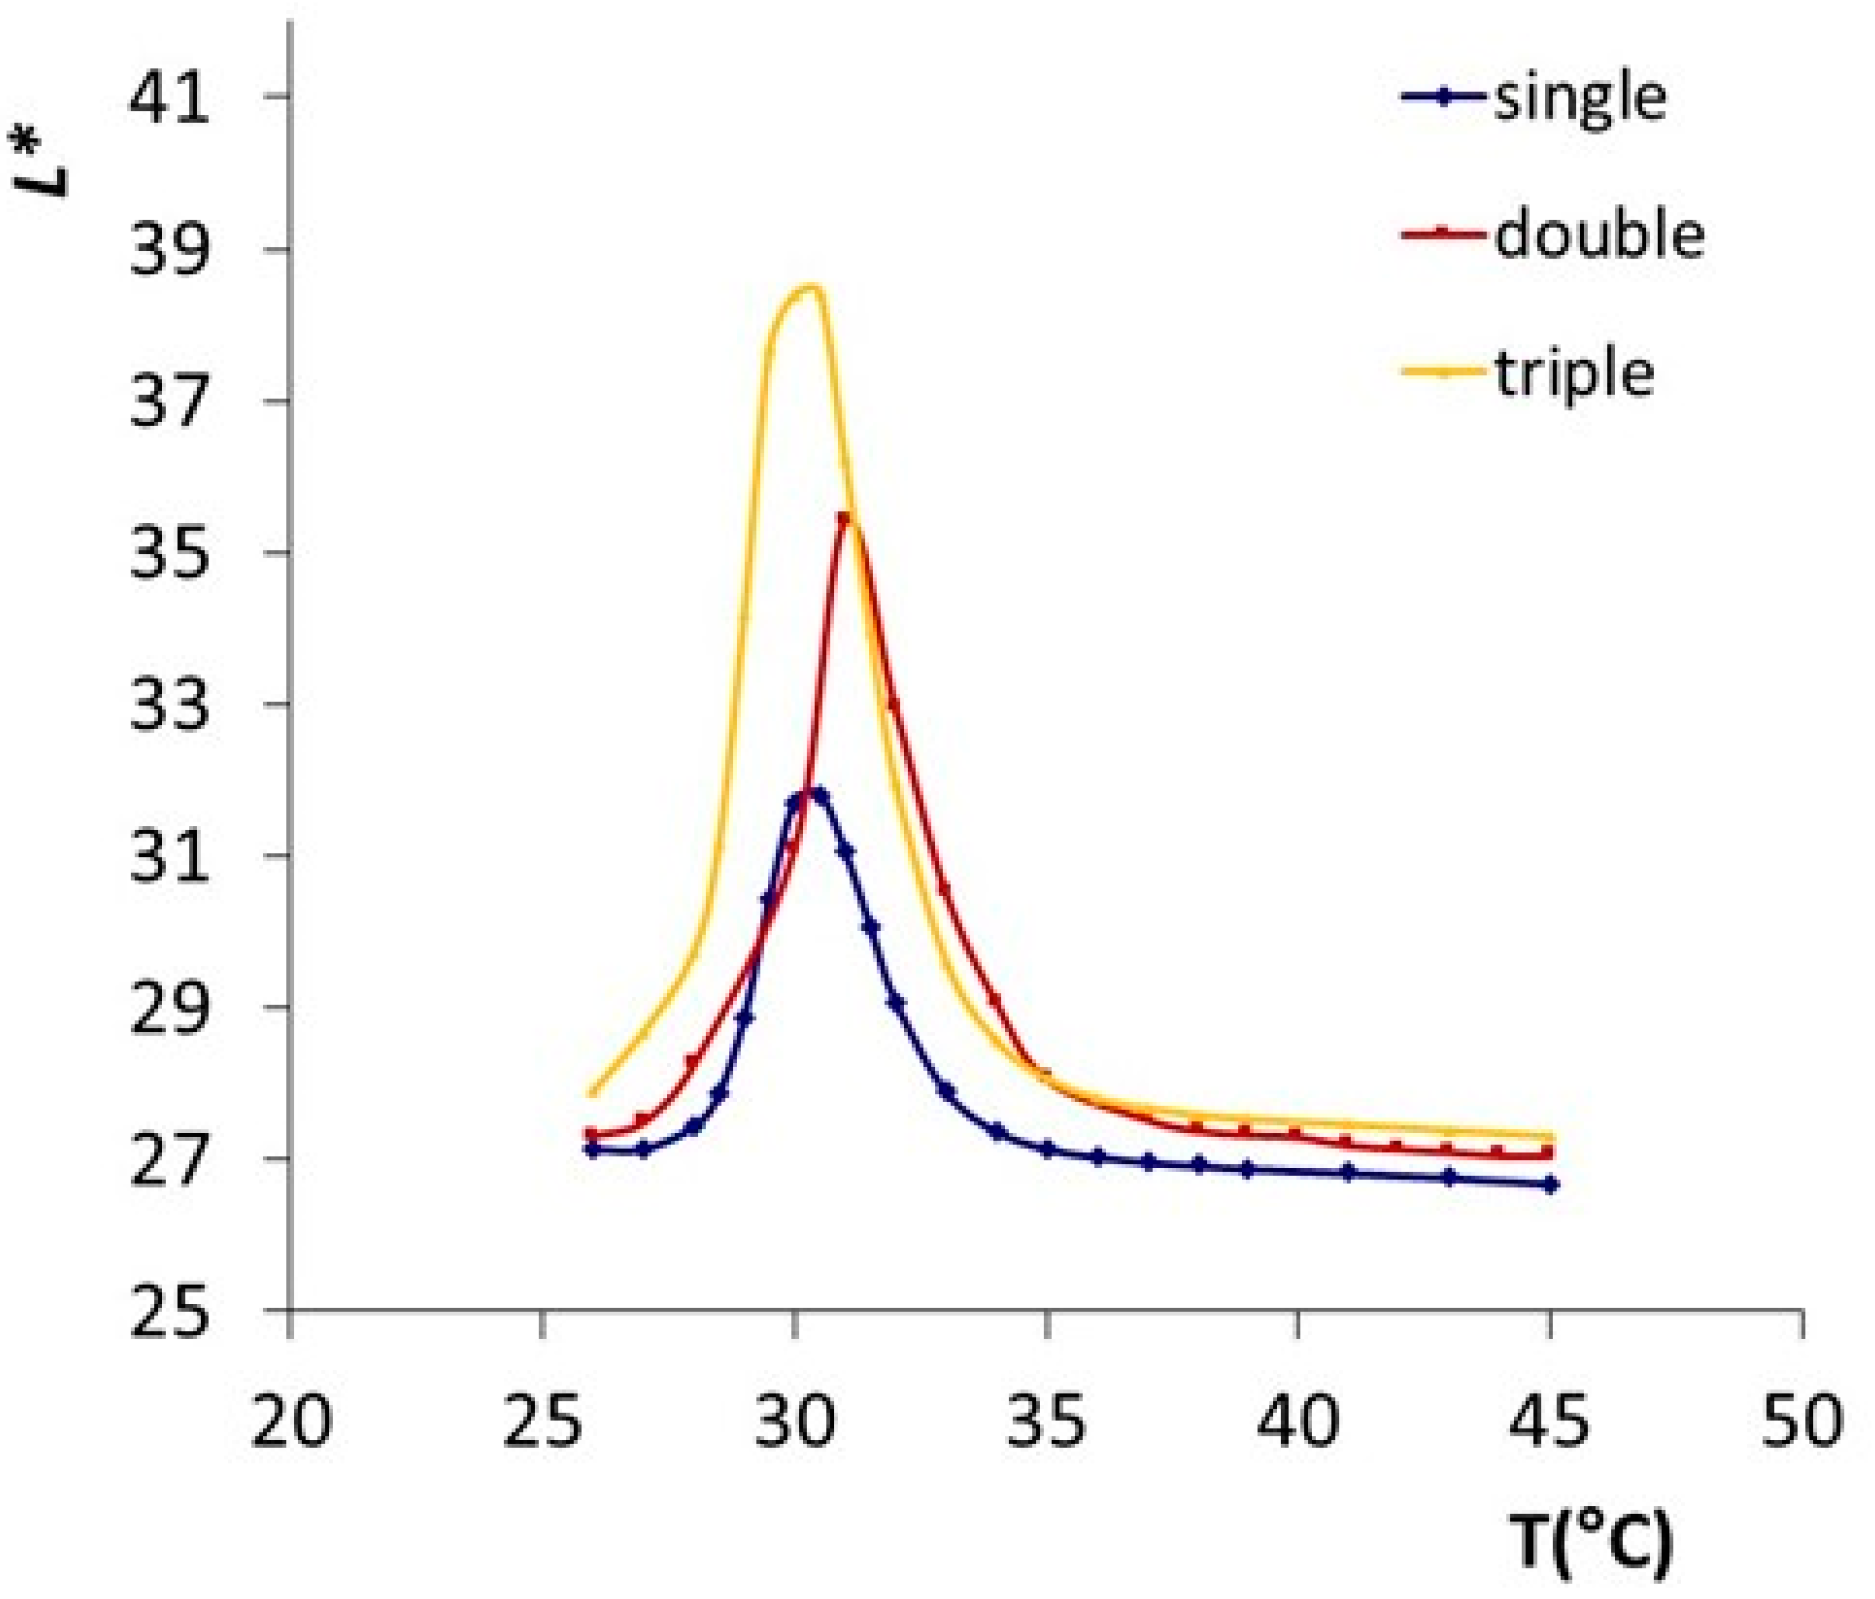
The CIELAB colour values include
a* (red-green),
b* (yellow-blue), and
L* (lightness) values. The
a* and
b* values were analysed by (
a*,b*) plots (
Figure 3 and
Figure 7), while
L* is examined by the
L*(T) plot (
Figure 8). Each curve extends from 27 to 45 °C, where the reflection peak appears in visible, justifying the colorimetric measurements within this range. A single maximum occurs in each
L*(T) curve in the green region, where the colour has the highest lightness
L* (
Table 1). The effect is nearly proportional to the thickness of the TLC layer, corresponding to the larger amount of the thermochromic material. At the temperature of 35 °C, the
L*(
T) reaches the peak for single- and triple-printed samples, but for the double-printed one, it differs by 0.5 °C, reaching the peak at 31 °C (
Table 1). This minute difference could be explained by possible incongruities during measurement.
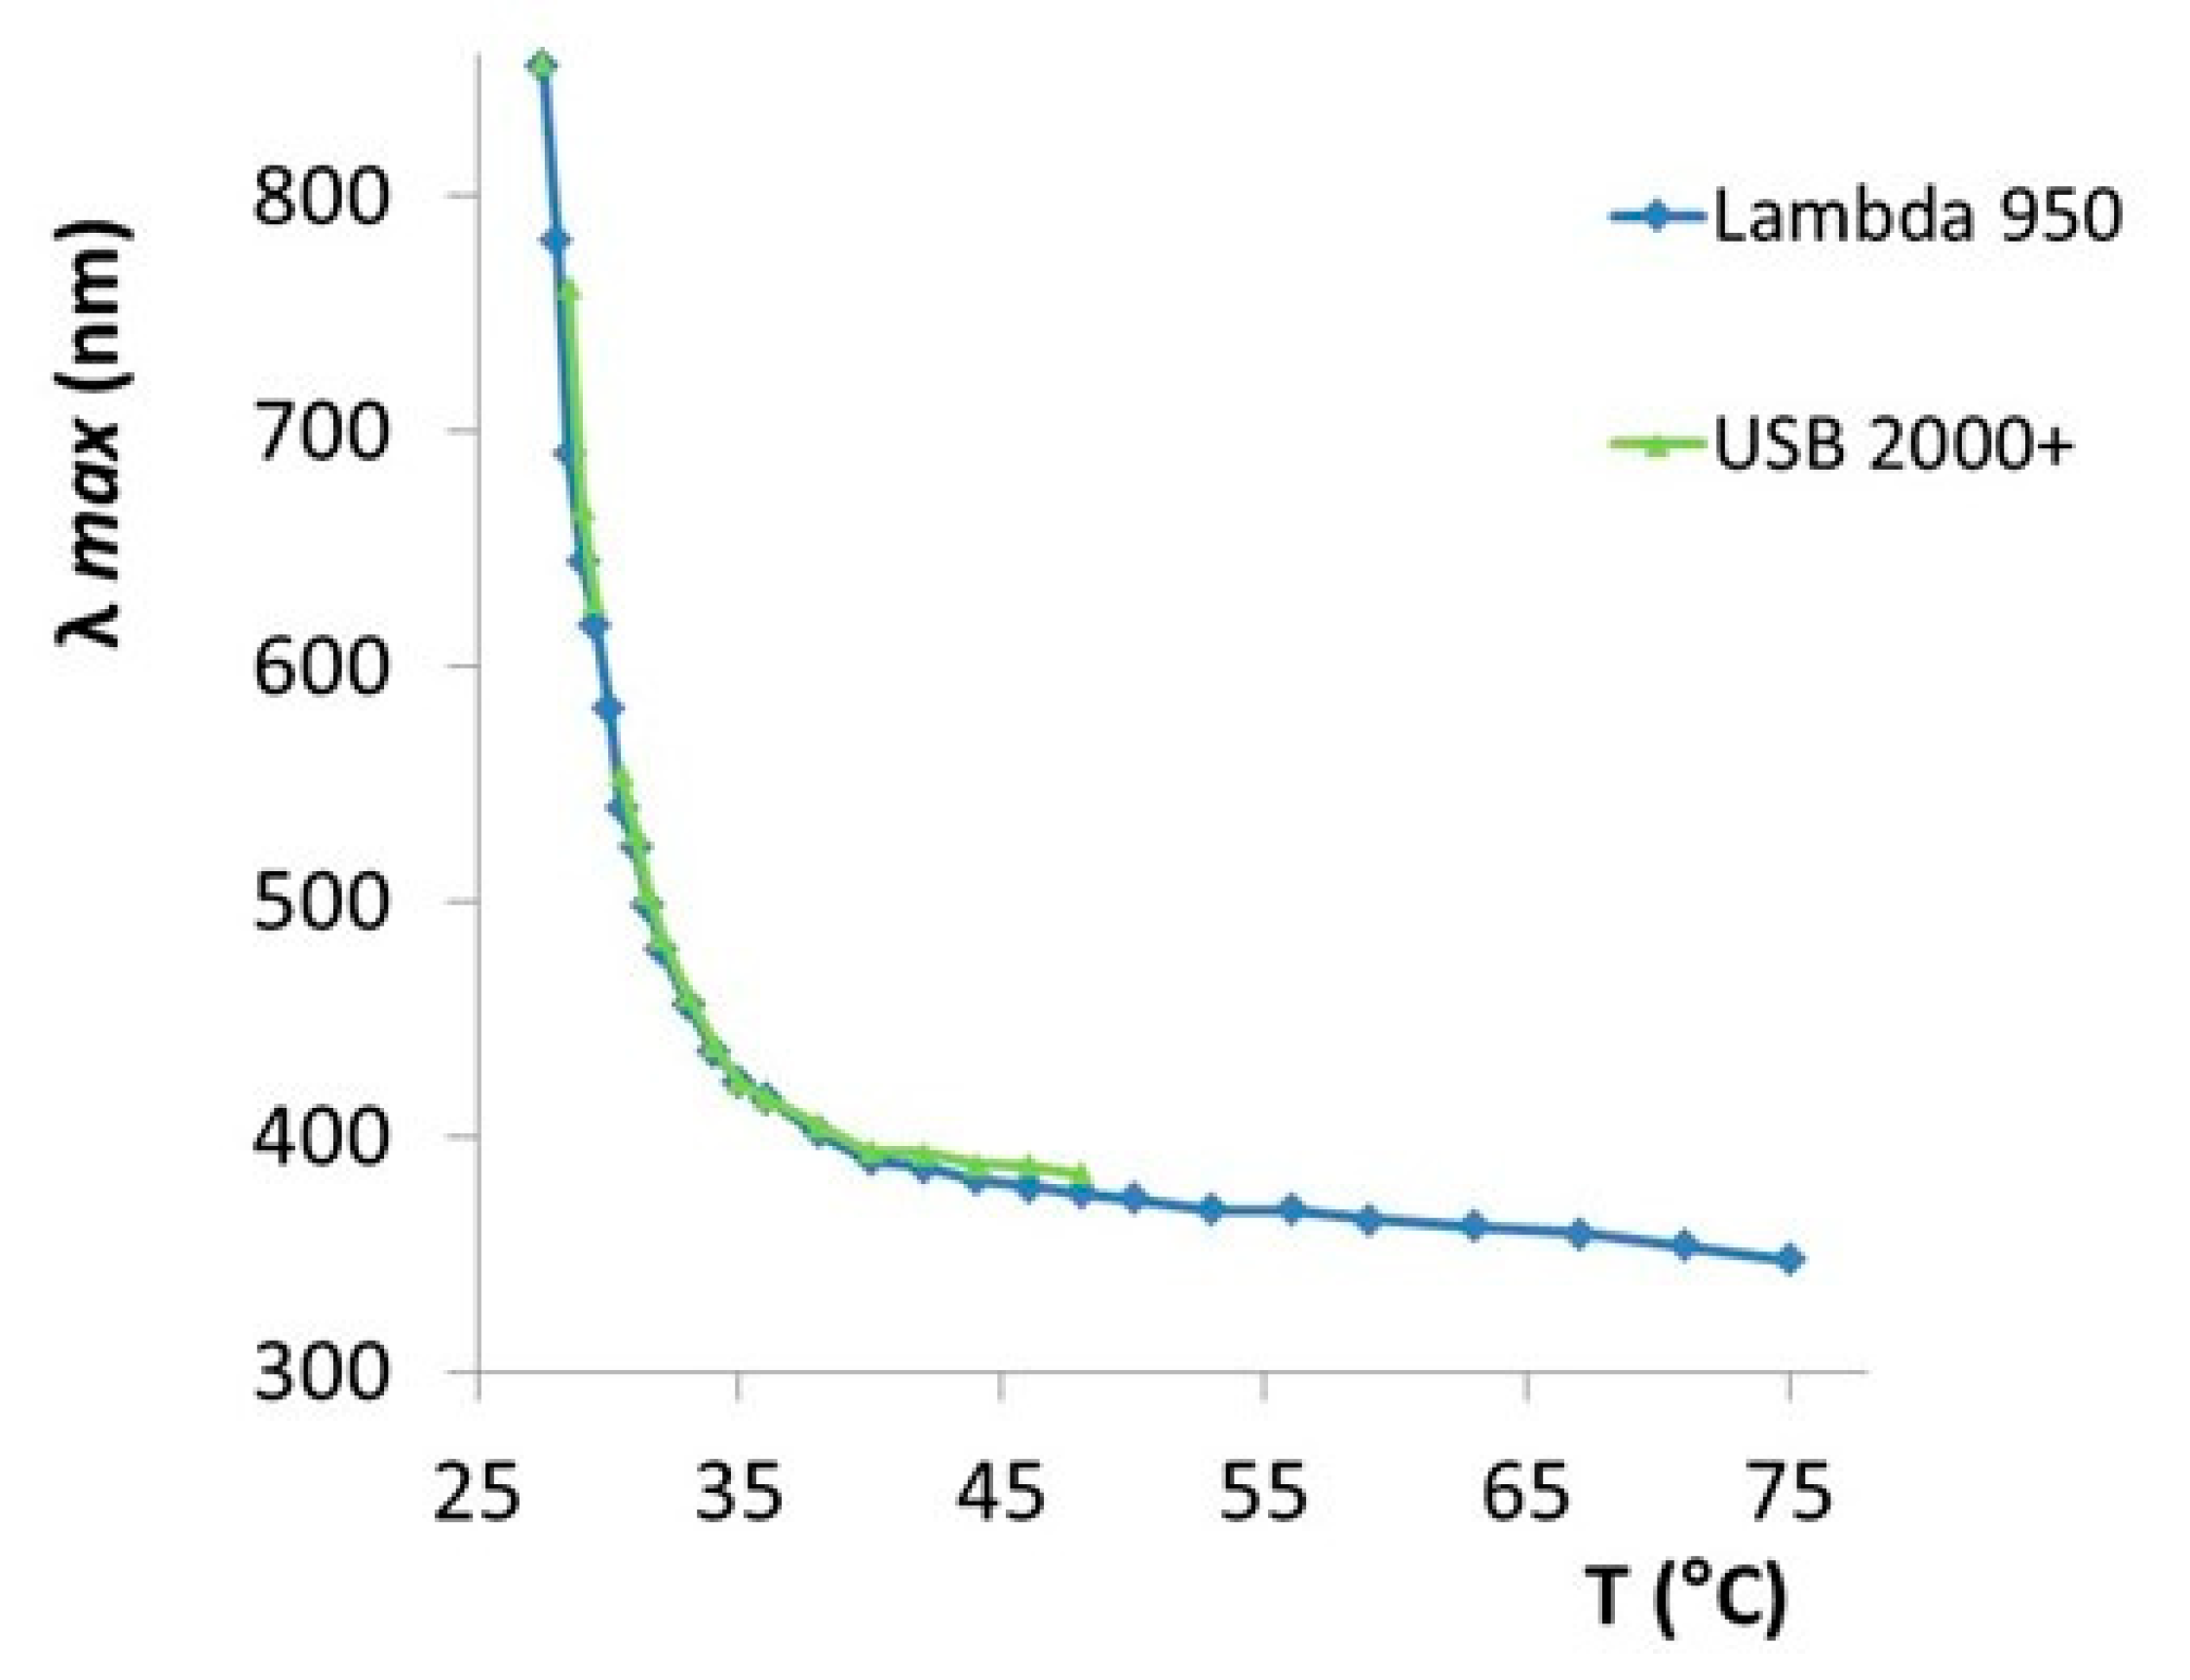
Reflectance spectra obtained by both integrating spheres (
Figure 1 and
Figure 2) were analysed in terms of the position of the reflectance peak
λmax as a function of temperature (
Figure 9). Here, the
λmax(
T) curves coincide almost completely. The
λmax shifts towards shorter wavelengths exponentially with an increase in temperature, which is in accordance with the findings reported in the literature, revealing the change in the pitch length in the TLC material [
4,
5,
7,
9].
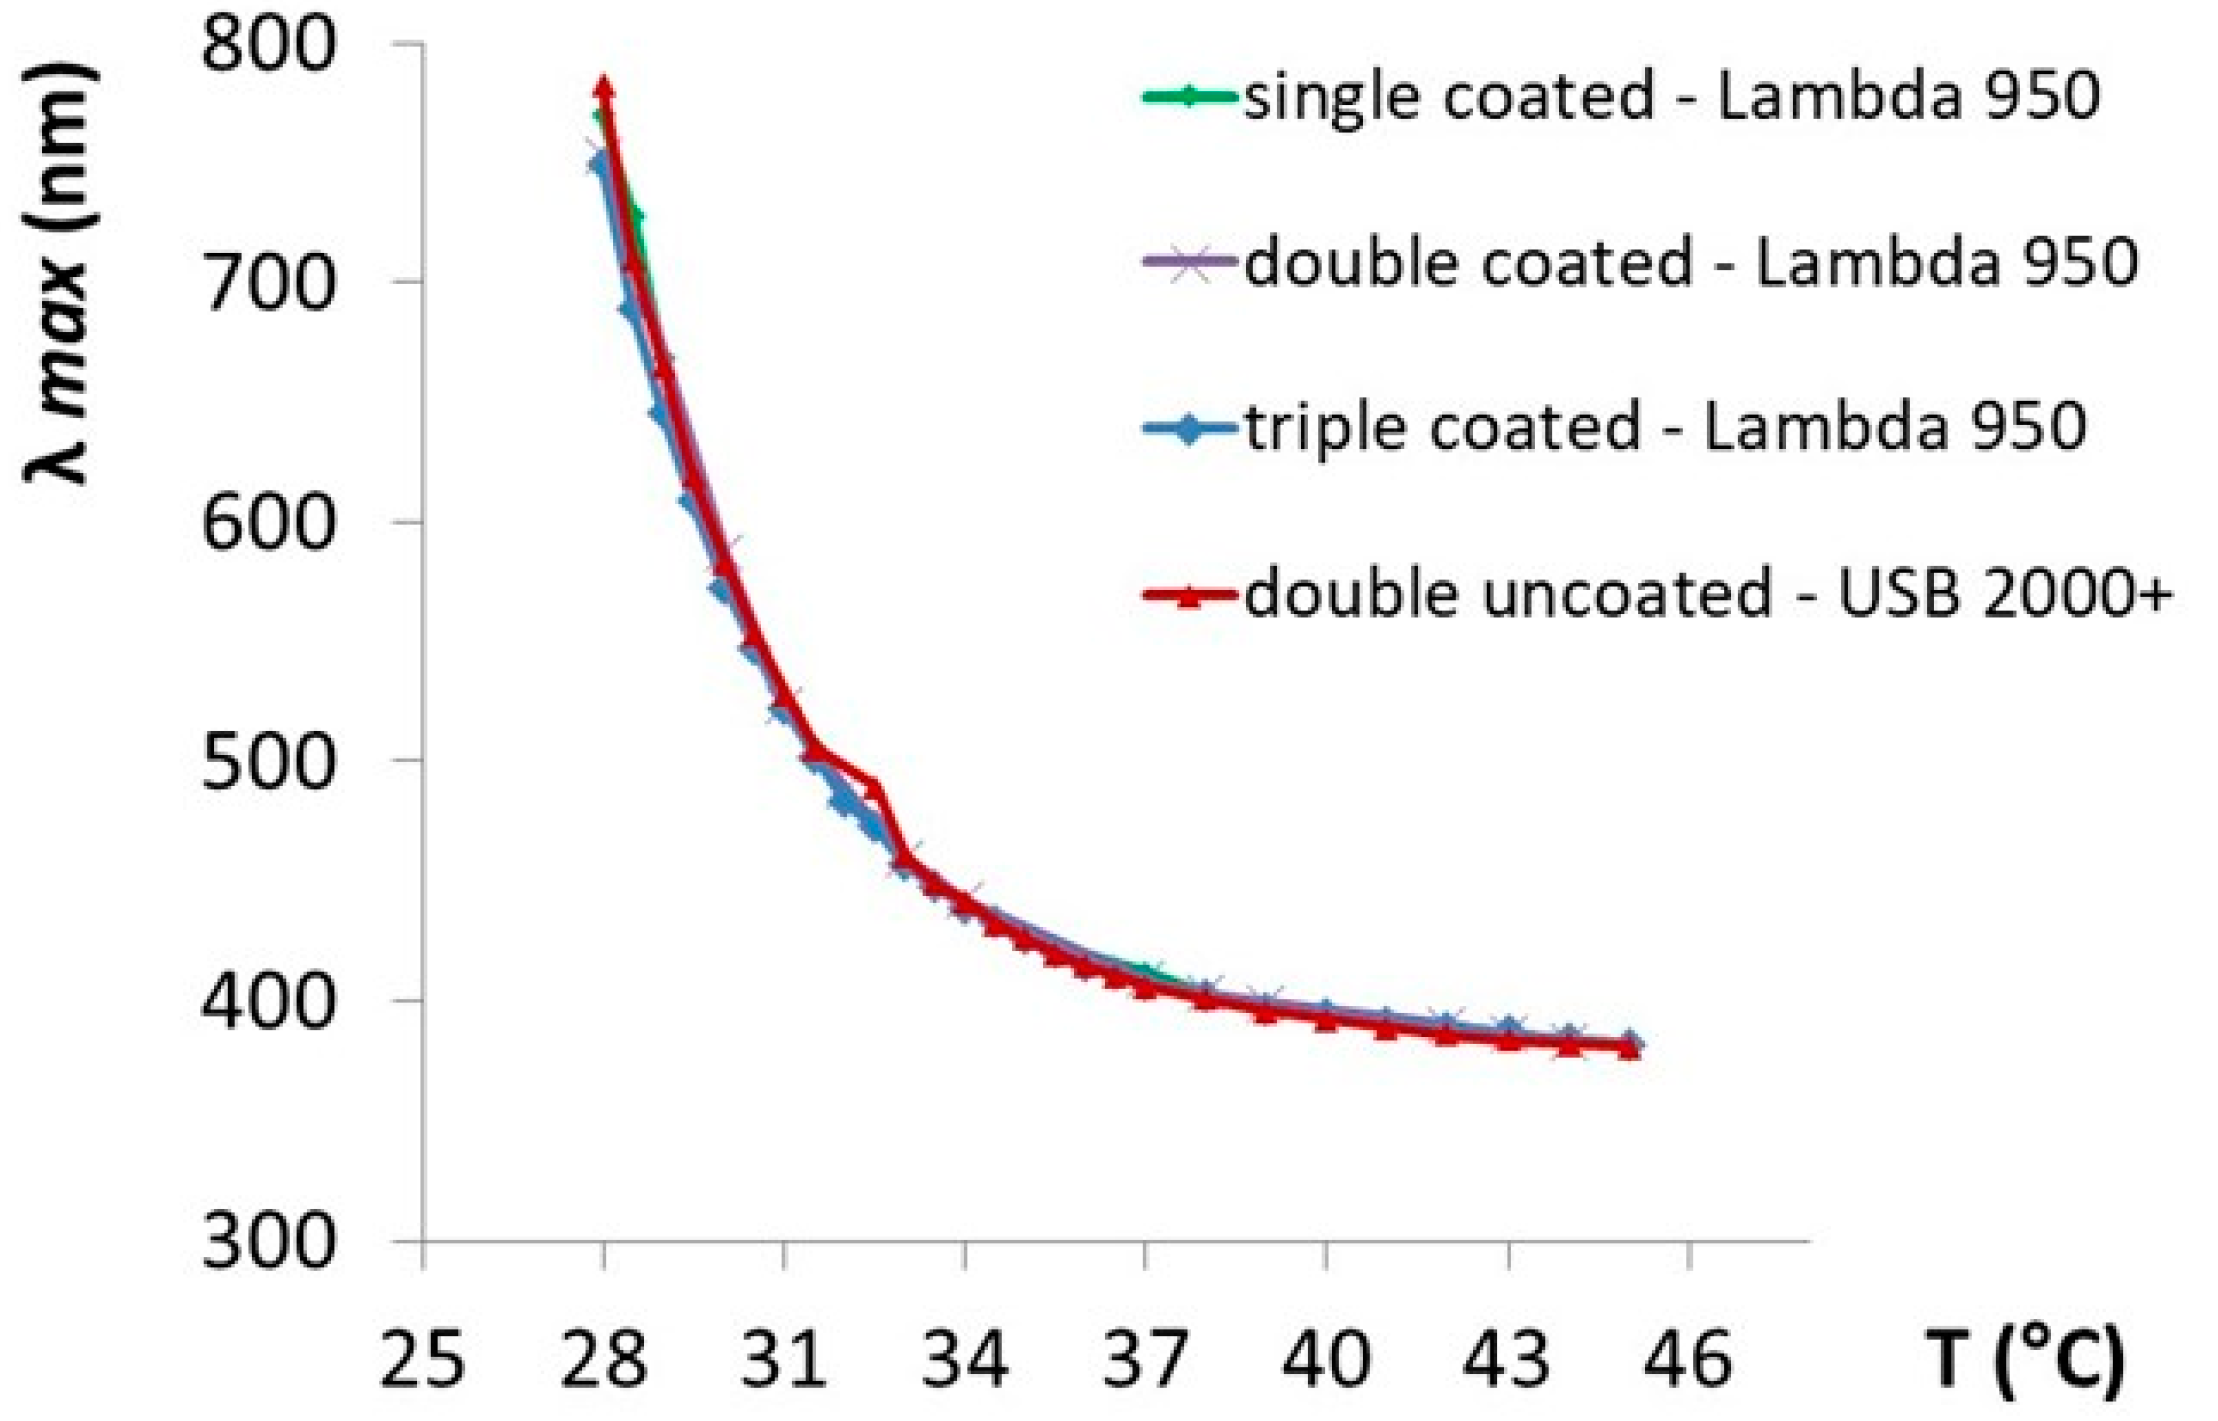
The position of the reflection peak was analysed in more detail, also taking into account the surface properties of the two substrates and the thickness of the TLC layers. For this purpose, the results were analysed for four samples, namely single, double, and triple layers on black coated substrate and double layer on black uncoated substrate. The
λmax(
T) curves of these samples coincide in full (
Figure 10). The only exception is the result at 32.5 °C obtained for the double-printed layer on uncoated black paper, which differs slightly from the other three, but this can be attributed to experimental error.
These results demonstrate that the position of the peak in reflection spectra of TLC samples is unrelated to the spectrometer and integrating sphere used for the measurements (
Figure 9). Moreover, the results do not depend either on the substrate and its surface properties (coated or uncoated, i.e., gloss or matt surface) or on the thickness of the TLC layer (
Figure 10).
4. Conclusions
Reflectance spectra as a function of temperatures of the TLC ink printed on coated and uncoated black substrate in single-, double- and triple-ink layers were measured by two different spectrometers—the Lambda 950 UV-VISNIR full-size device and the portable fibre-based USB 2000+ Ocean Optics. Both spectrometers use integrating spheres with identical measurement geometry (8°:di), but have different sphere diameter and sample port opening. The reflectance spectra obtained by these devices are highly similar to each other, though not identical. In both cases, the single reflection peak appears as a result of functional material being in the chiral nematic/cholesteric phase. The peak shifts along the visible range due to the increase of temperature and becomes narrower and more intense. When presented as CIELAB colour values, the differences are even more emphasized, despite a very similar shape of the curve obtained in the same trend of curve formation. The differences between the curves for different ink layers are even more significant, with single-layer samples showing the faintest colour play effect visible in the CIELAB diagram, and the triple-layer sample showing the strongest one, covering the largest CIELAB loop. None of these results can prove that the same TLC ink was used throughout the experiment. However, when the wavelengths at which the reflectance peak appears are extracted—the λmax—and presented as variables of the temperature, identical curves are obtained irrespective of the ink layers and substrate properties, and the same is true for both measuring devices. This is an authentic characteristic of TLC ink, independent of any other experimental parameter. We have proposed to call this feature the communication mechanism.
According to our studies, which have been ongoing since 2012, only the TLC inks require the specific procedure described, where only the temperature dependence of the peak in the reflectance spectra is the true identifier of the communication mechanism [
7,
14].


