1. Introduction
Recently, biodegradable polymers have attracted a lot of attention due to the environmental problems caused by traditional plastic materials and the depletion of fossil resources [
1,
2]. Biodegradable polymers have been suggested as an alternative to synthetic plastic materials, especially in some disposable products [
3]. Poly (butylene adipate-co-terephthalate) (PBAT), which is an aliphatic–aromatic copolyester as well as a semi-crystalline copolyester, shows excellent processability, thermal properties, mechanical properties, and biodegradability. It has been widely researched in the food package, biomedicine, and agricultural fields [
2,
4].
However, the application of PBAT in plastic mulch film is limited due to the excessive degradation rate. It means that crops would still be in the growth period when the film was degraded, which would not be conducive to the growth of crops, and would eventually lead to the crop yield not being significant [
5]. To meet the growing needs of more crops and to retard the degradation rate of PBAT, several means have been proposed to delay the degradation time, such as adding ADR chain extender [
6], UV absorber [
7], and antihydrolytic agent [
8], among others. All these methods had a positive effect on delaying the degradation rate of plastic film.
In addition, the crystallization of high polymers will affect their structure and properties [
9]. Therefore, in theory, the increase in crystallinity is also one of the effective ways to delay the degradation rate. When degradation occurs, the amorphous region of the polymer is attacked first, and the crystalline region is difficult to erode [
10]. Therefore, when the crystallinity of polymers increases, the degradation rate can be effectively slowed down. Svoboda et al. [
11] studied the effects of biodegradation on the crystallization of PBAT under 37 °C and 55 °C conditions. The results showed that the crystallinity was slightly higher under 55 °C. It could be interpreted, therefore, that a higher temperature is beneficial for accelerating biodegradation. Thus, the proportion of the amorphous region reduced, and the crystallinity increased relatively. Kuo et al. [
12] prepared hexadecylamine-modified zinc phenylphosphonate (m-PPZn) and poly (butylene succinate-co-adipate) (PBSA) composites and found that the degradation rate of PBSA increased as the contents of m-PPZn. This can be attributed to the degree of crystallinity decrease when the loadings of m-PPZn increase. Furthermore, in a study conducted by Yin et al. [
13], PCL (polycaprolactone)/PGS (poly (glycerol-succinate) composites were prepared with a blending method, and with the increase in the PGS modifier, the crystal size and crystallinity of the composites decreased. The PGS changed the crystallization of the composites and accelerated the degradation of the PCL matrix. These studies proved a strong negative correlation between crystallinity and the degradation rate.
Polyethyleneimine (PEI) is a water-soluble polymer material, and its structure and properties are very similar to those of polyvinylamine (PVAm). Its molecular structure contains a large number of amine groups that are directly connected with the carbon skeleton; thus, it is cationic. The presence of the amine group means that it is able to form a hydrogen bond with the oxygen-containing groups in the PBAT molecular structure, and the hydrogen bond can enhance the force between the composites [
14]. Furthermore, when PEI was added, the interlayer spacing between the composites was compressed by the interaction between the ions exchange, this is contrary to the conclusion of Kuo et al. [
12]. This force will help to improve the compatibility of PEI in the PBAT matrix and promote the PBAT crystal structure to be more regular. In other words, the crystallinity of PBAT can be regulated by adding PEI. In another major study, Hu et al. [
15] stated that PVAm had high crystallinity due to the strong interaction between the molecules. As a functional polymer, PEI has been widely used in biomaterials, reaction materials, synthetic intermediates, and various chemical modification materials [
16].
Until now, the literature has indicated that PEI is rarely used to increase the crystallinity of PBAT. Therefore, the objectives of the current study were to prepare PBAT/PEI films using the melt blending method as a low cost and simple process, and to systematically evaluate the effects of crystallization behavior and the thermal and mechanical properties on the degradation performance.
2. Experimental Methods
2.1. Materials
PBAT (Ecoworld®), with a density of 1.26 g/cm3, melt flow rate (MFR) of 3–5 g/10 min (190 °C/2.16 kg), melting point of 115 °C, and molecular weight of Mw = 9 × 10⁴ g/mol, was supplied by Jinhui Zhaolong Company Ltd (Shanxi, China). PEI (30 wt% aqueous solution), Mw = 2 × 10⁴ g/mol, was obtained from Condice Chemical Company Ltd. (Hubei, China).
2.2. Preparation of PBAT/PEI Composite Films
Initially, PBAT pellets were dried at 80 °C for 24 h. All the formulations were squeezed out and pelletized using a double-screw extruder (LTE-26-44, Labtech Engineering, Praksa, Thailand) and a pelletizer (LZ-120/vs, Labtech Engineering, Praksa, Thailand), respectively. Subsequently, the films were produced by a blown film machine (LF400-COEX, Labtech Engineering, Praksa, Thailand) with a temperature of zone 1, zone 2, and zone 3 being 130 °C, 140 °C, and 150 °C, respectively.
The compositions of PBAT/PEI films are shown in
Table 1. In addition to these three formulations, 2% and 5% of the PBAT/PEI films were also made, but were too thick compared with the other three, so they were abandoned and no analysis was made. It may not be suitable to add too much or necessary to optimize the processing technology.
2.3. Accelerated Photoaging Test
The accelerated photoaging test was performed based on ASTM G155-2013 in the Xenon lamp aging test machine (BGD866, an environmental simulator, BIUGED LABORATORY INSTRUMENTS CO.LTD, Guangzhou, China). The single aging cycle was 2 h, including 102 min illumination and 18 min spray, implied 20.4 h illumination and 3.6 h spray per day. The wavelength of the lamp was 340 nm and the UVA radiation intensity was 0.51 W/(m2 nm). The whole experiment period was 1080 h, and small piece samples were taken every 100 h for visual analysis and to determine gel permeation chromatography (GPC).
The conversion relationship between one day in the Xenon lamp aging test machine and the actual time in the field was as follows [
17]. The solar radiation in Beijing (China) was 6000 MJ/m
2/a. Within that, the ultraviolet A-type radiation (UVA, 315–400 nm) accounted for 5%, which was 300 MJ/m
2/a or 0.82 MJ/m
2/d. The UVA radiation in the Xenon lamp aging test machine was 173.40 W/m
2 (0.51 W/(m
2 nm) × 340 nm), equal to 12.73 MJ/m
2/d, considering cycles of 20.4 h illumination and 3.6 h spray per day. Therefore, one day in the Xenon lamp aging test machine was equivalent to 15.5 days (12.73/0.82) in the field.
The classification rules of degradation grade in the Xenon lamp aging test machine were as follows. Grade 1 (small cracking stage): cracks or holes (<2 cm wide) on the film; Grade 2 (long cracking stage): cracks or holes (2–20 cm wide); Grade 3 (fragmentation stage): cracked and broken into large fragments; Grade 4 (disintegration stage): small pieces existed; and Grade 5 (disappearance stage): the film was invisible.
2.4. Soil Biodegradability Test
As is well known, most studies of the biodegradation of PBAT have been performed under composting conditions, but our work aims to evaluate the behavior of the composites on the soil surface, as it was more in line with the needs of field application and provides reference. The acquisition of soil conforms to ASTM D5988-12, and three different regions were used to ensure microbial biodiversity. The soil properties and test methods of related indexes are shown in
Table 2. The mixed soil was dried for 48 h at room temperature (25 ± 2 °C), and then particle sizes smaller than 2 mm were obtained to remove other debris.
Three rectangle samples of 8 cm × 12 cm for each kind of film were used for soil degradation in a closed container. There were three containers in total. Subsequently, we put the containers in an artificial climate machine (without light) kept at room temperature (25 ± 2 °C). There was approximately 1.3 cm of soil layer in each container, and samples were laid flat on the soil surface. The amount of water added was to ensure the maximum retention capacity (about 23.8%) in order to make the film fully fit with the soil surface. The trial lasted a total of 6 weeks, with watering every week to keep the same water content as in the original and taking one sample of each material, and cutting a 4 cm × 4 cm square for visual analysis and scanning electron microscopy (SEM) analysis. Furthermore, the model of the artificial climate machine was RLD-300(Ningbo Ledian Instrument Manufacturing Co., Ltd, Ningbo, China). The classification rules for degradation grade in soil surface were the same as in the accelerated photoaging test.
2.5. Characterization and Property Tests
2.5.1. Mechanical Properties
The mechanical properties included tensile properties (tensile strength and elongation at break) and tear properties (tear strength). The tests were all carried out by a universal testing machine (Labthink Co. Ltd., Jinan, China), and the specific operation was according to ASTM D882-2018 and ASTM D1004-2013, respectively. These tests were performed on at least five samples of each film, and the results were averaged and the standard deviation was calculated. Furthermore, the thickness of all film samples was measured by a Millimar C1200 Thickness Gauge (Mahr Ltd., Shanghai, China) which meets the ASTM D6988-2013 standard.
2.5.2. Water Vapor Permeability
Water vapor permeability was tested with a W3/060 PERME machine (Labthink, Jinan, China). All samples were cut into 33.2 cm2 and the experimental conditions were approximately 38 °C temperature and 90% humidity, which meet the ASTM E96/E96M-2014 standard. At least two replicates were measured for each sample.
2.5.3. XRD Analysis
The X-ray diffraction (XRD) analysis of all films was recorded using a Bruker D8 FOCUS diffractometer (Bruker Instruments Co., Ltd, Beijing, China). The scanning range was from 5° to 80° (2θ), Cu Ka radiation (λ = 1.54 Å), 40 kV, 40 mA, 0.02° step, at room temperature.
2.5.4. DSC/TG Analysis
Differential scanning calorimetry (DSC) and thermogravimetric analysis (TGA) were performed through a TGA/DSC 1 (METTLER TOLEDO, Shanghai, China). The films were heated from 25 °C to 200 °C and melted for 2 min to eliminate the heat history, and subsequently cooled down to 25 °C to record their crystallization behavior. Following that, the samples were heated to 800 °C to record their melting behavior and thermogravimetric behavior. The heating and cooling rates were both 10 °C/min. All films were tested under nitrogen flow. Crystallinity (X
c) was calculated by the Equation [
20]:
where ΔHm was melting enthalpy;
wt was the PEI mass fraction; and ΔHo was melting enthalpy of PBAT at 100% crystallization (114 J·g
−1)(114 J/g) [
21].
2.5.5. FTIR Analysis
The functional groups in the film materials were identified by Fourier-transform infrared spectroscopy (FTIR), and the mode was attenuated total reflectance (ATR), using a Bruker Opus 7.5 spectrometer ((Bruker Instruments Co., Ltd, Beijing, China)). One sample of each film was analyzed from 4000 to 600 cm−1 with a resolution of 4 cm−1. The samples were mainly analyzed before and after 720 h of photoaging.
2.5.6. Visual Analysis
The visual analysis was realized by visual observation and photographing. After taking out the biodegradable film samples, the soil on the surface was washed away with distilled water. The samples in the xenon lamp aging machine also needed to be cleaned when they were taken out. Following that, the films were dried naturally for photographing and testing.
2.5.7. SEM Analysis
Scanning electron microscopy (SEM) was carried out with a Hitachi SU-8010 (Guangzhou Yide Precision Science Instrument Co., Ltd, Guangzhou, China) operating in high-vacuum mode and with an accelerating voltage of 20 kV. It was used to examine the surface morphologies of samples before and after degradation. The surfaces of all films were covered with a thin layer of gold to observe.
2.5.8. GPC Analysis
The change of molecular weight of PBAT and PBAT/PEI samples before and after photoaging was detected by a K-2501 system (SHIMADZU, Chengdu, China) for gel permeation chromatography (GPC). The solvent used in this test was tetrahydrofuran (THF), temperature 35 °C, loading volume 100 μL, and flow rate 0.5 mL/min.
3. Results and Discussion
3.1. Mechanical Properties
Table 3 presents the mechanical properties of the three films before degradation. It can be seen from
Table 3 that the order of the three indexes tensile strength, elongation at break, and tear resistance were all PBAT/0.5% PEI > PBAT/1% PEI > PBAT. Tensile strength, elongation at break, and tear resistance in PBAT/0.5% PEI and PBAT/1% PEI were approximately 39.2%, 40.2%, 49.5%, 31.9%, 30.5%, and 29.6% higher than those in PBAT, respectively. The results show that the addition of PEI markedly improved the mechanical properties of PBAT. It is possible that a hydrogen bond was formed between PBAT and PEI, which made the intermolecular force increase, so the PBAT matrix was not easy to deform when it was impacted by an external force. The research of Ye et al. [
22] also found that the existence of hydrogen bonds improved the strength and toughness of the films. The specific evidence will be shown in the FTIR analysis later in the paper. Moreover, it is likely to be related to the rise of crystallinity referred to in the XRD analysis below.
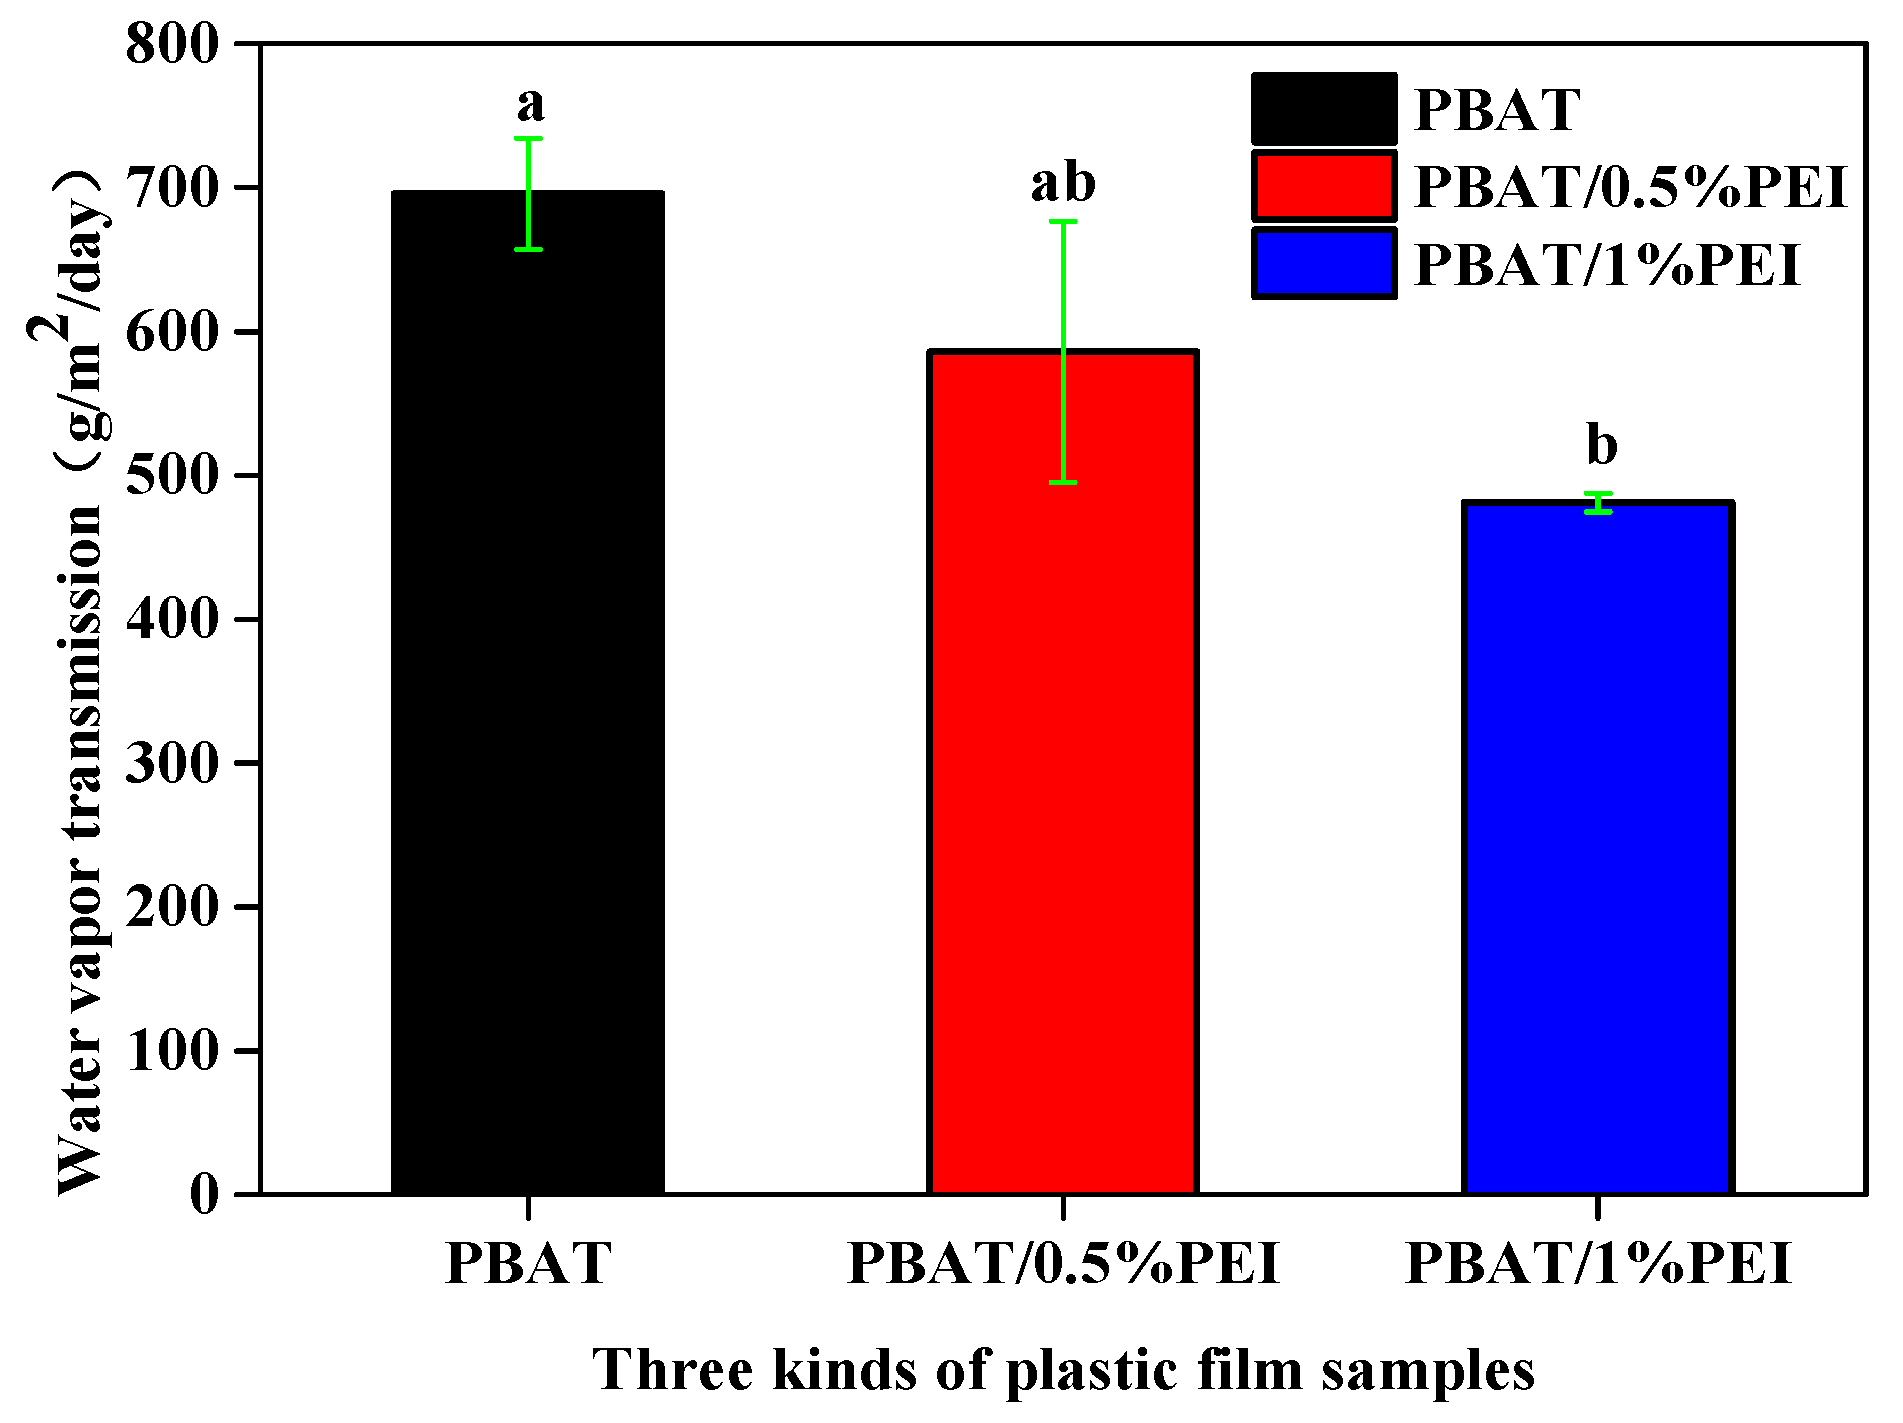
3.2. Water Vapor Permeability
Figure 1 shows the water vapor transmission of the films before degradation. The values in PBAT, PBAT/0.5% PEI, and PBAT/1% PEI were 696, 586, and 481, respectively. Interestingly, the water vapor transmission of PBAT/0.5% PEI and PBAT/1% PEI decreased 15.8% and 30.9% compared with PBAT. It meant that the water-holding capacity of the plastic films with PEI increased, and PBAT/1% PEI had a more significant increase than PBAT. PEI is a hydrophilic material. It may have locked the moisture content in and limited it to the film’s surface, thus the water vapor transmission was slower. This was consistent with the research results [
7,
23]. Additionally, PEI itself has a high crystallinity, which leads to a low effective permeable area, thus limiting the transport of water molecules referred to in the Tsuji et al. study [
24].
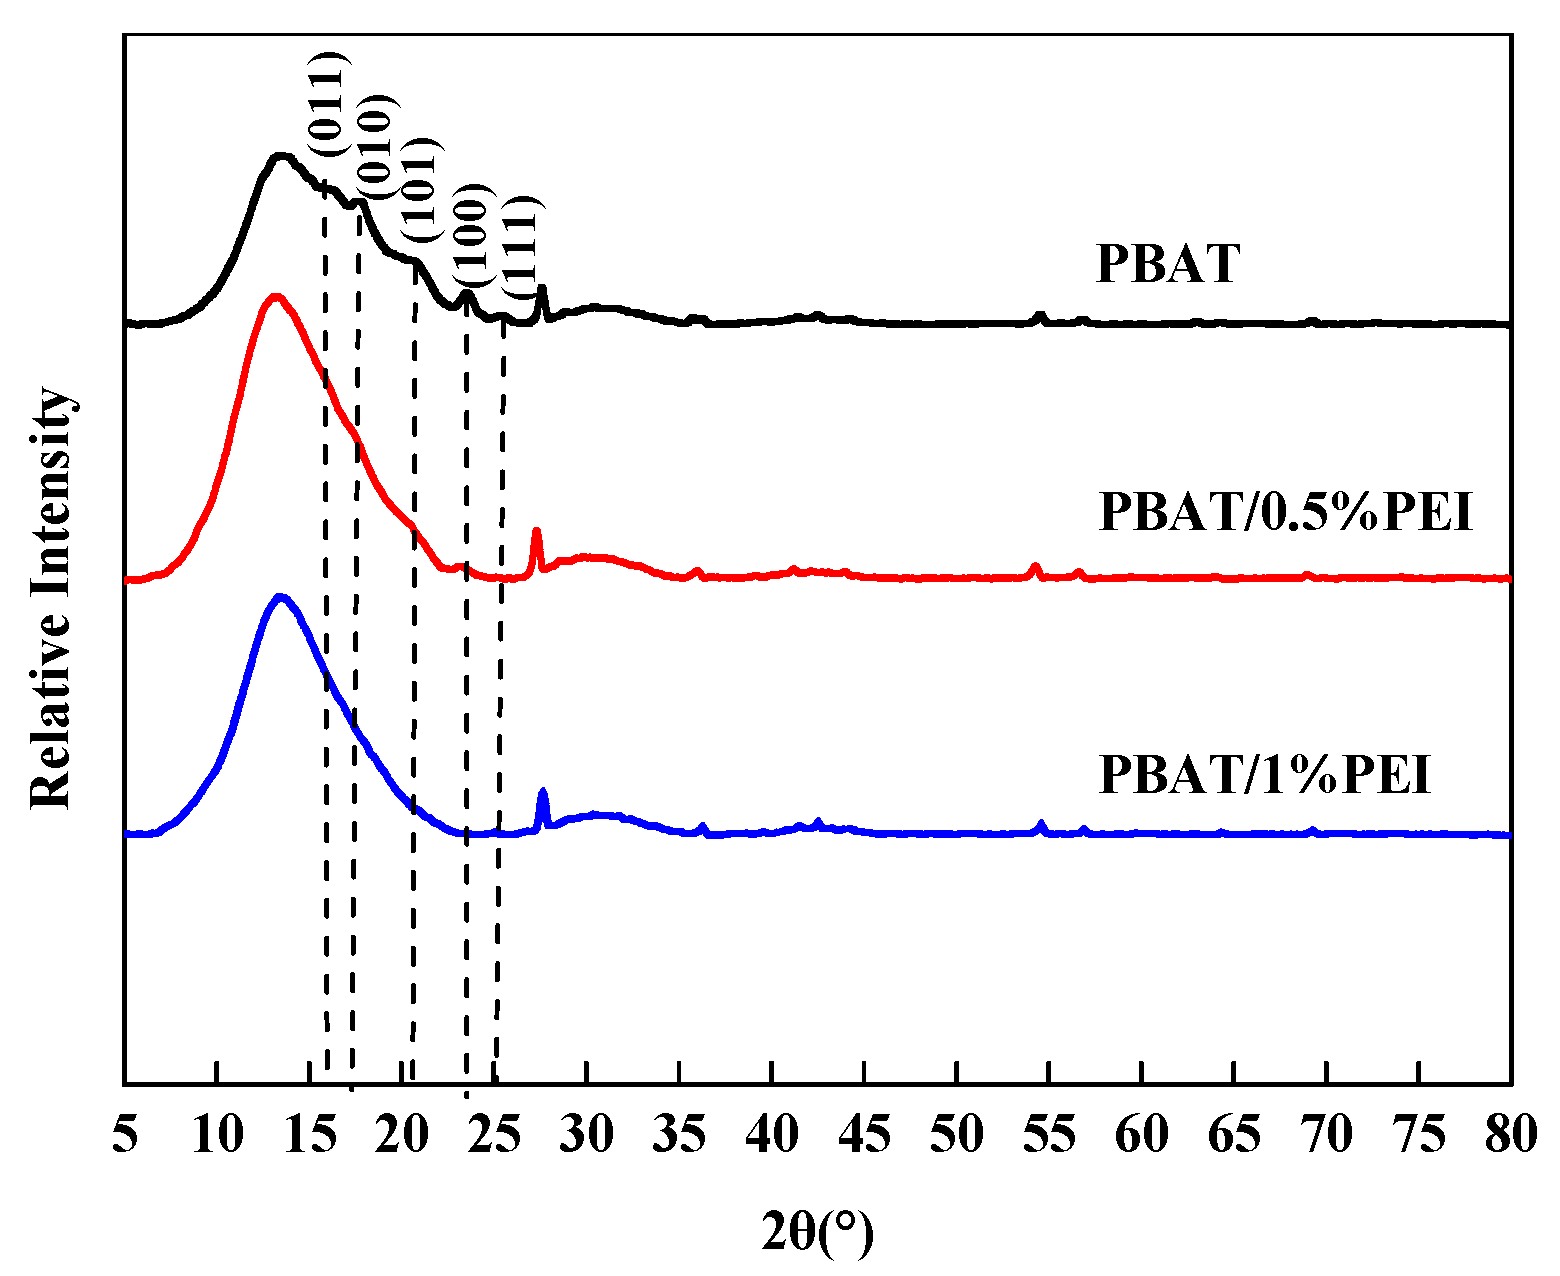
3.3. XRD Analysis
The XRD analysis was used to analyze the crystallinity of the materials. The results of the PBAT, PBAT/0.5% PEI, and PBAT/1% PEI films before degradation are presented in
Figure 2. In angle ranges 15° to 30°, PBAT showed five different diffraction peaks observed at 16.0°, 17.5°, 20.4°, 23.6°, and 25.1°. These crystal peaks corresponded to the planes of (011), (010), (101), (100), and (111), respectively [
25]. Furthermore, it can be seen that the structure of PBAT was composed of a crystalline region and an amorphous region from the wider peak in the graph [
26].
The curve trend of pure PBAT and PBAT/PEI composites was almost the same, which indicated that the addition of PEI had no effect on the crystallization mechanism of PBAT films. However, compared with PBAT, there were no obvious characteristic peaks in the PBAT/0.5% PEI and PBAT/1% PEI curves. Furthermore, when PEI was added, the range of crystallization peaks became narrow. It can be concluded that the addition of PEI increased the crystallinity to a certain extent, and was conducive to the integrity of the crystal and reduced the type of crystallization.
3.4. DSC Analysis
Figure 3 shows the second heating and cooling curves of the PBAT, PBAT/0.5% PEI, and PBAT/1% PEI films before degradation. The crystallization temperature (T
c), melting temperature (T
m), melting enthalpy (ΔH
m), and degree of crystallinity (X
c) gained from the curves are listed in
Table 4. The T
c of the PBAT/0.5% PEI film and the PBAT/1%PEI film was 0.3 °C and 0.5 °C lower than that of PBAT, respectively. But the T
m of the PBAT film was 1 °C higher with the addition of 1% PEI. During the heating process of polymers, their molecular chains start to move and seek opportunities for interaction [
27]. This may be due to the weak interaction between PBAT and PEI and the promotion of heterogeneous nucleation. Therefore, although the crystallization temperature and melting temperature were almost unchanged, the temperature range became narrower and the crystallization time became shorter after the addition of PEI.
Furthermore, the X
c of the PBAT film was 9.3%, 3.1% less than the PBAT/1% PEI film but 3.2% higher than the PBAT/0.5% PEI film. This can be explained by the fact that, in highly amorphous structures such as PBAT, chain overlap may not occur completely, and some regions do not crystallize due to chain entanglement [
6]. Therefore, the addition of PEI did not change the crystallinity greatly. The increased crystallinity corroborated the results of the mechanical properties and the water vapor transmission, mainly for the sample PBAT/1% PEI. In the case of the PBAT/0.5% PEI film, the low content of PEI, which had few sites that could act, probably limited the movement of the PBAT molecular chain, hindering the arrangement of molecules to an ordered structure and leading to the decrease of X
c values [
28].
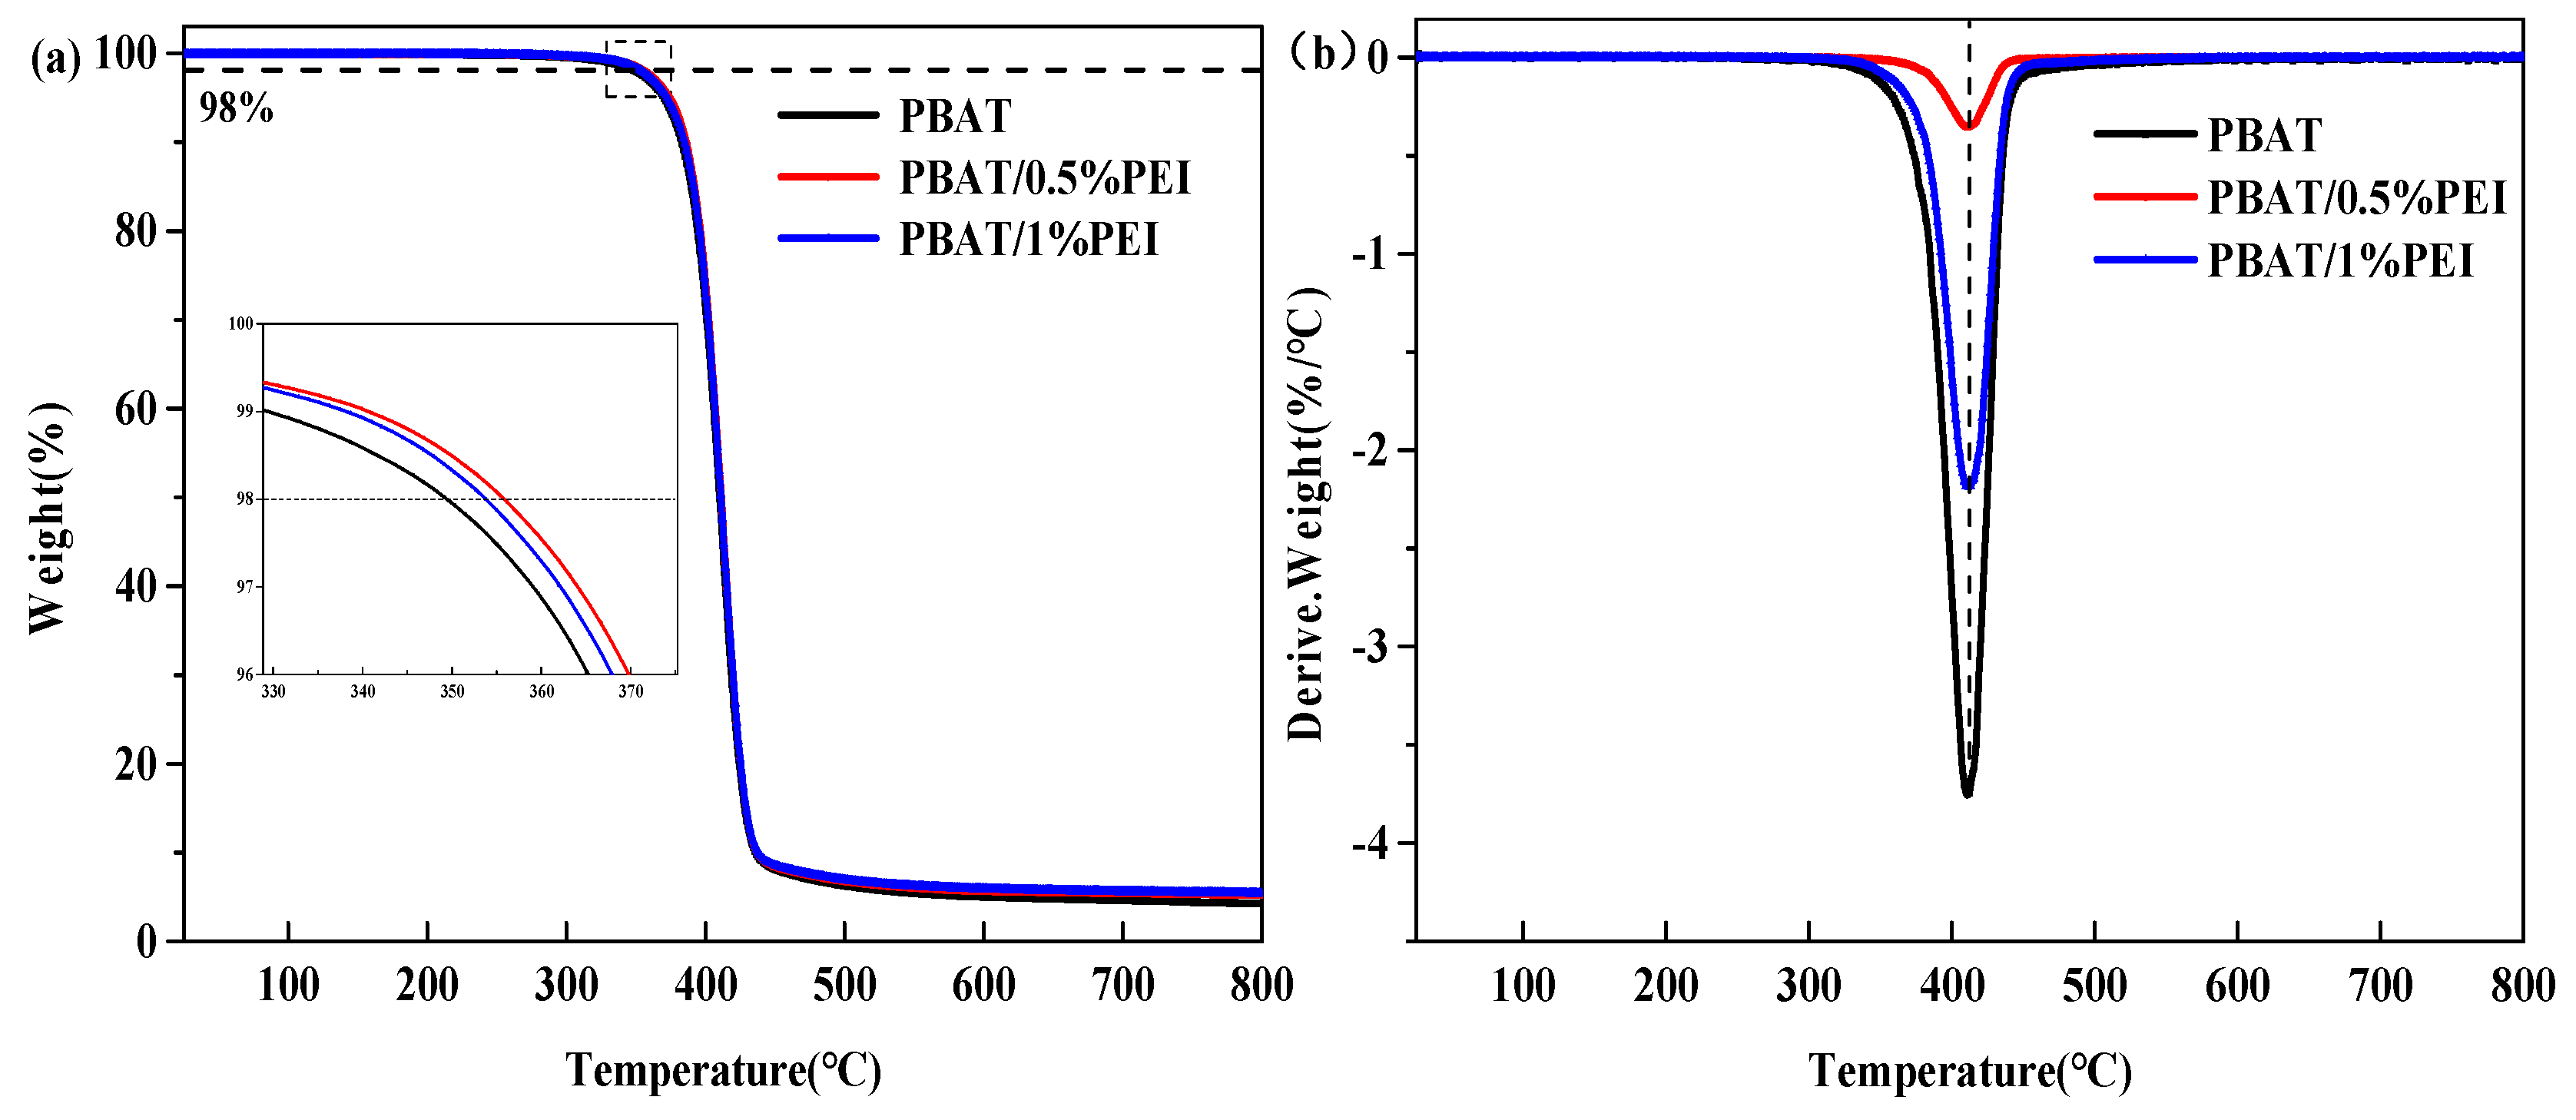
3.5. TG Analysis
Figure 4 presents the thermogravimetric curves, and the relevant information is listed in
Table 5. The T
2% and T
max were the temperatures corresponding to 2% and the fastest weight loss, respectively. The residue at 800 °C was the weight of residual material at 800 °C. It can be seen from
Figure 4a that there was only one weight loss step for pure PBAT and PBAT/PEI composites, which may be related to the very close thermal decomposition temperatures of PBAT and PEI. The T
2% and T
max of all PBAT/PEI compositions were increased in
Table 5. It could be interpreted that the PEI can increase the thermal stability. It is possible that the mobility of the PBAT/PEI molecular chains was lower in a higher temperature environment, then combined with hydrogen bonding and heterogeneous nucleation, which can hinder the thermal degradation of PBAT to a certain extent, thus promoting thermal stability [
28]. The composition values of the residue at 800 °C were all higher than neat PBAT. The composite films showed higher heat resistance.
3.6. Visual Analysis for Photodegradable Samples under Exposure to Accelerated Photoaging Conditions
The changes in sample appearance related to different degradation times are shown in
Table 6. The classification of degradation grades of films in the photoaging process is shown in
Table 7. An explanation could be that the incomplete part of the neat corners in the picture was cut by sampling and taking photos before sampling. With the extension of aging time, green areas appeared, and became more obvious on the surface of all films and the surface morphology, which was mentioned in SEM analysis. The photo oxidative degradation and Norrish reaction occurred when the film was irradiated by UV. Chromophores were formed in this complex photochemical reaction process, which led to the change of film color [
29,
30].
As can be seen from the pictures, the PBAT/0.5% PEI film was the first to break in 820 h and some of them were broken into small pieces in 1080 h. The PBAT film appeared to have holes in 920 h and became brittle in 1080 h. However, the PBAT/1% PEI film had holes but was almost complete in 1080 h. It can be seen from the above description that the induction period of the PBAT/0.5% PEI film was 34 days (820 h), the PBAT film was 38 days (920 h), and the PBAT/1% PEI film was 45 days (1080 h). This illustrated that the induction degradation period of the PBAT was 4 days (100 h) longer than PBAT/0.5% PEI, but 7 days (160 h) shorter than PBAT/1% PEI. If the ultraviolet radiation received by the films in the Xenon lamp aging test machine was equal to 15.5 days outdoors in Beijing, then the induction period of the PBAT/0.5% PEI film was 527 days, the PBAT film was 589 days, and the PBAT/1%PEI film was 697.5 days. However, the conversion process did not take into account the deterioration of the UV lamp with use and the distance between the lamp and the film. Of course, this was only in the case of exposure to the sun without contact with the soil. The order of degradation resistance was as follows: PBAT/1% PEI > PBAT > PBAT/0.5% PEI and was consistent with the Xc. These phenomena indicate that the films were degraded under the irradiation of ultraviolet light in the Xenon lamp aging test chamber. This could mean that there was a break in the molecular chain and a drop in the molecular weight. Specific analysis can be obtained from the FTIR and GPC analysis as follows.
3.7. FTIR Analysis
Figure 5 shows the FTIR spectra of the PBAT, PBAT/0.5% PEI, and PBAT/1% PEI films. The main peaks of PBAT were at 2954, 1715, 1268, and 729 cm
−1, in agreement with Zhang et al. [
31]. The bands at 2954 cm
−1 for the PBAT were assigned to the CH
2 stretching modes; 1715 cm
−1 bending mode of –C=O; and 1268 cm
−1 C–O–C stretching mode and 729 cm
−1 was related to four or more adjacent –CH
2. On the whole, the curves of composite films were consistent with that of the PBAT film. It should be noted that when PEI was added, there were weak curve changes at 1713 cm
−1, which was attributed to the hydrogen bond between the amine group in PEI and the oxygen group in PBAT. The weak intensity of the new peak was due to the small amount of PEI. The existence of this hydrogen bond was related to the enhancement of mechanical properties. From
Figure 5c, it can be verified that a new peak at 696 cm
−1 was an indicator of a possible interaction between PBAT and PEI. A similar result was also observed in PBAT-ADR [
32]. This new peak could have influenced the vibration of the –CH
2– groups. At the same time, it also explains the minute variations in other peaks reached by the stretching vibrations [
33,
34].
There were two reasons why only 720 h was selected for infrared spectrum curves. On one hand, the changing trend of the spectra of the other time samples was similar to that of 720 h; on the other hand, the green on the surface of the films was deeper, which was more conducive to monitoring changes. After 720 h of photoaging, the peaks at 1715, 1268, and 729 cm
−1 were weakened compared to 0 h and there were no new functional groups. These changes indicate that all the films were degraded, including molecular chain breaks, in the presence of light [
35]. Interestingly, the new peak at 696 cm
−1 disappeared. This once again confirmed the occurrence of chain breaking. The change of surface morphology can be seen in the SEM analysis.
3.8. Visual Analysis for Biodegradable Samples under Exposure to Soil Biodegradation Conditions
The pictures and degradation grades of films in the process of biodegradation are shown in
Table 8 and
Table 9, respectively. Based on visual examination, all films gradually degraded over time when put on the soil surface. It is clear that they turned yellow and that the surface became rough due to microbial erosion. Among them, PBAT/0.5% PEI changed the most and degraded the fastest, as pores appeared in 3 weeks and it was almost completely degraded in 6 weeks. There were two main reasons for this. First, this was largely due to the amount of water added. This experiment was watered every week and the water content was maintained at the maximum water-holding capacity, as mentioned in the experimental section. This may mean that the degradation cycle was shortened by half. Among the factors that affected the biodegradation process, water content was the most important environmental factor to control the biodegradation rate because soil moisture directly affected microbial activity [
36]. The other factor was that the X
c decreased after adding PEI according to the DSC results. It has been reported in the literature that degradation usually occurs in the amorphous region first, and then attacks the crystalline region [
37].
In weeks 5 and 6, long cracks and big holes appeared in PBAT. For PBAT/1% PEI, the film integrity was relatively high, although there were small holes. On the whole, PBAT reached the cracking state 2 weeks later than PBAT/0.5% PEI but 1 week earlier than PBAT/1% PEI. Thus, the degradation degree of the three films generally increased in the order of PBAT/0.5% PEI > PBAT > PBAT/1% PEI. It was proved that the increase in the Xc was beneficial to delaying the crystallization. Moreover, it must be noted that the conditions in indoor tests can be optimized, including a constant temperature and excessive humidity. Therefore, the whole biodegradation cycle was faster.
3.9. SEM Analysis
The micrographs of the films before degradation (0 week), degraded in the soil for 1, 3, and 5 weeks, and photoaging for 720 h are presented in
Figure 6. It can be seen from the pictures before degradation that the addition of PEI caused the incomplete compatibility of the matrix, and there were signs of uneven dispersion on the surface of the film. Moreover, this phenomenon was more obvious in the PBAT/0.5% PEI film. However, it did not affect mechanical behavior. As PEI was hydrophilic and PBAT was hydrophobic, the compatibility and dispersion between the two mediums were poor. Similar results were obtained in the previous study [
38].
In the following monitoring periods, it was clear that the surface of all the films was smooth before degradation, but rough after degradation. Consistent with visual analysis, the surface of the PBAT/0.5% PEI after being degraded in soil presented a more pronounced level of degradation. The sea-island phase structure (1 week), granular or small globular substances (3 week), and larger fractures (5 week) on the film surface of PBAT/0.5% PEI can be observed. These characteristics were shown earlier in relation to the other films. Furthermore, the degradation degree of PBAT/1% PEI was the slowest, the film was slightly damaged, and PBAT showed intermediate behavior. The higher the crystallinity, the slower the degradation rate was confirmed again.
Interestingly, with the extension of the monitoring time, it can be seen that the degradation of all films starts from the surface and then erodes layer by layer to the inside, even showing fractures. This can be attributed to the hydrolytic degradation and microbial erosion that occurred throughout the exposure to the soil surface [
39]. According to previous studies [
40], the degradation of polymers starts from the surface, mainly due to the activities of fungi and bacteria. The attack behavior of microorganisms will mainly lead to the hydrolysis and oxidation of films, resulting in the breaking of the molecular chain, and the decline of molecular weight.
The results of films aging in the Xenon lamp aging machine can be seen in the figure of 720 h. As mentioned in the visual analysis section above, with the growth of monitoring time, green areas appeared on the surface of the films. Therefore, SEM was used to show the micromorphology of the green areas. Initially, the three sample films were degraded in different degrees under the existence of light. PBAT/0.5% PEI still showed the most serious degradation characteristics, and there were many cracks on the surface. However, the changes in the PBAT/1% PEI film surface were small with a part of the area becoming rough. Additionally, PBAT was in the middle accompanied by massive degradation but no fissures. The order of degradation results fit with that in the soil.
3.10. GPC Analysis
The molecular weight changes were analyzed to explain the degradation of PBAT/PEI films. The molecular weight curves of PBAT, PBAT/0.5% PEI, and PBAT/1% PEI of before and after 720, and 1080 h of photodegradation are shown in
Figure 7. The peak intensity of all samples was weakened after the photoaging, the peak positions move to a longer retention time, and the new peaks appeared in the longer retention time. This evidence indicates that the molecular weight of all films decreased and low molecular weight substances were formed, which led to the increase in molecular weight distribution after photoaging [
41]. In
Figure 7a–c, the peak intensity of PBAT/0.5% PEI changes significantly compared to that of two films when they experienced 720 h of photoaging, which displays the faster molecular weight drop. Moreover, compared with 720 h, the peak intensity of the PBAT and PBAT/0.5% PEI at 1080 h was stronger, but PBAT/1% PEI still decreased at 1080 h. This illustrates that the crosslinking structure was formed in PBAT and PBAT/0.5% PEI films, which hindered the degradation and led to the increase of molecular weight. However, the crosslinking structure was not formed in the PBAT/1% PEI film, which could continue to degrade. Therefore, it can be concluded from the GPC curves that the fastest degradation rate was PBAT/0.5% PEI, the slowest was PBAT/1% PEI, and PBAT was in the middle. This corresponds with the results of the visual and SEM analysis and also proves that the increase of X
c was advantageous to reducing the degradation rate.
4. Conclusions
The new biodegradable PBAT/PEI composites with reasonable degradation rates were manufactured by melt blending. This study demonstrated a complex degradation process when PBAT was mixed with PEI. The complexity was mainly reflected in the amount of PEI added. FTIR analysis showed that the oxygen-containing group in PBAT formed a hydrogen bond with the amine group in PEI. In addition, the existence of hydrogen bonds enhanced the mechanical properties and thermal stability of the PBAT/PEI composite films. XRD and DSC analysis certificated that the addition of PEI increased the crystallinity of PBAT, and 1% PEI was effective. The crystallinity of the PBAT/1% PEI film was 9.6%, which was 3.1% higher than that of pure PBAT film. Moreover, the induction period of PBAT/1%PEI increased by 160 h under photoaging (no soil) and 1 week under biodegradation in soil (without light) compared with the PBAT film. The rise of crystallinity was beneficial to reducing the water vapor permeability and degradation rate. The order of degradation resistance of all film samples was as follows: PBAT/1% PEI > PBAT > PBAT/0.5% PEI, evidenced by GPC, SEM, and visual analysis. In conclusion, the higher the crystallinity, the slower the degradation rate was confirmed. This study provided an effective method for enlarging the crystallinity of PBAT, and also offered an important reference for extending the use period of plastic films in agricultural applications.


