Article

Crack Resistance of Insulated GRC-PC Integrated Composite Wall Panels under Different Environments: An Experimental Study

1
BIM Engineering Center of Anhui Province, Anhui Jianzhu University, Hefei 230601, China
2
School of Civil Engineering, Central South University, Changsha 410083, China
3
Shenzhen Hailong Construction Technology Company Limited, Shenzhen 518000, China
*
Author to whom correspondence should be addressed.
Crystals 2021, 11(7), 775; https://doi.org/10.3390/cryst11070775
Submission received: 27 May 2021 / Revised: 23 June 2021 / Accepted: 29 June 2021 / Published: 2 July 2021
(This article belongs to the Special Issue New Frontiers in Cementitious and Lime-Based Materials and Composites)

Abstract

:
GRC-PC wall is a new type of integrated composite exterior wall with decorative and structural functions. It is formed by superimposing GRC surface layer on the outer leaf of prefabricated PC wall. Due to the complexity of indoor and outdoor environment and the difference of shrinkage performance between concrete and GRC materials, GRC surface layer in GRC-PC wall is prone to shrinkage and cracking, among which, the connection modes between GRC layer and PC layer and change of temperature and humidity have the greatest influence. Therefore, GRC material formula was adjusted, and seven experimental panels were produced. In view of the temperature and the humidity changes in different indoor and outdoor environments, the influences of different connection modes between GRC layer and PC layer on the material shrinkage performance were studied, and a one year material shrinkage performance experiment was conducted. The results show that, in indoor environment, the shrinkage of GRC layer and PC layer is relatively gentle due to the small range of temperature and humidity change. Compared with the indoor environment, the changes of outdoor temperature and humidity are more drastic. The shrinkage changes of GRC layer and PC layer show great fluctuations, but the overall strain value is still within a reasonable range, and there is no crack. At the same time, this suggests that smooth interface is more conducive to crack resistance of GRC surface layer compared with different interface types between GRC layer and PC layer. The research provides an experimental basis for the large-scale application of the wall panel, and it has great advantages in improving the efficiency of prefabricated building construction.

1. Introduction

A glass-fiber-reinforced cement (GRC) is a type of composite building material made of cement and glass fiber as the main components while also including white sand, metakaolin, and fly ash [1]. Because of its excellent plasticity and durability, a GRC material can be used as an exterior leaf decorative material on the walls of buildings and is preferred over lacquer materials. The application of GRC not only protects the environment but also plays the role of architectural decoration in accordance with the concept of green buildings [2,3]. A GRC-PC exterior wall is a new type of prefabricated wall formed by a composite GRC surface layer on the outer leaf layer of a precast concrete (PC) wall panel, as shown in Figure 1, which not only ensures the structural bearing capacity of the members but also plays a decorative role. The use of this wall panel significantly reduces pollution, shortens the construction period, and improves the construction efficiency, thereby integrating the building, the structural, and the decorative elements through fabricated systems. It also has great advantages in improving the structural optimization of the conventional PC industry [4,5].
In practical engineering, the concrete components without glass fiber are prone to cracking, which shortens the service life of components, affects the aesthetic appearance, and reduces the construction quality [6,7]. Previous studies showed that the basic factors causing cracks in concrete cementitious materials are determined by mechanical properties, shrinkage properties, and ductility. Recently, in the development of new concrete materials, materials that incorporate fibers to improve the crack resistance of concrete, such as glass-fiber-cement (GRC) and steel-fiber-cement (SFRC), are gradually being used in engineering applications [8,9,10].
In a study on the mechanical properties of GRC, Liu and Wu [11] pointed out that adding glass fibers helped reduce the elastic modulus of concrete. Zhao et al. [12] showed that, with the increase in the glass fiber content, compressive strength, splitting tensile strength, and flexural strength of concrete increased first but then decreased, i.e., there is an optimal fiber content. Shen et al. [13] found that an alkali-resistant glass fiber could significantly improve the tension–compression ratio and Poisson’s ratio of concrete and enhance its toughness and brittleness. Qian and He [14] studied the influencing factors and the development patterns of glass fibers and fly ash composite cements and concluded that the material strength was most influenced by age and cement content, followed by the glass fiber, and least by the fly ash.
In a study on the shrinkage performance of GRC, Lura et al. [15] found that the shrinkage deformation of materials was the primary factor causing cracks in the process of condensate sclerosis, regardless of whether it was ordinary cement or GRC. The dominant shrinkage mechanism was found to be temperature autogenous shrinkage, which is the shrinkage deformation of a material under the combined action of the hydration heat of cement and the external temperature change [16]. Shrinkage deformation causes shrinkage stress in a material, and cracks are induced when the stress exceeds the maximum tensile stress that the material can withstand [17,18]. In addition, the shrinkage of GRC is affected by curing temperature, humidity, and environment [19,20].
To alleviate the shrinkage deformation of the GRC material and improve its crack resistance, previous studies were mainly carried out from two aspects. The first is the reasonable selection of GRC aggregates. Ye et al. [21] and Nguyen et al. [22] concluded that the incorporation of alkaline aggregates could help increase the amplitude of drying shrinkage of the GRC and the cracking sensitivity of cementation materials by measuring the cracking time and the cracking degree of cement with different alkalinities. Kumarappa et al. [23] reported that the addition of alkaline materials affected the reaction degree and the surface tension of pore solutions based on shrinkage, heat flow, and surface tension of cements blended with Na2O and SiO2, thus affecting the shrinkage performance of cement. Wu et al. [24] studied the effect of cementation material composition on the shrinkage properties of GRC materials and concluded that GRC materials prepared with sulphate aluminate cement underwent the least amount of shrinkage, whereas GRC materials prepared with silicate cement shrunk to a greater extent. Additionally, the incorporation of fly ash and silica fume could effectively reduce drying shrinkage and self-shrinkage of GRC materials. Chylík et al. [25] studied the effect of modified gum powder on the shrinkage of GRC materials and concluded that the incorporation of gum powder could help reduce the internal gel pores and the macropores in the material, improve the hydrophilicity of cement, and thus improve flow and toughness of the GRC. Guo et al. [26] studied the effect of swelling agents on the shrinkage of GRC materials and concluded that GRC materials with swelling agents had fewer bonding cracks between the hydration products and the aggregates, better interfacial transition zone of concrete, and fewer cracks due to drying shrinkage.
On the other hand, it is necessary to control the content and the composition of glass fibers in a GRC material. Fiber is added to increase toughness and ductility of the cement base, improve the tensile strength of cement, reduce cracks, and prevent cracks from developing [27]. He et al. [28] studied the influence of fiber geometry on the cracking resistance of GRC and found that, with the increase in the fiber length and the decrease in the fiber diameter, the total plastic shrinkage cracking area of a cement mortar showed a downward trend, and the cracking resistance improved correspondingly. Shen et al. [29] found that the shrinkage strain of fiber-reinforced concrete decreased with the increase in the fiber volume percentage and put forward a prediction model for the early self-shrinkage strain of fiber-reinforced concrete. Kasagani and Rao [30] studied the effect of fiber grading on the crack resistance of GRC, suggesting that short fibers mainly controlled the expansion of microcracks and improved the ultimate strength, while longer fibers inhibited macrocracks and alleviated the deformation of concrete. Consequently, the combination of long and short fibers could help prevent microscopic and macroscopic cracks from developing, thus improving the crack resistance of concrete.
In summary, previous studies on the mechanics and shrinkage performance of GRC mainly focused on pure GRC prefabricated components, and most of the experiments were carried out in a relatively constant temperature and humidity environment. The GRC-PC composite wall panel studied in this paper was to be used both inside and outside the building, with great changes in temperature and humidity. In addition, the shrinkage rate of concrete was less than that of GRC; in this scenario, the concrete layer would hinder the shrinkage of GRC layer when they were combined, which would increase the tensile stress in the GRC layer, causing GRC layer cracking. To improve the crack resistance of the GRC-PC composite wall panel, the research idea of this paper was as follows. First of all, the GRC material formula was adjusted, and the compressive strength and the elastic modulus of the material were measured. Secondly, according to the different interface types of GRC layer and PC layer, seven wall panels of 1 m × 1 m were prepared, and the shrinkage experiment was carried out for 365 days in environments with different temperature and humidity. Among them, the crack resistance of the GRC layer was the core of the test. Finally, according to experimental results, the reasonable interface type between the GRC layer and the PC layer was determined. Findings from this research contribute to application of GRC-PC composite wall panels and promotion of prefabrication.

2. Materials and Methods

2.1. Experimental Raw Materials and Equipment

The raw materials required for the experiment were C30 concrete and GRC mortar. Among them, C30 concrete was produced by a concrete factory, and the GRC material was prepared by mixing in the experimental site; GRC materials are prepared by mixing the raw materials listed in Figure 2 in the experimental site.
Portland cement, sand, fly ash, water reducing agent, and glass fiber are the traditional GRC formulations. In order to improve the crack resistance of the GRC material, the formula was adjusted, that is, we added rubber powder, expanding agent, metakaolin, and titanium dioxide.
The role of rubber powder was to reduce GRC internal porosity and improve the hydrophilicity of cement so as to increase its mobility and toughness [25]. The function of the expanding agent was to reduce the bond crack between hydration products and aggregate [26]. The role of metakaolin was to improve the pore structure of the cement mortar and improve uniformity and compactness of the mortar structure [31]. Titanium dioxide was used to improve the brightness to achieve the effect of decoration.
Table 1 lists the mix proportion of mortar of GRC, in which the cementing material and the sand were 8:9, and the water–binder ratio was 0.28.
Figure 3 shows the instruments and the equipment used in the experiment, including a compression testing machine, which was used to measure the compressive strength and the elastic modulus of the raw materials (C30 concrete and GRC materials). An embedded strain sensor DH1204 and a surface strain sensor DH1205 were used to measure the strains of the GRC and the PC layers, respectively. A DH3818Y static strain tester was used for strain data collection and recording.

2.2. Experiment on Mechanical Properties of Materials

The compressive strength and the modulus of elasticity are the basic mechanical properties of materials. Tests were carried out on the mechanical properties prior to the fabrication of the test elements to ensure that the material strength met the requirements. The twelve test blocks for the modulus of elasticity and compressive strength tests were divided into four groups of three blocks each based on the curing time listed in Table 2.
After curing each group of test blocks for the corresponding days, we installed strain sensors on their surface and connected the static strain tester. We then employed the compression testing machine to carry out a pressure test on the test blocks until they were destroyed. Figure 4 shows the experimental process.
The compressive strength was calculated using the following formula:
F c u = F A ,
where Fcu is the compressive strength (MPa) of C30 concrete and GRC cube specimens; F is the failure load (N) of the specimen; A is the bearing area (mm2) of the specimen.
The measurement and the calculation formula of the elastic modulus were:
E c = F a F 0 A × L Δ n ,
where Ec is the elastic modulus of the specimen; Fa is the load at which the stress reaches one third of the axial compressive strength value; F0 is the initial load (N) when the stress is 0.5 MPa; L is the measuring gauge distance (mm); A is the bearing area of the specimen (mm2); Δn is the average value (mm) of the deformation on both sides of Fa from F0 loading.

2.3. Shrinkage Experiment of GRC-PC Composite Wall Panels

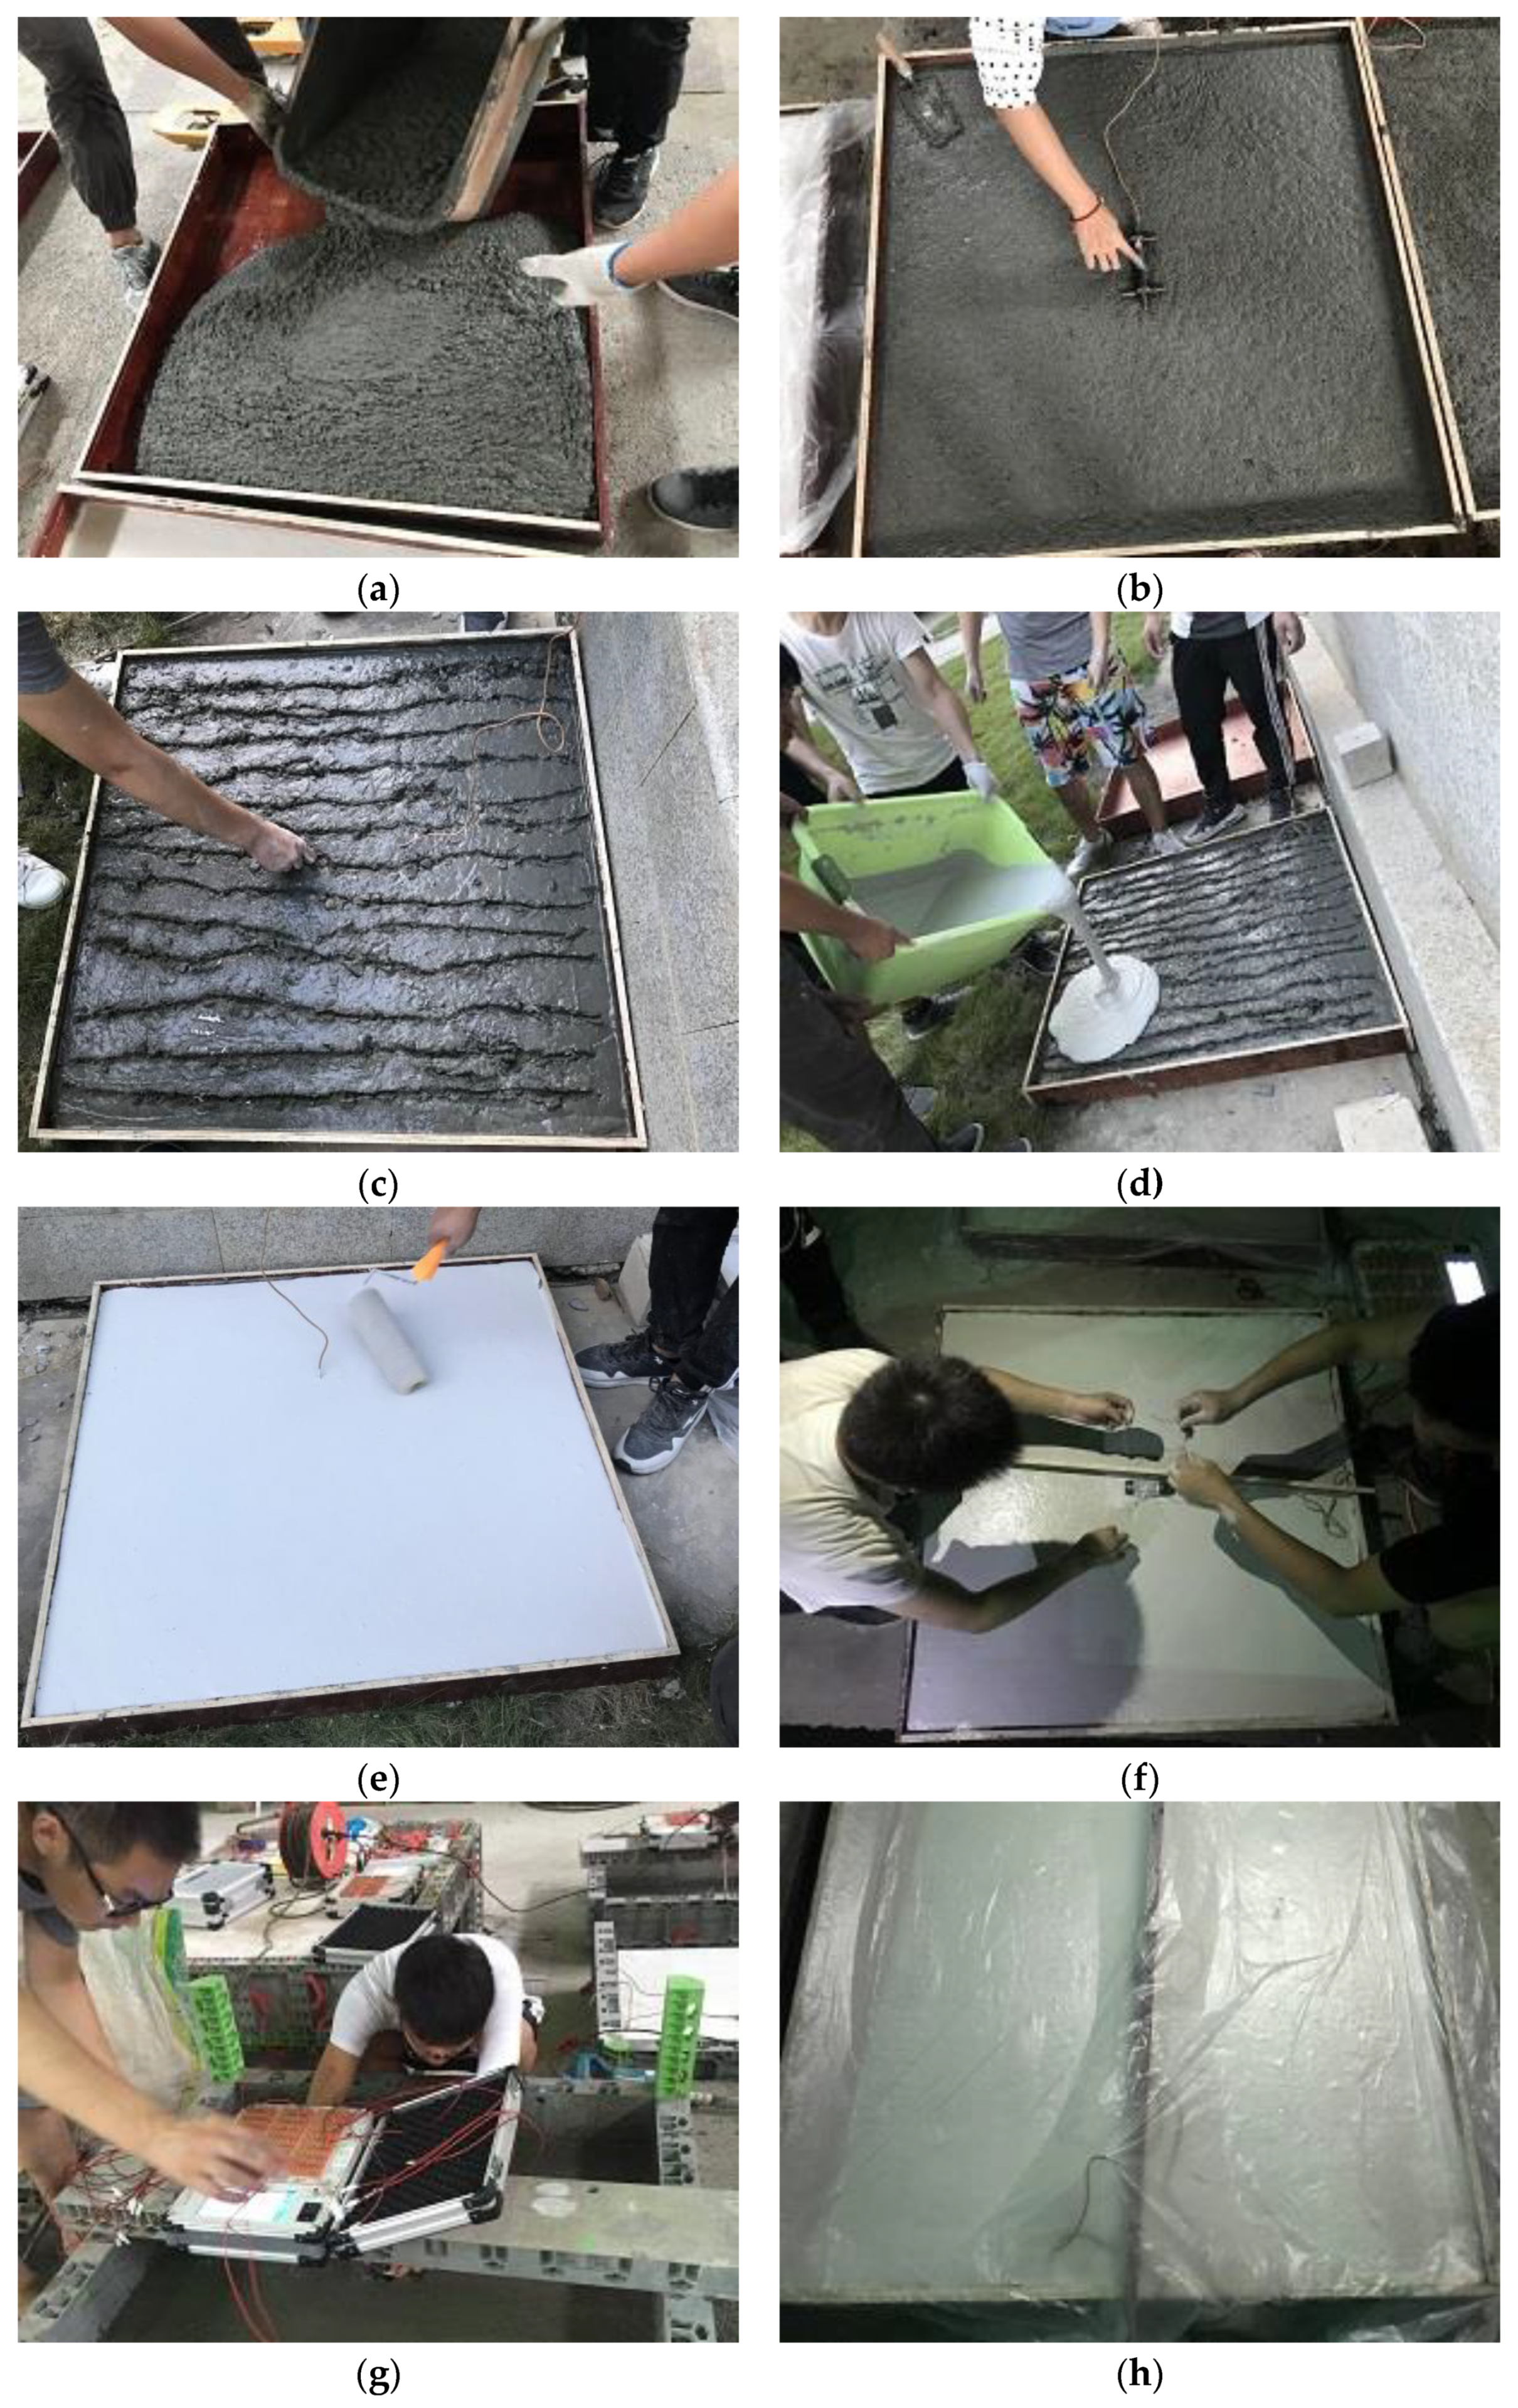
2.3.1. Specimen Design

A total of seven groups of components (S0 to S6) were designed for the shrinkage experiment. S0 and S1 were panels made of GRC without and with glass fiber, respectively; S2 was a panel made of concrete; S3 to S6 were GRC-PC composite wall panels made according to Figure 1, which omitted the concrete structure layer and the insulation layer, as shown in Figure 5. Table 3 lists the specific parameters. Because of the limitations of the experimental site, the length and the width of the wall panel were designed to be 1000 mm × 1000 mm, and the thicknesses of the GRC and the PC layers were set to 15 mm and 60 mm, respectively. For the interface between GRC and PC, two commonly used concrete surface processes were adopted: smooth surface (surface smoothing) and rough surface (surface grabbing).
The design idea of the components was as follows: S0 panel was a member without glass fiber, which was mainly used to observe the way of crack development so as to determine the location of the strain sensor. Other panels (S1 to S6) took the interface type and the environment as variables to determine the applicable structural type of GRC-PC wall panel.

2.3.2. Process of Experiment

Before collecting data from the shrinkage experiment, we first completed the fabrication of each group of wall panels (Table 3) and the installation of strain sensors, as shown in Figure 6. The placement of the strain sensor, as shown in Figure 7, was determined by the distribution of S0 cracks, which is explained in the next chapter.
The specific process was as follows.
(1) Brush the surface of the template with release oil and then pour the concrete to the height of the specified scale of the template;
(2) Vibrate the concrete and bury the embedded strain sensor at the center of the concrete;
(3) Machine the surfaces of wall panels of different types;
(4) Pour the mixed GRC material into the initial setting concrete and level the surface with a roller;
(5) Install and fix the surface strain sensor at the center of the GRC layer;
(6) Switch on the static strain tester and cover with a film for maintenance.
Since the shrinkage deformation of the wall panel is influenced by the ambient temperature and the humidity, in the experiment, we recorded daily indoor and outdoor temperatures and humidity in the morning, the afternoon, and the evening during the test period while taking the shrinkage strain measurement. The average value of the temperature in the three periods was taken and plotted as the temperature and humidity curve, as shown in Figure 8. As shown, the temperature amplitude was lower in the indoor environment than in the outdoor environment, whereas the air humidity was higher in the indoor environment than in the outdoor environment. Since cement-based cementitious materials are more suitable for maintenance and use in an environment with small temperature difference and high humidity [32], the outdoor environment, compared with the indoor environment, is more severe and places higher requirements on GRC-PC composite wall panels to resist cracking.

3. Results and Discussion

3.1. Experimental Results of Mechanical Properties of Materials

Table 4 and Table 5 list the measured compressive strength and elastic modulus, respectively. From Table 4, we found that the compressive strengths of three GRC and concrete test blocks reached the standard compressive strength value on the 28th day, and the average value was within the error range.

3.2. Shrinkage Experiment Results and Discussion

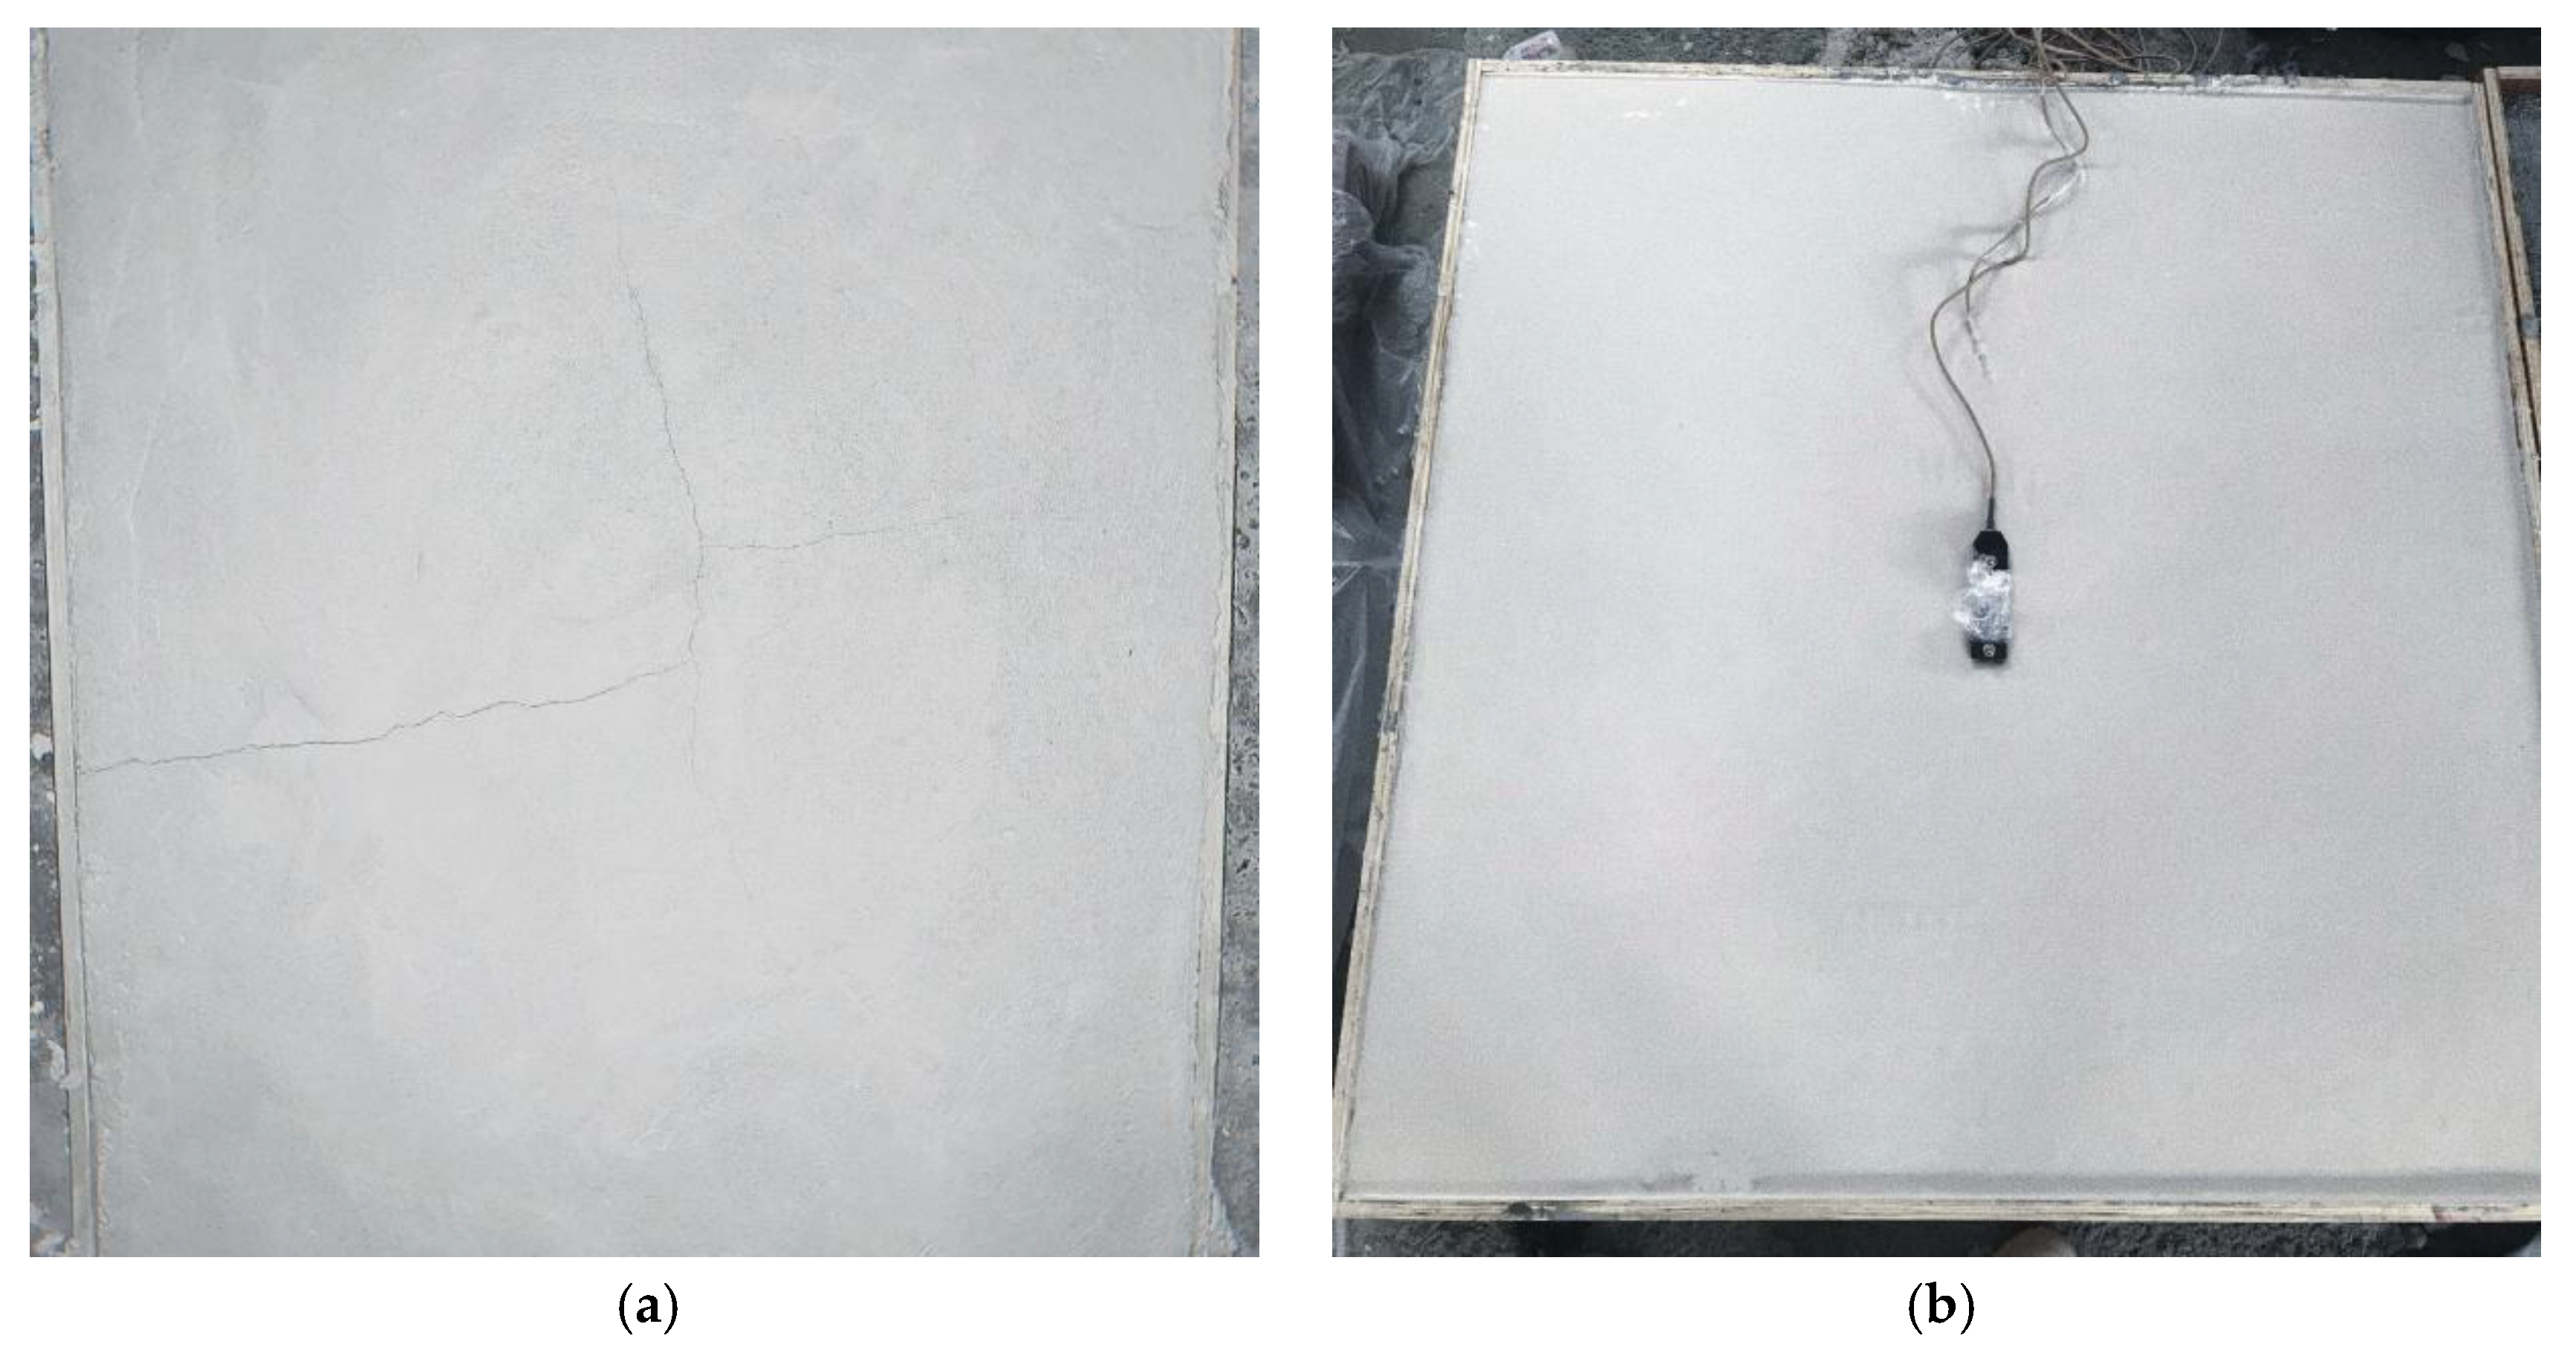
3.2.1. Cracking Analysis of Experimental Panels

The S0 panel was completed on 1 June 2019 and placed in an indoor environment for shrinkage experiments. As a member made of a single material, the S0 was subjected to free shrinkage. Three months later, cracks emerged in the S0 plate. As shown in Figure 9a, the cracks located in the middle of the panel in a cross distribution. These phenomenon indicated that different parts of the panel had different shrinkage and deformation. Thus, the shrinkage stress was generated in the panel. The distribution of cracks indicated that the shrinkage deformation in the middle of the panel was more limited, which led to the shrinkage stress exceeding the tensile limit of the material and finally cracking. Therefore, it was reasonable to place the strain gauge in the center of the panel (Figure 9b). At the same time, S1 to S6 did not crack during the monitoring period, and it can be concluded that the new GRC-PC composite wall panel met the crack resistance requirements.
In order to have a visual display of the shrinkage deformation of all specimens, the strain curves of the S1 to S6 wall panels, shown in Figure 10, were plotted based on the data collected by the strain sensor during the experimental period. Figure 10a shows the strain of GRC layer of wall panels collected by surface strain sensor, and Figure 10b shows the strain of PC layer of wall panels collected by embedded strain sensor. The strain curves of S1 and S2, which represent pure GRC and pure PC panels, respectively, were used as the standard free shrinkage curves for the material. The other wall panels were classified in terms of environment and type of interface, and each set of strain curves was compared with the standard free shrinkage curve of the material as the crack resistance curve. The analysis was judged by the degree of adaptability, i.e., the more closely the crack resistance curve fit the standard free shrinkage curve of the material, the closer was the shrinkage of the corresponding composite wall panel to the standard free shrinkage, the lower was the resulting shrinkage stress, and the lower was the likelihood of panel cracking. Table 6 lists the maximum strain values of each group of wall panels.

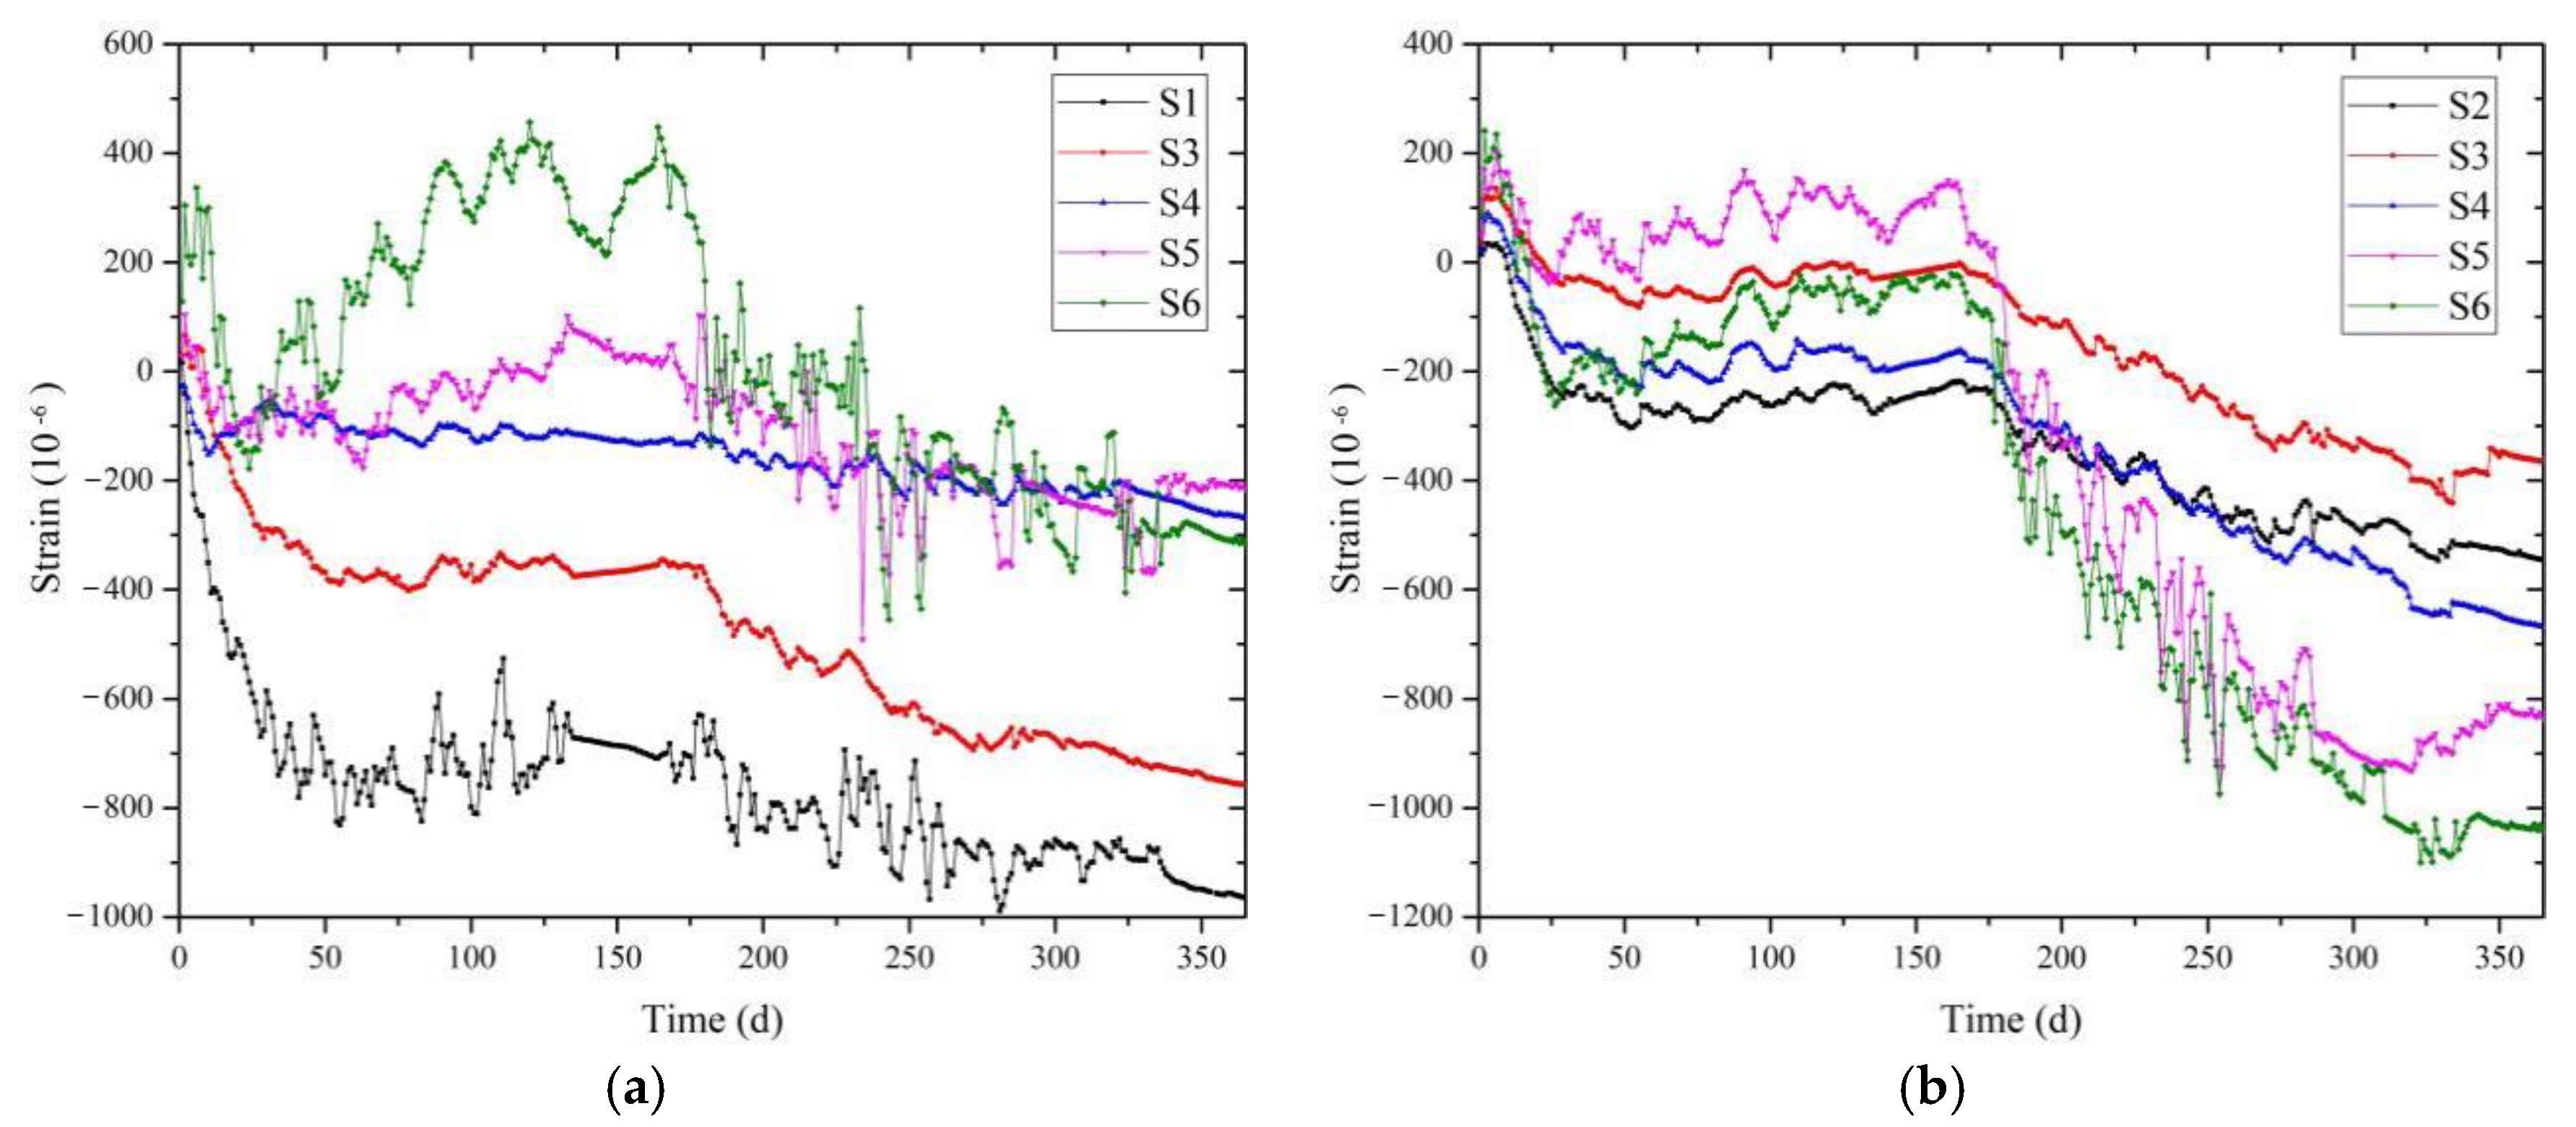
3.2.2. Shrinkage Analysis of Wall Panels with Different Interface Types

Because of the significant influence of environmental factors on the shrinkage of the composite wall panels, the shrinkage of wall panels with different types of interfaces under two environments, indoor and outdoor, were analyzed separately. Figure 11a,b show the strain curves of panels with different interfaces in an indoor environment. Figure 11c,d show the strain curves of panels with different interfaces in an outdoor environment.
As shown in Figure 11a,b, the strain values of the GRC and the PC layers of S3 and S4 followed approximately the same strain curve trend over the monitoring duration. At the beginning of the experiment, the concrete and the GRC materials expanded in volume and were pulled under the effect of hydration heat. With the hydration reaction gradually weakening until disappearing, the GRC material began to shrink, the GRC-PC strain value decreased to a negative value, and the panel began to be under pressure. In the middle and the later stages of the test, the strain showed a small wave change, which indicated that the shrinkage of the GRC materials tended to be stable. By comparing the three curves, we found that the GRC strain of the composite wall panel with a smooth interface in the indoor environment was closer to S1 strain, whereas the PC of the composite wall panel with a rough interface changed to S2 strain, indicating that the interface type of the composite wall panel significantly influenced the shrinkage. From the data listed in Table 6, we found that the shrinkage strains of the GRC material and the concrete with a smooth interface decreased by 23% and 19%, respectively, in the indoor environment, and the shrinkage strain of the GRC material with a rough interface decreased by 72% and that of the concrete increased by 22%. Therefore, the use of a smooth interface is more conducive to improving the shrinkage performance of GRC-PC composite wall panels installed in indoor environments.
Figure 11c,d show a fluctuation in the strain curve of the composite wall panel in the outdoor environment. This was attributed to the significant changes in the temperature and the humidity of the outdoor environment, and the shrinkages of both the PC and the GRC layers were significantly affected. The overall trend in the outdoor strain was similar to that in the indoor strain: both types of layers were in a state of tension in the early stages and began to contract under pressure as the hydration reaction diminished. From the data listed in Table 6, we found that the shrinkage strains of the GRC material and the concrete with a smooth interface decreased by 50% and 75%, respectively, in the outdoor environment, and the shrinkage strain of the GRC material with a rough interface decreased by 54% and that of concrete increased by 50%. Therefore, the use of a smooth interface is more conducive to improving the shrinkage performance of GRC-PC composite wall panels installed in outdoor environments.
In summary, composite wall panels with a smooth interface exhibit better shrinkage performance in both indoor and outdoor environments. It can be concluded that the rough PC surface increases the constraint on the GRC layer, which is not conducive to the free shrinkage of the GRC material, and consequently, the possibility of cracking of the GRC layer increases.

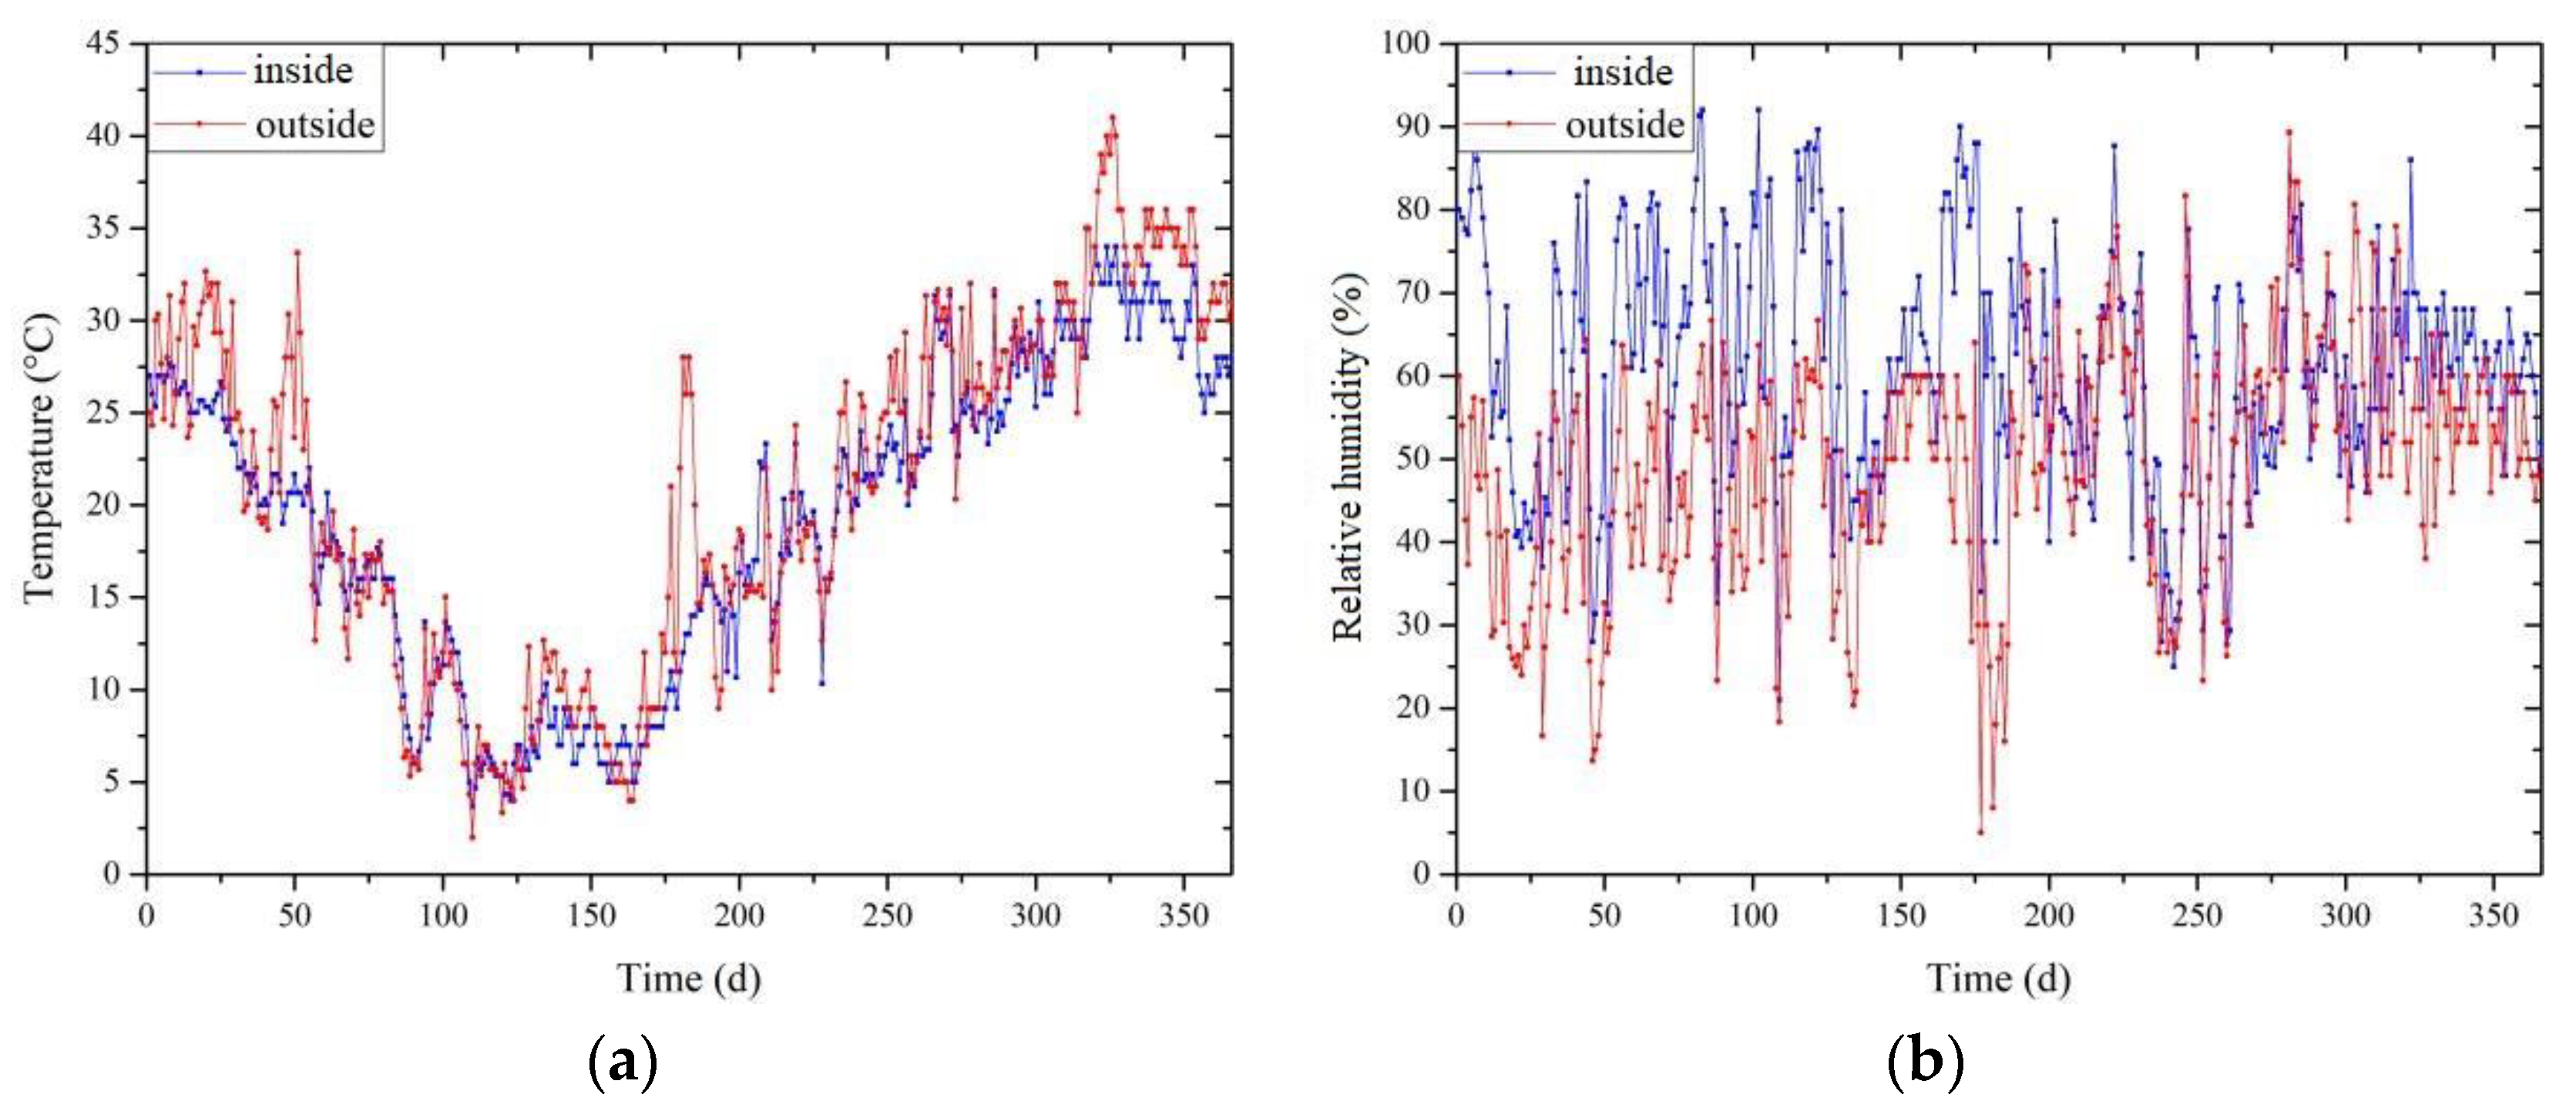
3.2.3. Shrinkage Analysis of Wall Panel under Different Environments

The composite wall panels with the same type of interface were used to compare and analyze their shrinkage patterns in both indoor and outdoor environments.
Figure 12a,b show the strain curves of the composite wall panel with a smooth interface in different environments. Figure 12c,d show the strain curves of the composite wall panel with a rough interface in indoor and outdoor environments. Figure 10a shows a similar overall trend in the GRC strains of S1, S3, and S5, with the GRC shrinkage strain of S3 being significantly lower than that of S5. Figure 12b shows that the strain curves of S2, S3, and S5 followed a similar trend in the early stage, whereas the S5 curve exhibited a downtrend in the later stage. The range of variation in the PC shrinkage strains for S2 and S3 was roughly similar, and the maximum shrinkage strains of PC for S2 and S3 were significantly less than those for S5. From the data listed in Table 6, the shrinkage strain of the GRC was reduced by 23% and 50%, whereas the shrinkage strain of the PC was reduced by 19% and increased by 75% for the composite wall panels with a smooth interface in indoor and outdoor environments, respectively. It can be concluded that, compared with the indoor environment, the GRC-PC panel with a smooth interface has a wider variation range of shrinkage strain in the outdoor environment. It was proven that the shrinkage of composite wall panels is significantly affected by the temperature.
Figure 12c shows that the strain of S6 gradually increased, whereas that of S4 did not change significantly, and the shrinkage strains of both S4 and S6 were lower than that of S1. Figure 12d shows that S2, S4, and S6 had similar stress change trends in the early stages, and the stress change in S6 was greater than those in S2 and S4 in the later stages because of the significant change in the outdoor temperature. From the data listed in Table 6, we found that the shrinkage strain of the GRC was reduced by 72% and 54%, whereas the shrinkage strain of the PC was increased by 22% and 101% for the composite wall panels with a rough interface in indoor and outdoor environments, respectively. It can be concluded that, compared with the indoor environment, the GRC-PC with a rough interface has a wider variation range of shrinkage strain in the outdoor environment.
In summary, the shrinkage deformation degree of GRC-PC composite wall panels with two types of interfaces is greater in the outdoor environment than in the indoor environment. Although the GRC-PC has a greater shrinkage strain amplitude in a relatively harsh outdoor environment than in an indoor environment with suitable temperature and humidity, there was no sharp increase or decrease in the strain value due to component cracking, which indicates that the cracking resistance of the GRC-PC composite wall panel made of the new GRC material meets the requirements of the outdoor environment.

4. Conclusions

This research investigated the crack resistance and the facade effect of the GRC-PC integrated composite wall panels under different environments through an experimental research. The following conclusions can be drawn.
(1) According to the experimental results of S0, the cracks of wall panels are concentrated in the center position, where the shrinkage stress value is also the largest. In addition, fiber is an indispensable material to improve the crack resistance of GRC by comparing the cracks of S0 and S1.
(2) By studying the shrinkage performance of GRC-PC composite wall panels with different types of interfaces, we can conclude that the shrinkage deformation amplitude of the composite wall panel with a smooth interface is lower than that of the composite wall panel with a rough interface in both indoor and outdoor environments. The strain law of pure GRC and PC panels indicates that the processing method with the smooth interface is more beneficial to the crack resistance of composite wall panels in practice.
(3) The shrinkage deformation amplitude of GRC-PC composite wall panels with two types of interfaces was found to be greater outdoors than indoors. The shrinkage strain of the composite wall panels in the outdoor environment was in line with the free shrinkage law of the material, and no cracking occurred in any of the wall panels during the monitoring period, indicating that the crack resistance of the GRC-PC composite wall panels can be ensured in both indoor and outdoor environments.
GRC-PC insulation composite wall panel is a new type of prefabricated wall which can greatly reduce pollution, shorten the construction period, and improve the construction efficiency. The research in this paper provides an experimental basis for the large-scale application of the wall panel.
Due to the complexity of materials and the uncertainty of environmental changes, this paper was not able to find a reasonable and reliable finite element analysis model for the finite element analytical method, which is the research direction of future research.

Author Contributions

Conceptualization, D.C., P.L. and B.C.; methodology, D.C., P.L., H.C. and B.C.; formal analysis, D.C., P.L. and B.C.; investigation, D.C., H.C. and B.C.; resources, Q.W.; data curation, P.L. and B.C.; writing—original draft preparation, D.C., P.L., B.Z. and Q.W.; writing—review and editing, D.C., P.L. and B.C.; visualization, B.Z. and B.C.; supervision, B.Z.; project administration, D.C.; funding acquisition, D.C. All authors have read and agreed to the published version of the manuscript.

Funding

This work was supported by Natural Science Foundation of Anhui Province (19080885ME173), Research & Development project of China State Construction International Holdings Limited (CSCI-2020-Z-06-04), and Science and Technology Project of Anhui Province Housing and Urban-Rural Construction (2020-YF47).

Institutional Review Board Statement

Not applicable.

Informed Consent Statement

Not applicable.

Data Availability Statement

All data have been included in the manuscript.

Conflicts of Interest

The authors declare no conflict of interest.

References

  1. Majumdar, A.J.; Laws, V. Glass Fiber Reinforced Cement; BSP Professional Books: Oxford, UK, 2001; pp. 46–53. [Google Scholar]
  2. Enfedaque, A.; Gálvez, J.C.; Suárez, F. Analysis of fracture tests of glass fiber reinforced cement (GRC) using digital image correlation. Constr. Build. Mater. 2015, 75, 472–487. [Google Scholar] [CrossRef]
  3. Cheng, C.; He, J.; Zhang, J.; Yang, Y. Study on the time-dependent mechanical properties of glass fiber reinforced cement (GRC) with fly ash or slag. Constr. Build. Mater. 2019, 217, 128–136. [Google Scholar] [CrossRef]
  4. Baghdadi, A.; Heristchian, M.; Kloft, H. Design of prefabricated wall-floor building systems using meta-heuristic optimization algorithms. Autom. Constr. 2020, 114, 103156. [Google Scholar] [CrossRef]
  5. Zhang, Z.; Chen, J.; Elbashiry, E.M.A.; Guo, Z.; Yu, X. Effects of changes in the structural parameters of bionic straw sandwich concrete beetle elytron plates on their mechanical and thermal insulation properties. J. Mech. Behav. Biomed. Mater. 2019, 90, 217–225. [Google Scholar] [CrossRef] [PubMed]
  6. Noël, M.; Soudki, K. Estimation of the crack width and deformation of FRP-reinforced concrete flexural members with and without transverse shear reinforcement. Eng. Struct. 2014, 59, 393–398. [Google Scholar] [CrossRef]
  7. João, R.C.; João, F.; Fernando, A.B. A rehabilitation study of sandwich GRC facade panels. Constr. Build. Mater. 2005, 20, 554–561. [Google Scholar] [CrossRef]
  8. Brandt, M.A. Fiber reinforced cement-based (FRC) composites after over 40 years of development in building and civil engineering. Compos. Struct. 2008, 1, 86. [Google Scholar] [CrossRef]
  9. Abaeian, R.; Behbahani, H.P.; Moslem, S.J. Effects of high temperatures on mechanical behavior of high strength concrete reinforced with high performance synthetic macro polypropylene (HPP) fibers. Constr. Build. Mater. 2018, 165, 631–638. [Google Scholar] [CrossRef]
  10. Ferreira, J.; Branco, F. Structural application of GRC in telecommunication towers. Constr. Build. Mater. 2007, 21, 19–28. [Google Scholar] [CrossRef]
  11. Liu, Y.F.; Wu, C.F. Experimental study on the elasticity modulus of glass fiber reinforced concrete. Concrete 2017, 6, 64–66+79. [Google Scholar] [CrossRef]
  12. Zhao, W.H.; Su, Q.; Li, T.; Huang, J.J. Experimental research on mechanical properties of light-weight foamed concrete with glass fiber reinforcement. Indust. Constr. 2017, 47, 110–114+80. [Google Scholar] [CrossRef]
  13. Shen, W.; Yang, D.Y.; Luo, J.J.; Huang, J.S.; Liu, X.; Zhu, Z.D. Research of the long-term mechanical properties of alkali resistant glass fiber concrete. Concrete 2017, 6, 102–106. [Google Scholar]
  14. Qian, W.; He, W.X. The Study on Mechanical Properties of Glass Fiber and Fly Ash Composite Cement Soil. J. Solid Waste Technol. Manag. 2018, 44, 361–369. [Google Scholar] [CrossRef]
  15. Lura, P.; Jensen, O.M.; Weiss, J. Cracking in cement paste induced by autogenous shrinkage. Mater. Struct. 2009, 42, 1089–1099. [Google Scholar] [CrossRef]
  16. He, Z.; Li, Z.J. Influence of alkali on restrained shrinkage behavior of cement-based materials. Cem. Concr. Res. 2004, 35, 457–463. [Google Scholar] [CrossRef]
  17. Sant, G. The influence of temperature on autogenous volume changes in cementitious materials containing shrinkage reducing admixtures. Cem. Concr. Compos. 2012, 34, 855–865. [Google Scholar] [CrossRef]
  18. Yuan, Z.; Jia, Y. Mechanical properties and microstructure of glass fiber and polypropylene fiber reinforced concrete: An experimental study. Constr. Build. Mater. 2021, 266, 121048. [Google Scholar] [CrossRef]
  19. Enfedaque, A.; Paradela, L.S.; Sánchez-Gálvez, V. An alternative methodology to predict aging effects on the mechanical properties of glass fiber reinforced cements (GRC). Constr. Build. Mater. 2012, 27, 425–431. [Google Scholar] [CrossRef] [Green Version]
  20. Bian, G.R.; Li, B.Z.; Li, M.; Xu, W.; Tian, Q. Influence of Variable Temperature Condition on Crack Resistance of Concrete. China Concr. Cem. Prod. 2021, 2, 23–26. [Google Scholar] [CrossRef]
  21. Ye, H.; Radlińska, A.; Neves, J. Drying and carbonation shrinkage of cement paste containing alkalis. Mater. Struct. 2017, 50, 132. [Google Scholar] [CrossRef]
  22. Nguyen, T.-T.; Waldmann, D.; Bui, T.Q. Phase field simulation of early-age fracture in cement-based materials. Int. J. Solids Struct. 2020, 191–192. [Google Scholar] [CrossRef]
  23. Kumarappa, D.B.; Peethamparan, S.; Ngami, M. Autogenous shrinkage of alkali activated slag mortars: Basic mechanisms and mitigation methods. Cem. Concr. Res. 2018, 109, 1–9. [Google Scholar] [CrossRef]
  24. Wu, Z.T.; Zhang, Y.S.; Liu, N.D.; Zhang, Y.T.; Yuan, D.F.; Wang, T.; Gu, J.S. Shrinkage properties of glass fiber reinforced cement-based materials. Bull. Chin. Ceram. Soc. 2019, 38, 2570–2577. [Google Scholar] [CrossRef]
  25. Chylík, R.; Fládr, J.; Petr, B.; Trtík, T.; Vráblík, L. An analysis of the applicability of existing shrinkage prediction models to concretes containing steel fibers or crumb rubber. J. Build. Eng. 2019, 24. [Google Scholar] [CrossRef]
  26. Guo, J.; Zhang, S.; Guo, T.; Zhang, P. Effects of UEA and MgO expansive agents on fracture properties of concrete. Constr. Build. Mater. 2020, 263, 120245. [Google Scholar] [CrossRef]
  27. Moosa, M.; Hemin, K.; Mohammad, K. Fracture behavior of monotype and hybrid fiber reinforced self-compacting concrete at different temperatures. Adv. Concr. Constr. 2020, 9, 375–386. [Google Scholar]
  28. He, J.H.; Cheng, C.M.; Zhang, Y.F.; Hong, S.L. Effect of glass fiber parameters on plastic shrinkage cracking of mortar. Concrete 2020, 10, 118–120. [Google Scholar]
  29. Shen, D.; Wen, C.; Zhu, P.; Wu, Y.; Wu, Y. Influence of Barchip fiber on early-age autogenous shrinkage of high-strength concrete internally cured with super absorbent polymers. Constr. Build. Mater. 2020, 264, 119983. [Google Scholar] [CrossRef]
  30. Kasagani, H.; Rao, C. Effect of graded fibers on stress strain behaviour of Glass Fiber Reinforced Concrete in tension. Constr. Build. Mater. 2018, 183, 592–604. [Google Scholar] [CrossRef]
  31. Li, Q.R.; Xu, R. Experimental study on RAC performance enhancement and micro action mechanism of metakaolin. Concrete 2021, 5, 84–87. [Google Scholar] [CrossRef]
  32. Almusallam, A.A. Effect of environmental conditions on the properties of fresh and hardened concrete. Cem. Concr. Compos. 2001, 23, 353–361. [Google Scholar] [CrossRef]
Figure 1. Schematic of a GRC-PC external wall structure.
Crystals 11 00775 g001
Figure 2. GRC raw materials.
Crystals 11 00775 g002
Figure 3. Equipment used in the experiment: (a) DH1204 embedded strain sensor; (b) DH1205 surface strain sensor; (c) DH3818Y static strain tester; (d) compression testing machine.
Crystals 11 00775 g003
Figure 4. Experimental process of mechanical properties of materials: (a) Manufacture of concrete test block; (b) manufacture of GRC test block; (c) grouping and pasting of test blocks; (d) loading of test block.
Crystals 11 00775 g004
Figure 5. Three-dimensional model of a composite wall panel.
Crystals 11 00775 g005
Figure 6. Experimental process: (a) pouring concrete; (b) placing embedded strain sensor; (c) surface processing; (d) pouring GRC material; (e) leveling the GRC surface; (f) placing surface strain sensors; (g) connecting the static strain tester; (h) covering film maintenance.
Crystals 11 00775 g006
Figure 7. Strain sensor location in the composite wall panel.
Crystals 11 00775 g007
Figure 8. Temperature and humidity curves during the test period: (a) Indoor and outdoor temperatures vs. time curves; (b) indoor and outdoor humidity vs. time curves.
Crystals 11 00775 g008
Figure 9. Cracking condition of S0 and S1: (a) S0; (b) S1.
Crystals 11 00775 g009
Figure 10. Strain curve of wall panels: (a) Strain curve of GRC layer for each panel; (b) strain curve of PC layer for each panel.
Crystals 11 00775 g010
Figure 11. Strain curves of wall panels with different types of interfaces: (a) GRC strain curves of S1, S3, and S4; (b) PC strain curves of S2, S3, and S4; (c) GRC strain curves of S1, S5, and S6; (d) PC strain curves of S2, S5, and S6.
Crystals 11 00775 g011
Figure 12. Strain curves for wall panels in different environments: (a) GRC strain curves of S1, S3, and S5; (b) PC strain curves of S2, S3, and S5; (c) GRC strain curves of S1, S4, and S6; (d) PC strain curves of S2, S4, and S6.
Crystals 11 00775 g012
Table 1. Mix proportion of mortar of GRC.
Cement
(kg/m3)
Sand
(kg/m3)
Water
(kg/m3)
Fly Ash
(kg/m3)
Metakaolin (kg/m3)Water Reducing Admixture (kg/m3)Glass Fiber
(kg/m3)
Rubber Powder
(kg/m3)
Expansion Agent
(kg/m3)
88812483225616631342864
Table 2. Parameters of material test block.
Type of Material Property TestTest Block Size (mm)Type and Number of Test Blocks
Compressive strength test150 × 150 × 150GRC-12PC-12
Elastic modulus test150 × 150 × 150GRC-12PC-12
Table 3. Dimensional parameters of GRC-PC composite wall panels.
Specimen NumberSpecimen Size
(Length × Width × Height) (mm)
GRC Thickness (mm)Concrete Thickness (mm)Type of InterfaceEnvironmentPeriod
S01000 × 1000 × 1515----indoor1 June 2019 to 1 September 2019
S11000 × 1000 × 1515----indoor1 October 2019 to 1 September 2020
S21000 × 1000 × 60--60--indoor
S31000 × 1000 × (15 + 60)1560smoothindoor
S41000 × 1000 × (15 + 60)1560roughindoor
S51000 × 1000 × (15 + 60)1560smoothoutdoor
S61000 × 1000 × (15 + 60)1560roughoutdoor
Table 4. Measurement results of compressive strength experiment.
GroupAge (d)MaterialsCompressive Strength (MPa)Average Compressive Strength (MPa)
Specimen 1Specimen 2Specimen 3
I7GRC52.5760.2555.7856.20
Concrete24.3625.4223.7824.52
II14GRC59.6860.5257.2459.15
Concrete26.5927.1528.4627.40
III21GRC67.5063.6260.4763.86
Concrete28.0028.5729.6128.73
IV28GRC67.2765.8666.8566.66
Concrete31.0231.0131.0730.68
Table 5. Measurement results of elastic modulus experiment.
GroupAge(d)MaterialsElastic Modulus Values (GPa)Average Modulus of Elasticity (GPa)
Specimen 1Specimen 2Specimen 3
I7GRC27.2028.527.4527.72
Concrete23.4021.8722.4522.57
II14GRC27.6028.6429.6328.62
Concrete25.7123.4323.8724.34
III21GRC28.3228.9029.8029.01
Concrete27.2528.2128.9628.14
IV28GRC30.6330.7133.3531.56
Concrete29.3231.4730.6330.47
Table 6. Maximum strain values of the GRC and PC layers for each group of wall panels.
NumberMaximum Strain Value of GRC (MPa)Maximum Strain Value of PC (MPa)
S1988.934 × 10−6-
S2-546.987 × 10⁻⁶
S3759.234 × 10−6441.238 × 10−6
S4270.548 × 10−6668.534 × 10−6
S5490.728 × 10−6975.871 × 10−6
S6454.864 × 10−61100.23 × 10−6
Publisher’s Note: MDPI stays neutral with regard to jurisdictional claims in published maps and institutional affiliations.

