Article

Quasi-Continuous Production and Separation of Lysozyme Crystals on an Integrated Laboratory Plant

Institute of Mechanical Process Engineering and Mechanics (MVM), Karlsruhe Institute of Technology (KIT), Straße am Forum 8, 76131 Karlsruhe, Germany
*
Author to whom correspondence should be addressed.
These authors contributed equally to this work.
Crystals 2021, 11(6), 713; https://doi.org/10.3390/cryst11060713
Submission received: 21 May 2021 / Revised: 9 June 2021 / Accepted: 15 June 2021 / Published: 21 June 2021
(This article belongs to the Special Issue Bulk Protein Crystallization)

Abstract

:
Vacuum crystallization with subsequent solid–liquid separation is a suitable method to produce and separate the temperature-sensitive protein lysozyme. The conventional process is performed batch-wise and on different devices, which in turn leads to disadvantages in terms of energy efficiency, contamination risk and process control. This publication therefore focuses on the application of the previously multistage process to a quasi-continuous, integrated single plant. The transfer occurs successively and starts with the substitution of the batch vessel by a process chamber. Afterwards, the filtration scale is increased and the formerly deployed membrane is replaced by an industrial filter cloth. Based on the results of these experiments, the complete process chain is successfully transferred to an integrated laboratory plant.

1. Introduction

Bulk protein crystallization for preparation or formulation requires new and adapted approaches in the field of process engineering and in the pharmaceutical-chemical industry. Hekmat [1] discussed the use of large scale protein crystallization as a replacement for chromatography and formulation steps, which reduce the number of downstream processing unit operations and costs. However, protein crystallization is still challenging especially when crystallizing from solutions containing impurities, because most proteins are sensitive to temperature, pH and ion strength changes. If these parameters vary too much, the protein can denature, which typically means that the tertiary structure is irreversibly altered and thus the function of the protein is lost. Furthermore, protein crystals, have lower mechanical strength compared to conventional ones, which makes further handling of the suspension more difficult [2]. To tackle these challenges, researchers alter proteins to enhance the crystallizabilty [3] and modify the crystals to improve stability [4].
The required supersaturation for crystallization is either achieved by reducing the solubility or by increasing the concentration of the target molecule. This is done by cooling, pH shift, addition of a precipitation agent or by removal, e.g., evaporation of solvent. As a result of the aforementioned challenges in the case of bulk protein crystallization, the typical method to enable protein crystallization is the use of a precipitation agent. These agents can be salts, organic solvents or polymers [5]. Crystallization using a precipitation agent, however, does not scale well because larger batches make it increasingly difficult to ensure a homogeneous distribution of the precipitation agent. Additionally, there are always high gradients at the inlet of the precipitation agent. Groß and Kind [6] therefore introduced a low temperature vacuum approach for protein crystallization. Their method relies on the boiling temperature reduction at lower ambient pressures which allows to use moderate temperatures for evaporating solvent and is hence suitable for proteins and other temperature-sensitive molecules. In further studies, Barros Groß and Kind [7] investigated the influence of seeding on the crystal size distribution of lysozyme. They found that seeding improved the reproducibility of the crystal size distribution for isometric lysozyme crystals. Hubbuch et al. [5] outlined the path of finding the right crystallization conditions from microscale phase screening to bulk protein crystallization and the final filtration step.
Filtration is the separation of a colloidal (e.g., particles) from a continuous phase using a porous filter medium [8]. In cake forming dead end filtration the particles are retained on the filter medium based on the particle size. In the case of protein crystallization this enables to capture the target crystals from the mother liquor. Typically, the experimental setup to design a filtration process requires a large amount of sample. This amount is not available in early product development or in microscale screening. Additionally, not all possible crystal shapes exhibit the same mechanical strength and filterability. Therefore, to investigate the filtration properties early in process development, Radel et al. [9] developed a small scale filtration device. It allows to determine the filtration properties with amounts of sample as small as 300 μ L . Radel et al. [10] applied this to isometric, rod-like and needle shaped lysozyme crystals and found that isometric and rod-like lysozyme crystals are easy to filter. Needle shaped lysozyme crystals, on the contrary, might break and have poorer filtration properties.
State of the art vacuum crystallization of proteins takes place in batches, which entails some disadvantages compared to a continuous mode of operation. This includes the down and cleaning times between the charges as well as the high energy consumption for start-up and shut-down sequences [11,12]. Besides the aspects mentioned, continuous processes offer a more constant product quality, an increased production capacity and easier controllable process conditions than batch manufacturing [12,13,14].
Conventional production techniques are characterized by the fact that almost every step is carried out on a different plant. On the one hand, this demands transport equipment such as pumps or pipelines, and on the other hand, increases the space requirement and the risk of undesirable product contamination during transfer between the individual units [15]. As a result, integrated plants become more and more important. Already established examples from the field of process engineering are the Titus-Nutschen Dryer [16], the Konfiltro [17] and the Belt Crystallizer developed by Dobler et al. [
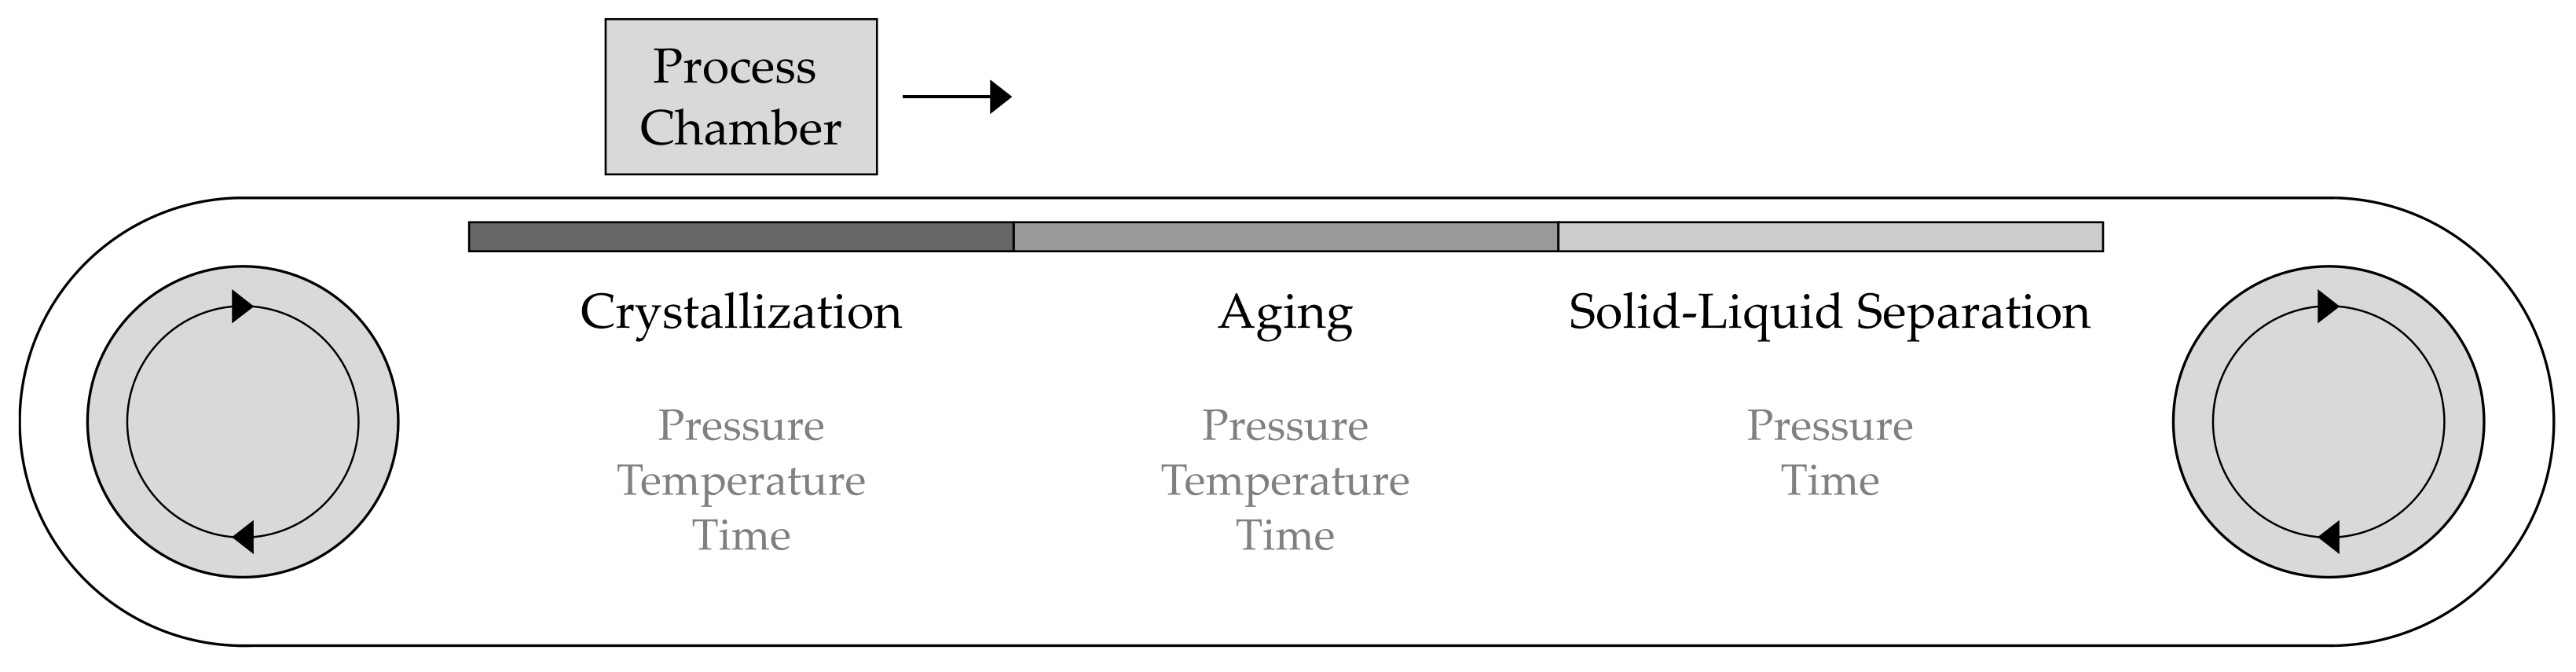
15]. The latter combines cooling crystallization, solid–liquid separation and contact drying on a belt filter and is used for quasi-continuous manufacturing of crystalline particles.
Since the present concept of the Belt Crystallizer is not suitable for temperature-sensitive products like proteins, we enhance the existing design by implementing vacuum crystallization. This enables the combined fabrication of protein crystals while benefiting from the advantages of integrated and quasi-continuous equipment.

2. Materials and Methods

2.1. Enhanced Belt Crystallizer

The focus of the paper lies on the transfer of a multi-stage batch process into its quasi-continuous form. In contrast to the conventional production method, the complete process chain (crystallization, aging and solid–liquid separation) is carried out on an integrated plant schematically shown in Figure 1.
Basis of the apparatus is a modified belt filter, in which the vacuum trays below the filter medium are replaced by flexible and interchangeable functional units. For the fabrication of protein crystals, temperature control units are located in the crystallization and aging section and filtration units in the solid–liquid separation area. The concept of the functional units is described in Dobler et al. [15].
Above the filter medium there is a newly developed process chamber which runs through the entire process chain and enables integrated, quasi-continuous vacuum crystallization for the first time. The left hand side of Figure 2 shows the schematic structure and the right-hand side the CAD rendering of the component. The body of the chamber is a rectangular, milled aluminum cuboid open at the bottom (1). The underside contains a 3D printed flat seal (2) that isolates the contents from the environment and prevents any leakage. On the top of the cuboid are ports for a vacuum pump (3), a stirring tool (4) and for a temperature sensor (5). The stirrer is used to ensure homogeneous mixing and the temperature sensor to monitor and control the process temperature. The front sides of the assembly are provided with angles for exact positioning and transport (6).
In the first process step, crystallization took place. For this purpose, the initial solution was added to the process chamber and brought to the required temperature. The procedure occurred at constant stirring in vacuum, so that even at comparatively low temperatures the solvent evaporates and thus supersaturates the system. This was followed by aging, in the course of which the supersaturation was reduced by the formation of crystalline structures at a given temperature and under a predefined pressure. In the next step, the suspension was separated into its solid and liquid components, resulting in the formation of a filter cake on the filter medium. Finally, the filter cake was removed from the filter.

2.2. Crystallization

Lyoszyme crystals were produced using vacuum crystallization analogous to Groß and Kind [6]. Therefore, two stock solutions were prepared. Stock solution A contained ultrapure water and a mass fraction of 0.211 hen egg white lysozyme (Lysozyme Granulated, Ovobest Eiprodukte GmbH & Co. KG, Neuenkirchen-Vörden, Germany). After the lysozyme had dissolved, the suspension was vacuum filtered with a glass fiber filter GF/B (Whatman, GE Healthcare GmbH, Solingen, Germany). The filter retains particles larger than 1 μ m . Subsequently, the protein mass fraction determined with UV absorbance was about 0.189. Stock solution B was a citrate buffer with mass fractions of 0.057 water free citric acid (Citric Acid, Carl Roth GmbH & Co. KG, Karlsruhe, Germany) and 0.025 sodium hydroxide (Sodium Hydroxide Pellets, VWR International GmbH, Darmstadt, Germany) dissolved in ultrapure water.
For each crystallization experiment, 100 g crystallization buffer were required. Hence, stock solution B was added to solution A in the process chamber so that the final mass fractions were 0.144 lysozyme and 0.009 citric acid. The pH of crystallization buffer was adjusted to 4.5 with 0.1 mol   dm 3 sodium hydroxide solution. Finally, the mixture was made up to 100 g with ultrapure water.
Lysozyme crystallizes polymorphic. At 24 ° C the crystals grow isometric, at 35 ° C rod-like particles form [6]. The process chamber was evacuated from ambient pressure to vapor pressure. At a temperature of 24 ° C the corresponding vapor pressure is 0.027 × 10 5 Pa . For the rod-like crystals at 35 ° C the vapor pressure is 0.055 × 10 5 Pa . To reduce foaming, the pressure was reduced with pauses for several minutes at 0.6 × 10 5   Pa and 0.8 × 10 5   Pa . This allowed dissolved gas to escape slowly. After reaching the final pressure, the solution was gently stirred and heated to provide the necessary evaporation enthalpy.
Initially, the crystallization buffer contained 25 m mol   dm 3 citric acid. During the process 50 g water evaporated and the concentration of citric acid increased to its final value of 50 m mol   dm 3 . Meanwhile, the concentration of lysozyme rose and the solubility decreased which lead to supersaturation and finally to crystallization. For the detailed process path please refer to Barros Groß and Kind [18].
After evaporation, the crystals need to age and grow. To reduce further evaporation the pressure was adjusted to 0.6 × 10 5 Pa at constant temperature during aging.

2.3. Microscopy

2.3.1. Bright-Field Light Microscopy

The crystal shape and size are easy to determine with a conventional light microscope (Leitz Orthoplan, Leitz GmbH, Wetzlar, Germany). To obtain evaluable images, the amount of crystals per image was reduced by diluting the crystal suspension with supernatant. Images were taken at 100× magnification with an integrated camera.
To quantify crystal size distributions from bright-field light microscopy we applied the software Fiji to the image stacks [19]. First, the images were converted from RGB to 8 bit gray scale. Afterwards, the contrast of the image stack was normalized and the images were binarized with Fiji’s default thresholding method [20]. Subsequently, we applied the “Analyze Particles” plugin to obtain the area and maximal diameters of each particle. Particles touching an image border were excluded to avoid underestimation of particle sizes.
From the projection areas A P of the particles the cumulative particle size distributions ( Q 2 ) were calculated. The typically used diameter of a sphere x eq with equivalent projection area however, is not a suitable parameter for elongated particles like rods. Therefore, we took the maximum diameter for the rod-like and the equivalent diameter for isometric particles to calculate the Q 2 distribution with the corresponding projection areas. The distribution for n discrete classes of particle sizes x i follows
Q 2 ( x i ) = j = 0 i a j j = 0 n a j ,
with the cumulated area a j as
a j = A P for 1 4 π x j 1 2 A P < 1 4 π x j 2 for isometric crystals , A P for x j 1 x max A P < x j for rod - like crystals .
For isometric crystals Equation (2) sums up the projection areas of particles that fall within one particle size class x j . In the case of rod-like crystals, Equation (2) summarizes the projection areas which are obtained from a lookup table that matches the maximum diameter with the corresponding area. The maximum diameter and the projection area were both determined with image analysis.

2.3.2. Laser Scanning Microscopy

Laser scanning microscopy is a method for creating high-contrast light images and thus for determining the surface properties of a sample. Therefore, the specimen is scanned sequentially with a confocal laser beam in different layers. Since both the sample and the aperture are focused equally, the detector only records information from the focal plane. Finally, the received pixel information serves to reconstruct the surface [21].
Within the scope of this work, a Keyence VK-X100 (Keyence Deutschland GmbH, Neu-Isenburg, Germany) was used. The step size between two layers was 3 μ m each. To evaluate the data, we computed the height profile with the software application VK Analyzer (Keyence Deutschland GmbH, Neu-Isenburg, Germany).

2.3.3. µCT Analysis

Micro Computer-Tomography (µCT) is a technique which allows the destruction free analysis of a sample’s three-dimensional structure. The working principle of the µCT (XRadia 520 Versa, Carl Zeiss Microscopy GmbH, Oberkochen, Germany) is depicted in Figure 3.
The source emits a X-ray spectrum that gets scattered by the sample due to photoelectric effect and Compton scattering. This causes signal attenuation, registered by the detector. The distances between source, sample and detector are adjustable, resulting in geometric magnification. At the detector front is a scintillator membrane which converts X-rays to visible light. This enables an additional optical magnification with a conventional objective and the use of a CCD camera as detector. During one CT scan the sample rotates 360°. Various transmission images, so-called projections, are taken at different sample angles and afterwards reconstructed to a three-dimensional image.
For high resolution scans, the samples must be small and compact. Therefore, we cut out portions of the filter cake with a polyimide tube (Goodfellows GmbH, Friedberg, Germany) with a diameter of 3.48   m m . Polyimide is almost completely translucent to X-rays. The samples were deep-frozen with liquid nitrogen to avoid further crystallization in the drying process and afterwards lyophilized. When the samples had dried, the tube was sealed and glued to a dress pin. Per measurement 2401 projections were recorded at a source power of 4 W . The resulting voxel size was 0.745   μ m .
The µCT device provides 16 bit grayscale images which require further processing. First the contrast of the image stack was enhanced with Fiji. To further improve the signal noise ratio the non-local means filter was applied [22]. Lastly, the crystals were segmented from the background with a threshold. In the resulting binary image stack touching crystals were separated with three-dimensional distance transformation watershed using chamfer distance maps. The final three-dimensional rendering and label analysis were performed with Dragonfly® (Object Research Systems, Montreal, QC, Canada) and the maximum diameter and the corresponding particle volume were calculated. Finally, the resulting Q 3 distribution was computed analogous to Equations (1) and (2) using the determined particle volume.

2.4. Filtration Experiments

2.4.1. Pressure Nutsche

To determine the specific filter cake resistance α H permeation experiments took place with a VDI 2762 [23] pressure nutsche. The technical standard VDI 2726 describes the design of the pressure filter cell, the required analytics as well as their accuracy and finally the experimental execution of the tests in order to obtain meaningful results. Therefore, a laboratory balance measured the amount of filtrate that accumulates over time t. Using the integrated Darcy equation for constant pressure permeation
V = Δ p A η R t ,
the total resistance R can be calculated as a function of the applied pressure difference Δ p , the filter area A, the viscosity η and the volume V [8]. The total resistance R is in turn composed of the filter medium R M and the filter cake resistance R C , which is usually normalized with the cake height h C . The following applies:
R = R C + R M = α H h C + R M .
50 g crystal suspension, initially filtered at a pressure difference of 0.5 × 10 5   Pa , was the basis for all experiments. As filter medium, we either used a membrane (Ultipor®  0.2   μ m , Pall GmbH, Dreieich, Germany) or a filter cloth (SEFAR TETEX® MONO 07-90-SK 012, Sefar AG, Thal, Switzerland). The filter cake remaining on the filter medium was then permeated at different pressure levels ( 0.25 × 10 5   Pa , 0.5 × 10 5   Pa and 0.75 × 10 5   Pa ). In each case, 50 g of saturated, particle free lysozyme solution acted as the permeation medium. Finally, a laser displacement sensor (LK-GD500, Keyence Deutschland GmbH, Neu-Isenburg, Germany) served to detect the cake height.
For the determination of the filter medium resistance, we performed further permeation tests with the pressure nutsche. In contrast to the previously described test procedure, a saturated lysozyme solution was used instead of the crystalline suspension, which means that only the filter medium and not the medium in combination with the cake was permeated.

2.4.2. Filtration Cuvette

The filtration setup developed by Radel et al. [9] enables the characterization of filtration on a small scale in the centrifugal field. This allows to investigate the filterability of proteins early in product development. The cuvette consists of two parts. The upper part holds the suspension and the lower part catches the filtrate. The interchangeable filter medium (Ultipor®  0.2   μ m , Pall GmbH, Dreieich, Germany) and its support structure sits between those two parts. The assembled and filled cuvette is placed into a photocentrifuge, which provides the ability to trace the filtration progress in situ with light transmission. To make the experiments and the evaluation easier, the filter cake was first built using 500–800 μ L crystal suspension. In a second step, we carefully added 300 μ L clear supernatant on the top of the filter cake and permeated the filter cake at different rotation speeds. This allowed to observe the characteristic signals of the gas liquid and the liquid solid interface in the transmission profiles. With the time resolved positions of those interfaces we calculated the height specific cake resistance according to Loginov et al. [24] and Radel et al. [9,10]. The cake height was directly obtained from the transmission profiles. The filtration pressure is dependent on the rotation speed of the centrifuge and drops during the permeation process because the liquid height above the filter cake decreases. All the given pressures regarding centrifugal filtration are therefore mean pressures of an experiment at a constant rotation speed. The rotation speed of the centrifuge ranges from 500–4000 rpm which corresponds to mean filtration pressures of 0.03 × 10 5 0.95 × 10 5   Pa . For a thorough explanation of the setup and data evaluation please refer to Radel et al. [9,10] and Loginov et al. [24].

3. Results and Discussion

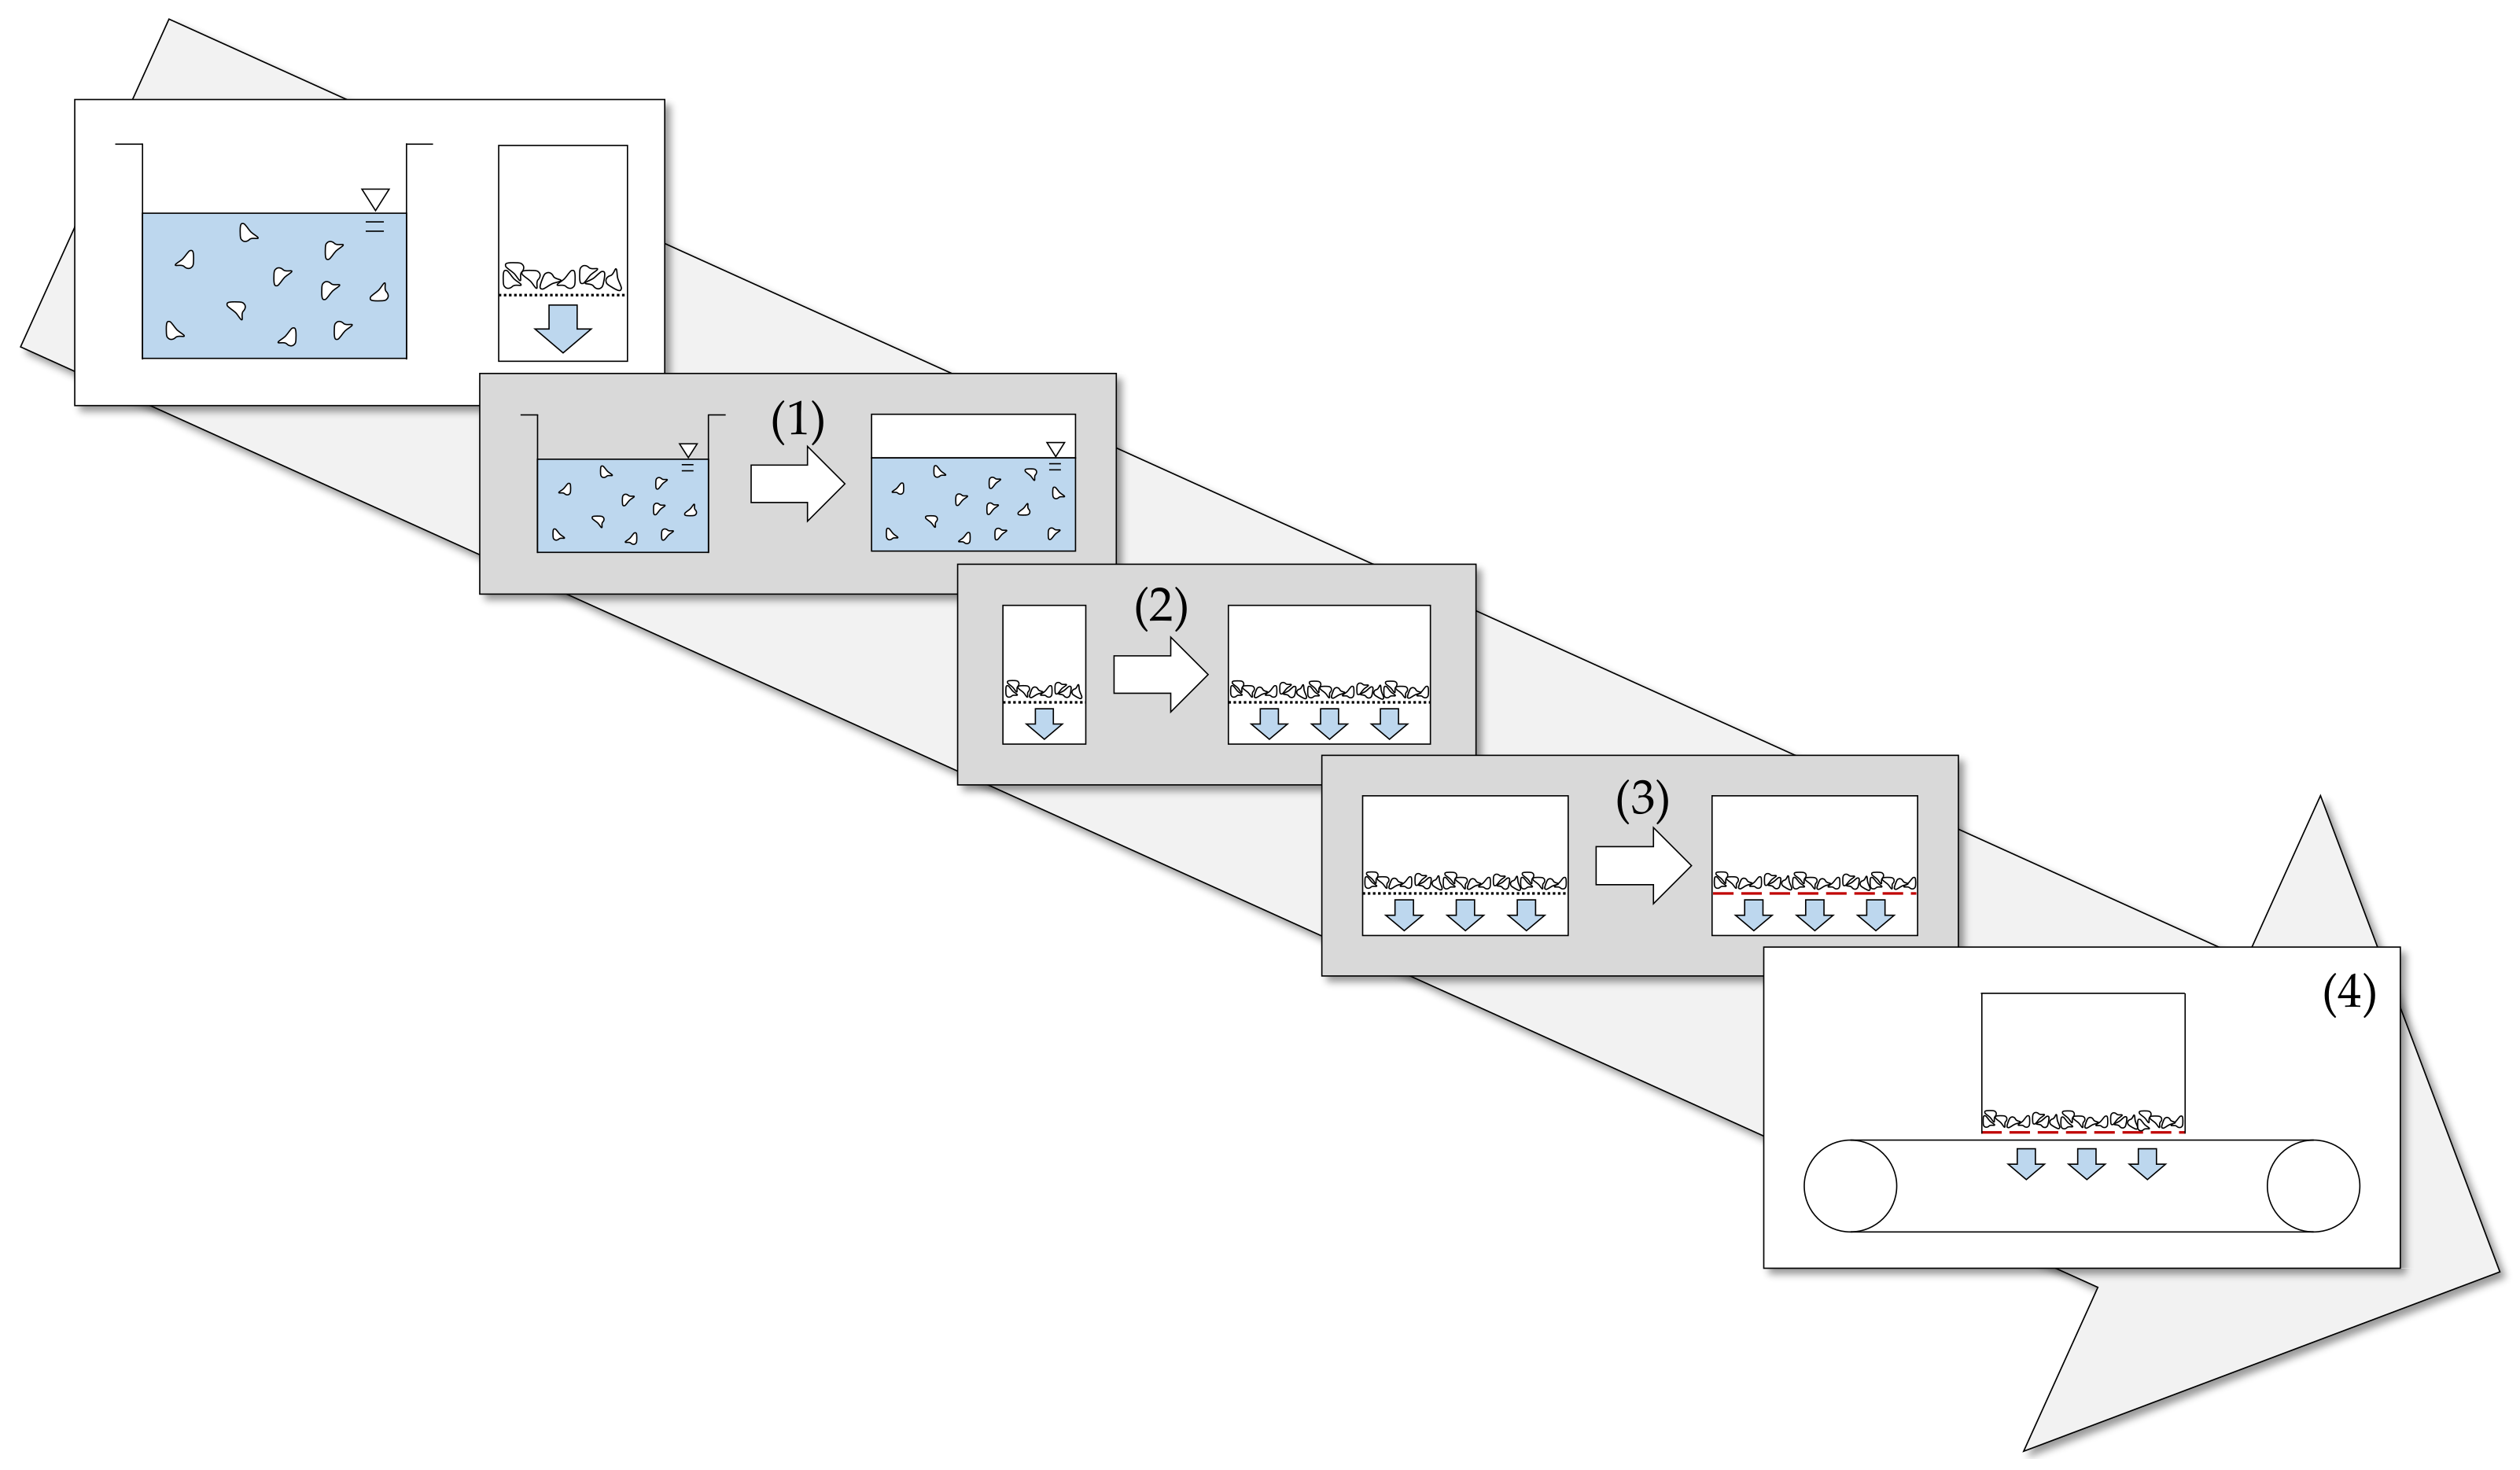
The transfer of the conventional process chain to the quasi-continuous laboratory plant occurs successively and in several individual steps as shown in 
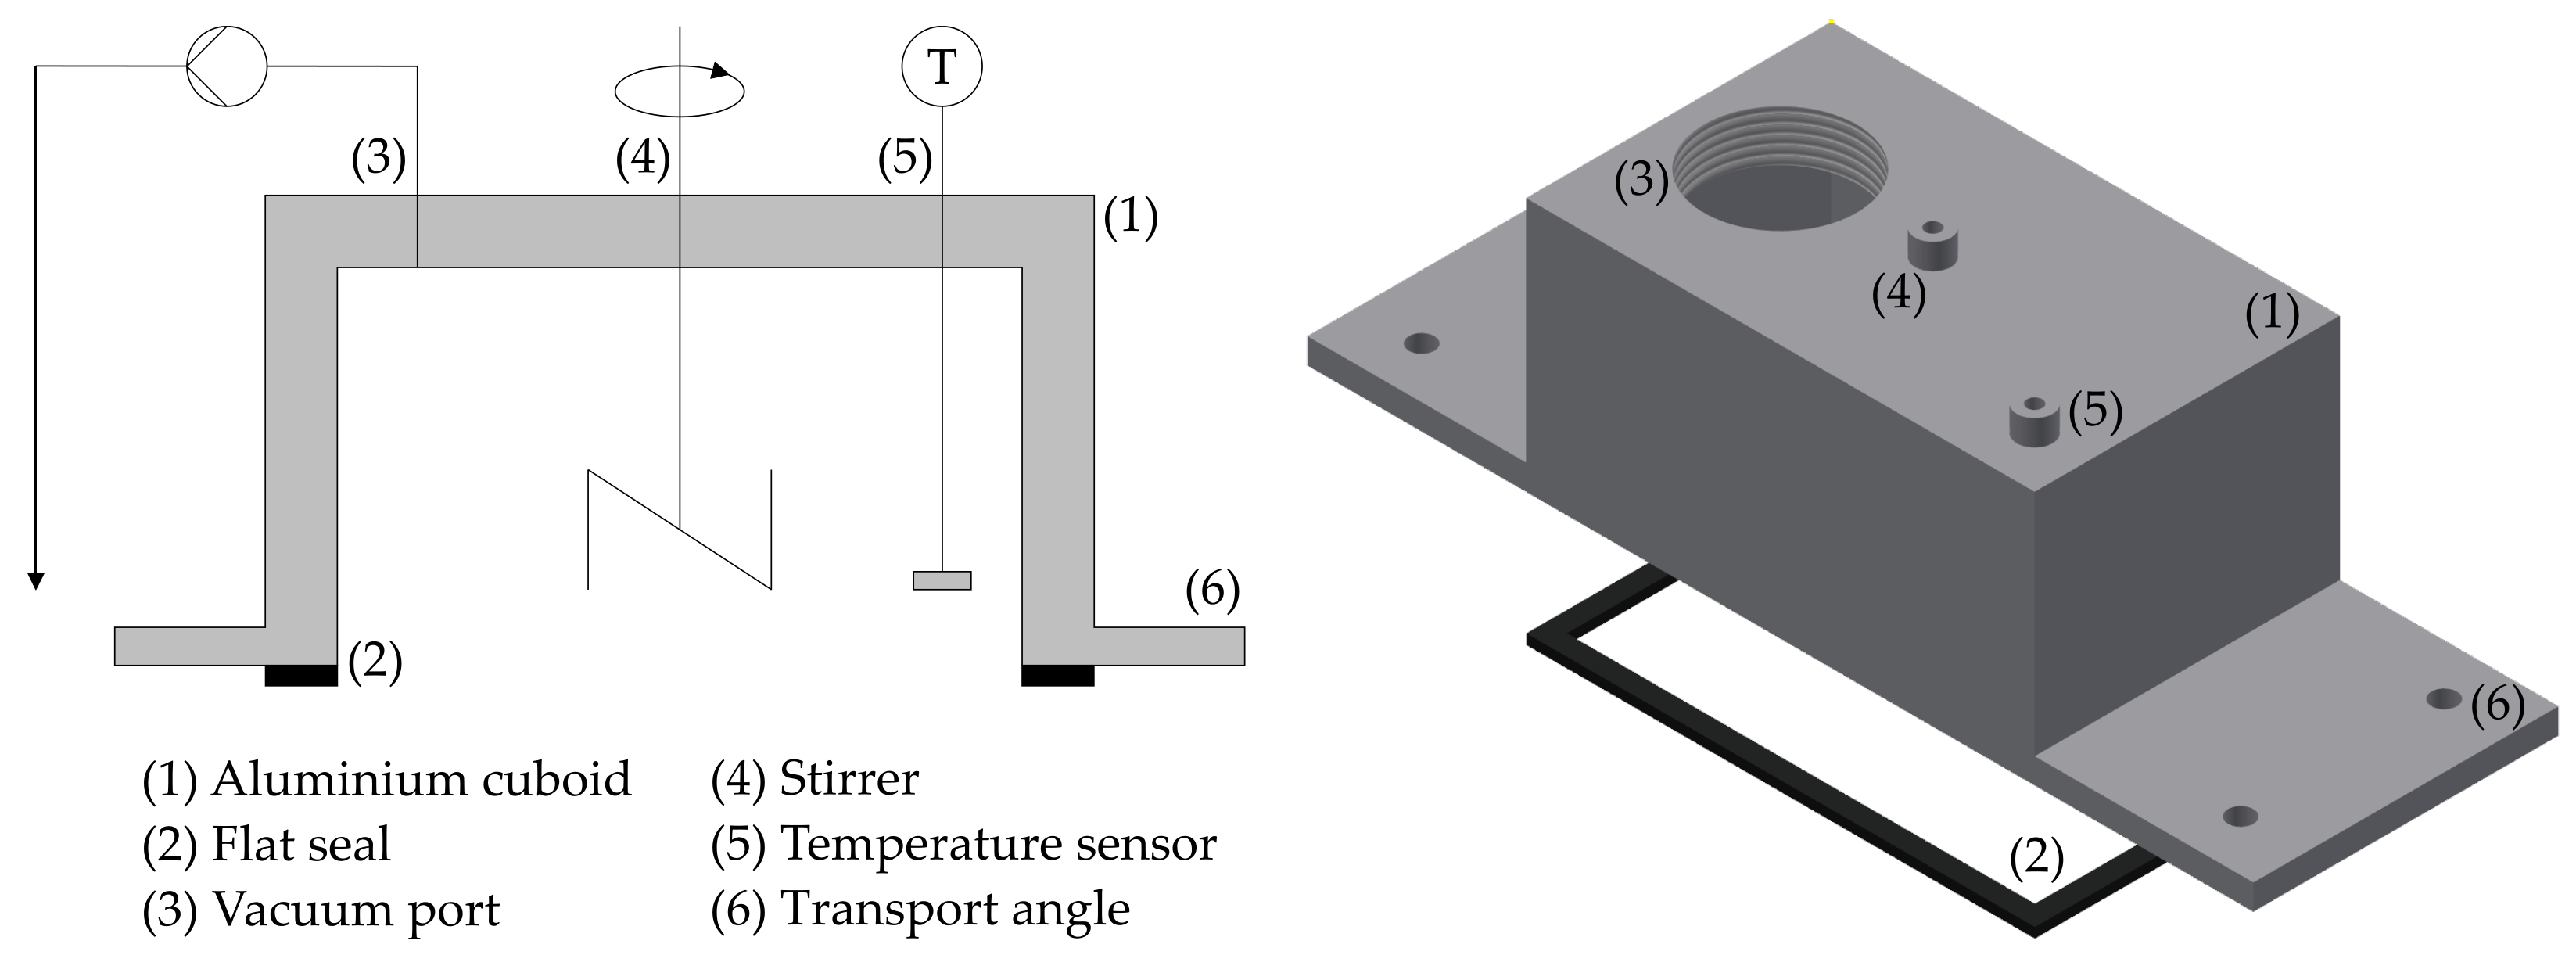
Figure 4. The starting point is the established process route. Here, the crystal suspension is generated batch-wise in a vessel and subsequently separated with the filtration cuvette. A membrane serves as the filter medium. In a first step, the batch vessel is replaced with a process chamber (1). Then, the focus is on the scale-up of the filtration process. In this context, tests are carried out on the pressure nutsche with a membrane (2) and consecutively with a monofilament filter cloth (3). Finally, the results from (1)–(3) are used to transfer the overall process to the enhanced belt crystallizer (4).

3.1. From Batch Vessel to Process Chamber

The following chapter deals with particle production, which takes place in batch vessels in the conventional manufacturing procedure [6]. To transfer the entire process chain to the integrated laboratory system, however, the application of a process chamber is necessary. Therefore, we investigate whether the production process is feasible into this assembly.
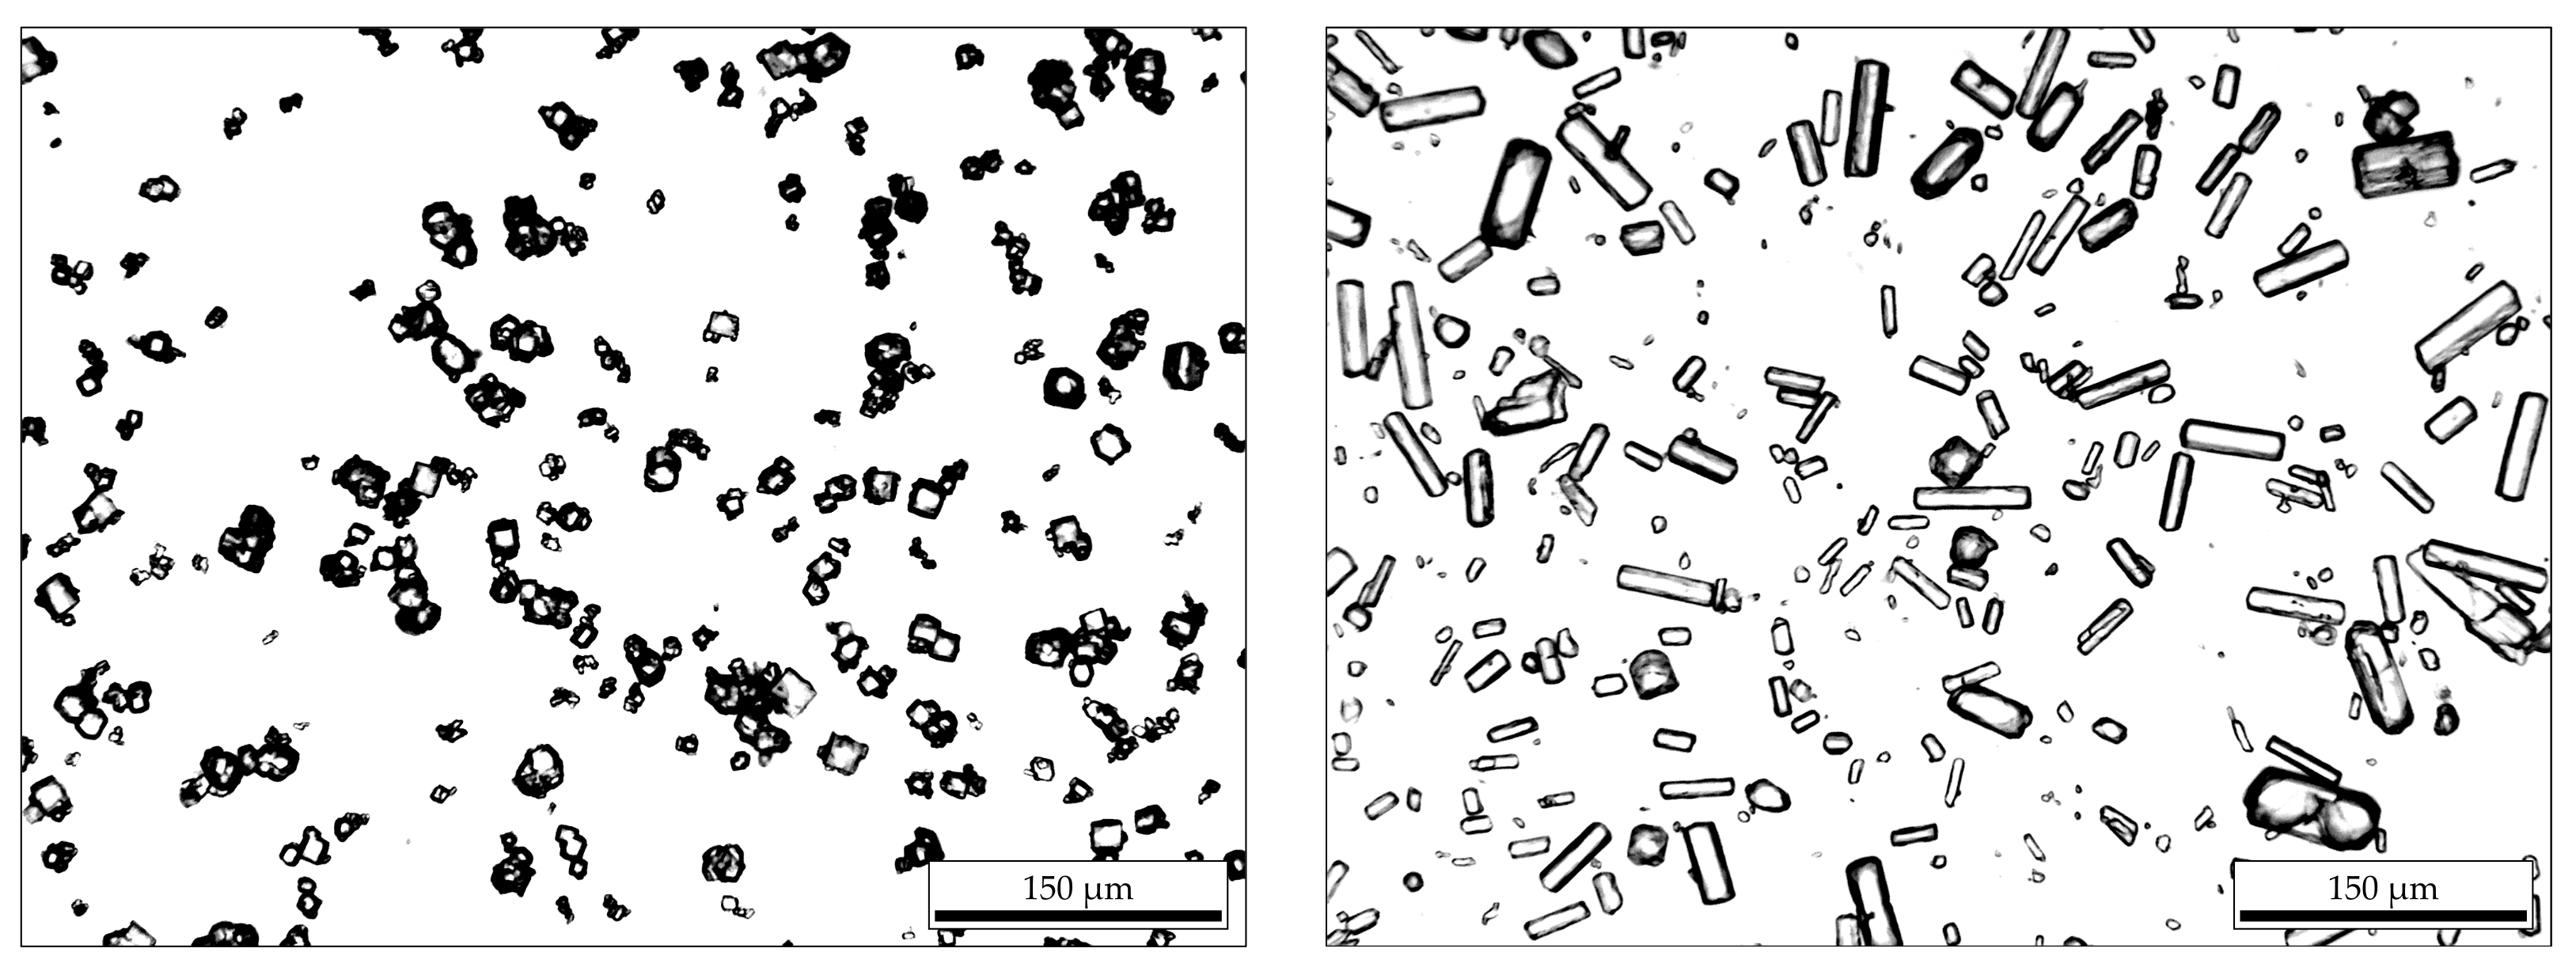
Figure 5 shows microscopy images of the crystals obtained. The picture proves that both isometric (left) and rod-shaped particles (right) can be formed in the process chamber. In addition to the successful demonstration of the device’s functionality, it is also noticeable that the isometric crystals tend to agglomerate and form cluster-like structures. This agglomeration leads to undefined particle properties and complicates the optical evaluation of the microscopy data. In the case of the rods, such behavior is not detectable.
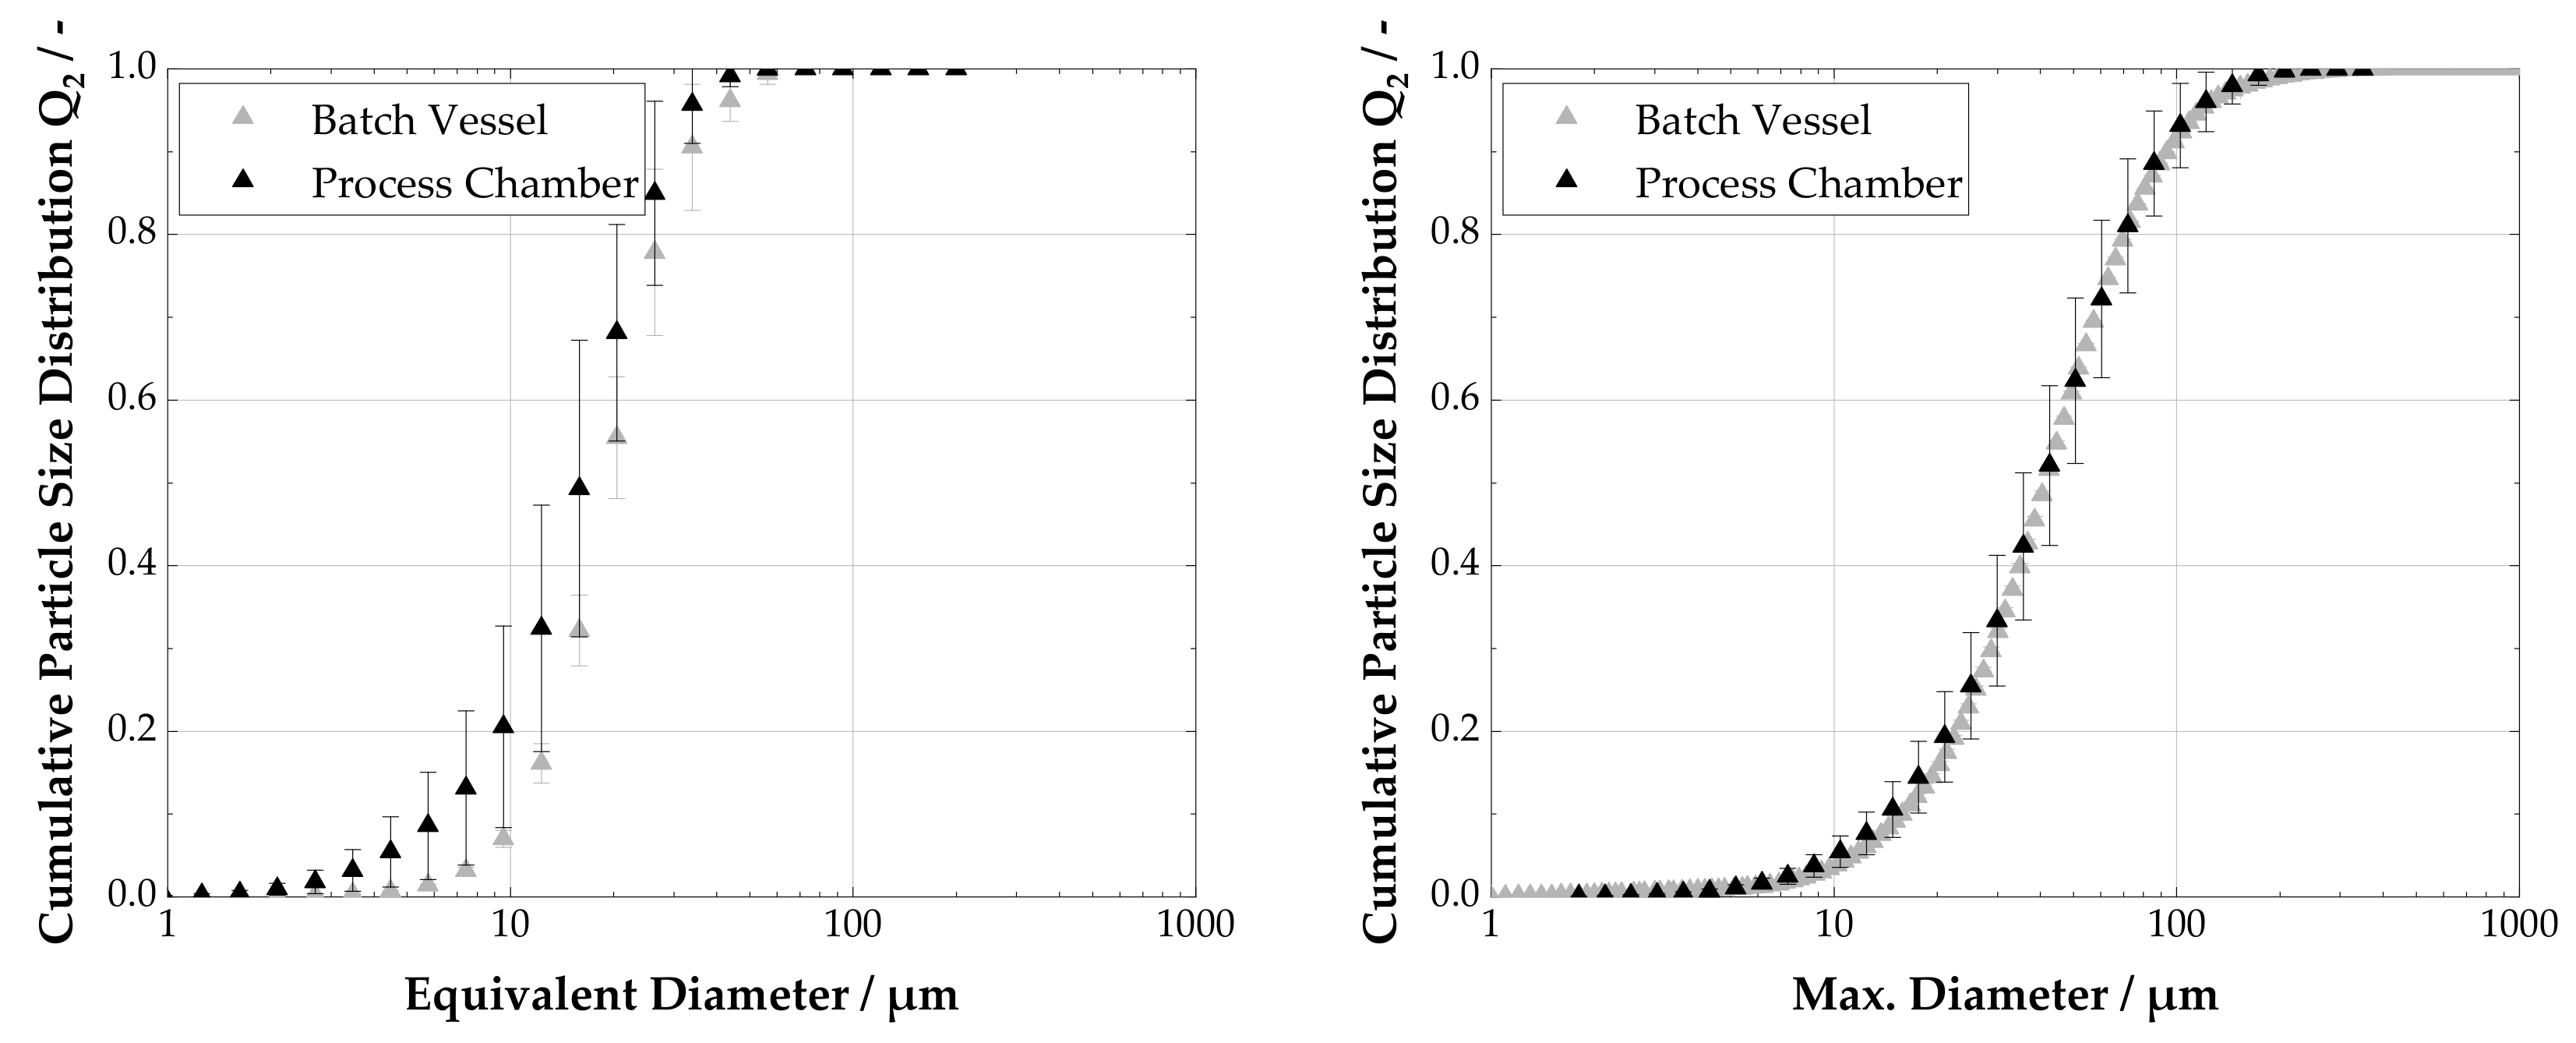
The particle size distributions determined from the microscopy images are illustrated in Figure 6. The left side refers to the isometric and the right side to the rod-like crystals. In batch-wise production, we obtain a median particle size of 19.63 ± 1.41   μ m for the isometric and 41.40 ± 0.22   μ m for the rod-shaped ones. The corresponding distribution widths are 1.18 ± 0.21 and 1.89 ± 0.02. In the process chamber, isometric crystals with a median size of 17.42 ± 3.61   μ m and rods with 41.76 ± 7.56   μ m are formed. The span amounts to 1.21 ± 0.16 and 1.81 ± 0.19.
In summary, Figure 6 verifies that particles with almost identical size properties as in conventional production may be manufactured using the process chamber. However, the plots also reveal that reproducibility with isometric particles is low, which can be seen by the large variations in the particle size distribution. These deviations are due to agglomeration and the absence of seed crystals [7] and prevent consistent product quality. Thus, only rod-like particles are used in the further studies.

3.2. From Small to Lab-Scale Filtration

The filtration setup described in Radel et al. [9] is useful to determine filtration properties early in product development because it only requires low sample volumes of 300 μ L per experiment. Results for rod-like lysozyme crystals produced by Groß and Kind [6] and filtered with the filtration cuvette are published in Radel et al. [10] and shown in 
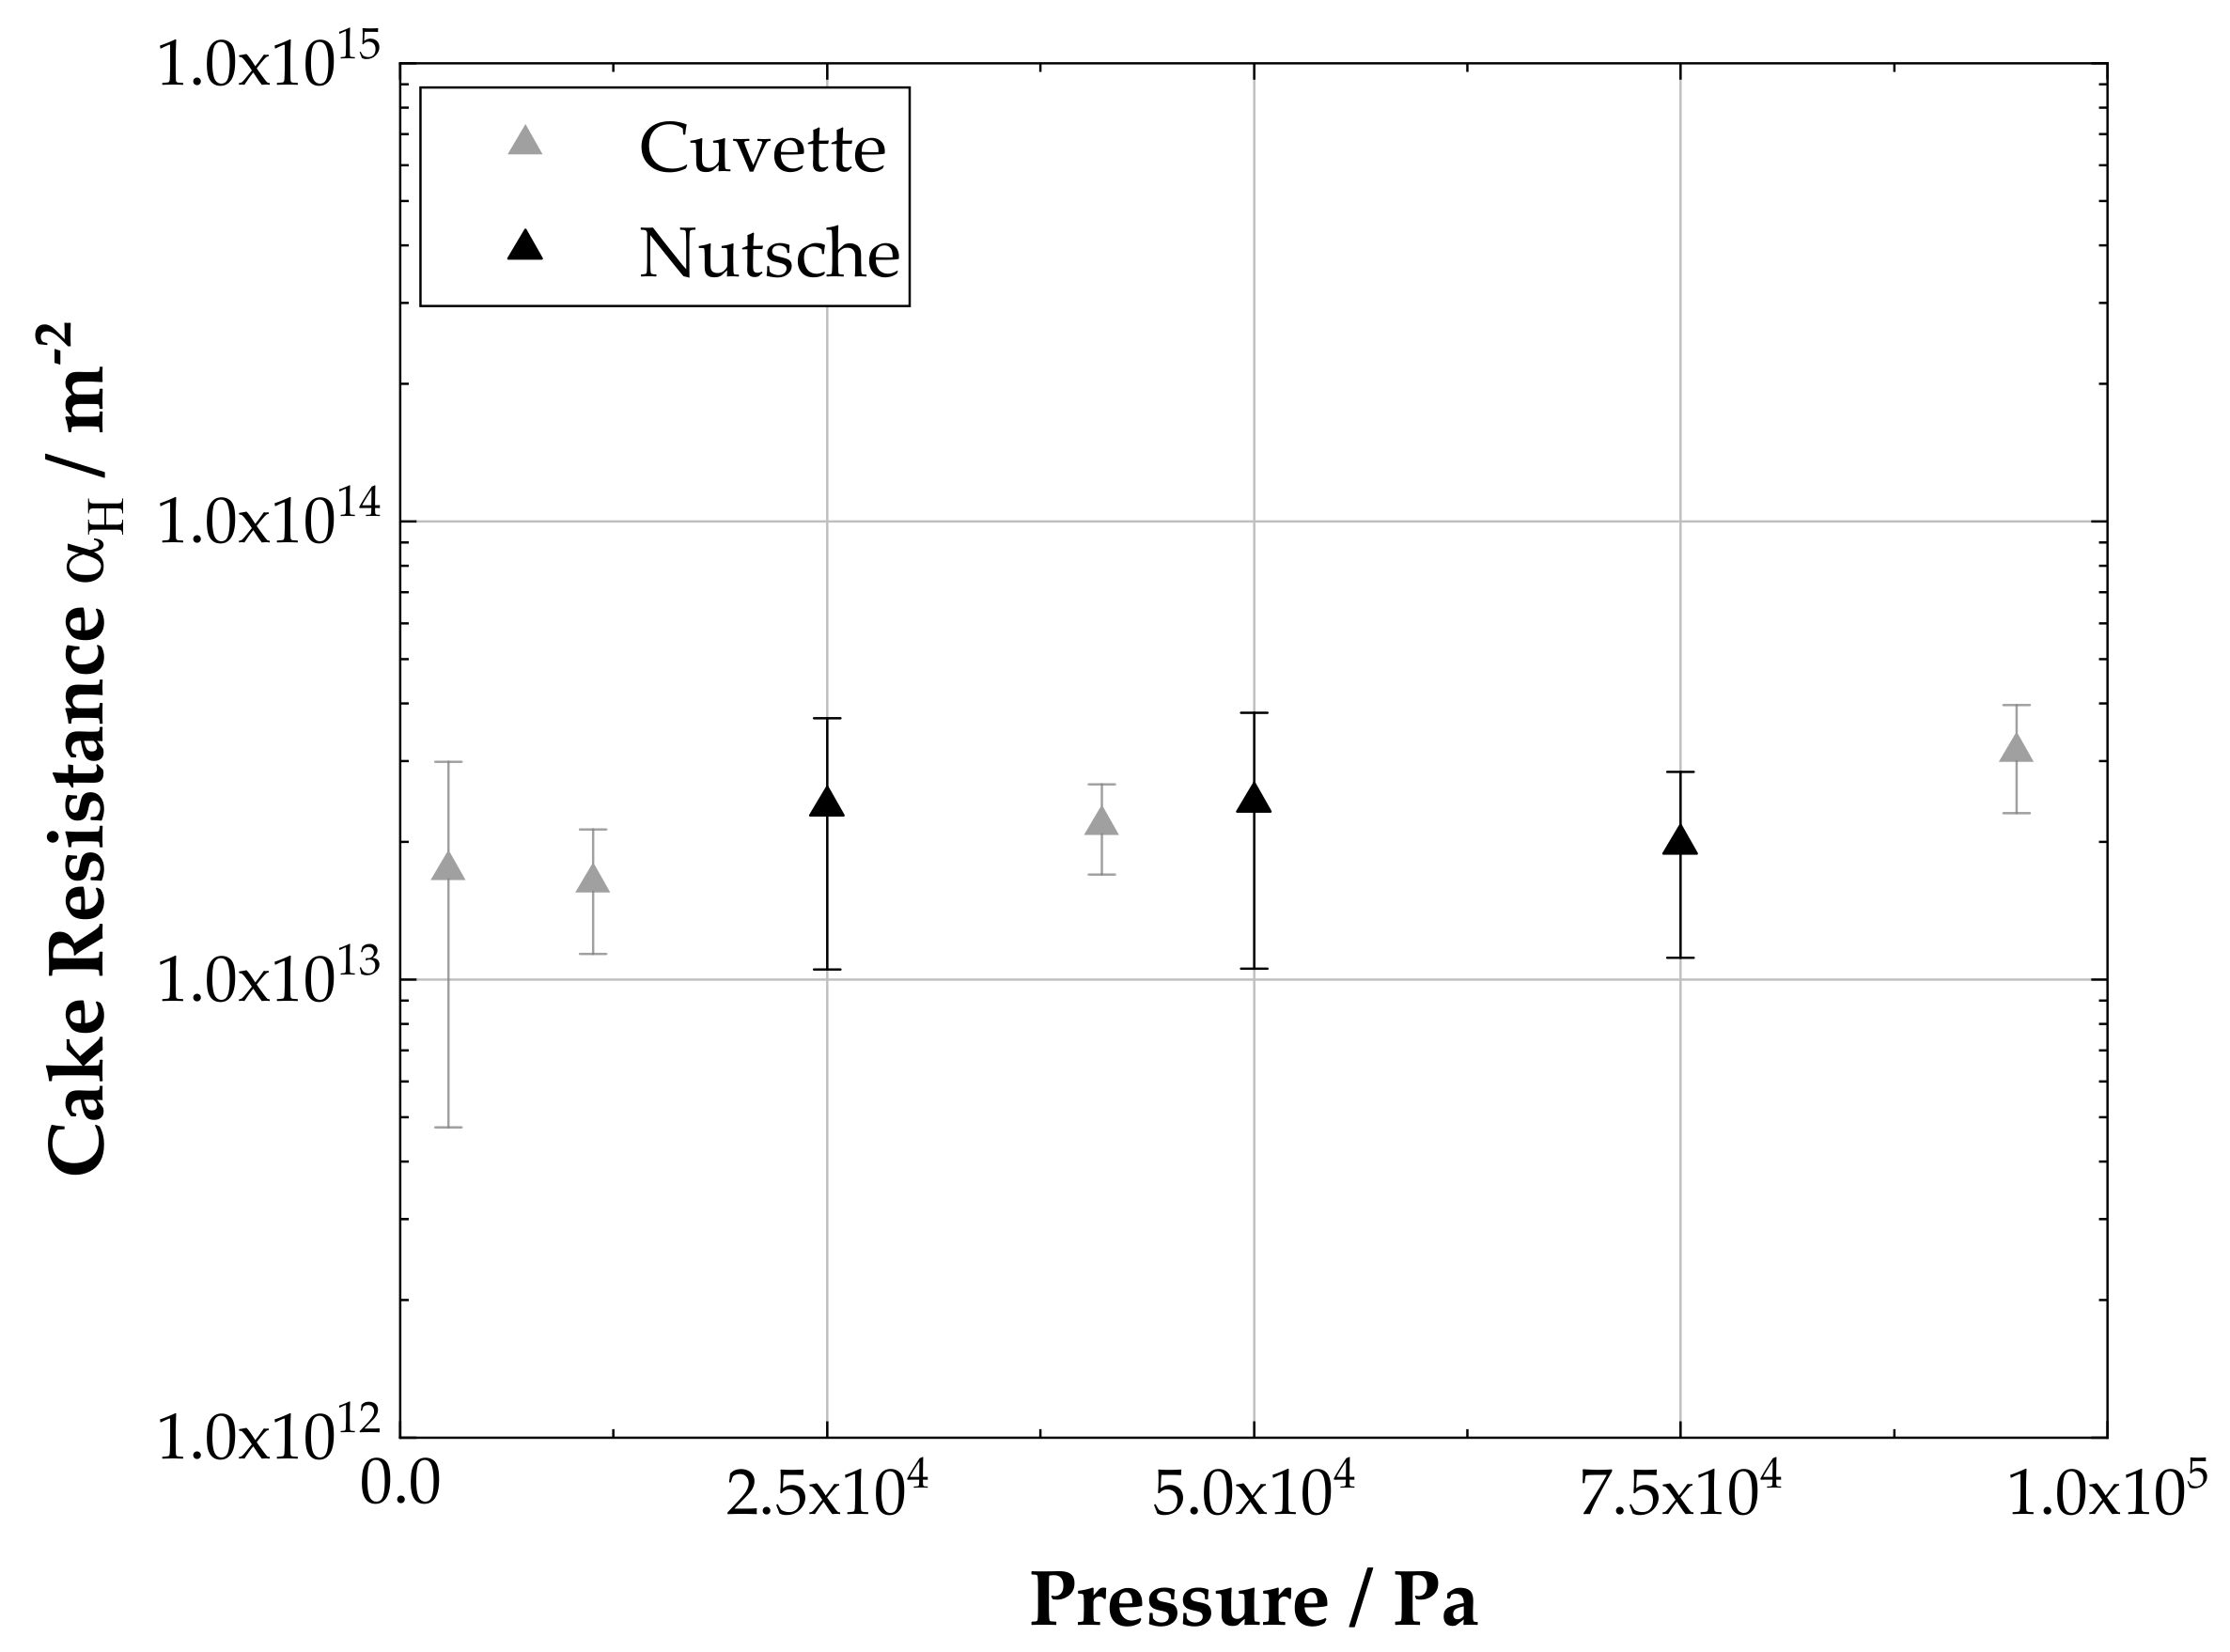
Figure 7 (“Cuvette”). The objective is now to compare these results with data from crystals produced in the process chamber and filtered with a VDI 2762 [23] lab scale pressure nutsche (Figure 7, “Nutsche”) to see if there are differences due to the different filtration scale.
As can be seen in Figure 7, the height specific cake resistance from the filtration cuvette and pressure nutsche are in good agreement. All data shown result from permeation experiments using the same membrane (Ultipor® 0.2   μ m , Pall GmbH, Dreieich, Germany) as filter medium. For the cuvette the height specific cake resistance lies between 1.73 × 10 13 3.14 × 10 13 m 2 in a pressure range of 0.03 × 10 5 0.95 × 10 5 Pa . In the case of the nutsche filter the cake resistances are similar, ranging between 1.98 × 10 13 2.44 × 10 13 m 2 for permeation pressures of 0.25 × 10 5 , 0.5 × 10 5 and 0.75 × 10 5   Pa . Hence, the transformation from the batch vessel into the process chamber on a quasi-continuous apparatus did not affect the overall cake resistance. Additionally, the small scale filter setup is suitable to correctly characterize filtration resistances with low sample volumes.
However, a membrane as filter medium is not suitable for the enhanced belt crystallizer because it would be too expensive and too fragile for the mechanical stress on the apparatus. Therefore, the next step for the filtration is the use of a cheaper and reusable filter cloth with a larger pore size that can handle the requirements of the laboratory apparatus.

3.3. From Filter Membrane to Filter Cloth

An ideal filter medium exhibits low resistance and high mechanical stability. Lower resistance often correlates with bigger pore sizes, increasing the chance of turbid filtrate at the beginning of the process. Later on, the filter cake itself retains particles smaller than the particles held back by the filter medium. Typically, the resistance of a filter cake is much bigger than the resistance of the medium, which means one is able to neglect the filter medium resistance for the design of the filtration process [8].
To investigate the suitability of a filter cloth, we replaced the membrane and carried out tests using the pressure nutsche. The expected result would be almost equal cake resistance and similar filter cake heights when using a filter cloth.
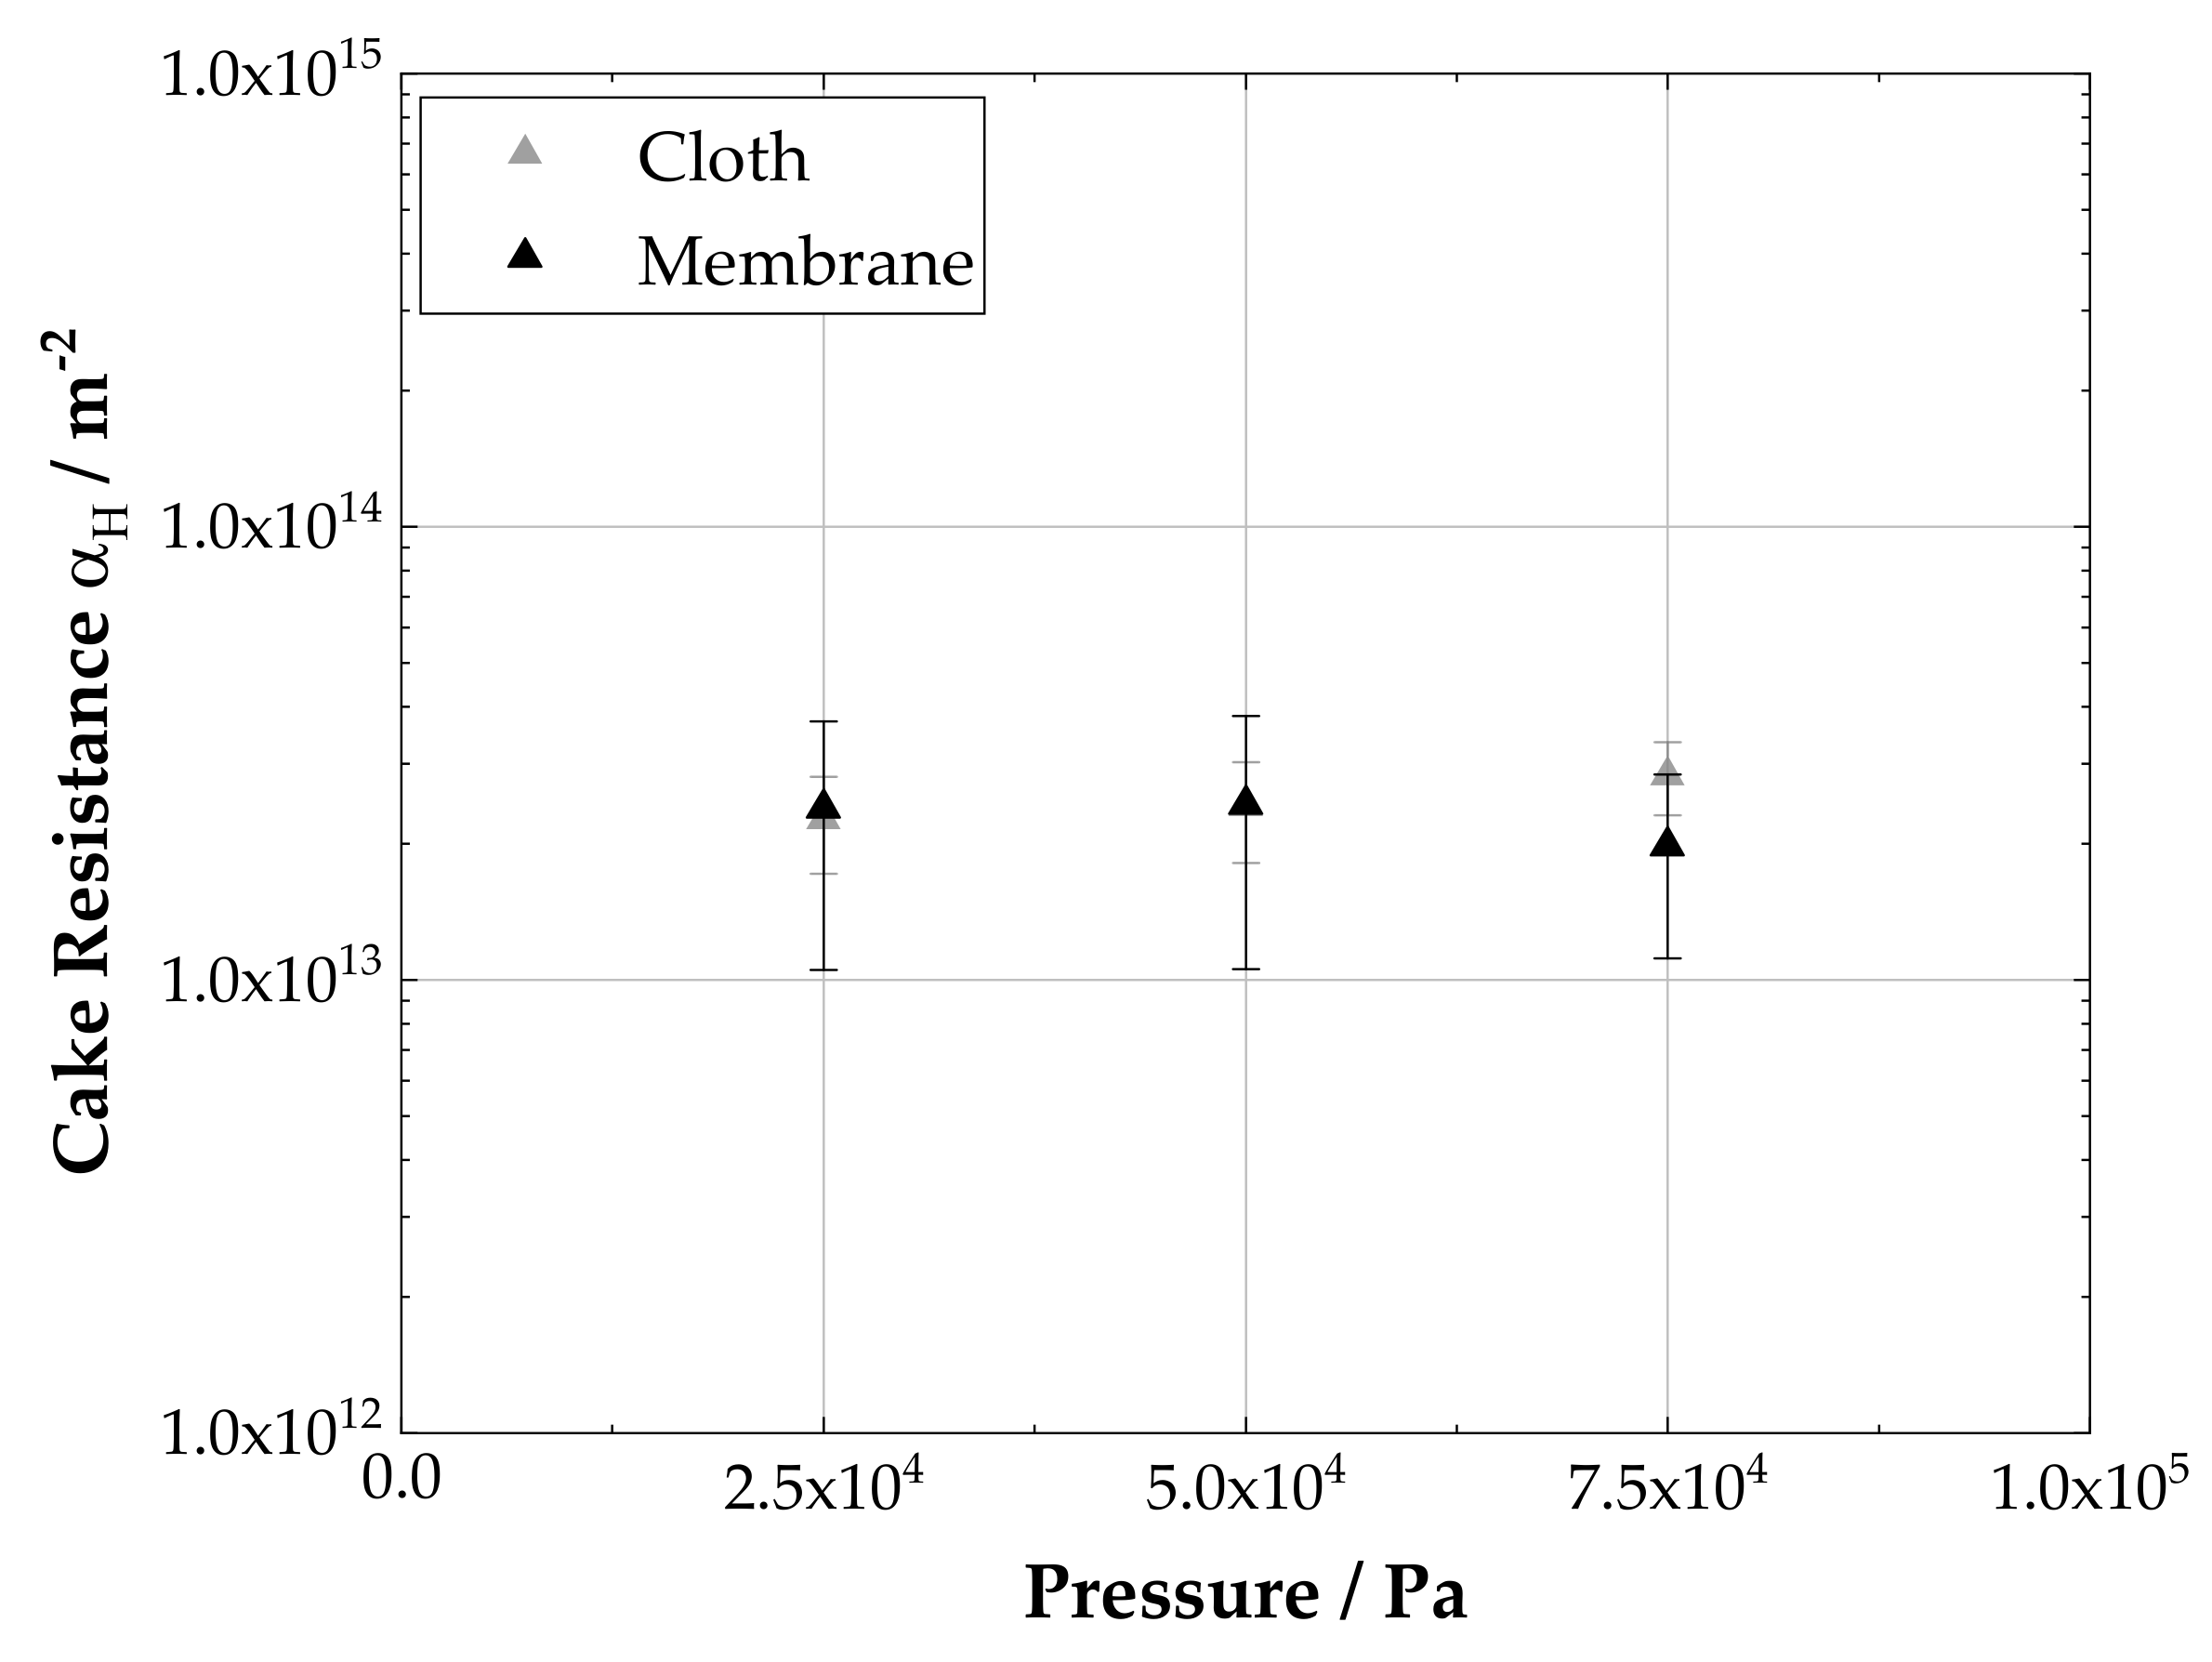
Figure 8 shows the determined cake resistances for rod-like lysozyme crystals using a membrane with a pore size of 0.2   μ m and a woven filter cloth with a pore size of 12 μ m . As can be seen, the resulting cake resistances with a filter cloth are very close to the resistances obtained with a membrane.
The resistance of the two filter media against permeation with supernatant is 5.00 ± 0.03 × 10 10   m 1 for the membrane and 2.60 ± 0.26 × 10 8   m 1 for the filter cloth. This indicates a much lower filter medium resistance for the cloth than for the membrane. It should be noted that determining medium resistance with particle free supernantant leads to underestimation of the actual medium resistance when using a suspension. However, the resistance of the cloth with particle free supernatant is three magnitudes smaller than the total resistance of the filter cake and is negligible, even with particles present. Comparing the cake heights between the two filter media leads to 9.6 ± 0.6   m m for the filtration setup with a membrane and to 9.4 ± 0.6   m m for the filter cloth. Thus, neither the cake height nor the resistance show a significant change when using a filter cloth instead of a membrane.
The successful transition from a membrane to a filter cloth is a prerequisite for transferring the process to the integrated belt crystallizer in a next step. In this final setup the unit operations crystallization, aging and filtration take place quasi-continuously on the same apparatus.

3.4. Process Transfer to the Laboratory Plant

Based on the results of the previous sections, we finally transfer the process chain to the laboratory plant. Therefore, a crystal suspension is produced and subsequently separated into its solid and liquid components by the filter cloth integrated in the process chamber. The remaining cake is then permeated with saturated lysozyme solution and the required time t Exp is detected. All experiments take place at a pressure difference of 0.5 × 10 5   Pa . Moreover, the filter area is 4.80 × 10 3   m 2 and the viscosity 1.19 × 10 3   Pa s in each case. To establish the theoretical permeation time t Theo , the previously determined media resistance of 2.6 × 10 8   m 1 and cake resistance of 2.50 × 10 13   m 2 are deployed.
Table 1 shows the permeation times calculated with Equation (3) and the ones received experimentally. It is apparent that both durations differ only marginally and almost coincide with each other. The occurring difference is due to the fact that the cake height is not constant over the entire cake surface.
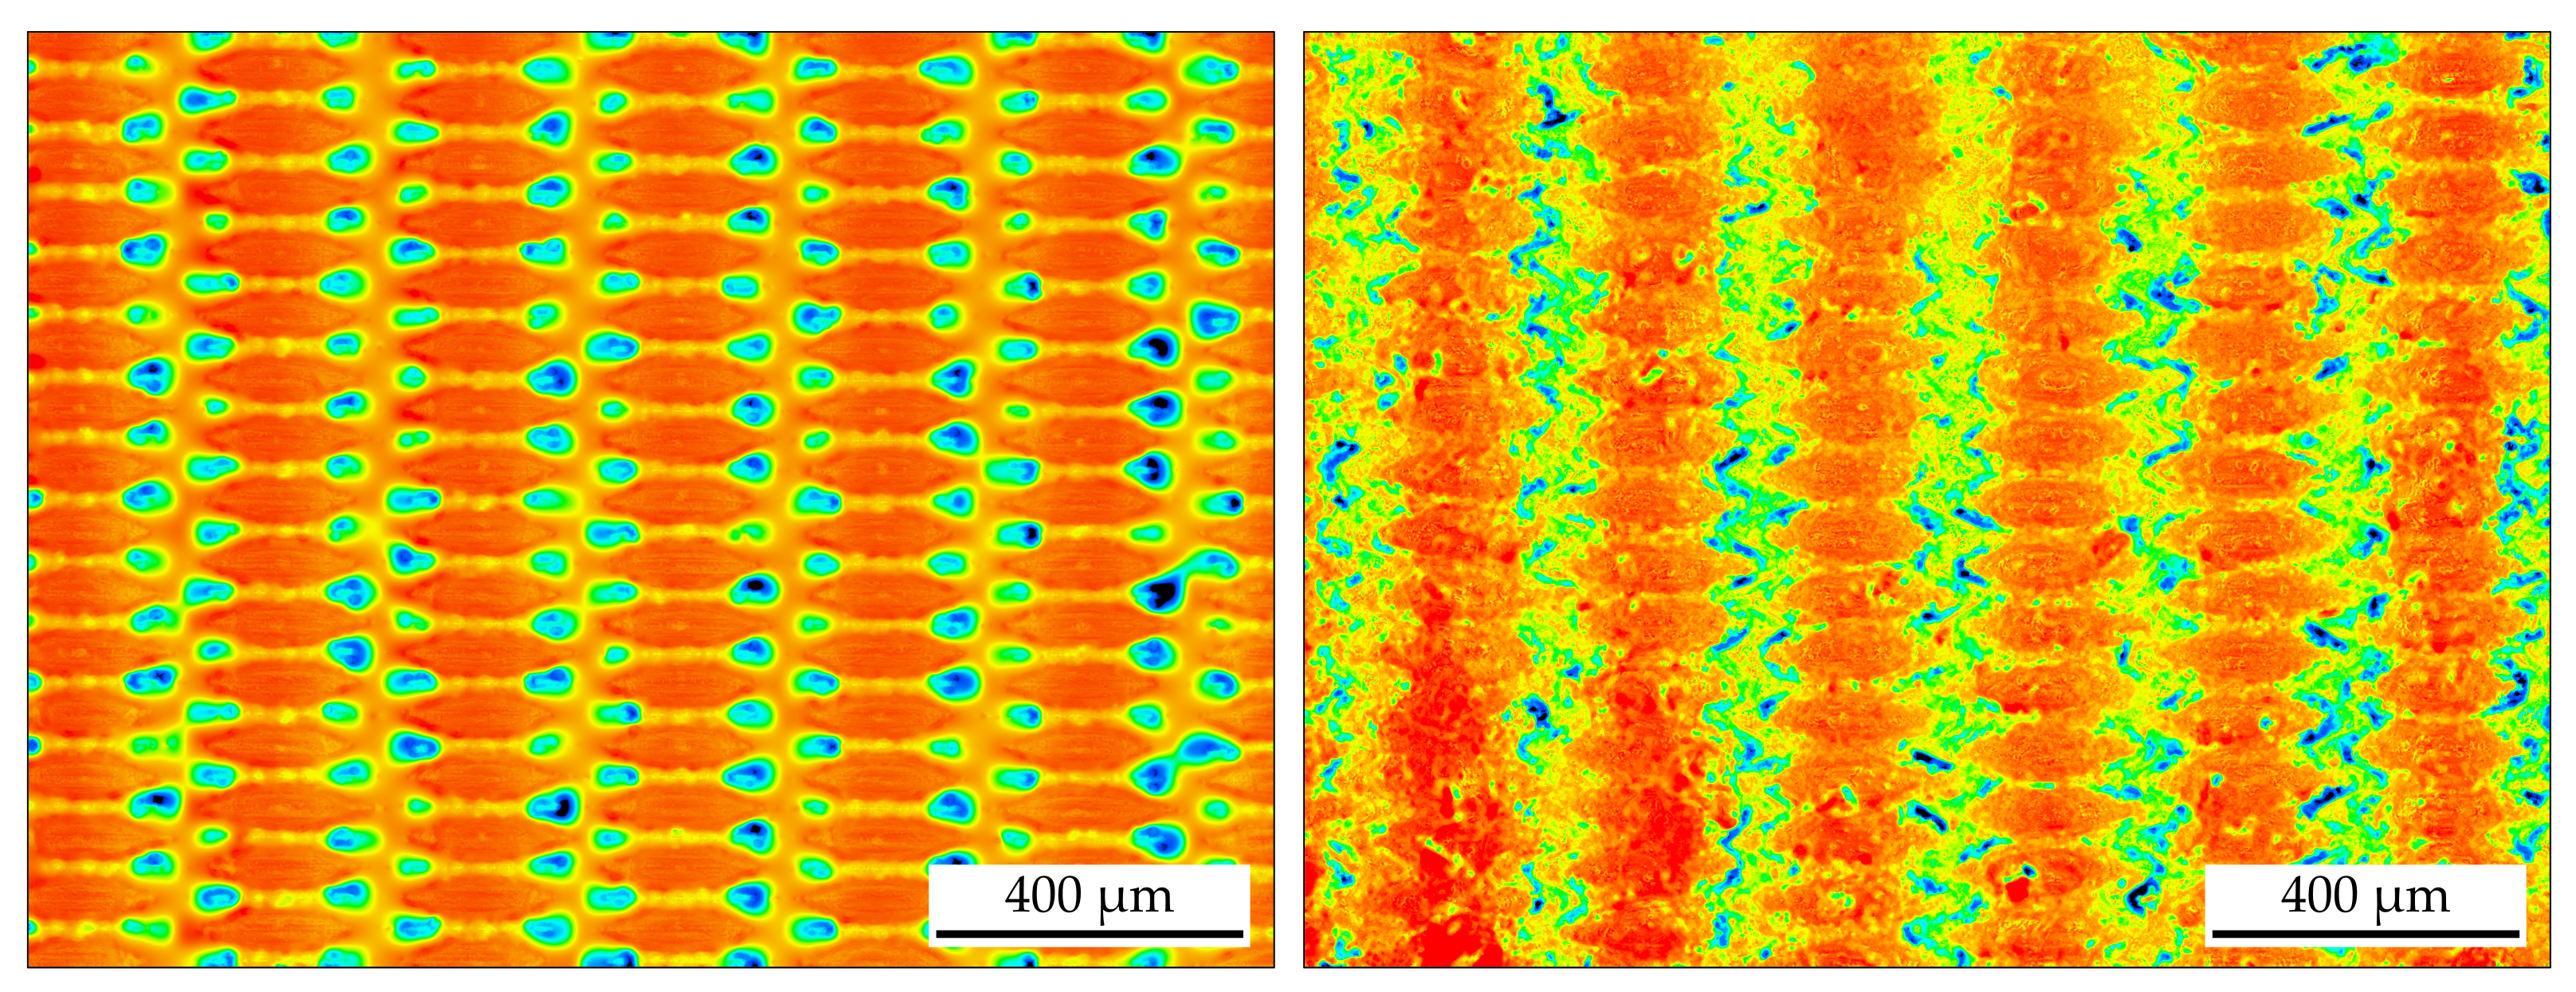
In addition to the permeation time, we also observe the influence of the crystallization and aging step on the filter cloth. For this purpose, a laser scanning microscope is applied to create a height profile of the filter medium. The color scale ranges from blue to red. Red represents elevations, such as warp and weft threads, and blue dents, like pores. The left side of Figure 9 shows an unused filter cloth, revealing the pores and surface structure. The right side of Figure 9 displays a filter media after the crystallization and aging procedure. In contrast to the unused one, it exhibits local contamination. However, the original surface including the pore structure is still visible, so the influence on the overall process is negligible.
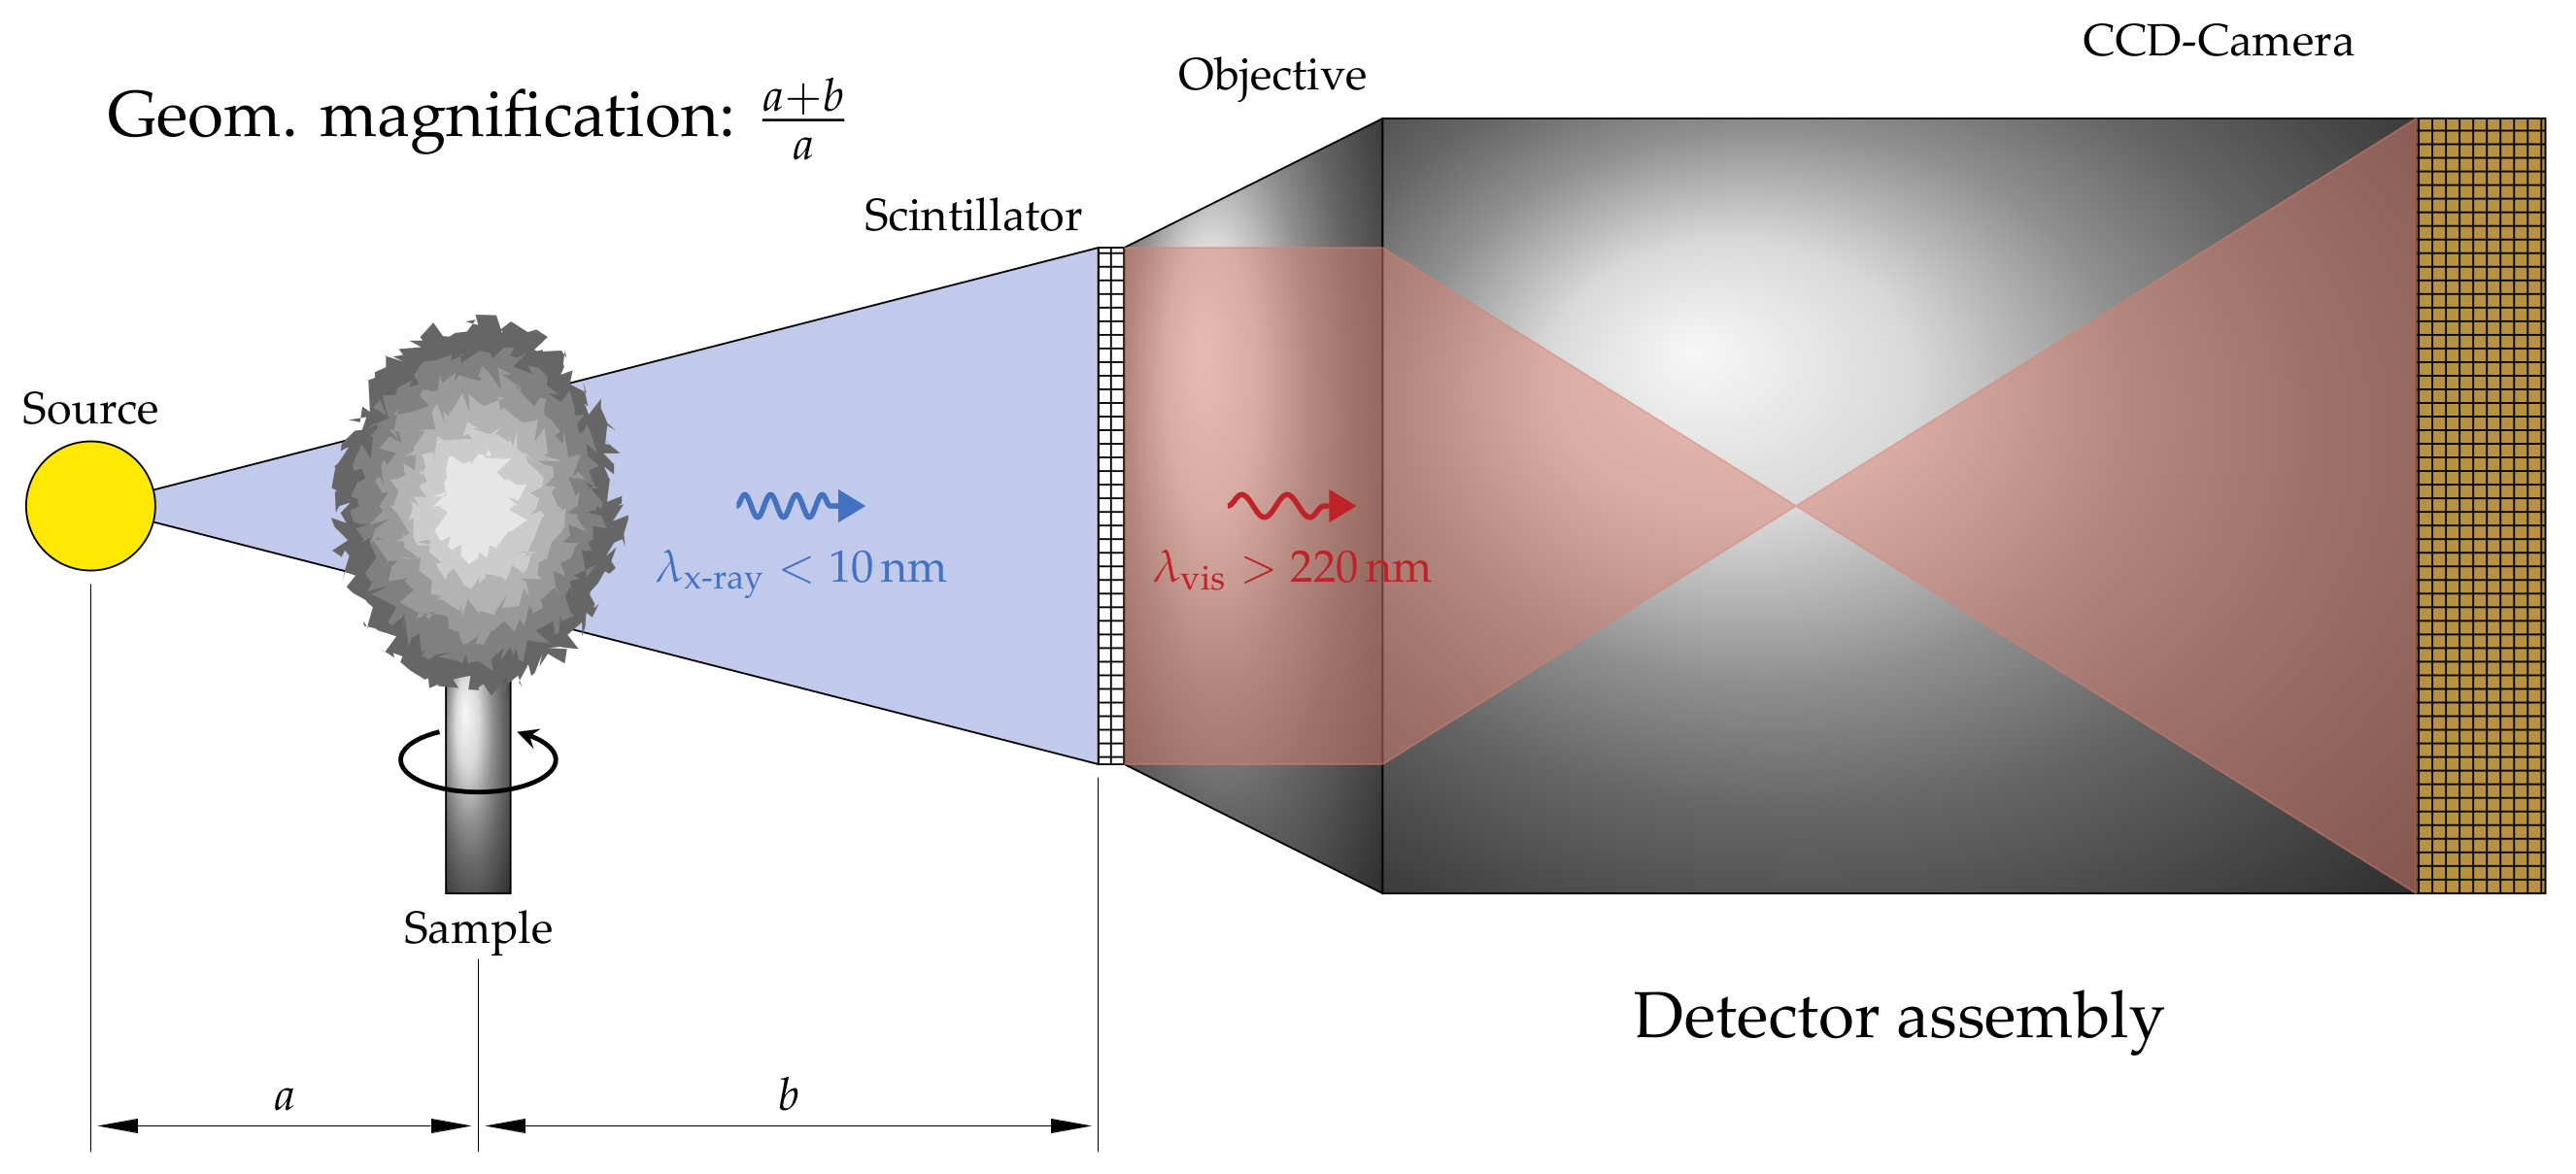
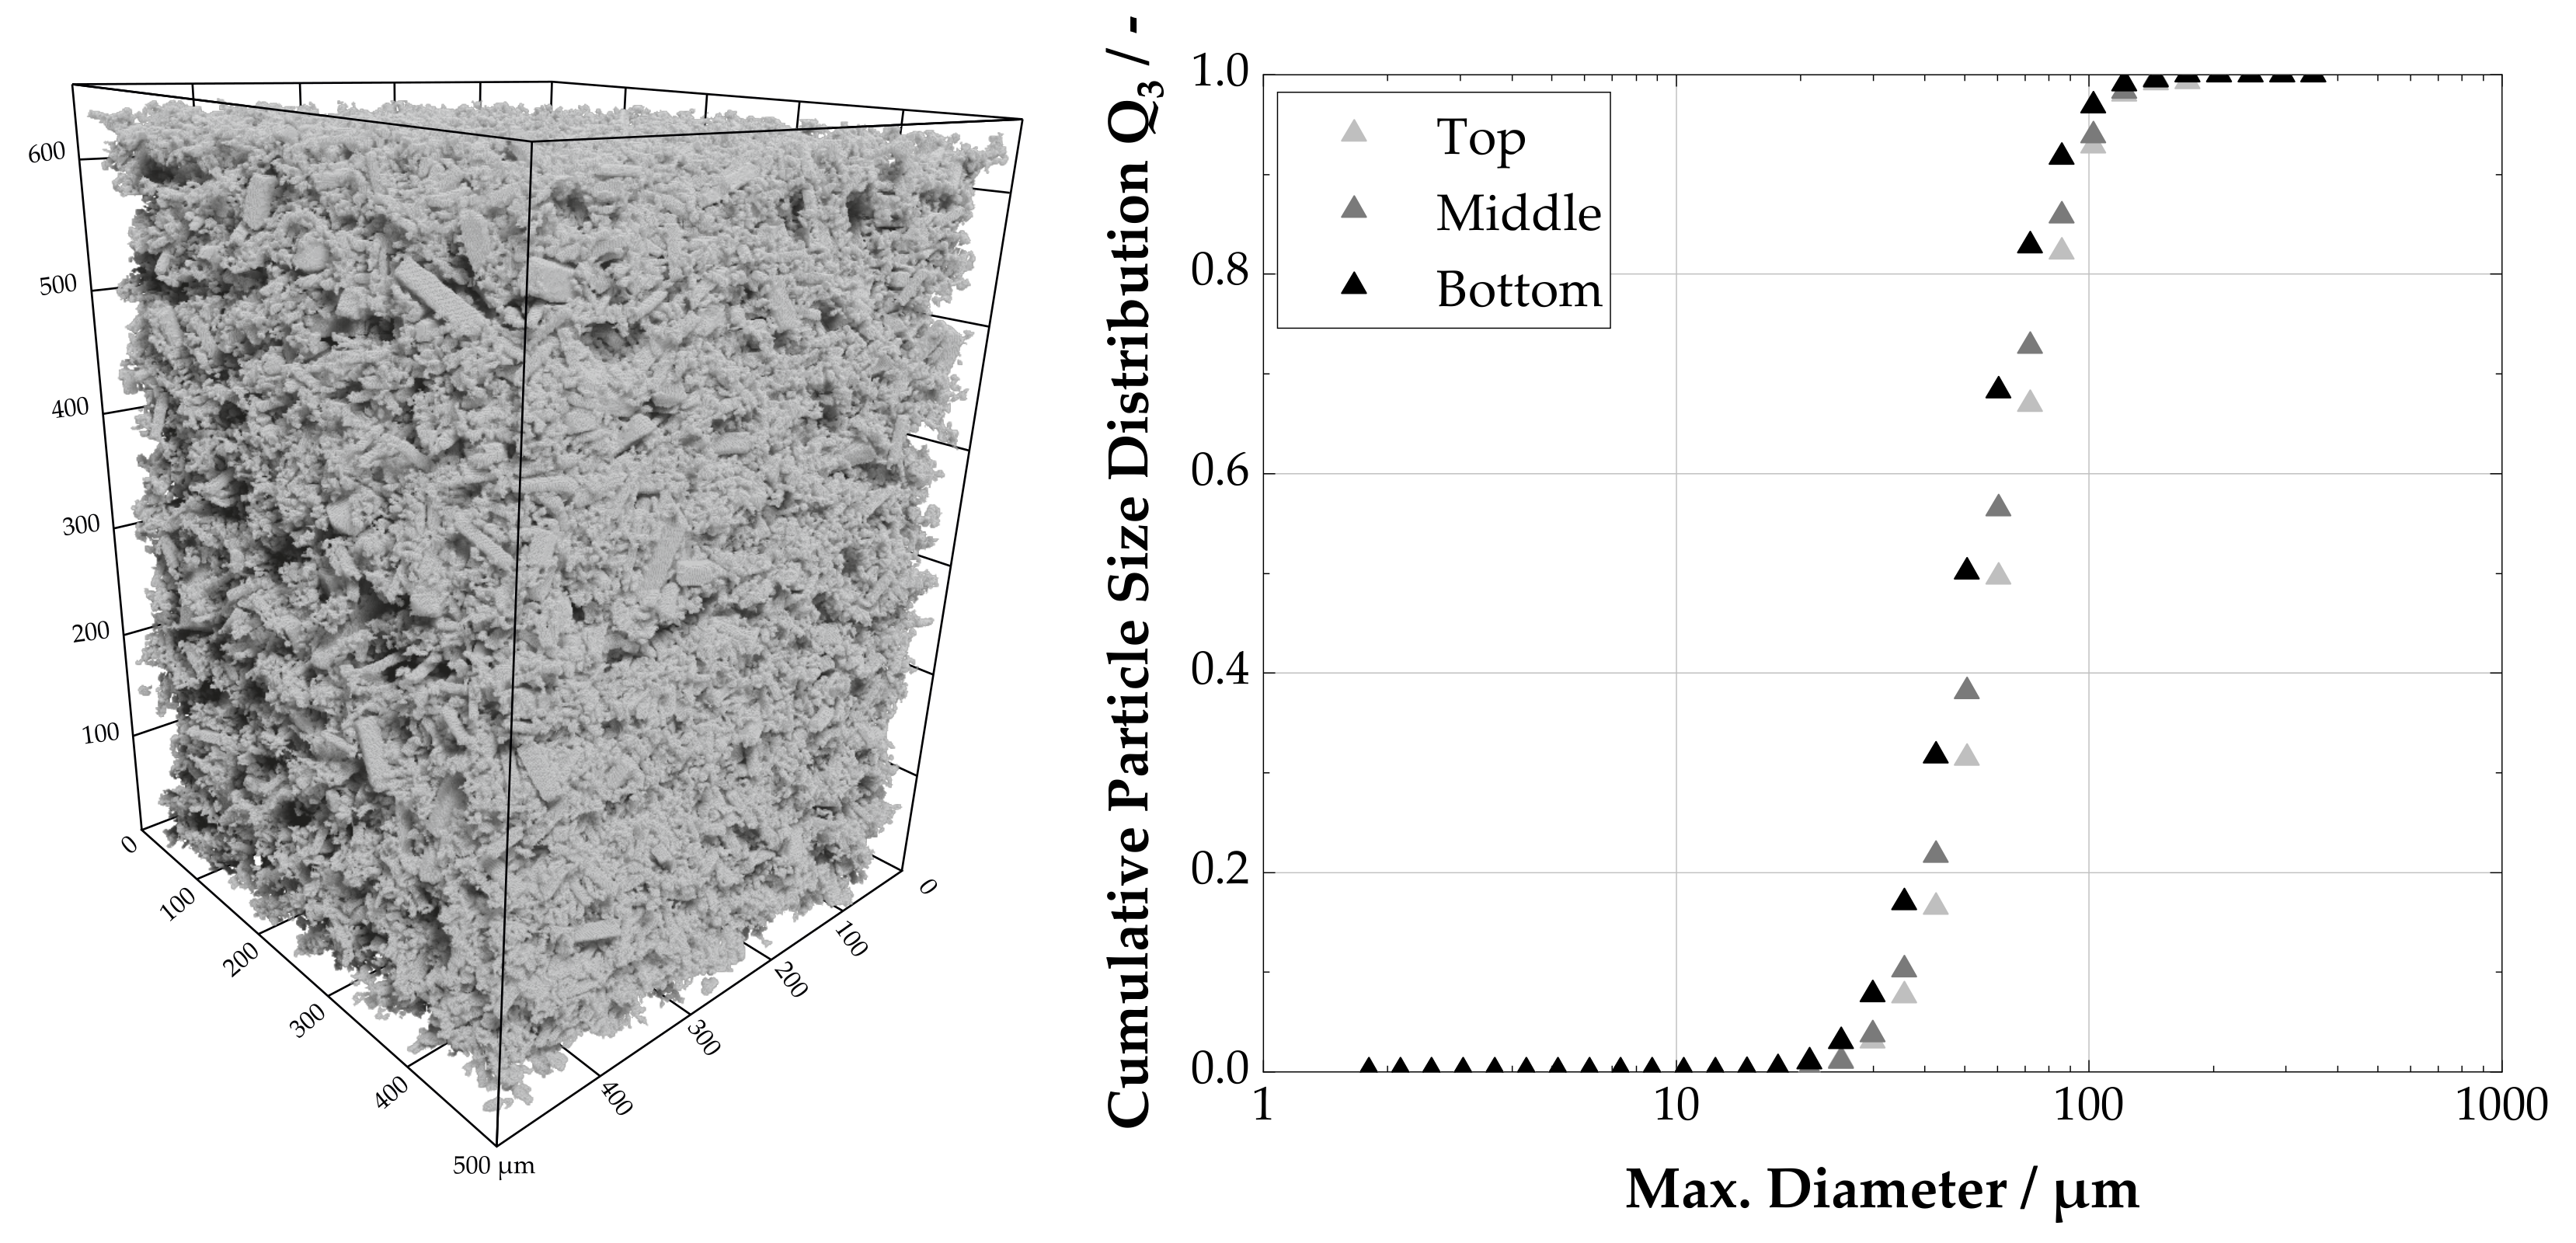
To exclude the possibility of segregation effects, the filter cake is finally analyzed with µCT. Therefore, we determine the particle size distributions in a top, middle and bottom scan of the cake. Figure 10left, shows as an example the bottom scan of the filter cake. The 3D rendering already indicates homogeneity over the cake height. To further quantify this impression the Q 3 distributions obtained from the µCT scan are shown on the right-hand side of Figure 10. It is noticeable that the particle properties in the individual layers are almost identical, which in turn suggests the formation of a homogeneous cake. The same observations can be made when analyzing the particle size distribution of a filter cake from the pressure nutsche with the µCT (data not shown). Those distributions are nearly identical to the ones from the enhanced belt crystallizer.
In summary, the executed experiments demonstrate that it is possible to transfer the experiments originally carried out in multi-stage batch process to an integrated, quasi-continuous laboratory plant.

4. Conclusions

For the production or purification of temperature-sensitive materials, a vacuum crystallization followed by a solid–liquid separation is commonly suitable. Typically, the process steps are carried out batch-wise and on different plants, which leads to a number of disadvantages. For instance, there are deficits in process efficiency, the risk of product contamination during transfer between the individual units and the requirement for energy-intensive transport facilities like pumps. To reduce these negative aspects, it is possible to apply integrated, quasi-continuous equipment.
In a first step of the successive transfer from a multi-stage to an integrated process, the batch vessel used for conventional preparation is replaced by a process chamber that enables the production of particles with almost equal size characteristics as the original one. Subsequently, the focus is on solid–liquid separation. Initially, the filtration scale is increased from small to laboratory dimensions. The resistance values obtained here are nearly the same, which means that experiments with the cuvette on a small scale are suitable to successfully characterize filtration characteristics for a laboratory filter. Afterwards, the membrane originally utilized is substituted by a filter cloth. Analogous to the previous experiments, the resistance values are almost identical and prove that both the enlargement of the scale and the replacement of the filter medium are feasible without influencing the filtration process. In a final step, the complete process chain is transferred to the integrated laboratory system. For this purpose, crystals are produced in the process chamber and subsequently separated by an integrated filter cloth. It is shown that the calculated permeation time corresponds approximately to the actually determined duration. This proves that the multi-stage lysozyme production procedure is transferable to a combined, quasi-continuous plant, which offers advantages compared to conventional manufacturing, e.g., in terms of efficiency and energy.
The following abbreviations are used in this manuscript:

Author Contributions

Conceptualization, T.D. and B.R.; methodology, T.D. and B.R.; validation, T.D. and B.R.; formal analysis, T.D. and B.R.; investigation, T.D. and B.R.; resources, H.N.; data curation, T.D. and B.R.; writing—original draft preparation, T.D. and B.R.; writing—review and editing, M.G. and H.N.; visualization, T.D. and B.R.; supervision, T.D., B.R. and H.N.; project administration, T.D. and B.R.; funding acquisition, H.N. All authors have read and agreed to the published version of the manuscript.

Funding

This research was funded by the German Federal Ministry for Economic Affairs and Energy (Grant number: 03ET1652E) and the German Research Foundation (Grant numbers: NI 414/26-2 and SPP 1934). The APC was funded by the KIT-Publication Fund of the Karlsruhe Institute of Technology.

Institutional Review Board Statement

Not applicable.

Informed Consent Statement

Not applicable.

Data Availability Statement

The data presented in this study are available on request from the corresponding author.

Acknowledgments

The authors would like to thank Michael Barros Groß and Matthias Kind from the Institute of Thermal Process Engineering in Karlsruhe (KIT) for providing material data.

Conflicts of Interest

The authors declare no conflict of interest.

References

  1. Hekmat, D. Large-scale crystallization of proteins for purification and formulation. Bioprocess. Biosyst. Eng. 2015, 38, 1209–1231. [Google Scholar] [CrossRef] [PubMed]
  2. Cornehl, B.; Overbeck, A.; Schwab, A.; Büser, J.P.; Kwade, A.; Nirschl, H. Breakage of lysozyme crystals due to compressive stresses during cake filtration. Chem. Eng. Sci. 2014, 111, 324–334. [Google Scholar] [CrossRef]
  3. Nowotny, P.; Hermann, J.; Li, J.; Krautenbacher, A.; Klöpfer, K.; Hekmat, D.; Weuster-Botz, D. Rational Crystal Contact Engineering of Lactobacillus brevis Alcohol Dehydrogenase to Promote Technical Protein Crystallization. Cryst. Growth Des. 2019. [Google Scholar] [CrossRef]
  4. Kubiak, M.; Solarczek, J.; Kampen, I.; Schallmey, A.; Kwade, A.; Schilde, C. Micromechanics of Anisotropic Cross-Linked Enzyme Crystals. Cryst. Growth Des. 2018, 18, 5885–5895. [Google Scholar] [CrossRef]
  5. Hubbuch, J.; Kind, M.; Nirschl, H. Preparative Protein Crystallization. Chem. Eng. Technol. 2019, 42, 2275–2281. [Google Scholar] [CrossRef] [Green Version]
  6. Groß, M.; Kind, M. Bulk Crystallization of Proteins by Low-Pressure Water Evaporation. Chem. Eng. Technol. 2016, 39, 1483–1489. [Google Scholar] [CrossRef]
  7. Barros Groß, M.; Kind, M. Comparative Study on Seeded and Unseeded Bulk Evaporative Batch Crystallization of Tetragonal Lysozyme. Cryst. Growth Des. 2017, 17, 3491–3501. [Google Scholar] [CrossRef]
  8. Anlauf, H. Wet Cake Filtration: Fundamentals, Equipment, Strategies; WILEY VCH: Weinheim, Germany, 2020. [Google Scholar]
  9. Radel, B.; Funck, M.; Nguyen, T.H.; Nirschl, H. Determination of filtration and consolidation properties of protein crystal suspensions using analytical photocentrifuges with low volume samples. Chem. Eng. Sci. 2019, 196, 72–81. [Google Scholar] [CrossRef] [Green Version]
  10. Radel, B.; Nguyen, T.H.; Nirschl, H. Calculation of the flux density function for protein crystals from small scale settling and filtration experiments. Preprints 2021, 2021050483. [Google Scholar] [CrossRef]
  11. Löbnitz, L. Auslegung des Separationsprozesses und Entwicklung Neuer Verfahrenskonzepte zur Integrierten Produktion und Separation Kristalliner Aminosäuren. Ph.D. Thesis, Karlsruher Institut für Technologie, Karlsruhe, Germany, 2020. [Google Scholar] [CrossRef]
  12. Behr, A.; Brehme, V.A.; Ewers, C.; Grön, H.; Kimmel, T.; Küppers, S.; Symietz, I. New Developments in Chemical Engineering for the Production of Drug Substances. Eng. Life Sci. 2004, 4, 15–24. [Google Scholar] [CrossRef]
  13. Lier, S.; Paul, S.; Ferdinand, D.; Grünewald, M. Modulare Verfahrenstechnik: Apparateentwicklung für wandlungsfähige Produktionssysteme. Chem. Ing. Tech. 2016, 88, 1444–1454. [Google Scholar] [CrossRef]
  14. Bieringer, T.; Buchholz, S.; Kockmann, N. Future Production Concepts in the Chemical Industry: Modular-Small-Scale-Continuous. Chem. Eng. Technol. 2013, 36, 900–910. [Google Scholar] [CrossRef]
  15. Dobler, T.; Buchheiser, S.; Gleiß, M.; Nirschl, H. Development and Commissioning of a Small-Scale, Modular and Integrated Plant for the Quasi-Continuous Production of Crystalline Particles. Processes 2021, 9, 663. [Google Scholar] [CrossRef]
  16. Thurner, F. Der Titus-Nutsch-Trockner-Neue Wege der Produktisolierung. Chem. Ing. Tech. 1990, 62, 753–755. [Google Scholar] [CrossRef]
  17. Gehrmann, D.; Schweigler, N. Device for Continuous Filtration and Drying of a Solid Suspension. U.S. Patent No. 5,527,458, 18 June 1996. [Google Scholar]
  18. Barros Groß, M.; Kind, M. From microscale phase screening to bulk evaporative crystallization of proteins. J. Cryst. Growth 2018, 498, 160–169. [Google Scholar] [CrossRef]
  19. Schindelin, J.; Arganda-Carreras, I.; Frise, E.; Kaynig, V.; Longair, M.; Pietzsch, T.; Preibisch, S.; Rueden, C.; Saalfeld, S.; Schmid, B.; et al. Fiji: An open-source platform for biological-image analysis. Nat. Methods 2012, 9, 676–682. [Google Scholar] [CrossRef] [PubMed] [Green Version]
  20. Ridler, T.W.; Calvard, S. Picture Thresholding Using an Iterative Selection Method. IEEE Trans. Syst. Man Cybern. 1978, 8, 630–632. [Google Scholar] [CrossRef]
  21. Dürrenberger, M.B.; Handschin, S.; Conde-Petit, B.; Escher, F. Visualization of Food Structure by Confocal Laser Scanning Microscopy (CLSM). LWT Food Sci. Technol. 2001, 34, 11–17. [Google Scholar] [CrossRef]
  22. Buades, A.; Coll, B.; Morel, J.M. A Non-Local Algorithm for Image Denoising. In Proceedings of the 2005 IEEE Computer Society Conference on Computer Vision and Pattern Recognition (CVPR 2005), San Diego, CA, USA, 20–25 June 2005; pp. 60–65. [Google Scholar] [CrossRef]
  23. VDI 2762. Mechanical Solid-Liquid Separation by Cake Filtration; Standard VDI 2762; Verein Deutscher Ingenieure e.V.: Düsseldorf, Germany, 2010. [Google Scholar]
  24. Loginov, M.; Samper, F.; Gésan-Guiziou, G.; Sobisch, T.; Lerche, D.; Vorobiev, E. Centrifugal ultrafiltration for determination of filter cake properties of colloids. J. Membr. Sci. 2017, 536, 59–75. [Google Scholar] [CrossRef]
Figure 1. Concept of the enhanced belt crystallizer. The basis of the system is a belt filter, in which the vacuum trays below the filter medium are replaced by functional units. The plant includes the process steps crystallization, aging and solid–liquid separation. Key parameters are pressure, temperature and time.
Crystals 11 00713 g001
Figure 2. Schematic (left) and CAD drawing (right) of the process chamber. The component consists of a rectangular aluminum cuboid (1), a flat seal (2) and connections for vacuum (3), stirring tool (4) and temperature sensor (5). The front sides are provided with angles to ensure exact positioning and transport (6).
Crystals 11 00713 g002
Figure 3. Schematic depiction of the working principle of Micro Computer-Tomography.
Crystals 11 00713 g003
Figure 4. Transfer of the conventional process route to the integrated laboratory system. In a first step, the batch vessel is replaced by a process chamber (1). Subsequently, the scale of the filtration process is enlarged (2) and tests are carried out with a filter cloth (3). Finally, the transfer to the laboratory plant takes place (4).
Crystals 11 00713 g004
Figure 5. Light microscopy images of crystals produced in the process chamber. The (left) side of the figure shows isometric and the (right) side rod-shaped crystals.
Crystals 11 00713 g005
Figure 6. Particle size distribution as a function of the manufacturing route. It is found that both isometric (left) and rod-like (right) crystals with almost identical size properties as in the batch vessel may be produced in the process chamber. The data for the rods synthesized in the batch vessel are kindly provided by Dr.-Ing. Barros Groß and Prof. Dr.-Ing. Kind from the Institute of Thermal Process Engineering in Karlsruhe (KIT).
Crystals 11 00713 g006
Figure 7. Height specific cake resistances from permeation experiments in the filtration cuvette [10] with crystals from Groß and Kind [6] and permeation data from the pressure nutsche with crystals produced in the process chamber.
Crystals 11 00713 g007
Figure 8. Height specific filter cake resistances of rod-like lysozyme crystals measured with the pressure nutsche using a membrane and a cloth as filter medium.
Crystals 11 00713 g008
Figure 9. Laser scanning microscope images. Surface profile of an unused (left) and a used (right) filter cloth. It is noticeable the original surface including the pore structure is still visible when used, so that the influence of the contaminations is negligible.
Crystals 11 00713 g009
Figure 10. 3D rendering of a filter cake (left) and particle size distributions prevailing in the individual layers (right). It can be seen that the particle size distribution is almost homogeneous over the entire cake height.
Crystals 11 00713 g010
Table 1. Theoretical and experimental permeation time.
No./-123
V/ m 3 50.8 × 10−649.9 × 10−648.9 × 10⁻⁶
h C / m 7.40 × 10−36.40 × 10−37.33 × 10⁻³
t Theo / s 46.739.744.5
t Exp / s 44.237.842.3
Publisher’s Note: MDPI stays neutral with regard to jurisdictional claims in published maps and institutional affiliations.

