Article

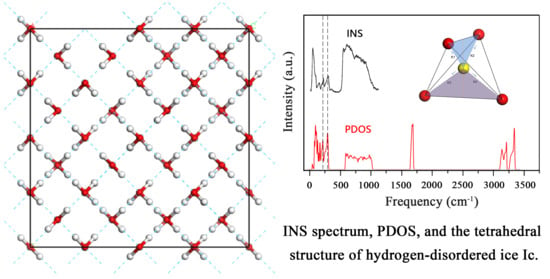
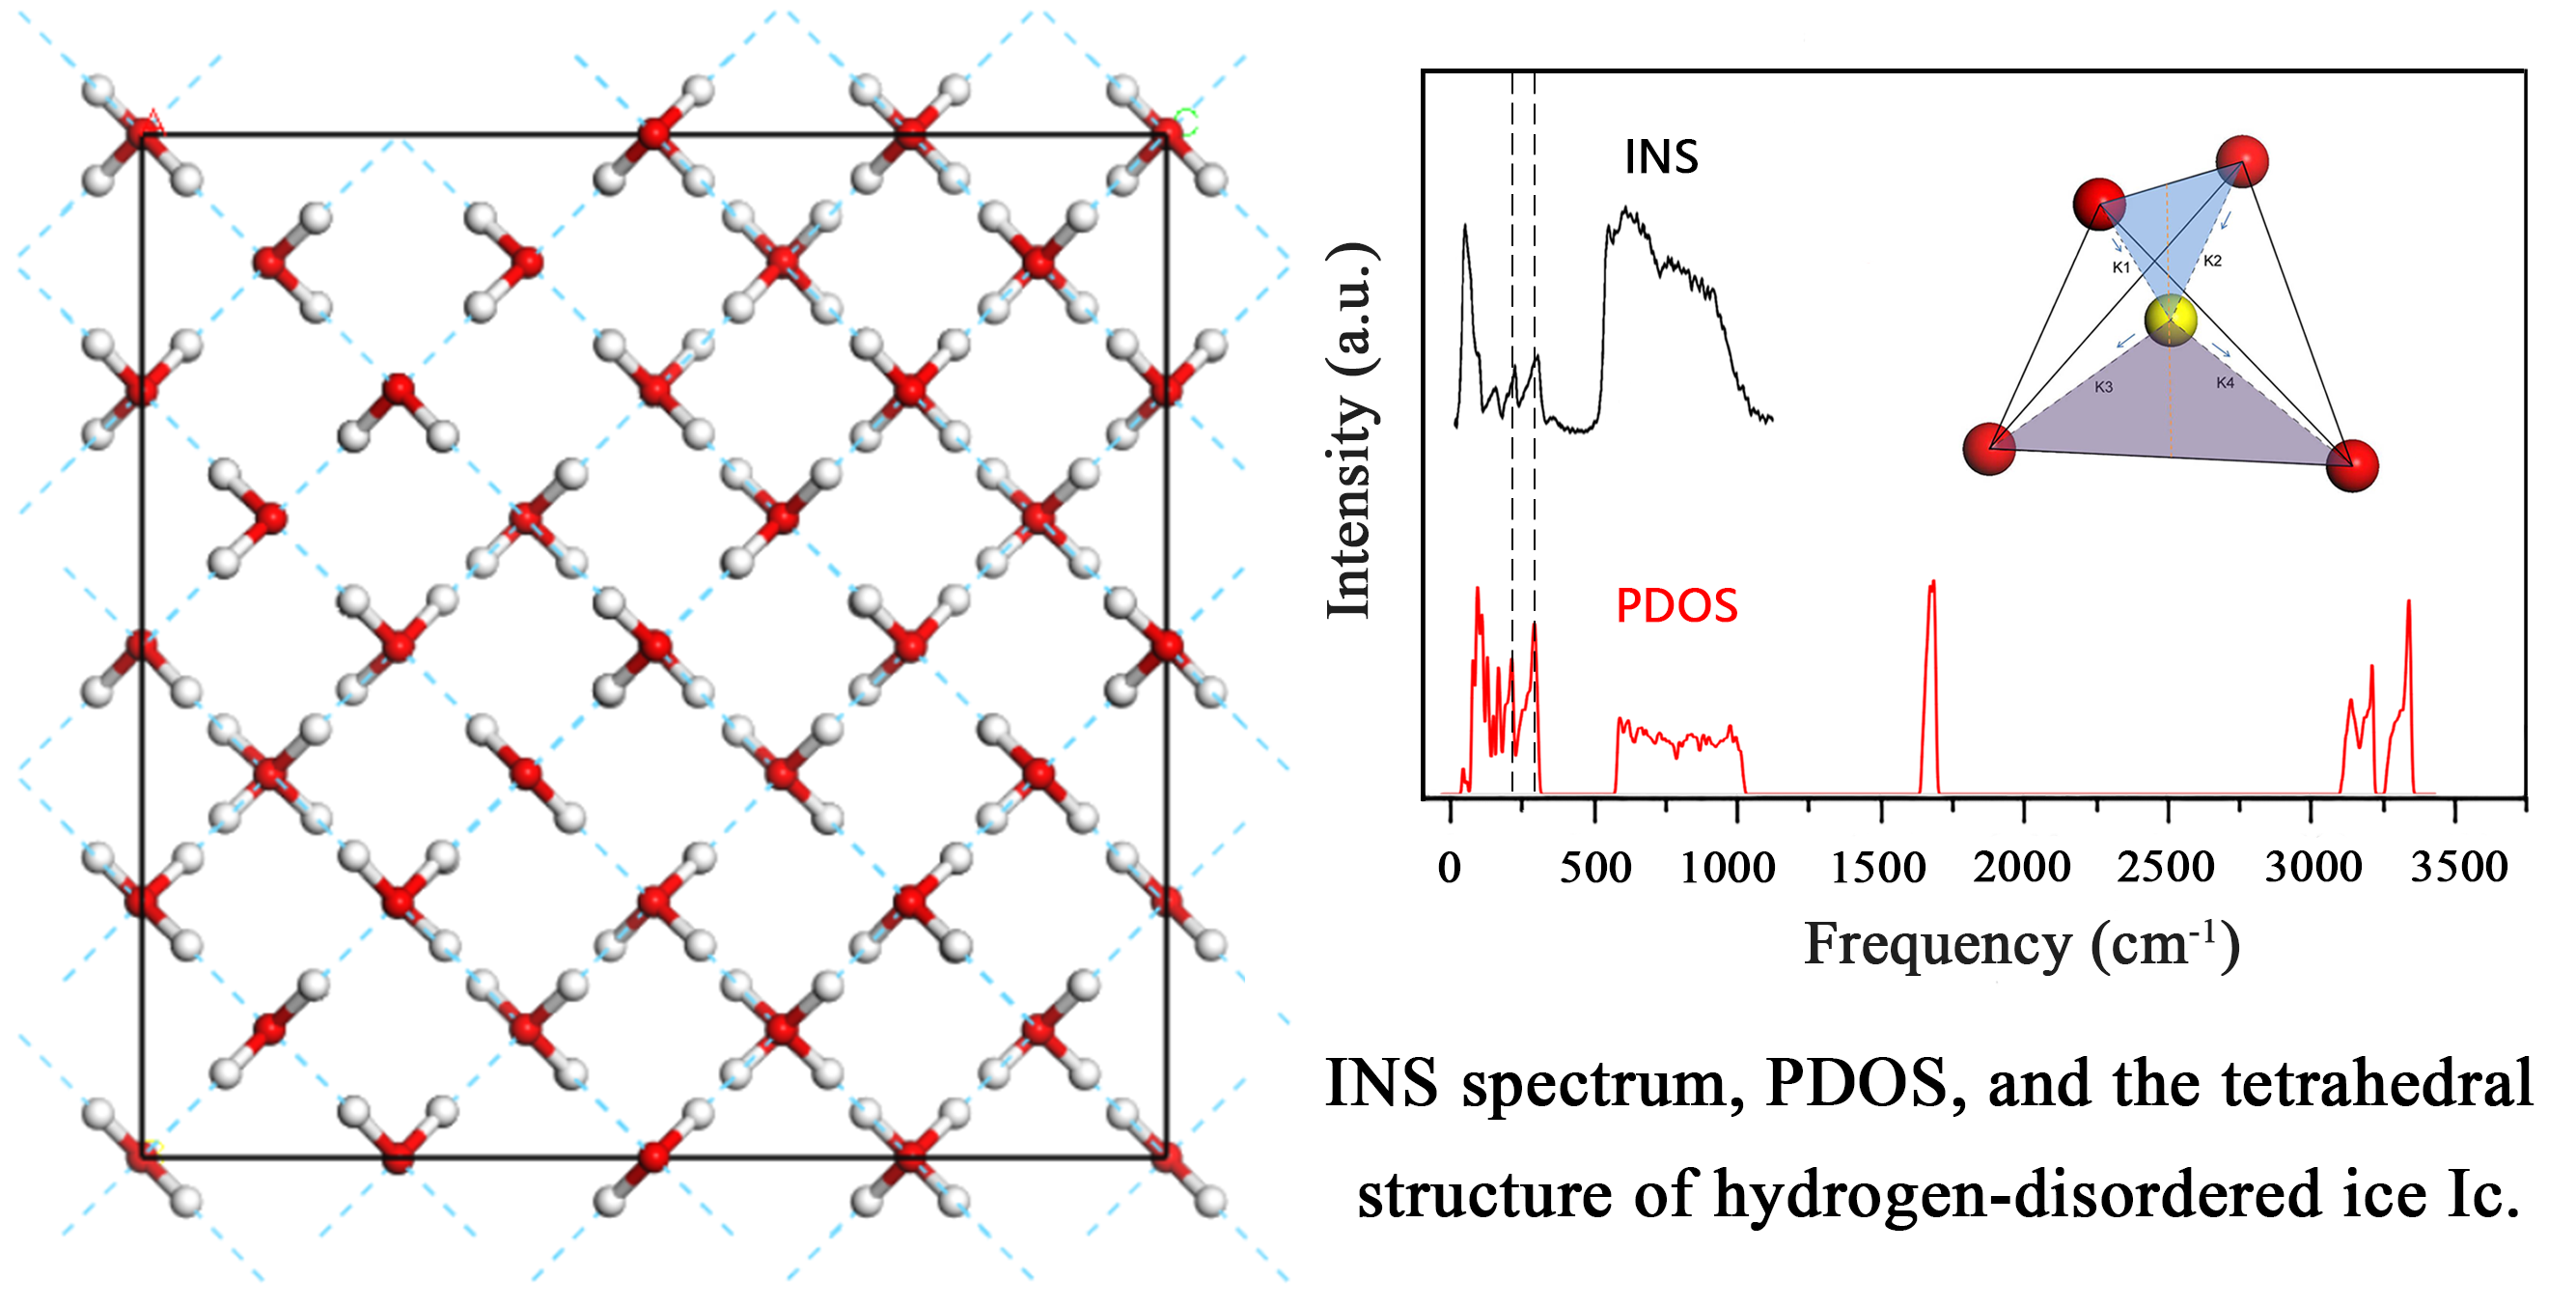
Studies of Hydrogen Bond Vibrations of Hydrogen-Disordered Ice Ic

School of Space Science and Physics, Shandong University, Weihai 264209, China
*
Author to whom correspondence should be addressed.
Crystals 2021, 11(6), 668; https://doi.org/10.3390/cryst11060668
Submission received: 7 May 2021 / Revised: 8 June 2021 / Accepted: 8 June 2021 / Published: 10 June 2021
(This article belongs to the Special Issue First-Principles SimulationNano-Theory)

Abstract

:
The hydrogen-disordered structure of ice, Ic, makes it difficult to analyze the vibrational normal modes in the far-infrared region (i.e., the molecular translation band). To clarify the origin of the energy-splitting of hydrogen bond vibrations in this area, a 64-molecule supercell was constructed and calculated using first-principles density functional theory. The results were in good agreement with inelastic neutron scattering experiments and our previous study of a hydrogen-ordered ice Ic model. Assisted by analytic equations, we concluded that the origin of the two hydrogen bond peaks in real ice Ic is consistent with that of hydrogen-ordered ice Ic: the peaks originate from two kinds of normal mode vibration. We categorize the four peaks in the far-infrared region recorded from inelastic neutron scattering experiments as the acoustic peak, the superposition peak, the two-hydrogen bond peak and the four-hydrogen bond peak. We conclude that the existence of two intrinsic hydrogen bond vibration modes represents a general rule among the ice family, except ice X.

Graphical Abstract

1. Introduction

Water/ice is among the Earth’s most abundant materials. Despite its simplicity, at least 18 ice phases have been identified experimentally at specific pressures and temperatures [1,2,3,4,5,6,7,8,9,10,11]. In 2019, a new ice phase, ‘ice XVIII’, was found to exist at pressures greater than 100 GPa and temperatures above 2000 K [11]. Most ice phases exist in pairs, such as ice Ih and ice XI, which have the same oxygen positions but differ in terms of hydrogen order or disorder. The vibrational spectrum of ice may be detected by infrared (IR) absorption, Raman scattering and inelastic neutron scattering (INS). These spectra can also be simulated using the first-principles density functional theory (DFT) to reveal the lattice structure and the vibrational energies of atoms and molecules. However, the complex hydrogen-disordered structure obstructs phonon analysis. First, we must construct a large supercell to mimic the real lattice structure. However, because the number of simulated normal modes is very large, it is difficult to discern the insight vibration rules. In this study, we demonstrate how to determine the intrinsic vibrational types of the hydrogen bonds (H-bonds) of ice Ic using a comparative method with a hydrogen-ordered ice Ic structure.
König was the first to identify and deduce the structure of ice Ic [12]. The density of ice Ic is nearly the same as ice Ih [13], and its oxygen atoms are arranged in a diamond structure. In other word, the stacking mode of Ic is A, B, C while that of Ih is A, B, A. Ice Ic has a face-centred cubic structure. It can be formed in various ways, such as by the homogeneous crystallisation of pure water droplets at approximately 235 K [14,15], by the decompression of high-density ice at 77 K [16] or from amorphous ice [13,17], ice II, ice III or ice V under high pressure [1]. Under normal conditions, cubic ice Ic is metastable and will gradually convert to hexagonal ice Ih. Whalley first discovered the presence of ice Ic in nature in the refractive halo of sunlight [18]. However, the experimental synthesis of large, high-purity ice Ic crystals is difficult [16,19,20]. A large number of methods have been developed to prepare high-purity ice Ic in recent decades [21,22,23], and disordered accumulation of hydrogen ice with purity in excess of 70% can be prepared [24]. In 2020, Ulivi, del Rosso [25] and Komatsu et al. [26] proposed two methods for the preparation of ice Ic with 100% purity without stacking defects.
Although the ice Ic phase is hydrogen-disordered, Geiger et al. concluded that the ferroelectric hydrogen-ordered structure of ice Ic is the most stable geometric structure based on the results of spectral experiments and first-principles simulations [27]. They proposed that their experimental spectra provided evidence for a partially hydrogen-ordered structure in ice Ic, but no unique assignment of the hydrogen order was possible. We simulated the vibrational spectrum of the ferroelectric hydrogen-ordered structure of ice Ic [28]. We later used that hydrogen-ordered model to identify two kinds of H-bond vibrational modes and confirmed that this is a general rule for ice structures. In this study, we optimised the hydrogen-disordered phase of ice Ic with a large supercell. Our comparison with the former hydrogen-ordered ice Ic allowed us to verify the two main H-bond vibrational types in the lattice and analyse the physical mechanism with the aid of DFT simulations.

2. Methods

Despite the hydrogen atoms, the primitive cell can be experimentally measured. Due to its hydrogen-disordered structure under static equilibrium conditions, ice Ic has no periodic repeated unit. Based on the consistency between simulation results and experiments in our previous work [29,30,31,32,33], we constructed a 64-molecule supercell with GenIce [34], in which the hydrogen atoms were rearranged randomly in accordance with the Bernal–Fowler rules [35] to mimic the real structure. The phonon density of states (PDOS) was calculated using the CASTEP module [36] of Materials Studio 6.0 based on the first-principles DFT method. For such a supercell, it was treated as a periodic primitive cell and can be calculated with basic set of plane waves. Meanwhile, the inner hydrogen atoms were disordered so that the calculated normal modes could represent the massive non-degenerate states. Since the electron density has a large gradient change, the exchange-correlation functional of generalized gradient approximation (GGA) was appropriate. Consistent with our previous work [28,31], and to reproduce the relevant features in experimental spectra, we chose the GGA RPBE [37] functional. The calculation of phonons requires high-accuracy geometry optimization. The energy threshold and self-consistent field tolerance were set to 1 × 10⁻⁹ eV per atom for geometry optimization. The energy cut-off was 830 eV, based on our experience. Due to the large supercell, the first Bouillon Zone was small, so that the k-point can be set as 1 × 1 × 1. Norm-conserving pseudopotentials were used to calculate the PDOS with the linear response method. We used our self-written code [31] to classify the main vibration vectors of oxygen, discussed in detail below.

3. Results and Discussion

Figure 1 shows the good agreement between the PDOS spectra of the hydrogen-ordered ice Ic and the supercell ice Ic. All four bands have identical widths in the hydrogen-ordered ice Ic and supercell ice Ic spectra. As the primitive cell of hydrogen-ordered ice Ic has two water molecules, there are only 2 × 3 × 3 − 3 = 15 optical normal modes; thus, the PDOS curve shows sharp pronounced peaks. In contrast with this, the 64-molecule supercell has 64 × 3 × 3 − 3 = 573 normal modes. The vibrational modes are all non-degenerate, and many adjacent modes overlap to form a smooth curve. We focus on the translation band, which comprises the optical and acoustic normal modes. Two sharp H-bond vibrational peaks are obvious in this region and show good agreement with the INS experimental data, as shown in Figure 1.
The simulated PDOS is generated by integrating the phonon signals from the entire Brillouin zone. The INS data also reflect the phonons throughout the Brillouin zone, so the accuracy of PDOS can be verified by the INS spectrum. The PDOS of the supercell ice Ic shows two peaks at 215 and 293 cm−1, which correspond to those at 225 and 298 cm−1 in the INS spectrum. We have shown that the two characteristic peaks in many ice phases in the translation region are formed from two kinds of H-bond vibrational modes. The consistency between the supercell and hydrogen-ordered ice Ic shows that the main features of H-bond vibrations can be deduced from the hydrogen-ordered structure of ice Ic. In the study of hydrogen-ordered ice Ic, we found that the two peaks originate from three normal modes in total [28]. The molecular configurations of any ice phase are subject to the Bernal–Fowler rules, in which one water molecule links four neighbours via H-bonds to form a tetrahedral geometry [35]. For the strong peak, a molecule vibrates along the H-O-H angle bisectors with all four neighbours. Thus, all four H-bonds participate in the vibration, which can thus be named the ‘four-bond’ mode. For the weak peak, a molecule vibrates along two H-bonds while the other two remain static, so we refer to this kind as the ‘two-bond’ mode. In ice Ic, there are two degenerate modes of the two-bond kind due to symmetry in the basal plane. Hence, there are three normal modes in total.
According to the simulation results of hydrogen-ordered ice Ic, we analyse the dynamic process as follows.
The water molecule is treated as a point mass, and the oxygen is regarded as the approximate mass center. Details for this model can be seen from Reference [31]. In that work, we consider the O–O–O bending energies to explain the H-bond energy splitting. However, without the H–O–H bending, the angle change between two H-bonded O–O–O does not need extra energy. It originates from the molecular relative motions. Thus, we do not consider this factor. Considering the four linking H-bonds, the vibration energy in one cell is
Ψ = 1 4 k i = 1 2 j = 1 4 ( | d i j | d ) 2 ,
where k is the H-bond force constant, d is the O–O distance at equilibrium, ( | d i j | d ) represents the relative displacement between two adjacent molecules, i indicates the two molecules in one cell, and j indicates four neighbours. The factor 1/4 is used to subtract the double-counted potential energy. Regardless of the hydrogen atoms, the two-point masses in one primitive cell have six degrees of freedom. We use index α = 1, 2, …, 6 for the generalized coordinates. Expanding Φ as a function of quadratic terms of molecule displacements u ( l i )
Ψ = 0 + 1 2 α , β = 1 6 Φ α β ( l l i i ) u α ( l i ) u β ( l l ) + ,
where l , l indicates different cells. Assuming that the included angle of the H-bond and the vibrational direction are c o s θ , the vibration energy is proportional to c o s 2 θ . Thus, due to rotational symmetry, we obtain
c o s 2 θ 1 + c o s 2 θ 2 + c o s 2 θ 3 + c o s 2 θ 4 = 4 3 .
A locally tetrahedral structure, such as diamond, has three energy-degenerate optical normal modes. In fact, the tetrahedral symmetry of ice is broken by hydrogen atoms, so the vibrational normal modes show energy level splitting. To consider the two types of vibrational modes, we set a coefficient c and obtain
Φ α β ( l l i i ) = ( 2 Ψ u α ( l i ) u β ( l i ) ) = ( 4 3 c k 0 0 4 3 c k 0 0 0 4 3 c k 0 0 4 3 c k 0 0 0 4 3 c k 0 0 4 3 c k 4 3 c k 0 0 4 3 c k 0 0 0 4 3 c k 0 0 4 3 c k 0 0 0 4 3 c k 0 0 4 3 c k )
The Lagrangian of each cell is
L = 1 2 m α = 1 6 u ˙ α 2 + Φ ,
and the dynamic matrix is
k α β = Φ α β .
Based on the simulations, the hydrogen-ordered model comprises two kinds of molecular translational mode. According to the results of hydrogen-ordered ice Ic, the two frequencies are 320.76 and 229.96 cm−1.
Thus, we obtain
{   ω 1 = 1 m ( c 1 8 k 3 ) = 2 π × 320.76 × 3 × 10 10   s 1   ω 2 = 1 m ( c 2 8 k 3 ) = 2 π × 229.96 × 3 × 10 10   s 1
Taking the H-bond force constant as k = 17.1   N · m 1 (Ref. [38], p. 56), we obtain
{   c 1 = 2.40   c 2 = 1.23 .
Here, the ratio of two coefficients c 1 / c 2 = 1.95 2 .
These results indicate that the contributions of H-bond force constants of the four-bond mode are double those of the two-bond mode and that the vibrational energy ratio between the two modes is approximately 2 . The results verify that the H-bond energy level splitting is due to the existence of two kinds of H-bond vibrational mode in the tetrahedral structure of ice. It is then natural to deduce that the two characteristic peaks in the supercell ice Ic result from these two kinds of modes. We use a simple model of intermolecular connecting spring to analyze the two kinds of vibrational modes in Reference [28]. We obtained the simple ratio 2 . In this work, we obtained the vibrational frequencies from first-principles DFT calculations and verified that the classification of four-bond and two-bond modes is rational.
The stronger vibrational band ranging from 160 to 320 cm−1 comes from H-bond-related monomolecular vibrations, so we classified the normal modes (gamma point only) into two categories and fitted the signals into two curves, as shown in Figure 2, which shows that the sum curve is consistent with the PDOS. The principle of classification is based on the vibrational direction of the maximum amplitude of oxygen in one mode. The source code of this self-written code was published in Reference [31]. As shown in Figure 2, the four-bond modes have higher energies at 293 cm−1, whilst the greatest distribution of the two-bond modes lies at 215 cm−1. However, it is notable that the two kinds of modes overlap below 280 cm−1. As all of the modes are non-degenerate, many coupled modes are located between the peaks in the four-bond and two-bond modes, so our simple self-written code may be unable to distinguish them clearly. In addition, the use of oxygen as the point-mass center may produce some errors. The main conclusions from Figure 2 are that the strong peak at 293 cm−1 in the PDOS comes from four-bond mode vibrations and that the weak peak at 215 cm−1 comes from two-bond mode vibrations. Thus, based on the hydrogen-ordered model, we verify that the real ice Ic phase follows the same rule as that derived from the hydrogen-ordered model. Considering our series of investigations into ice phases, we conclude that this is a general rule among the ice family, except ice X [28,29,30,31,32,33,39,40,41,42,43,44,45,46].
The vibrational modes discussed above comprise the vibration of a single molecule against its neighbors. In contrast, the modes in the lower-energy regions are cluster vibrations, in which many molecules bonded together present a collective vibration. In this case, the number of participating H-bonds decreases while the mass of the cluster increases. For a simple harmonic motion, the vibrational frequency υ = k / m ; therefore, the cluster vibrations present lower energies than the monomolecular vibrations, and many of them may overlap with acoustic phonons. This is the origin of peaks below 160 cm−1 in the PDOS. Figure 3 portrays several typical examples of the dynamic processes of these normal modes. Figure 3a,b shows two cluster vibrations. Figure 3c,d illustrates the dynamic movement of the two-bond mode at 219 cm−1 and the four-bond mode at 311 cm−1. The gold color indicates the main vibrating molecules and the arrow sizes are proportional to the amplitudes. Videos of these four examples are provided in the Supplementary Materials.
In the lowest-energy translation region, a distinct peak was observed at 57 cm−1 via the INS experiments. This peak represents phonons that belong to acoustic branches and corresponds to the peak at 95 cm−1 in the simulated PDOS curve. Another INS peak at 153 cm−1 should correspond to the PDOS peak at 168 cm−1. We attribute this peak to the superposition of acoustic phonons with optical phonons, as seen in the dispersion curves from our previous study of hydrogen-ordered ice Ic [28]. Thus, from low to high energy, the four pronounced peaks in Figure 1 in the translation band of ice Ic are attributed to the acoustic peak, the superposition peak, the two-bond peak and the four-bond peak.

4. Conclusions

We previously confirmed the origin of energy splitting in the H-bond vibrations of ice Ic via simulation of a hydrogen-ordered ice Ic model [28]. However, the real ice Ic crystal is hydrogen-disordered. To simulate the real structure, we constructed a 64-molecule supercell. The calculated PDOS shows good agreement with the INS spectrum and the hydrogen-ordered model of ice Ic, implying that the origin of the two H-bond peaks in real ice Ic are consistent with that inferred from simulations of hydrogen-ordered ice Ic. We confirmed the existence of two kinds of intrinsic H-bond vibration modes in hydrogen-ordered ice Ic due to the local tetrahedral structure. The strong mode was named the ‘four-bond’ mode because the molecule vibrates against four neighbours, so that all four H-bonds work together. The weak mode was named the ‘two-bond’ mode because the molecule vibrates along only two H-bonds, while the other two remain static. Based on the two kinds of H-bond vibrations, we classified the H-bond modes into two corresponding groups and obtained consistent results. Thus, the most intense H-bond vibrations correspond to these two kinds of modes, giving rise to two distinct peaks.
Due to the simplicity of the primitive cell of hydrogen-ordered Ic, there are only one strong H-bond vibration mode and two degenerate weak H-bond vibration modes. For the 64-molecule hydrogen-disordered model, there are 3 × 64 − 3 = 189 normal modes in the translational band. As the normal modes are all non-degenerate due to the hydrogen-disordered structure, many coupled modes can be found away from the two H-bond peaks. Thus, a complex set of vibration modes coexist in a hydrogen-disordered ice Ic lattice. In the region below 160 cm−1 of real Ic, there are many cluster vibration modes, which have much lower vibrational energies. However, the PDOS curve shows a very similar pattern to the hydrogen-ordered model. This means that the two kinds of H-bond vibration modes represent the major feature of molecular vibrations in the far-IR region.
We classify the four distinct peaks in the INS spectrum of ice Ic as the acoustic peak, the superposition peak, the two-bond peak and the four-bond peak, as in our previous investigations into ice Ih [31]. We conclude that the existence of two intrinsic H-bond vibration modes represents a general rule among the ice family, except ice X.

Supplementary Materials

The following are available online at https://www.mdpi.com/article/10.3390/cryst11060668/s1, Video S1: Dynamic process of cluster vibration at 89 cm−1. Video S2: Dynamic process of cluster vibration at 117 cm−1. Video S3: Dynamic process of two-bond vibration at 219 cm−1. Video S4: Dynamic process of four-bond vibration at 311 cm−1.

Author Contributions

X.-H.Y., X.-L.Q. and X.-T.D. performed simulations and drafted the manuscript; J.-W.C., X.-L.Z. and H.-C.W. assisted with structural modeling and data processing; Y.-J.S. and Z.-X.X. participated in the discussion of results; P.Z. conducted the project and edited the manuscript; all authors gave final approval for publication. All authors have read and agreed to the published version of the manuscript.

Funding

This research was funded by the National Natural Science Foundation of China, grant number 11075094.

Acknowledgments

The numerical calculations were done on the supercomputing system in the Supercomputing Center, Shandong University, Weihai.

Conflicts of Interest

The authors declare no conflict of interest.

References

  1. Bertie, J.E.; Calvert, L.D.; Whalley, E. Transformations of ice II, ice III, and ice V at atmospheric pressure. J. Chem. Phys. 1963, 38, 840–846. [Google Scholar] [CrossRef]
  2. Bertie, J.E.; Whalley, E. Optical spectra of orientationally disordered crystals. II. Infrared spectrum of ice Ih and ice Ic from 360 to 50 cm−1. J. Chem. Phys. 1967, 46, 1271–1284. [Google Scholar] [CrossRef]
  3. Whalley, E.; Heath, J.B.R.; Davidson, D.W. Ice IX: An antiferroelectric phase related to ice III. J. Chem. Phys. 1968, 48, 2362–2370. [Google Scholar] [CrossRef]
  4. Tajima, Y.; Matsuo, T.; Suga, H. Phase transition in KOH-doped hexagonal ice. Nature 1982, 299, 810–812. [Google Scholar] [CrossRef]
  5. Kuhs, W.F.; Finney, J.L.; Vettier, C.; Bliss, D.V. Structure and hydrogen ordering in ices VI, VII, and VIII by neutron powder diffraction. J. Chem. Phys. 1984, 81, 3612–3623. [Google Scholar] [CrossRef]
  6. Hirsch, K.R.; Holzapfel, W.B. Effect of high pressure on the Raman spectra of ice VIII and evidence for ice X. J. Chem. Phys. 1986, 84, 2771–2775. [Google Scholar] [CrossRef]
  7. Lobban, C.; Finney, J.L.; Kuhs, W.F. The structure of a new phase of ice. Nature 1998, 391, 268–270. [Google Scholar] [CrossRef]
  8. Salzmann, C.G.; Radaelli, P.G.; Hallbrucker, A.; Mayer, E.; Finney, J.L. The preparation and structures of hydrogen-ordered phases of ice. Science 2006, 311, 1758–1761. [Google Scholar] [CrossRef]
  9. Salzmann, C.G.; Radaelli, P.G.; Mayer, E.; Finney, J.L. Ice XV: A new thermodynamically stable phase of ice. Phys. Rev. Lett. 2009, 103, 105701. [Google Scholar] [CrossRef] [PubMed] [Green Version]
  10. Falenty, A.; Hansen, T.C.; Kuhs, W.F. Formation and properties of ice XVI obtained by emptying a type sII clathrate hydrate. Nature 2014, 516, 231–233. [Google Scholar] [CrossRef]
  11. Millot, M.; Coppari, F.; Rygg, J.R.; Barrios, A.C.; Hamel, S.; Swift, D.C.; Eggert, J.H. Nanosecond X-ray diffraction of shock-compressed superionic water ice. Nature 2019, 569, 251–255. [Google Scholar] [CrossRef] [PubMed]
  12. König, H. Eine kubische Eismodifikation. Z. Für Krist. Cryst. Mater. 1943, 105, 279–286. [Google Scholar] [CrossRef]
  13. Dowell, L.G.; Rinfret, A.P. Low-temperature forms of ice as studied by X-ray diffraction. Nature 1960, 189, 1144–1148. [Google Scholar] [CrossRef]
  14. Murray, B.J.; Bertram, A.K. Formation and stability of cubic ice in water droplets. Phys. Chem. Chem. Phys. 2006, 8, 186–192. [Google Scholar] [CrossRef] [PubMed] [Green Version]
  15. Murray, B.J. Enhanced formation of cubic ice in aqueous organic acid droplets. Environ. Res. Lett. 2008, 3, 025008. [Google Scholar] [CrossRef]
  16. Malkin, T.L.; Murray, B.J.; Brukhno, A.V.; Anwar, J.; Salzmann, C.G. Structure of ice crystallized from supercooled water. Proc. Natl. Acad. Sci. USA 2012, 109, 1041–1045. [Google Scholar] [CrossRef] [PubMed] [Green Version]
  17. Mayer, E.; Hallbrucker, A. Cubic ice from liquid water. Nature 1987, 325, 601–602. [Google Scholar] [CrossRef]
  18. Whalley, E. Scheiner’s halo-Evidence for ice Ic in the atmosphere. Science 1981, 211, 389–390. [Google Scholar] [CrossRef]
  19. Kuhs, W.F.; Bliss, D.V.; Finney, J.L. High-resolution neutron powder diffraction study of ice-Ic. J. Phys. Colloq. 1987, 48, 631–636. [Google Scholar] [CrossRef]
  20. Kuhs, W.F.; Sippel, C.; Falenty, A.; Hansen, T.C. Extent and relevance of stacking disorder in “ice I-c”. Proc. Natl. Acad. Sci. USA 2012, 109, 21259–21264. [Google Scholar] [CrossRef] [PubMed] [Green Version]
  21. Murray, B.; Knopf, D.; Bertram, A. The formation of cubic ice under conditions relevant to Earth’s atmosphere. Nature 2005, 434, 202–205. [Google Scholar] [CrossRef]
  22. Falenty, A.; Kuhs, W.F. Self-preservation of CO2 gas hydrates-surface microstructure and ice perfection. J. Phys. Chem. B 2009, 113, 15975–15988. [Google Scholar] [CrossRef] [PubMed]
  23. Baker, J.M.; Dore, J.C.; Behrens, P. Nucleation of ice in confined geometry. J. Phys. Chem. B 1997, 101, 6226–6229. [Google Scholar] [CrossRef]
  24. Malkin, T.L.; Murray, B.J.; Salzmann, C.G.; Molinero, V.; Pickering, S.J.; Whale, T.F. Stacking disorder in ice I. Phys. Chem. Chem. Phys. 2015, 17, 60–76. [Google Scholar] [CrossRef] [Green Version]
  25. Del Rosso, L.; Celli, M.; Grazzi, F.; Catti, M.; Ulivi, L. Cubic ice Ic without stacking defects obtained from ice XVII. Nat. Mater. 2020, 19, 663–668. [Google Scholar] [CrossRef]
  26. Komatsu, K.; Machida, S.; Noritake, F.; Hattori, T.; Kagi, H. Ice I-c without stacking disorder by evacuating hydrogen from hydrogen hydrate. Nat. Commun. 2020, 11, 464. [Google Scholar] [CrossRef] [PubMed] [Green Version]
  27. Geiger, P.; Dellago, C.; Macher, M.; Franchini, C.; Kresse, G.; Bernard, J.; Stern, J.N.; Loerting, T. Proton ordering of cubic ice Ic: Spectroscopy and computer simulations. J. Phys. Chem. C 2014, 118, 10989–10997. [Google Scholar] [CrossRef]
  28. Yuan, Z.Y.; Zhang, P.; Yao, S.K.; Lu, Y.B.; Yang, H.Z.; Luo, H.W.; Zhao, Z.J. Computational assignments of lattice vibrations of ice Ic. RSC Adv. 2017, 7, 36801–36806. [Google Scholar] [CrossRef] [Green Version]
  29. Zhu, X.L.; Yuan, Z.Y.; Jiang, L.; Zhang, K.; Wang, Z.R.; Luo, H.W.; Gu, Y.; Cao, J.W.; Qin, X.L.; Zhang, P. Computational analysis of vibrational spectrum and H-bonds of ice XVII. New J. Phys. 2019, 21, 043054. [Google Scholar] [CrossRef]
  30. Gu, Y.; Zhu, X.L.; Jiang, L.; Cao, J.W.; Qin, X.-L.; Yao, S.K.; Zhang, P. Comparative analysis of H-bond vibrations in ice VIII and VII. J. Phys. Chem. C 2019, 123, 14880–14883. [Google Scholar] [CrossRef]
  31. Zhu, X.L.; Cao, J.W.; Qin, X.L.; Jiang, L.; Gu, Y.; Wang, H.C.; Liu, Y.; Kolesnikov, A.I.; Zhang, P. Origin of two distinct peaks of ice in the THz region and its application for natural gas hydrate dissociation. J. Phys. Chem. C 2019, 124, 1165–1170. [Google Scholar] [CrossRef]
  32. Cao, J.W.; Zhu, X.L.; Wang, H.C.; Qin, X.L.; Yuan, X.Q.; Wang, X.C.; Yu, J.L.; Ma, X.T.; Li, M.M.; Zhang, P. A Strategy for the Analysis of the Far-Infrared Vibrational Modes of Hydrogen-Disordered Ice V. J. Phys. Chem. C 2021, 125, 7913–7918. [Google Scholar] [CrossRef]
  33. Wang, X.C.; Zhu, X.L.; Gu, Y.; Wang, H.C.; Qin, X.L.; Cao, J.W.; Yu, X.H.; Yuan, X.Q.; Zhang, P. Comparative Analysis of Hydrogen-Bonding Vibrations of Ice VI. ACS Omega 2021, 6, 14442–14446. [Google Scholar] [CrossRef]
  34. Masakazu, M.; Takuma, Y.; Hideki, T. GenIce: Hydrogen-disordered ice generator. J. Comput. Chem. 2018, 39, 61–64. [Google Scholar]
  35. Bernal, J.D.; Fowler, R.H. A theory of water and ionic solution, with particular reference to hydrogen and hydroxyl ions. J. Chem. Phys. 1933, 1, 515–548. [Google Scholar] [CrossRef]
  36. Clark, S.J.; Segall, M.D.; Pickard, C.J.; Hasnip, P.J.; Probert, M.I.J.; Refson, K.; Payne, M.C. First principles methods using CASTEP. Z. Krist. Cryst. Mater. 2005, 220, 567–570. [Google Scholar] [CrossRef] [Green Version]
  37. Hammer, B.; Hansen, L.B.; Norskov, J.K. Improved adsorption energetics within density-functional theory using revised Perdew-Burke-Ernzerhof functionals. Phys. Rev. B 1999, 59, 7413–7421. [Google Scholar] [CrossRef] [Green Version]
  38. Petrenko, V.; Whitworth, R. Physics of Ice; Oxford University Press: Oxford, UK, 2002. [Google Scholar]
  39. Yao, S.K.; Zhang, P.; Zhang, Y.; Lu, Y.B.; Yang, T.L.; Sun, B.G.; Yuan, Z.Y.; Luo, H.W. Computing analysis of lattice vibrations of ice VIII. RSC Adv. 2017, 7, 31789–31794. [Google Scholar] [CrossRef] [Green Version]
  40. Zhang, K.; Zhang, P.; Wang, Z.R.; Zhu, X.L.; Lu, Y.B.; Guan, C.B.; Li, Y.H. DFT analysis of lattice vibrations of ice XIV. Molecules 2018, 23, 1781. [Google Scholar] [CrossRef] [PubMed] [Green Version]
  41. Jiang, L.; Yao, S.K.; Zhang, K.; Wang, Z.R.; Luo, H.W.; Zhu, X.L.; Gu, Y.; Zhang, P. Exotic Spectra and Lattice Vibrations of Ice X Using the DFT Method. Molecules 2018, 23, 2780. [Google Scholar] [CrossRef] [PubMed] [Green Version]
  42. Wang, Z.R.; Zhu, X.L.; Jiang, L.; Zhang, K.; Luo, H.W.; Gu, Y.; Zhang, P. Investigations of the H-bonds and vibrational spectra of clathrate ice XVI. Materials 2019, 12, 246. [Google Scholar] [CrossRef] [Green Version]
  43. Qin, X.L.; Zhu, X.L.; Cao, J.W.; Jiang, L.; Gu, Y.; Wang, X.C.; Zhang, P. Computational analysis of exotic molecular and atomic vibrations in ice XV. Molecules 2019, 24, 3115. [Google Scholar] [CrossRef] [PubMed] [Green Version]
  44. Cao, J.W.; Chen, J.Y.; Qin, X.L.; Zhu, X.L.; Jiang, L.; Gu, Y.; Yu, X.H.; Zhang, P. DFT investigations of the vibrational spectra and translational modes of ice II. Molecules 2019, 24, 3135. [Google Scholar] [CrossRef] [PubMed] [Green Version]
  45. Zhao, Z.J.; Qin, X.L.; Cao, J.W.; Zhu, X.L.; Yang, Y.C.; Wang, H.C.; Zhang, P. Computing investigations of molecular and atomic vibrations of ice IX. ACS Omega 2019, 4, 18936–18941. [Google Scholar] [CrossRef] [PubMed]
  46. Wei, Z.W.; Zhu, X.L.; Cao, J.W.; Qin, X.L.; Jiang, L.; Gu, Y.; Wang, H.C.; Zhang, P. Two basic vibrational modes of H-bonds in ice XIII. AIP Adv. 2019, 9, 115118. [Google Scholar] [CrossRef]
Figure 1. Simulated PDOS spectra of hydrogen-ordered (primitive cell; black curve) and hydrogen-disordered (supercell; red curve) ice Ic. The curve at the top is the INS experimental spectrum. The agreement of the two hydrogen bond peaks in these three spectra is marked with dashed lines. The 64-molecule supercell of ice Ic and the unit cell of the hydrogen-ordered model are inserted.
Crystals 11 00668 g001
Figure 2. Fitted curves of two-bond modes (red) and four-bond modes (blue) in hydrogen-disordered ice Ic. Inset: The PDOS spectrum in the translation region.
Crystals 11 00668 g002
Figure 3. Four examples of normal modes in the translational band of ice Ic. (a,b) are two cluster vibration modes. (c,d) are the two-bond and four-bond modes. Representative vibrating molecules are shown in gold. Arrows represent the vibrational direction of the atoms and are proportional in size to the vibration amplitude. Dotted lines indicate H-bonds.
Crystals 11 00668 g003
Publisher’s Note: MDPI stays neutral with regard to jurisdictional claims in published maps and institutional affiliations.

