
Crystal Plasticity Simulation of Magnesium and Its Alloys: A Review of Recent Advances


Abstract
:1. Introduction
2. Crystal Plasticity Models
2.1. Overview
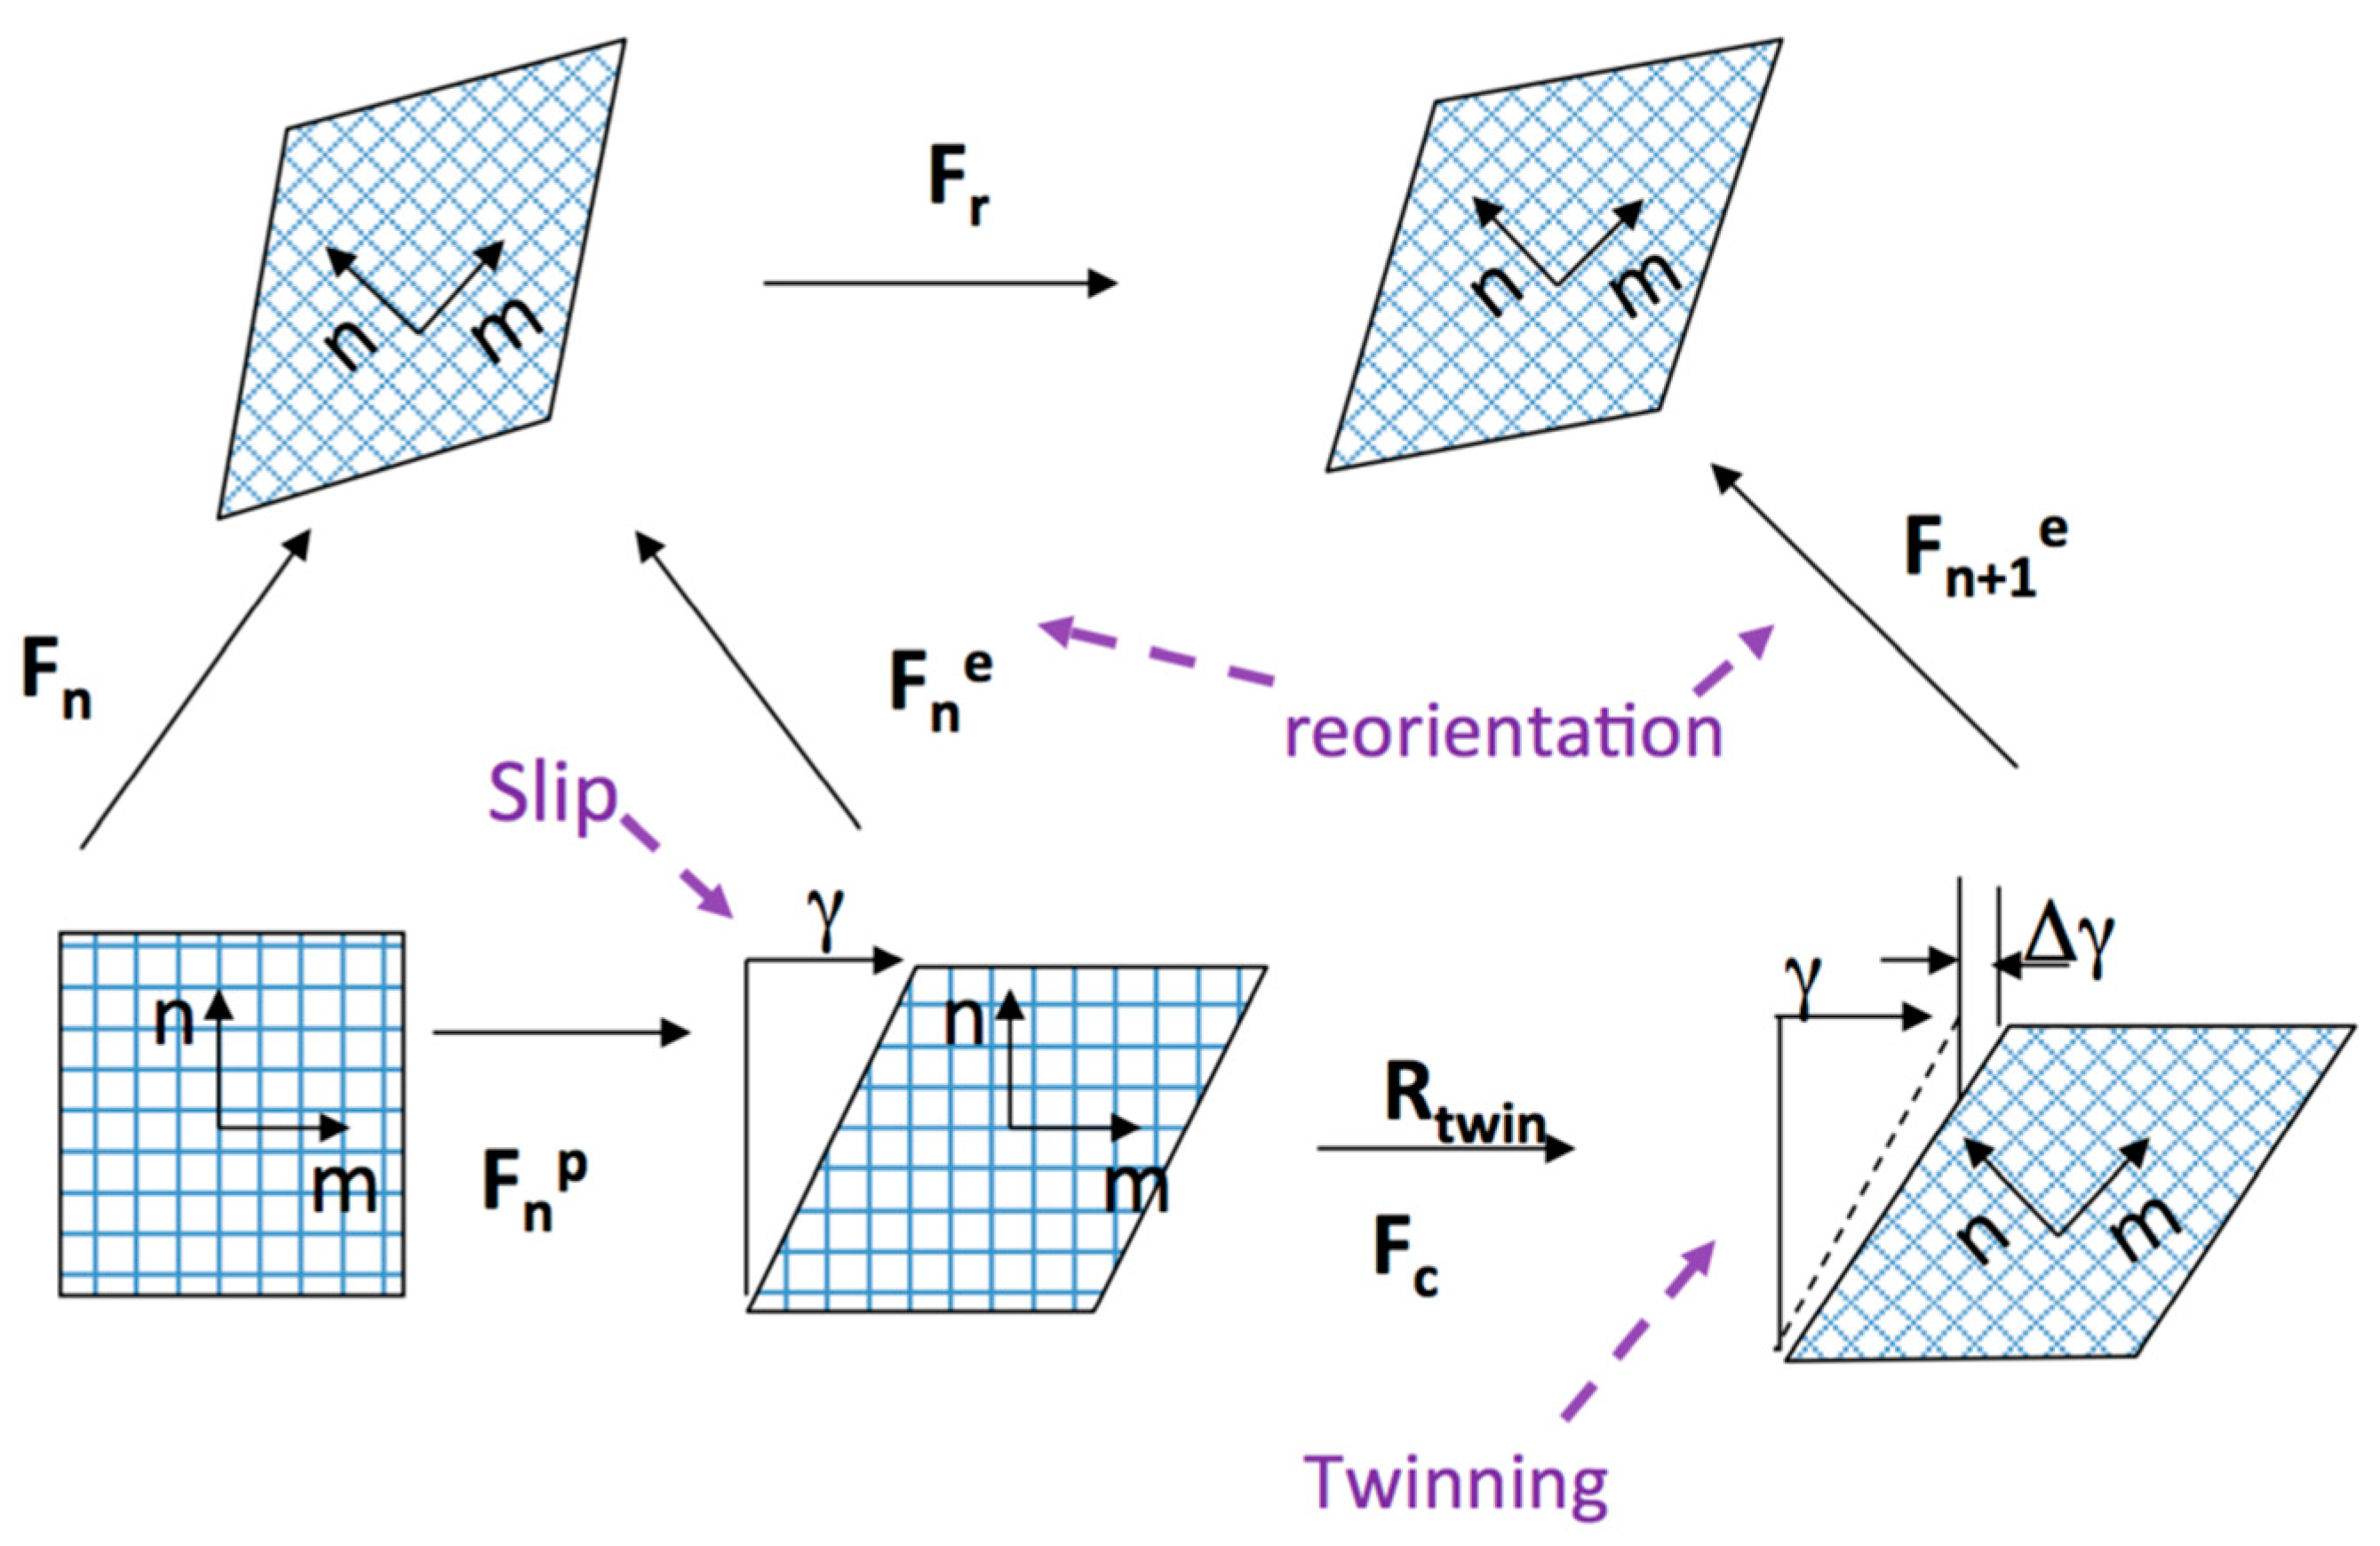
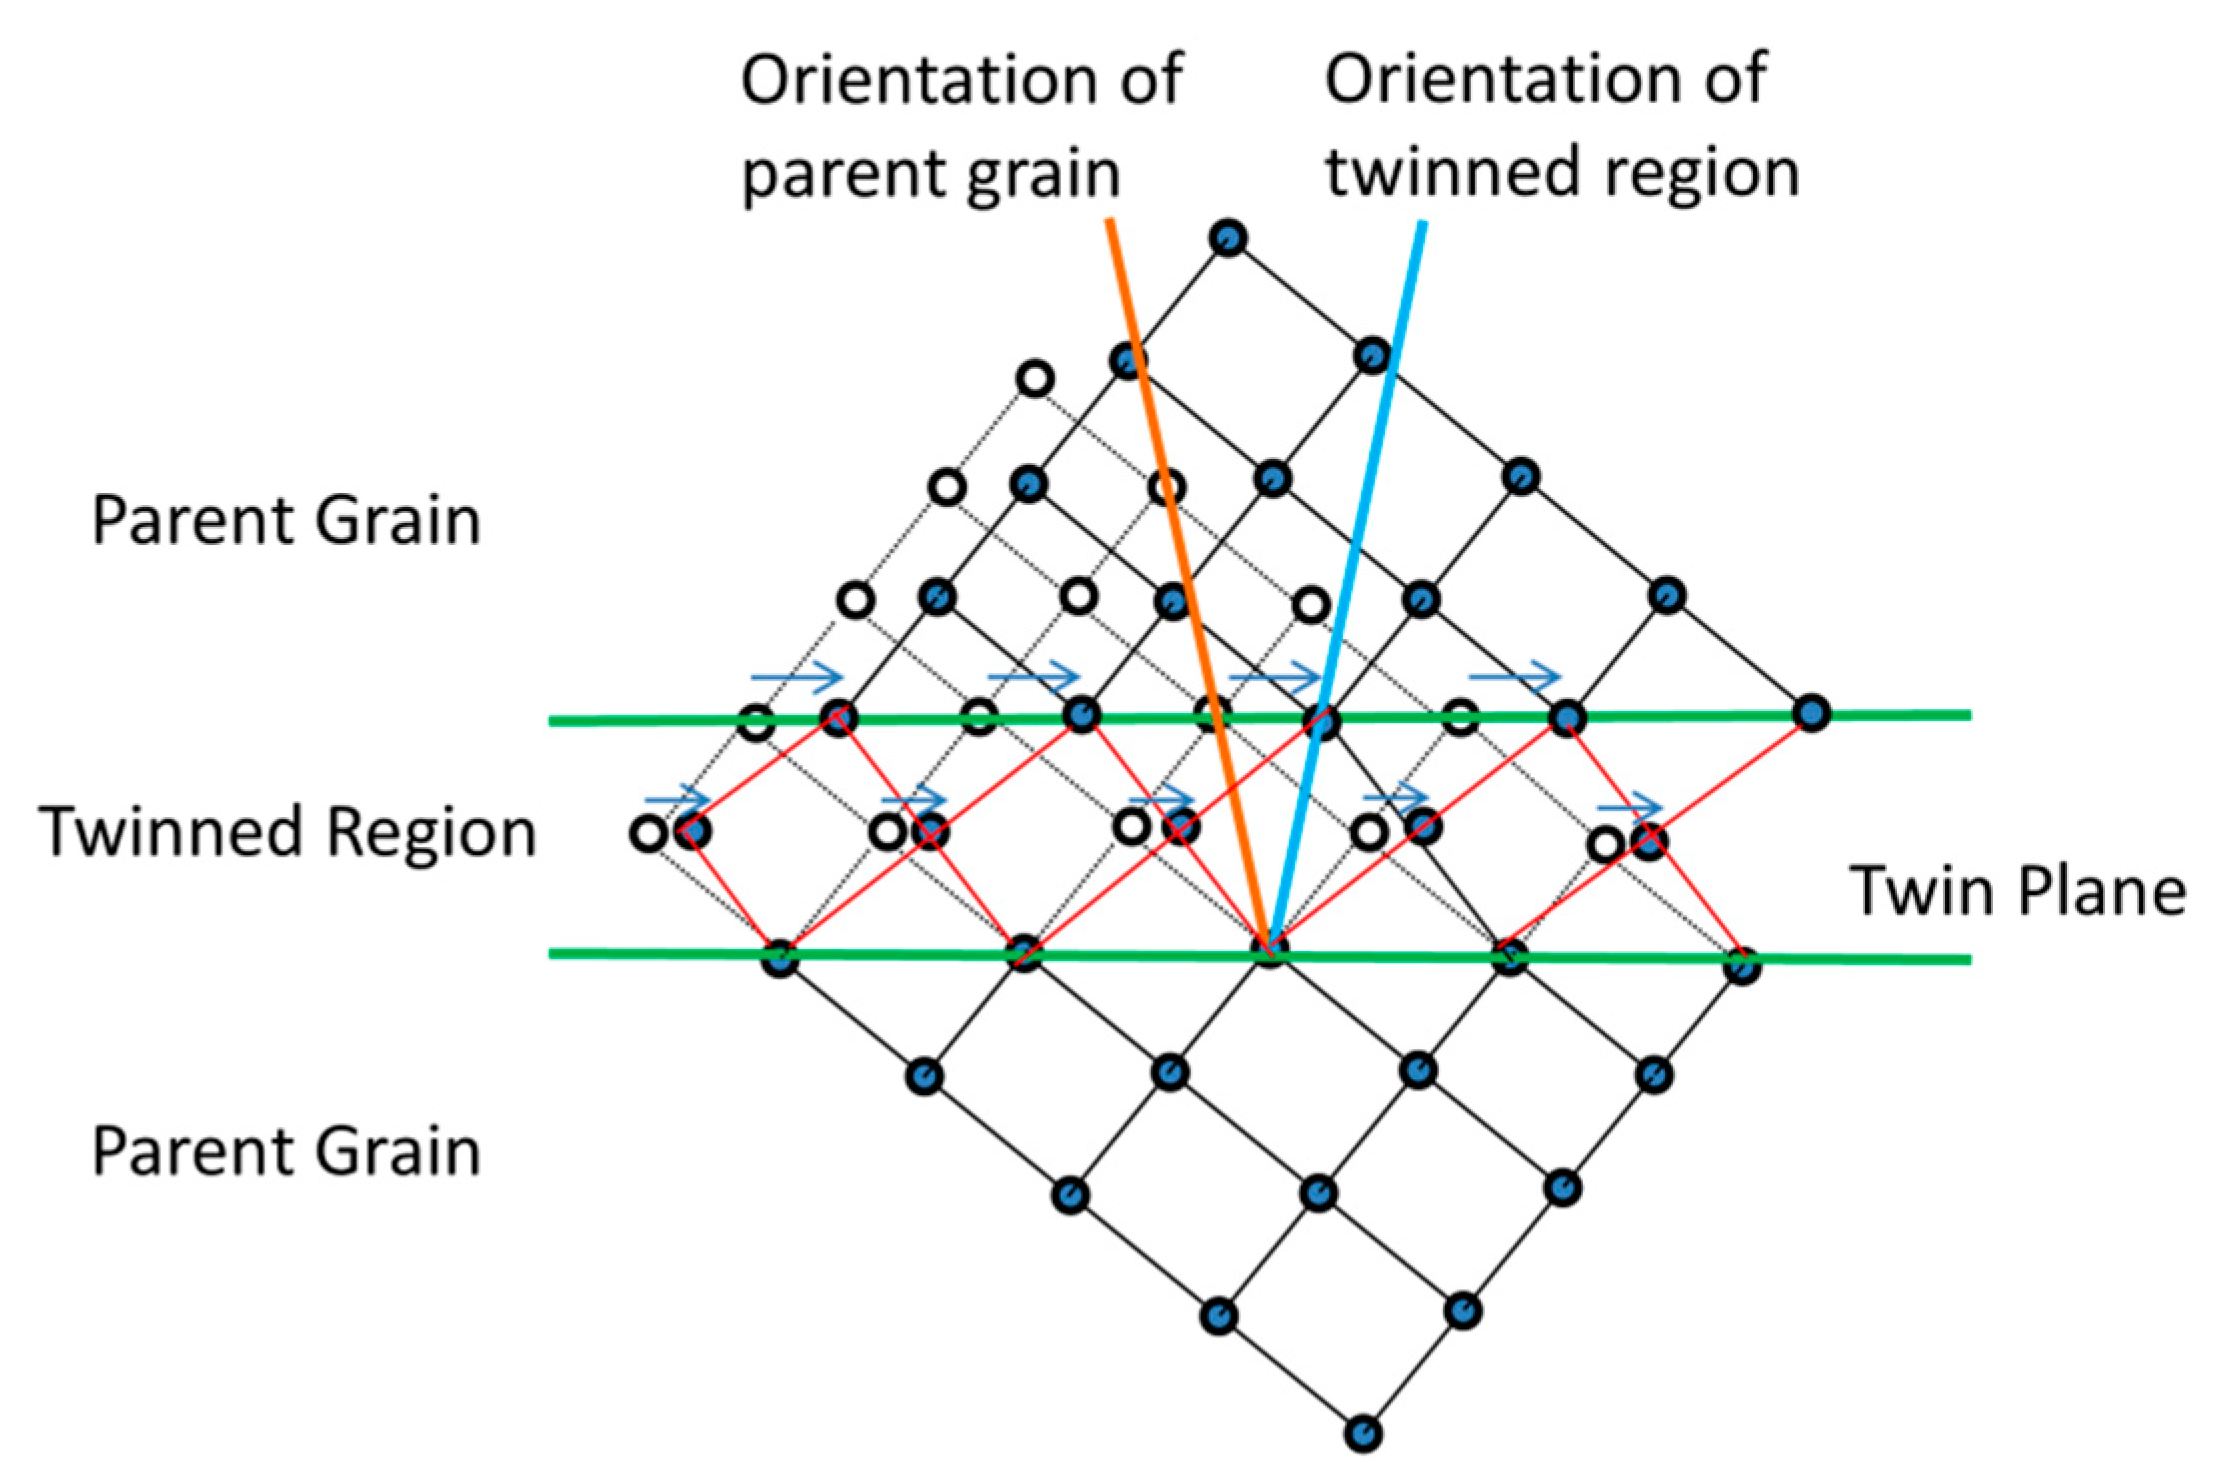
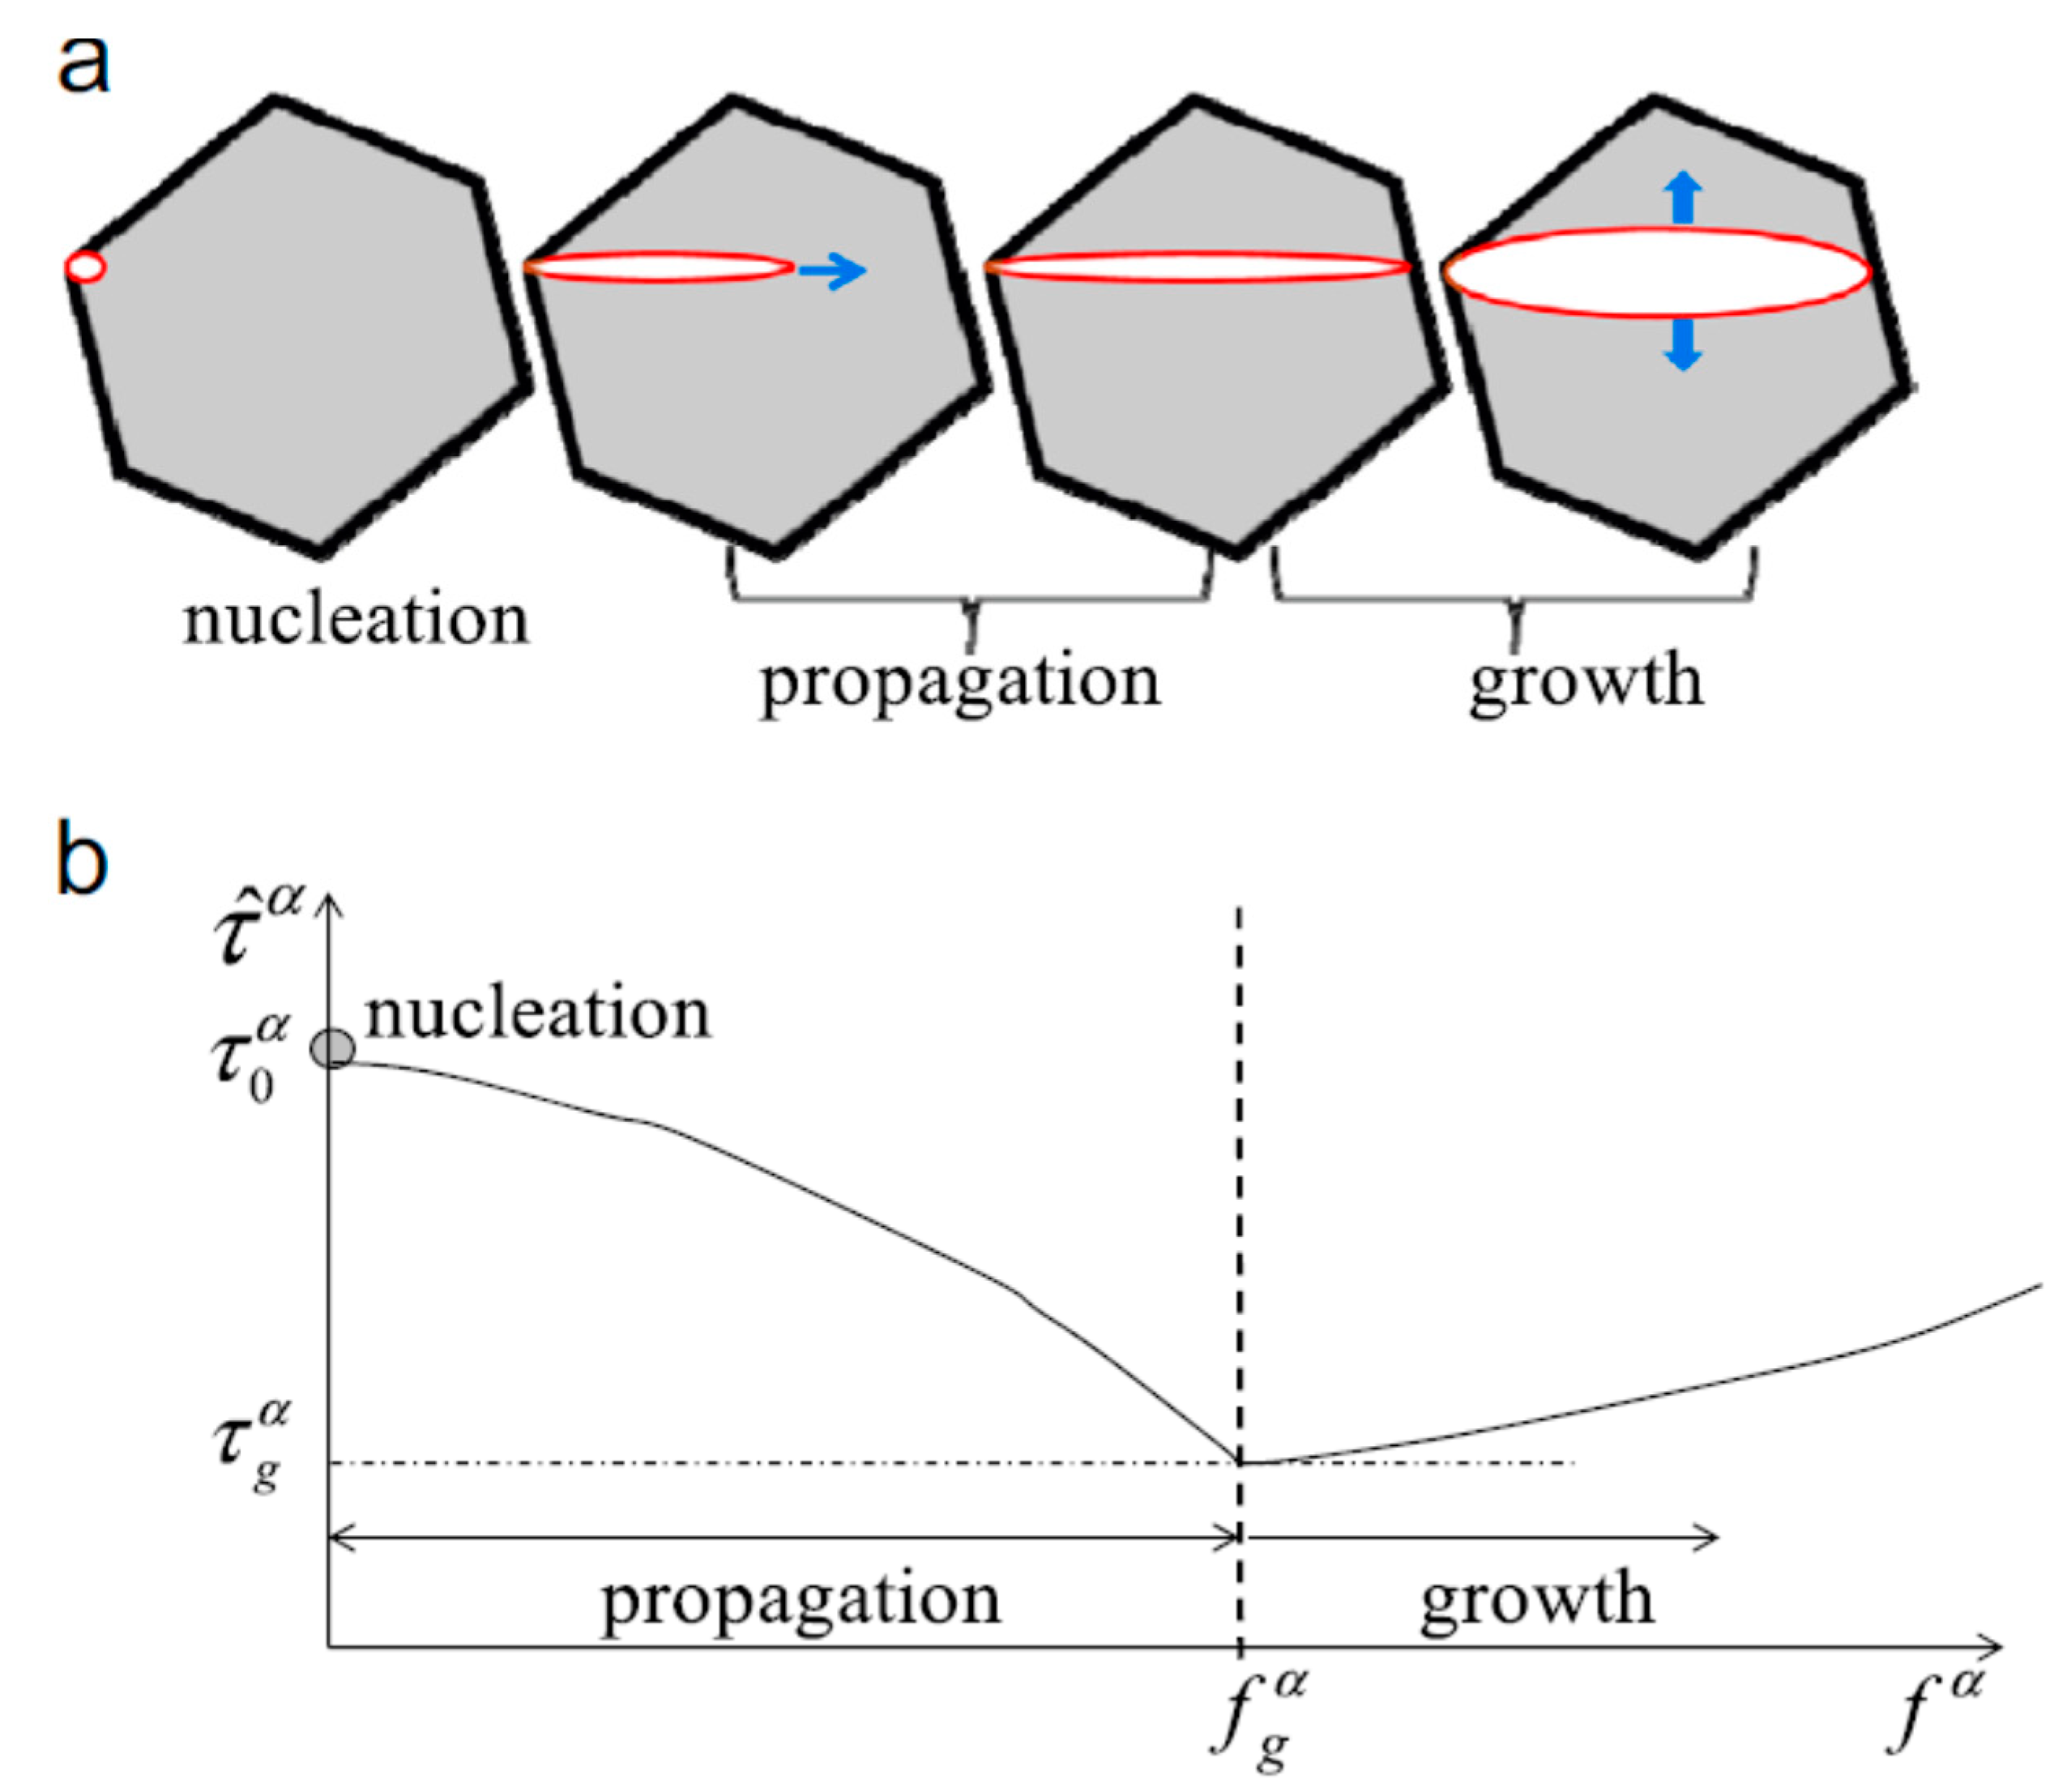
2.2. Twinning
2.3. Stress Relaxation
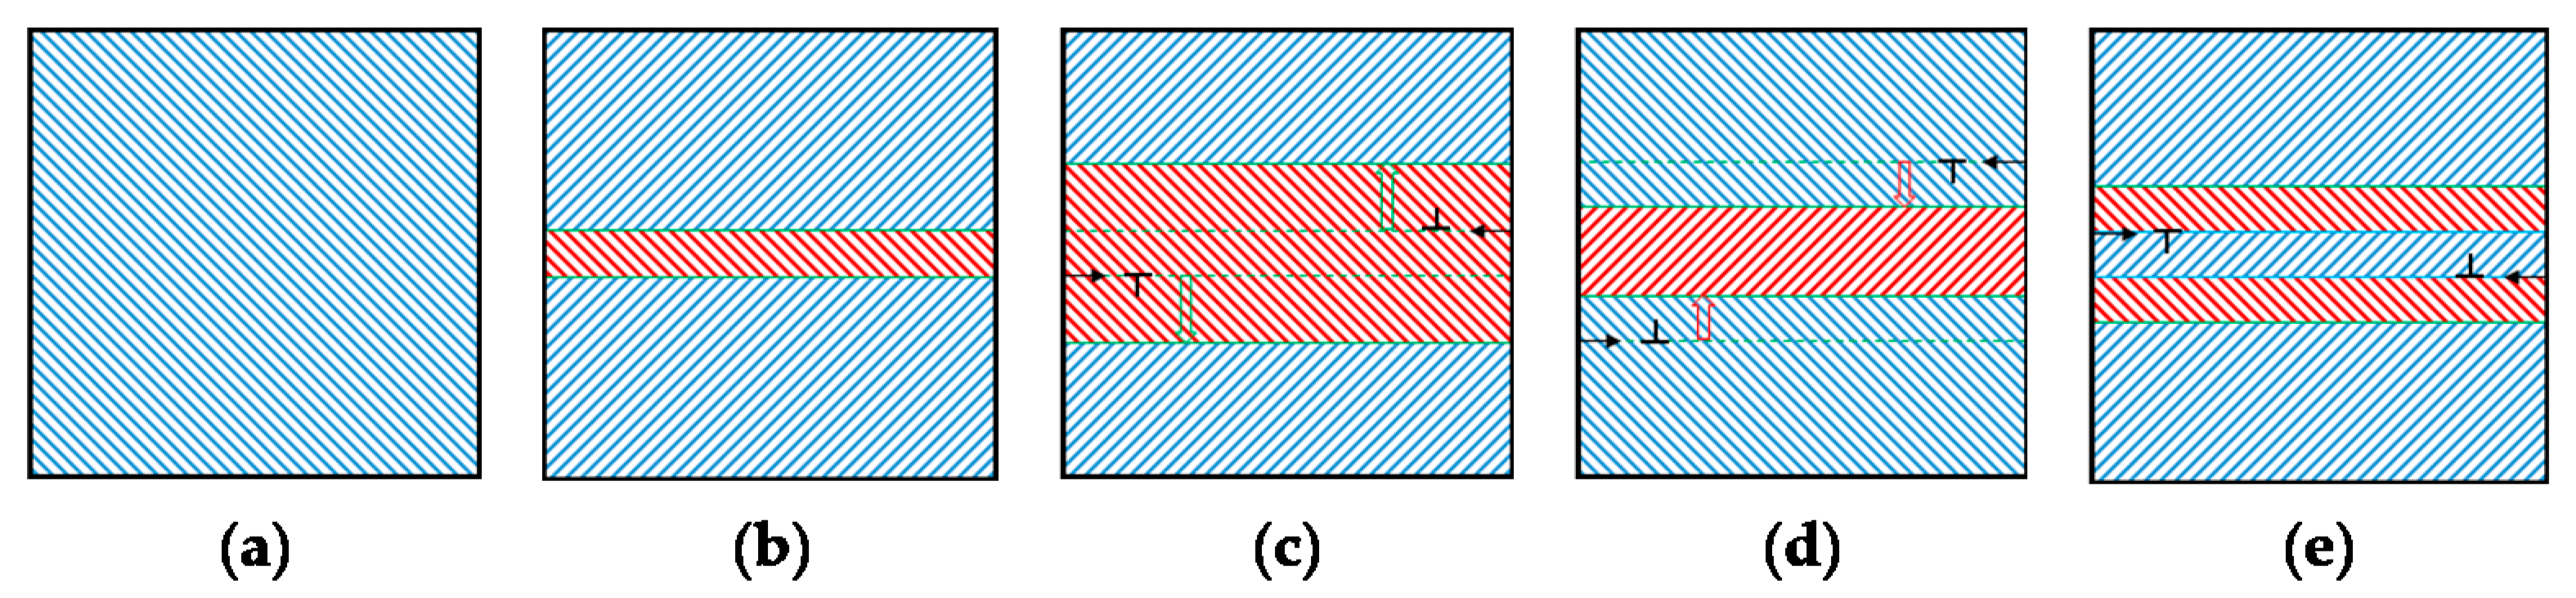
2.4. Detwinning
- Operations A: Twin nucleation and growth due to parent grain reduction.
- Operations B: Twin growth due to the twinned child propagation.
- Operations C: Twin shrinkage due to the parent propagation.
- Operations D: Detwinning in the twinned child.
3. In-situ Experiments
3.1. In-Situ DIC Experiments
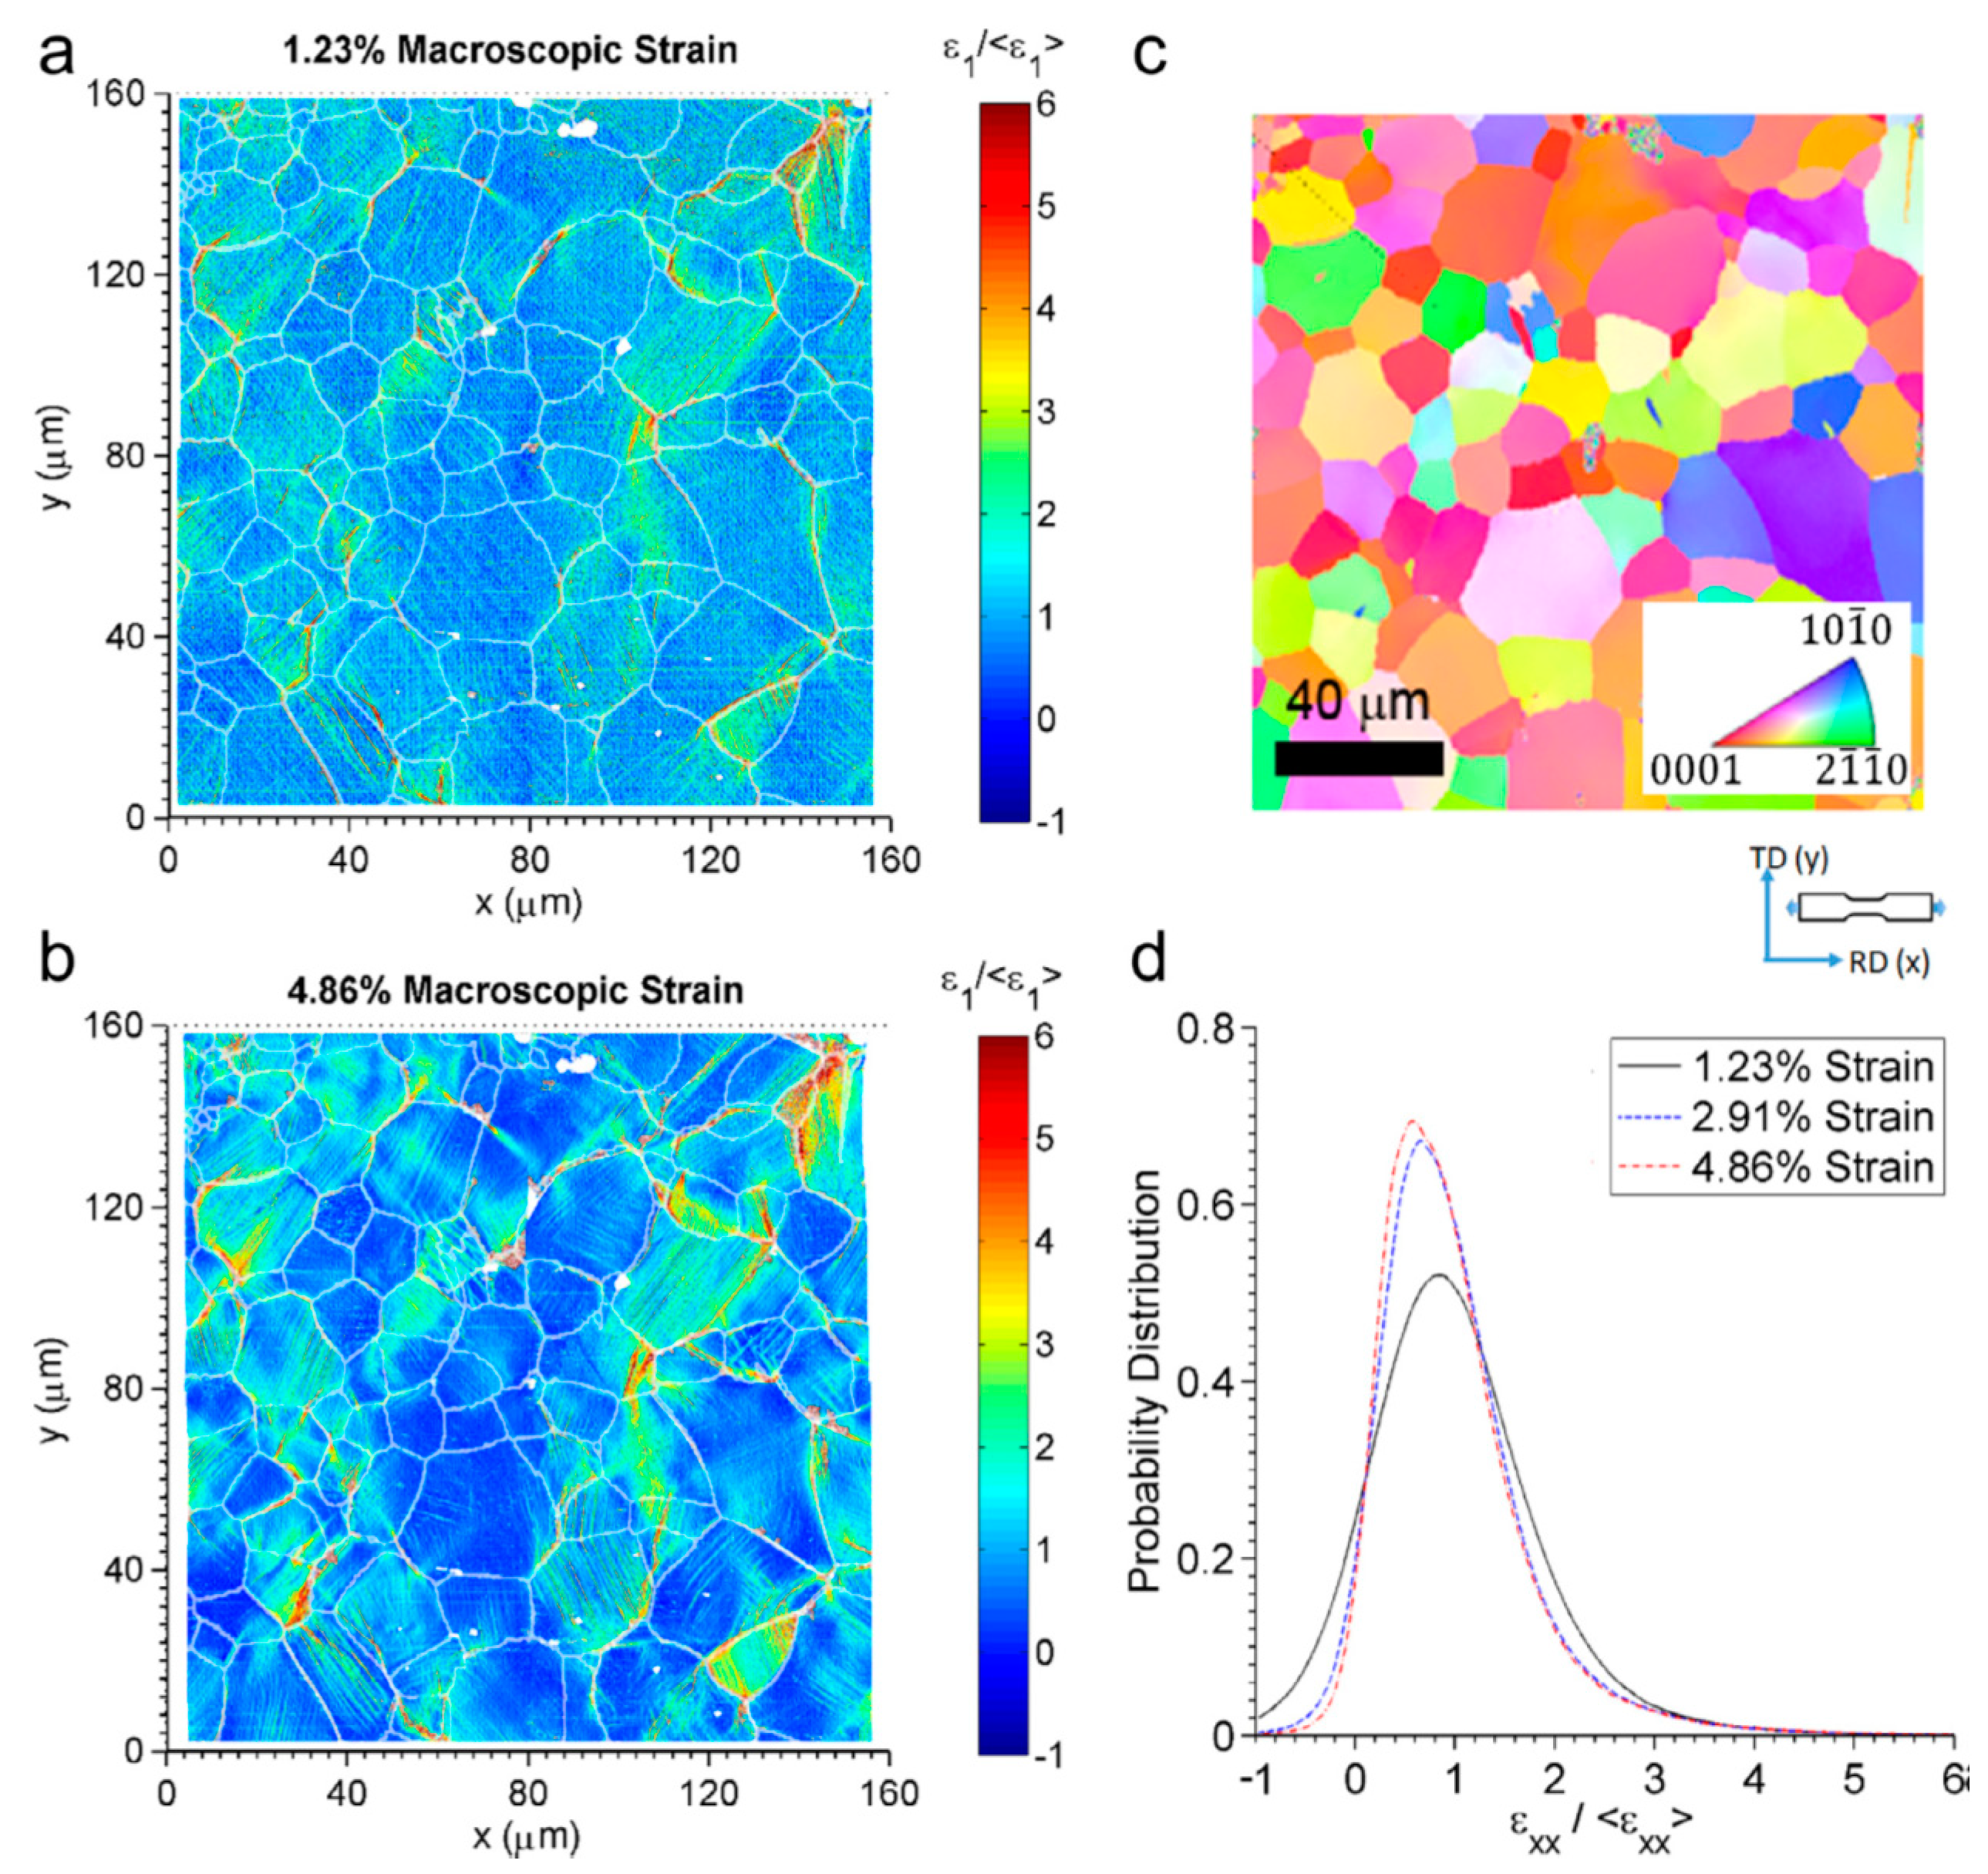
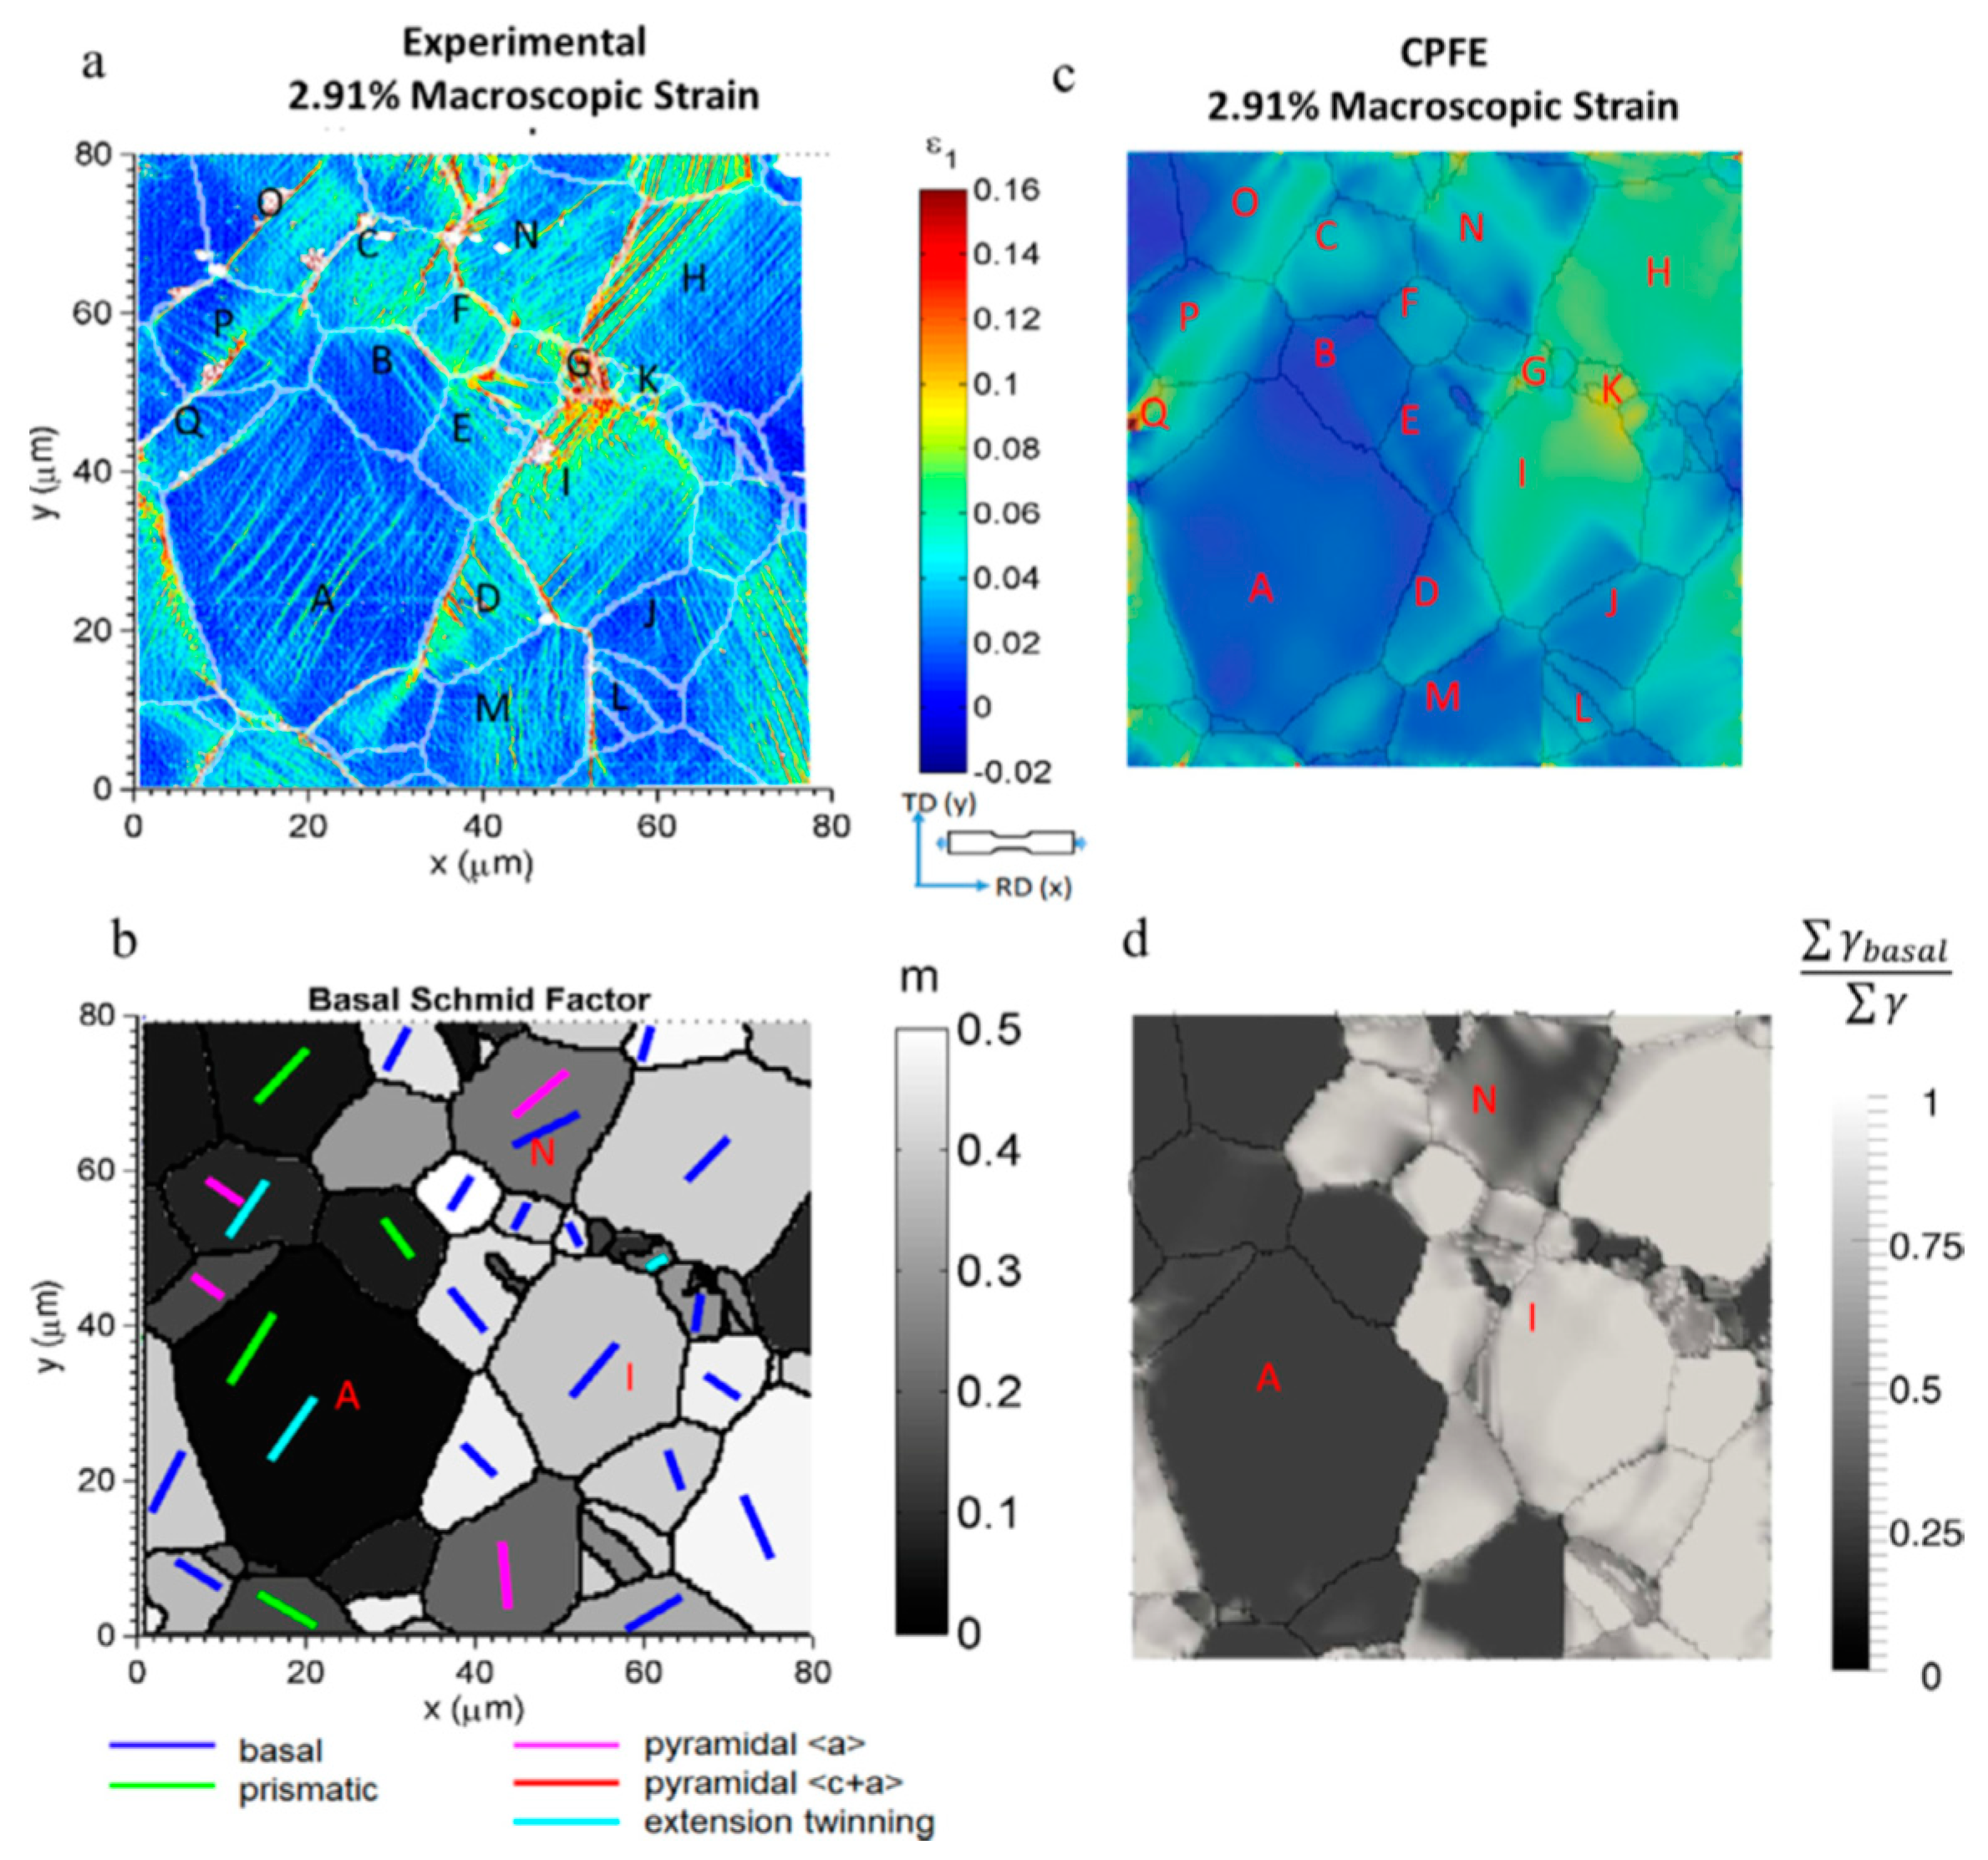
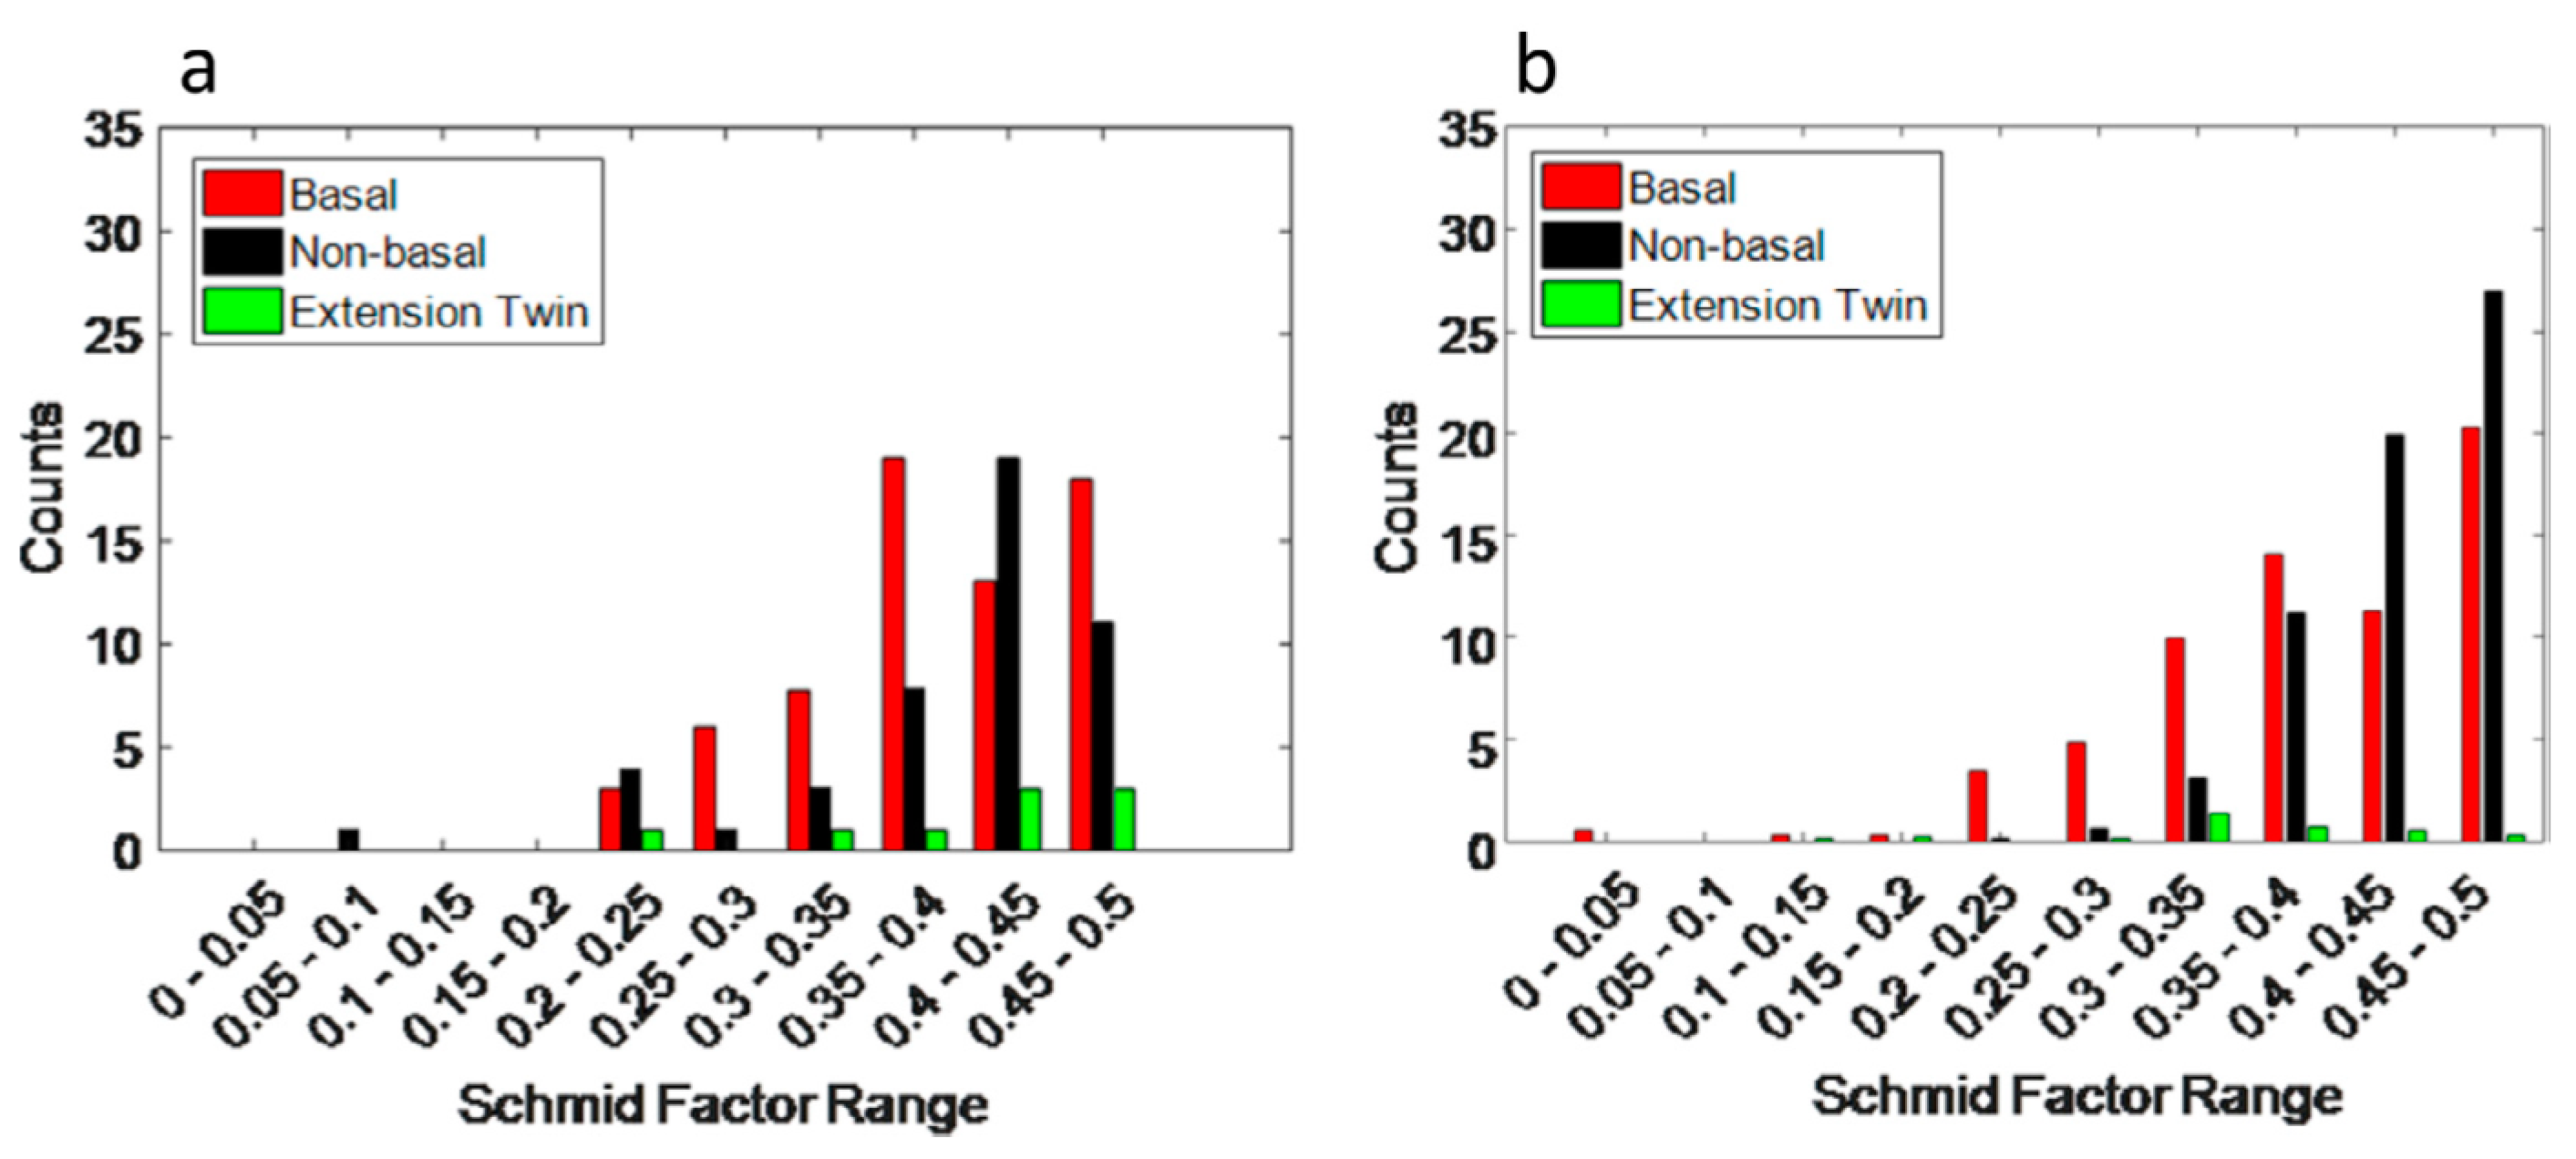
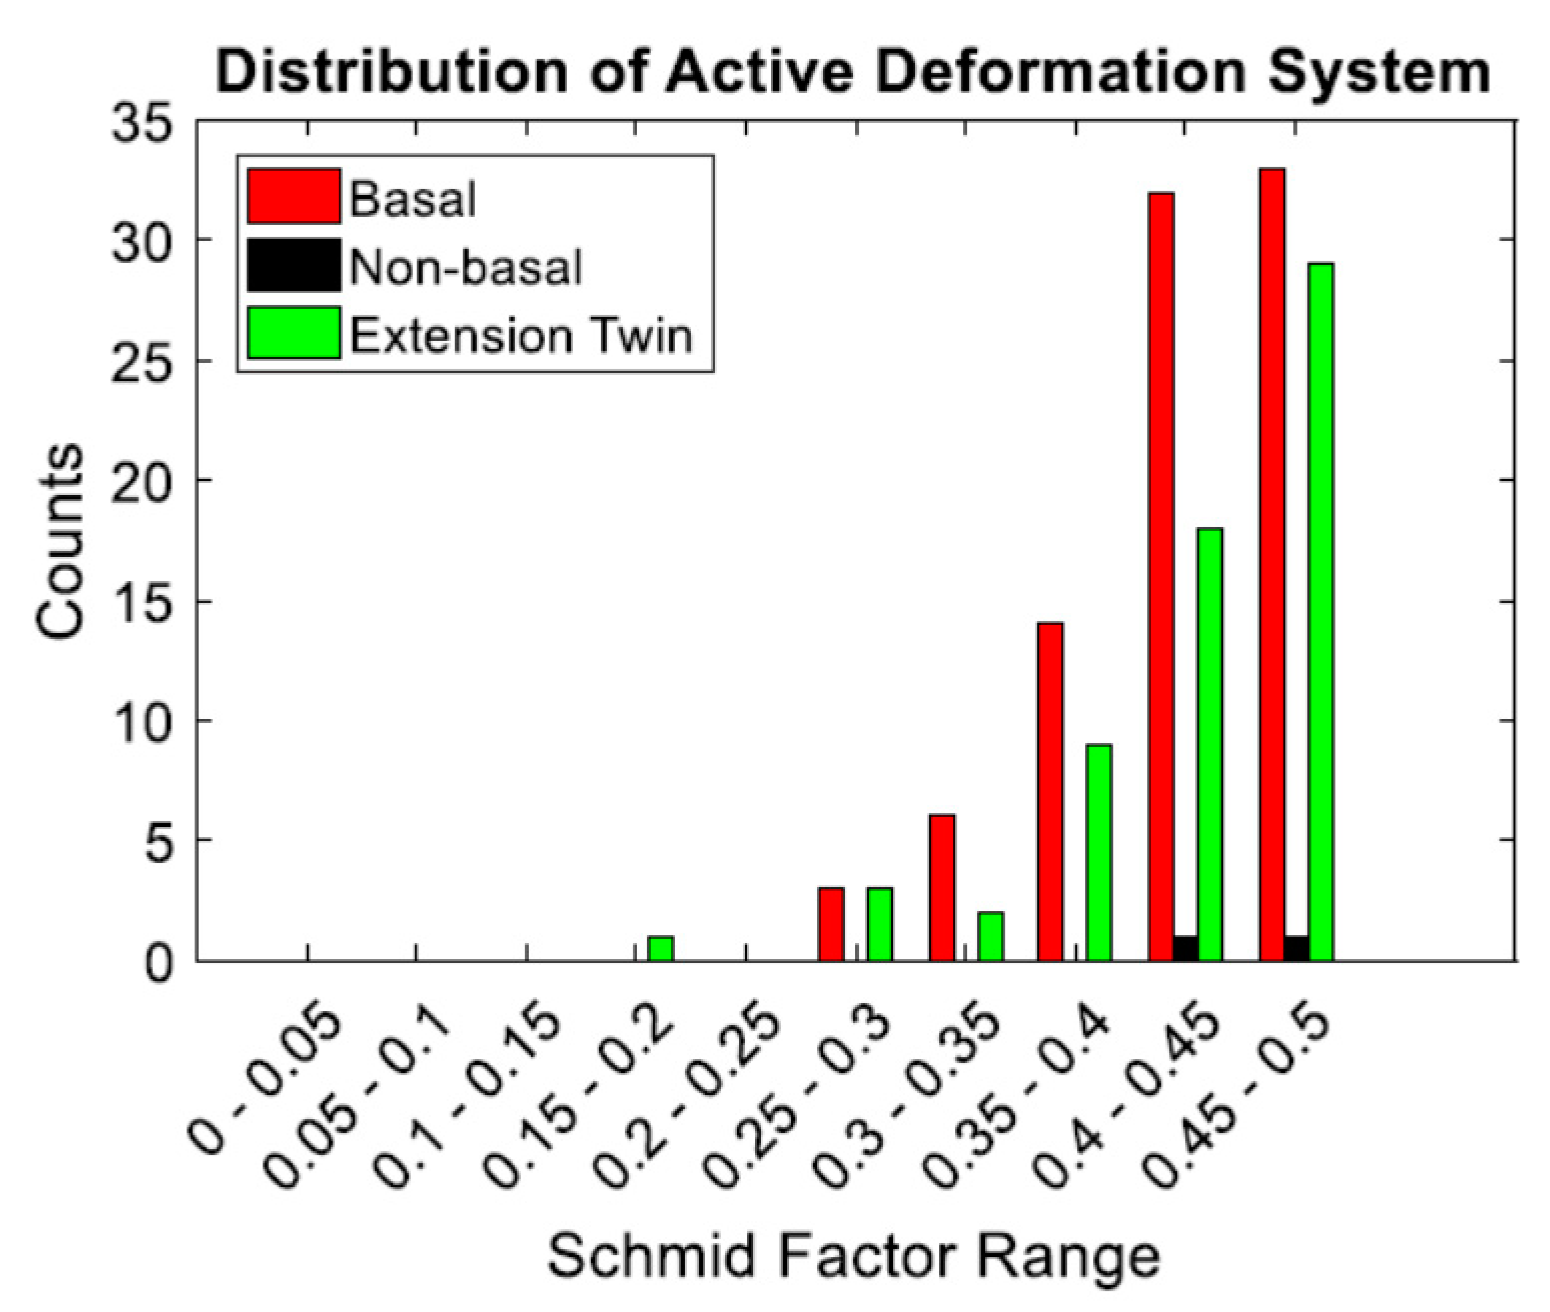
3.1.1. Microscale Deformation Mechanisms
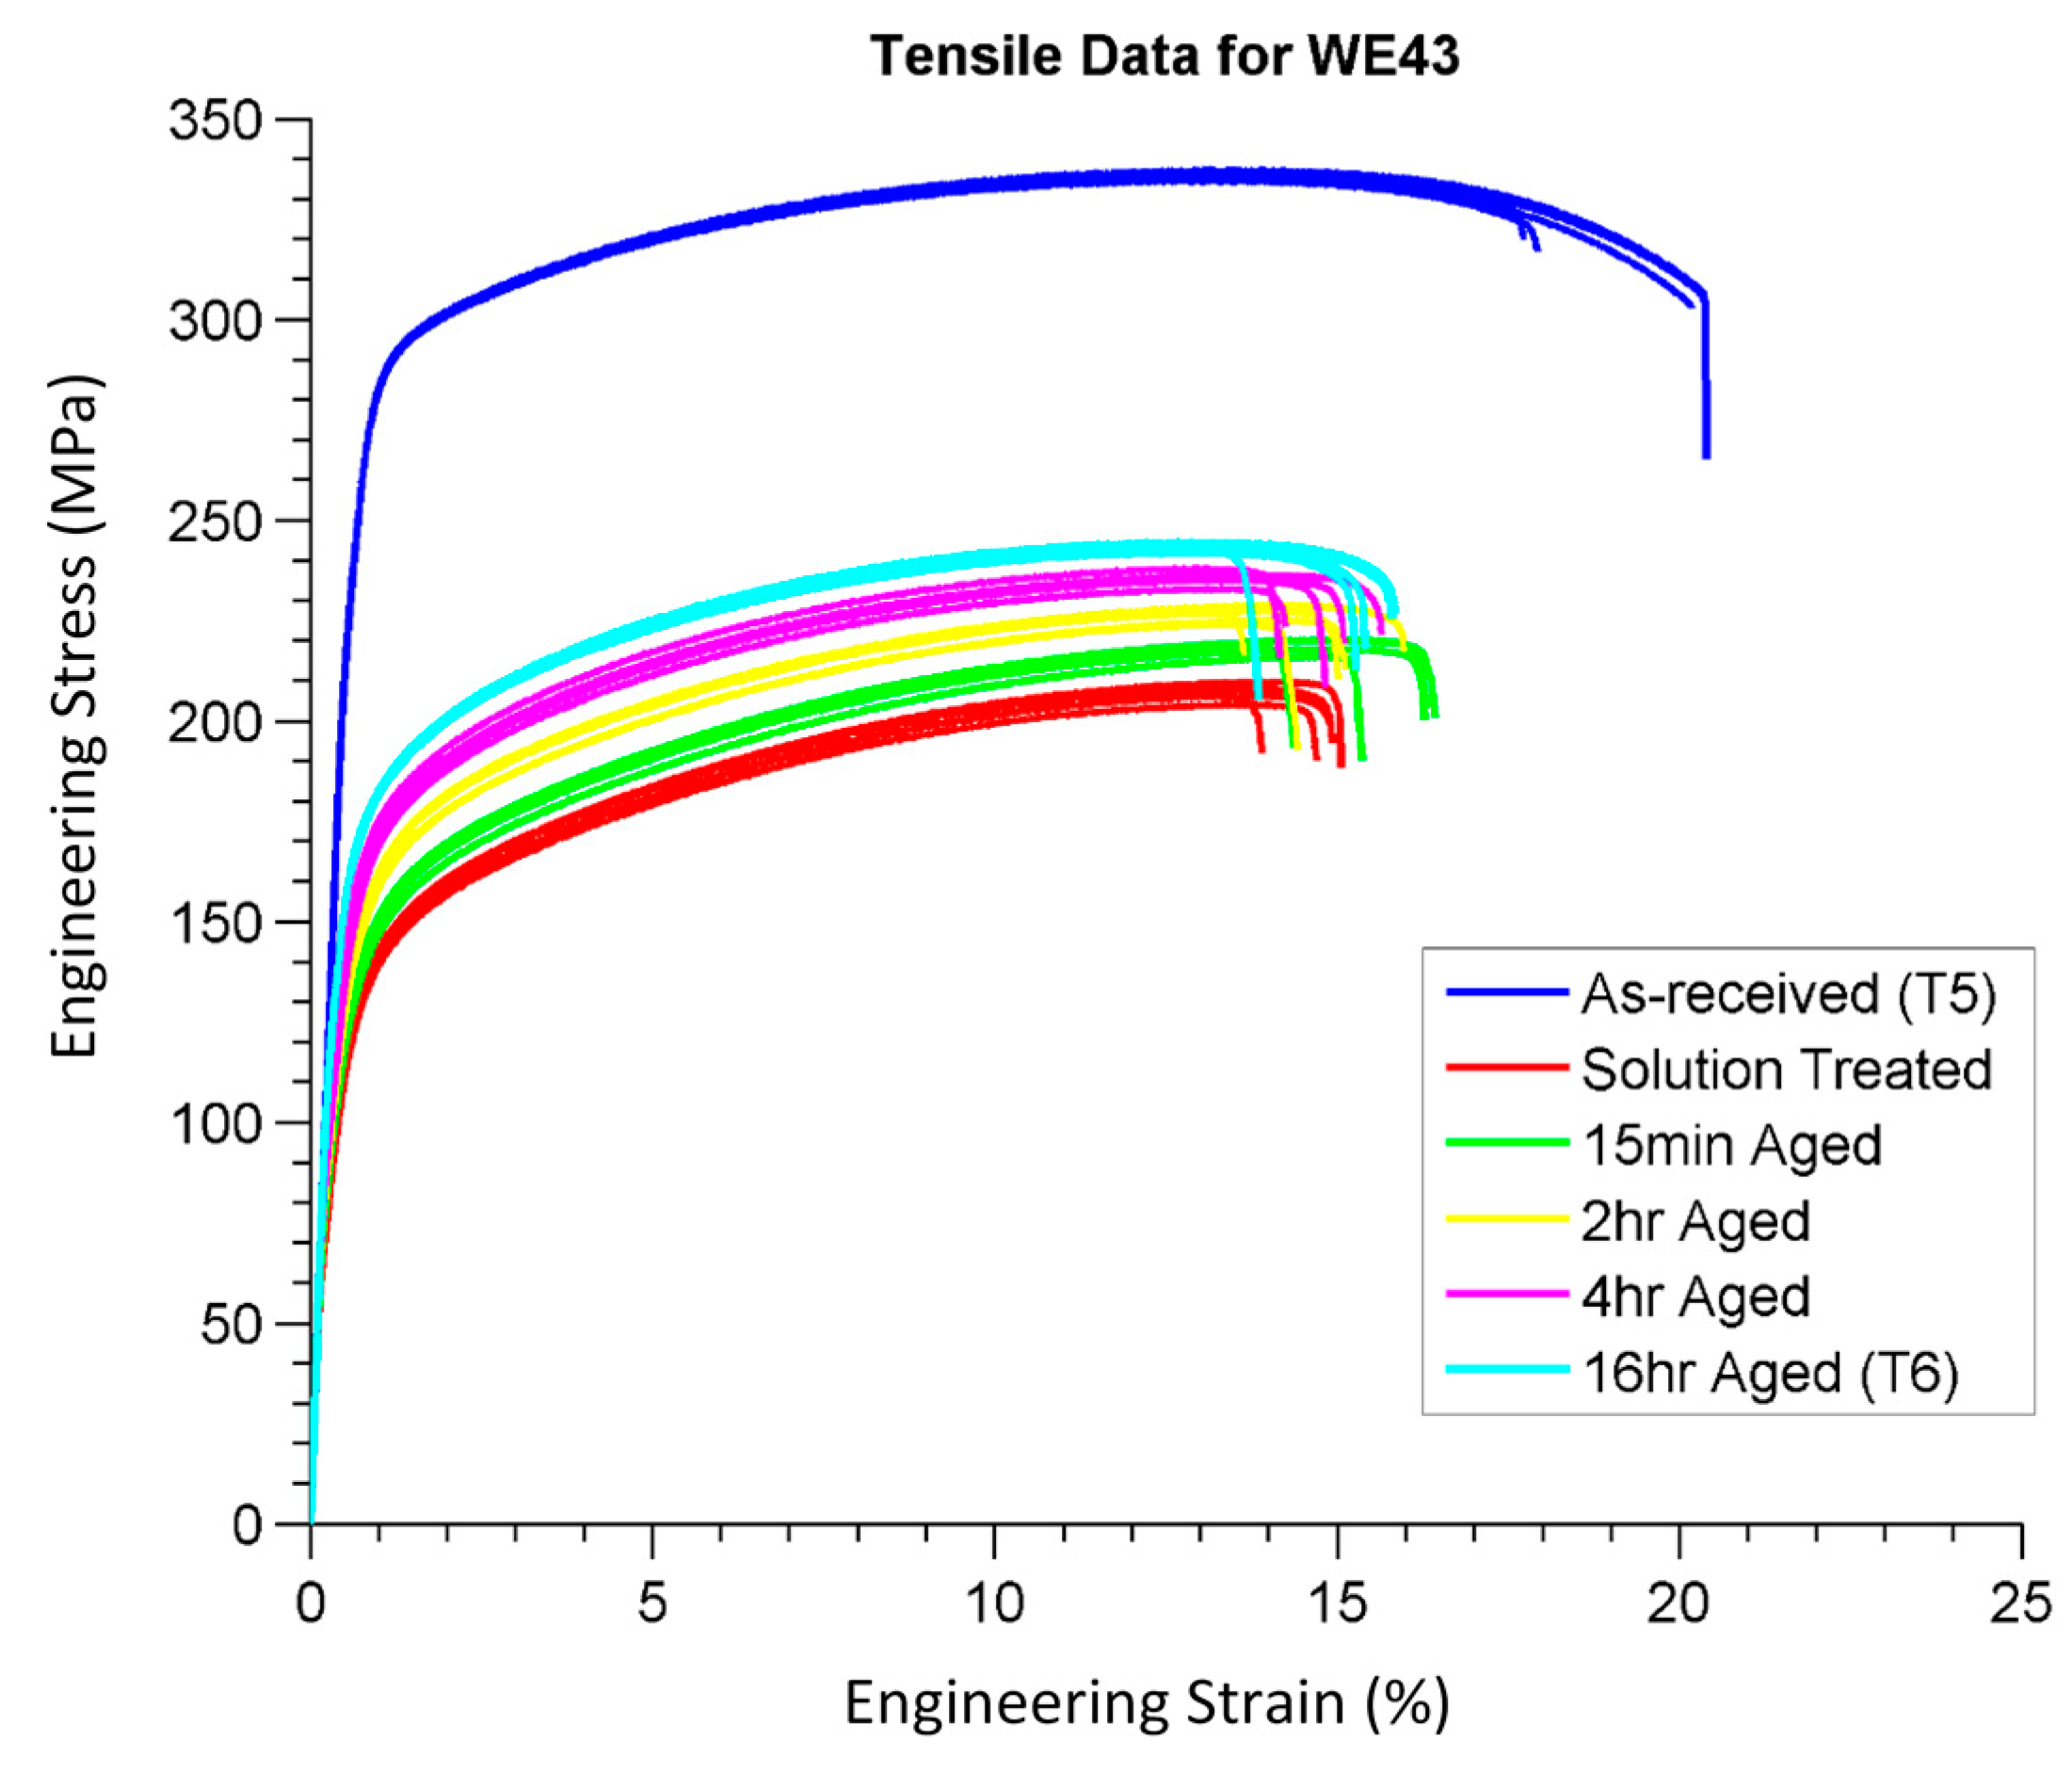
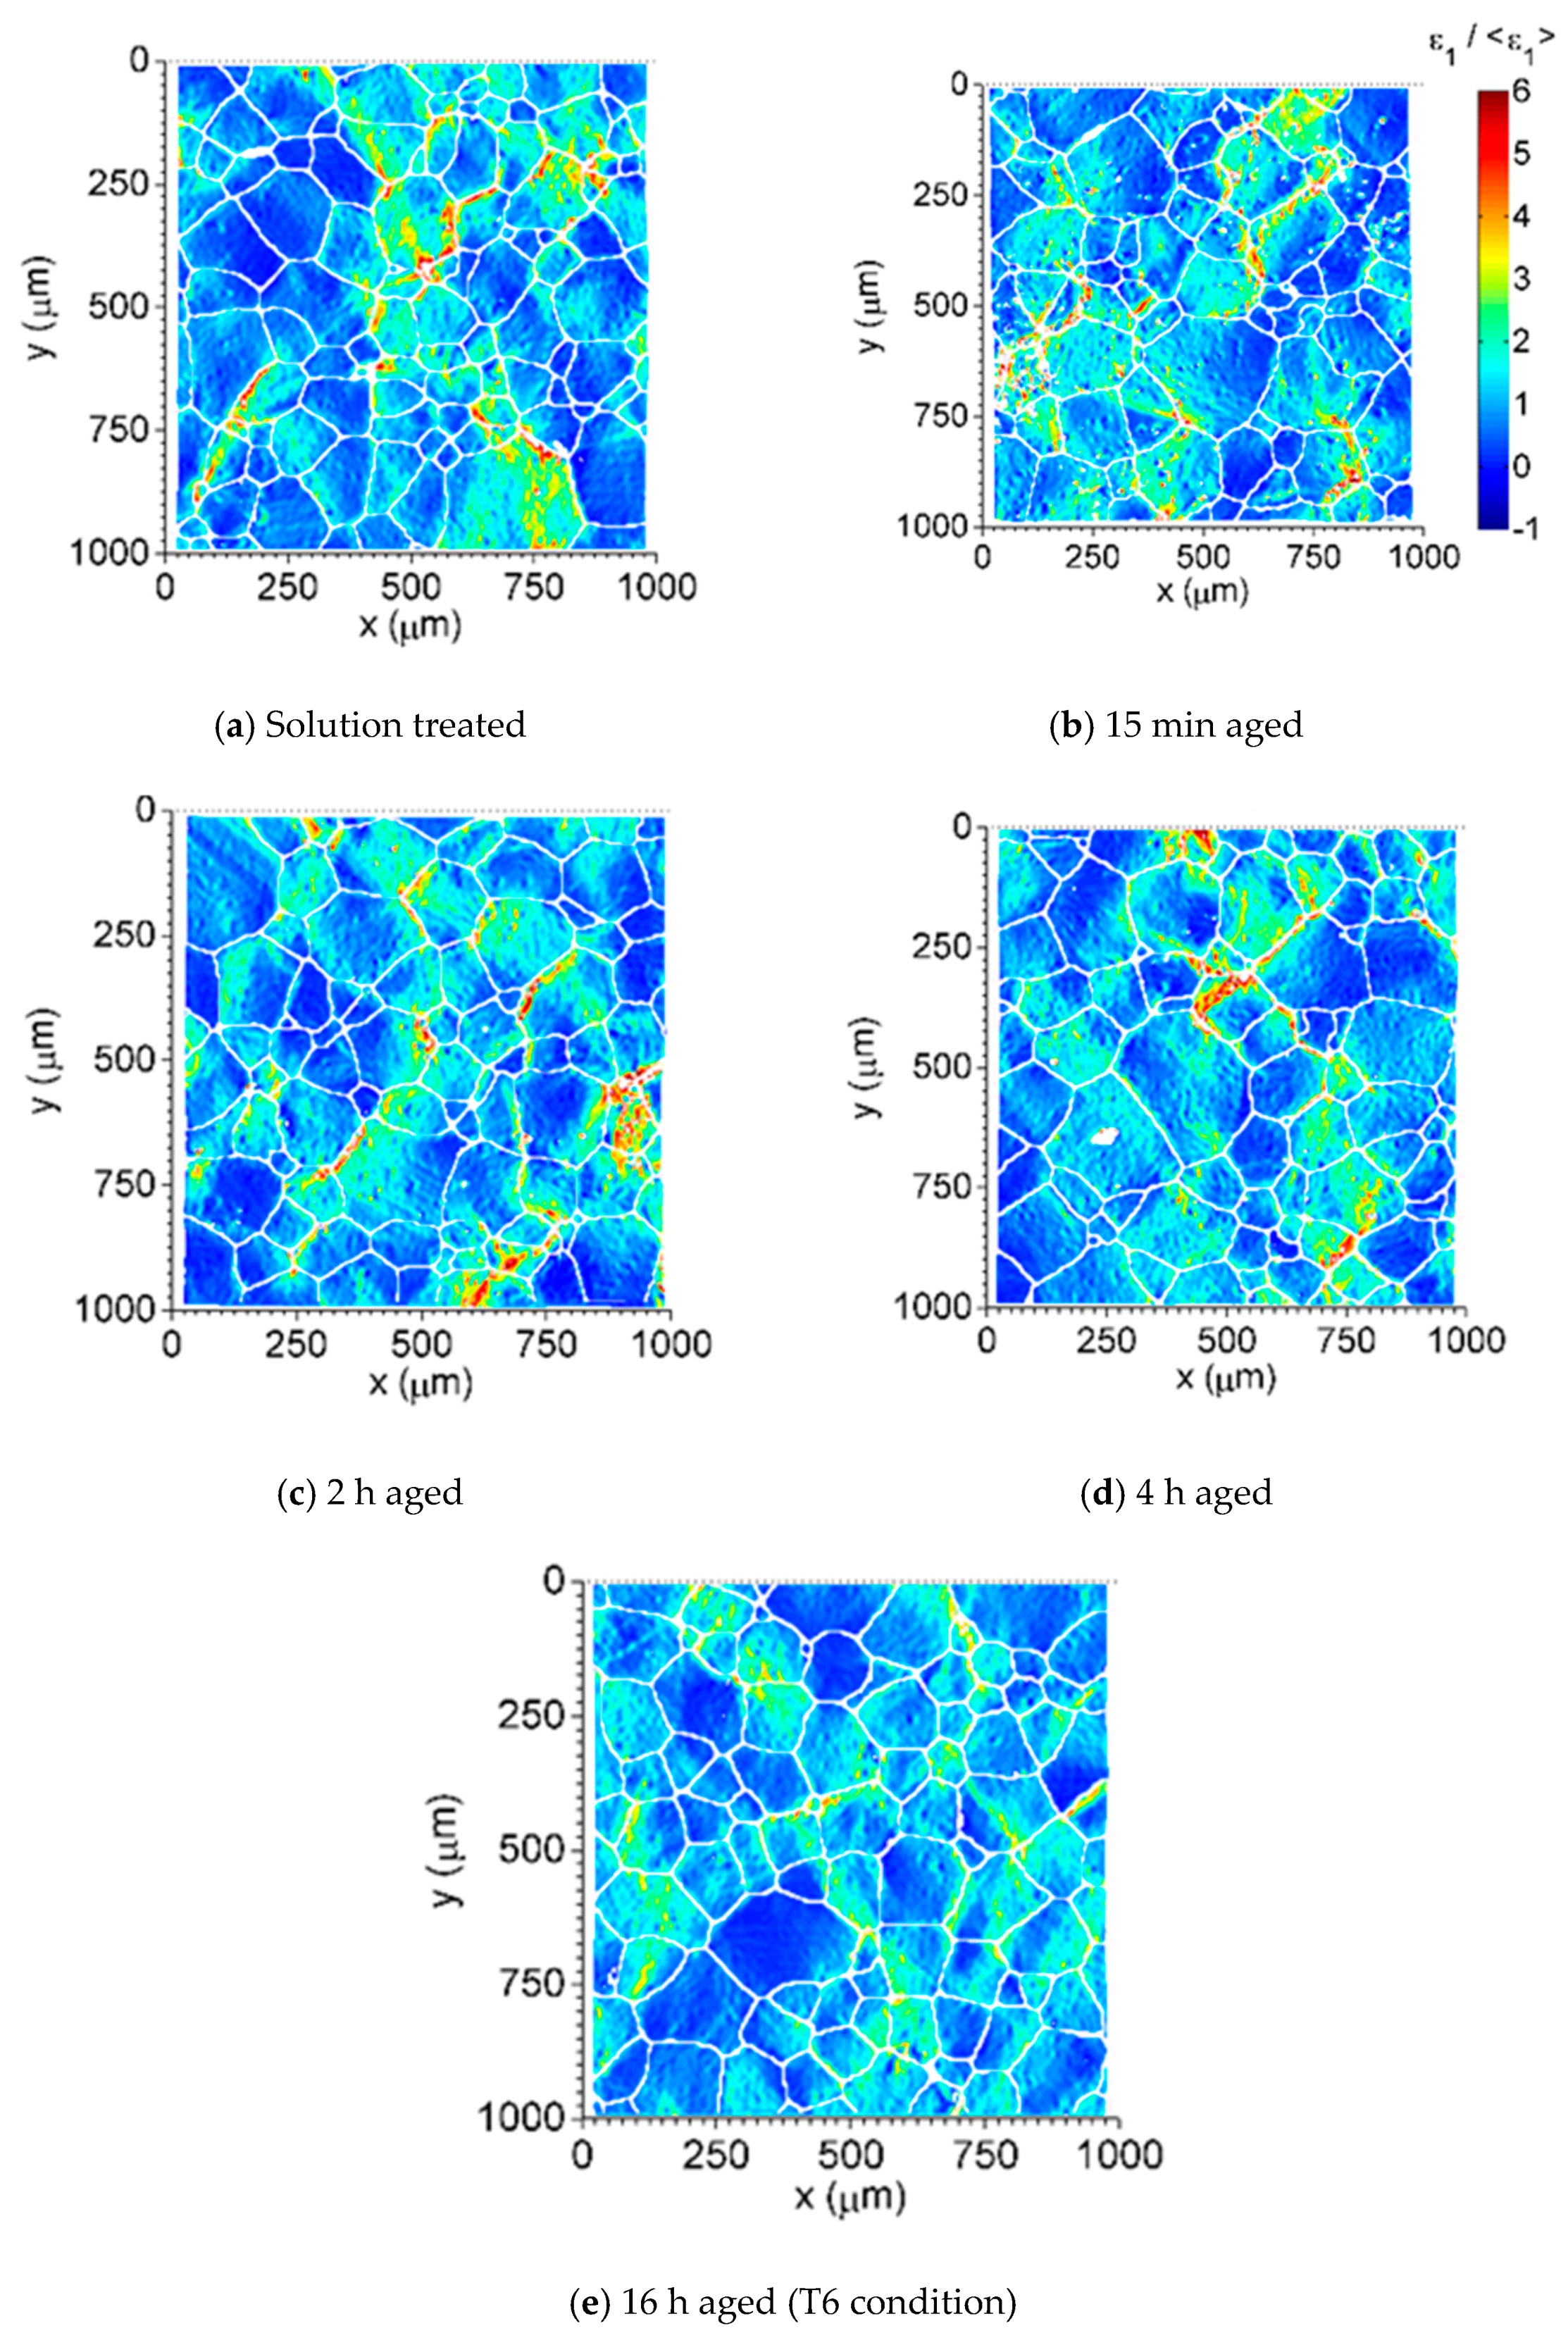
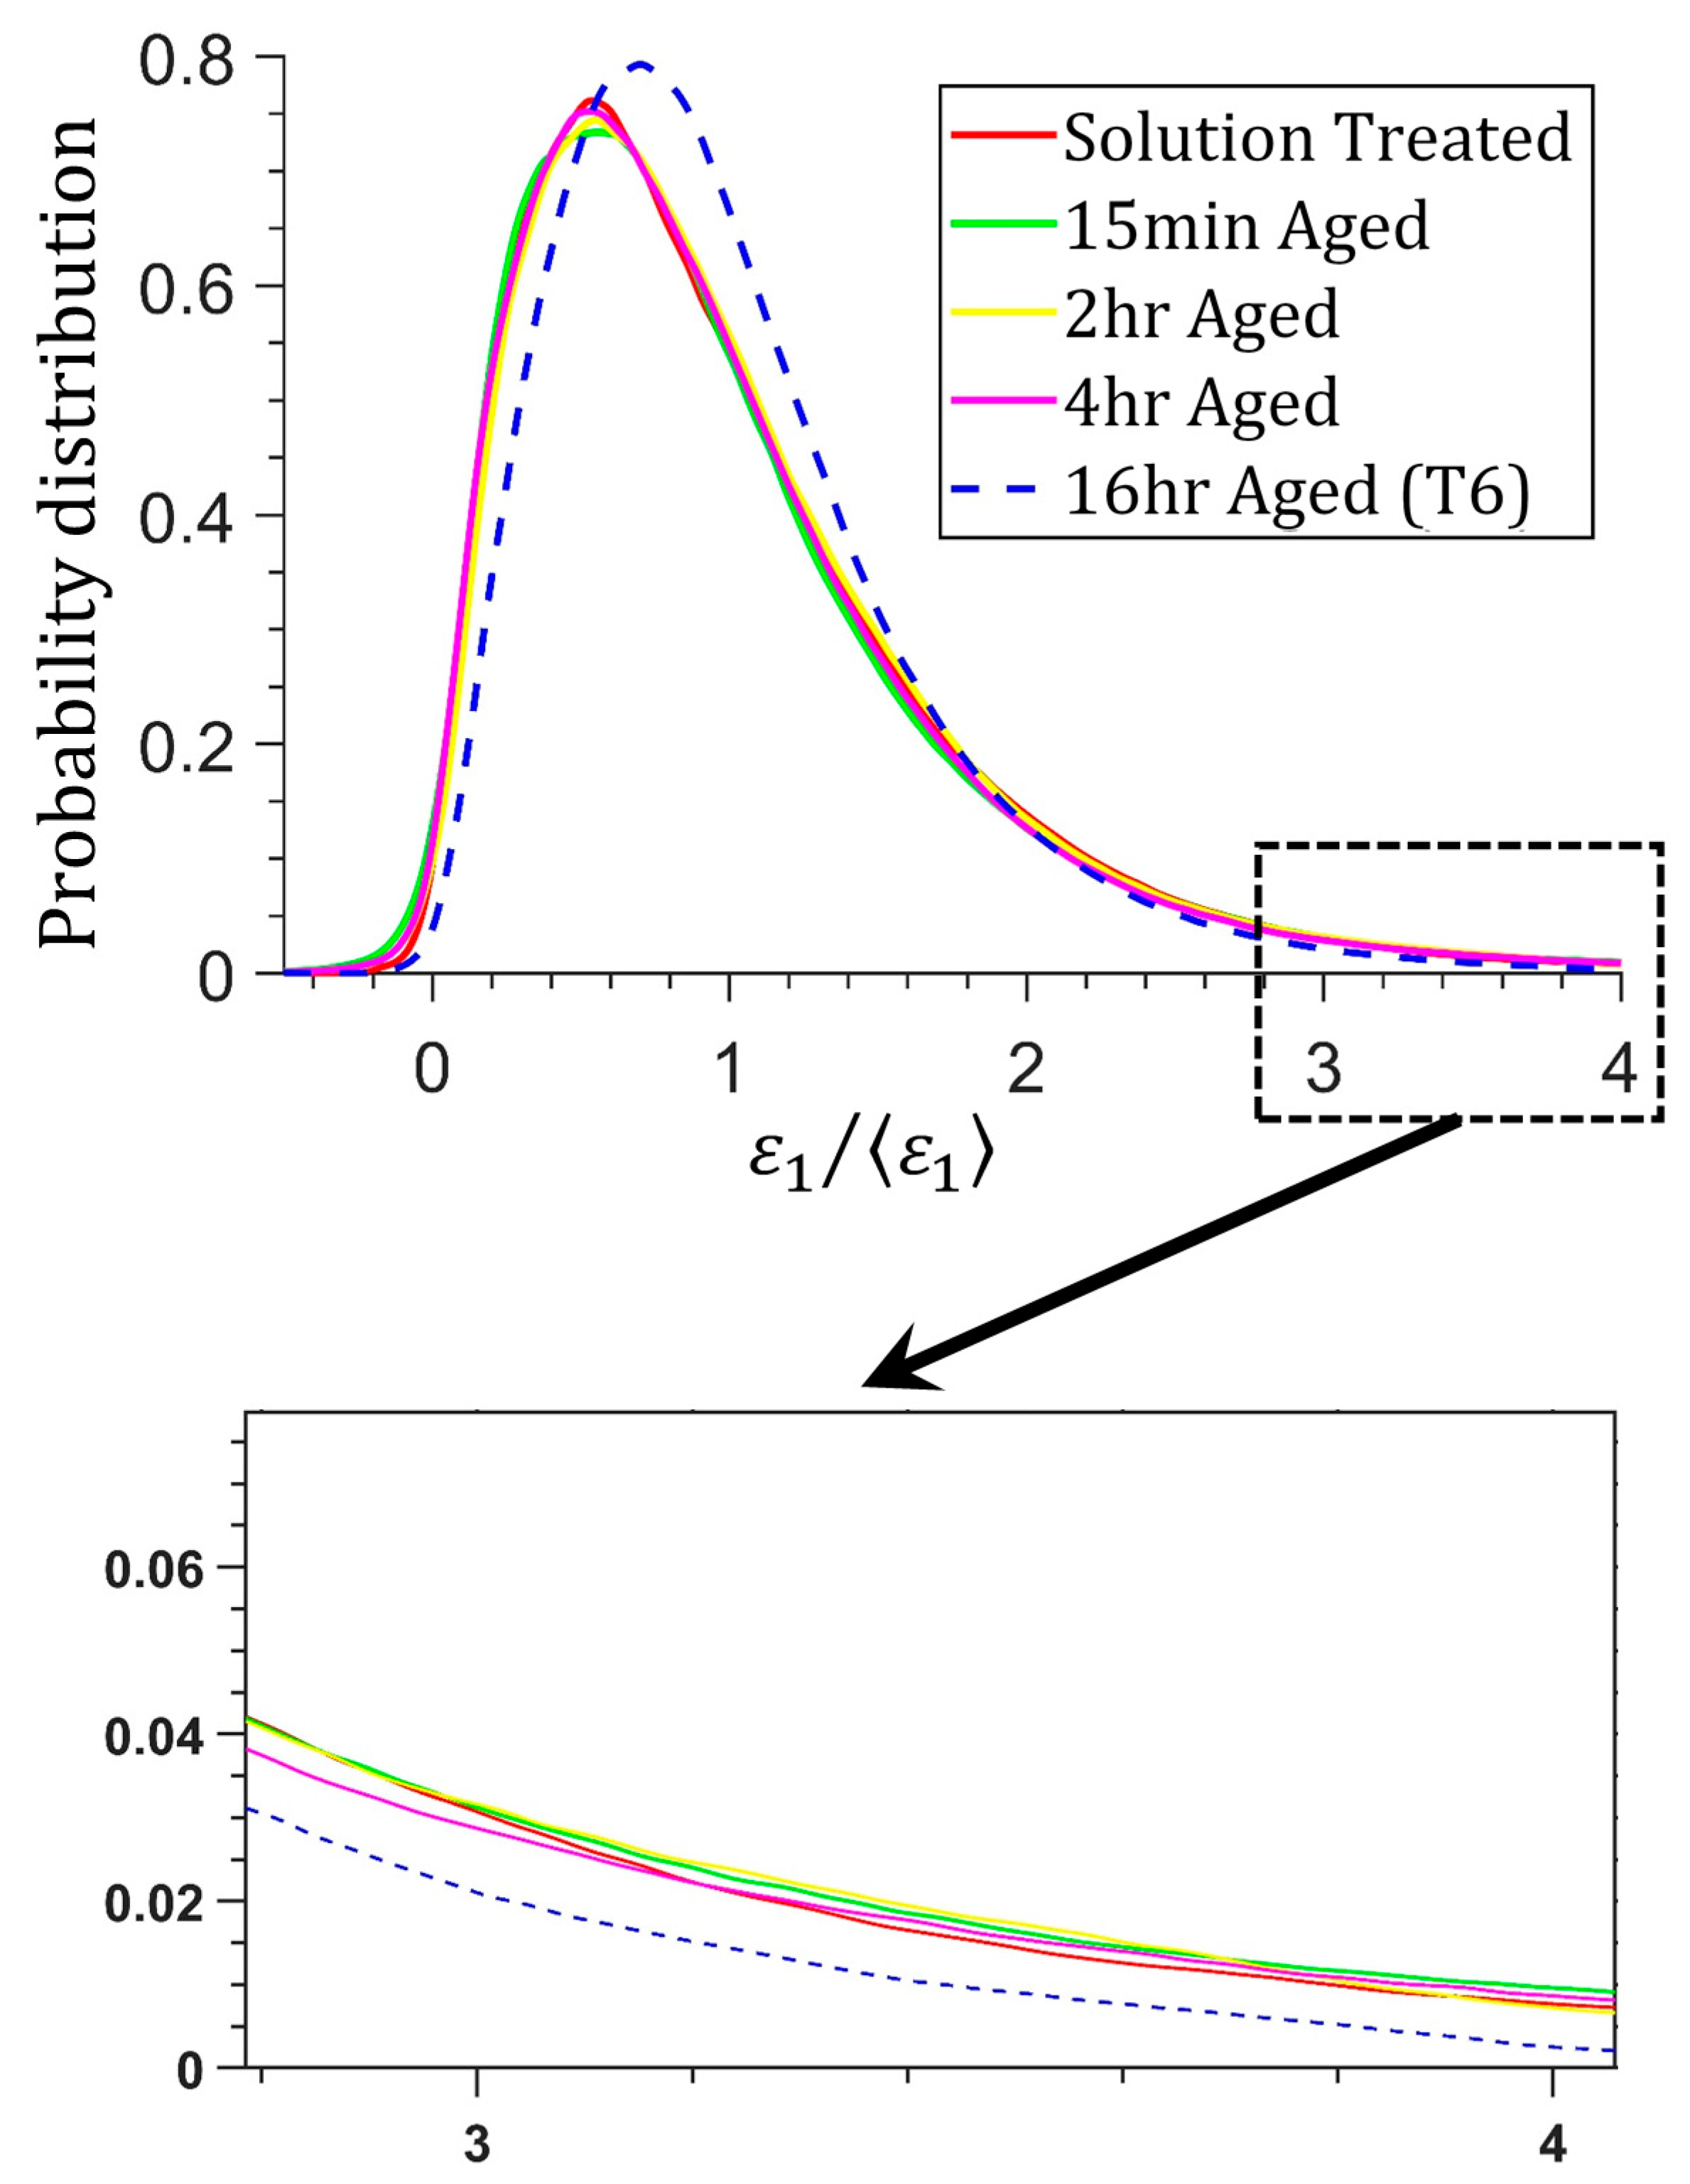
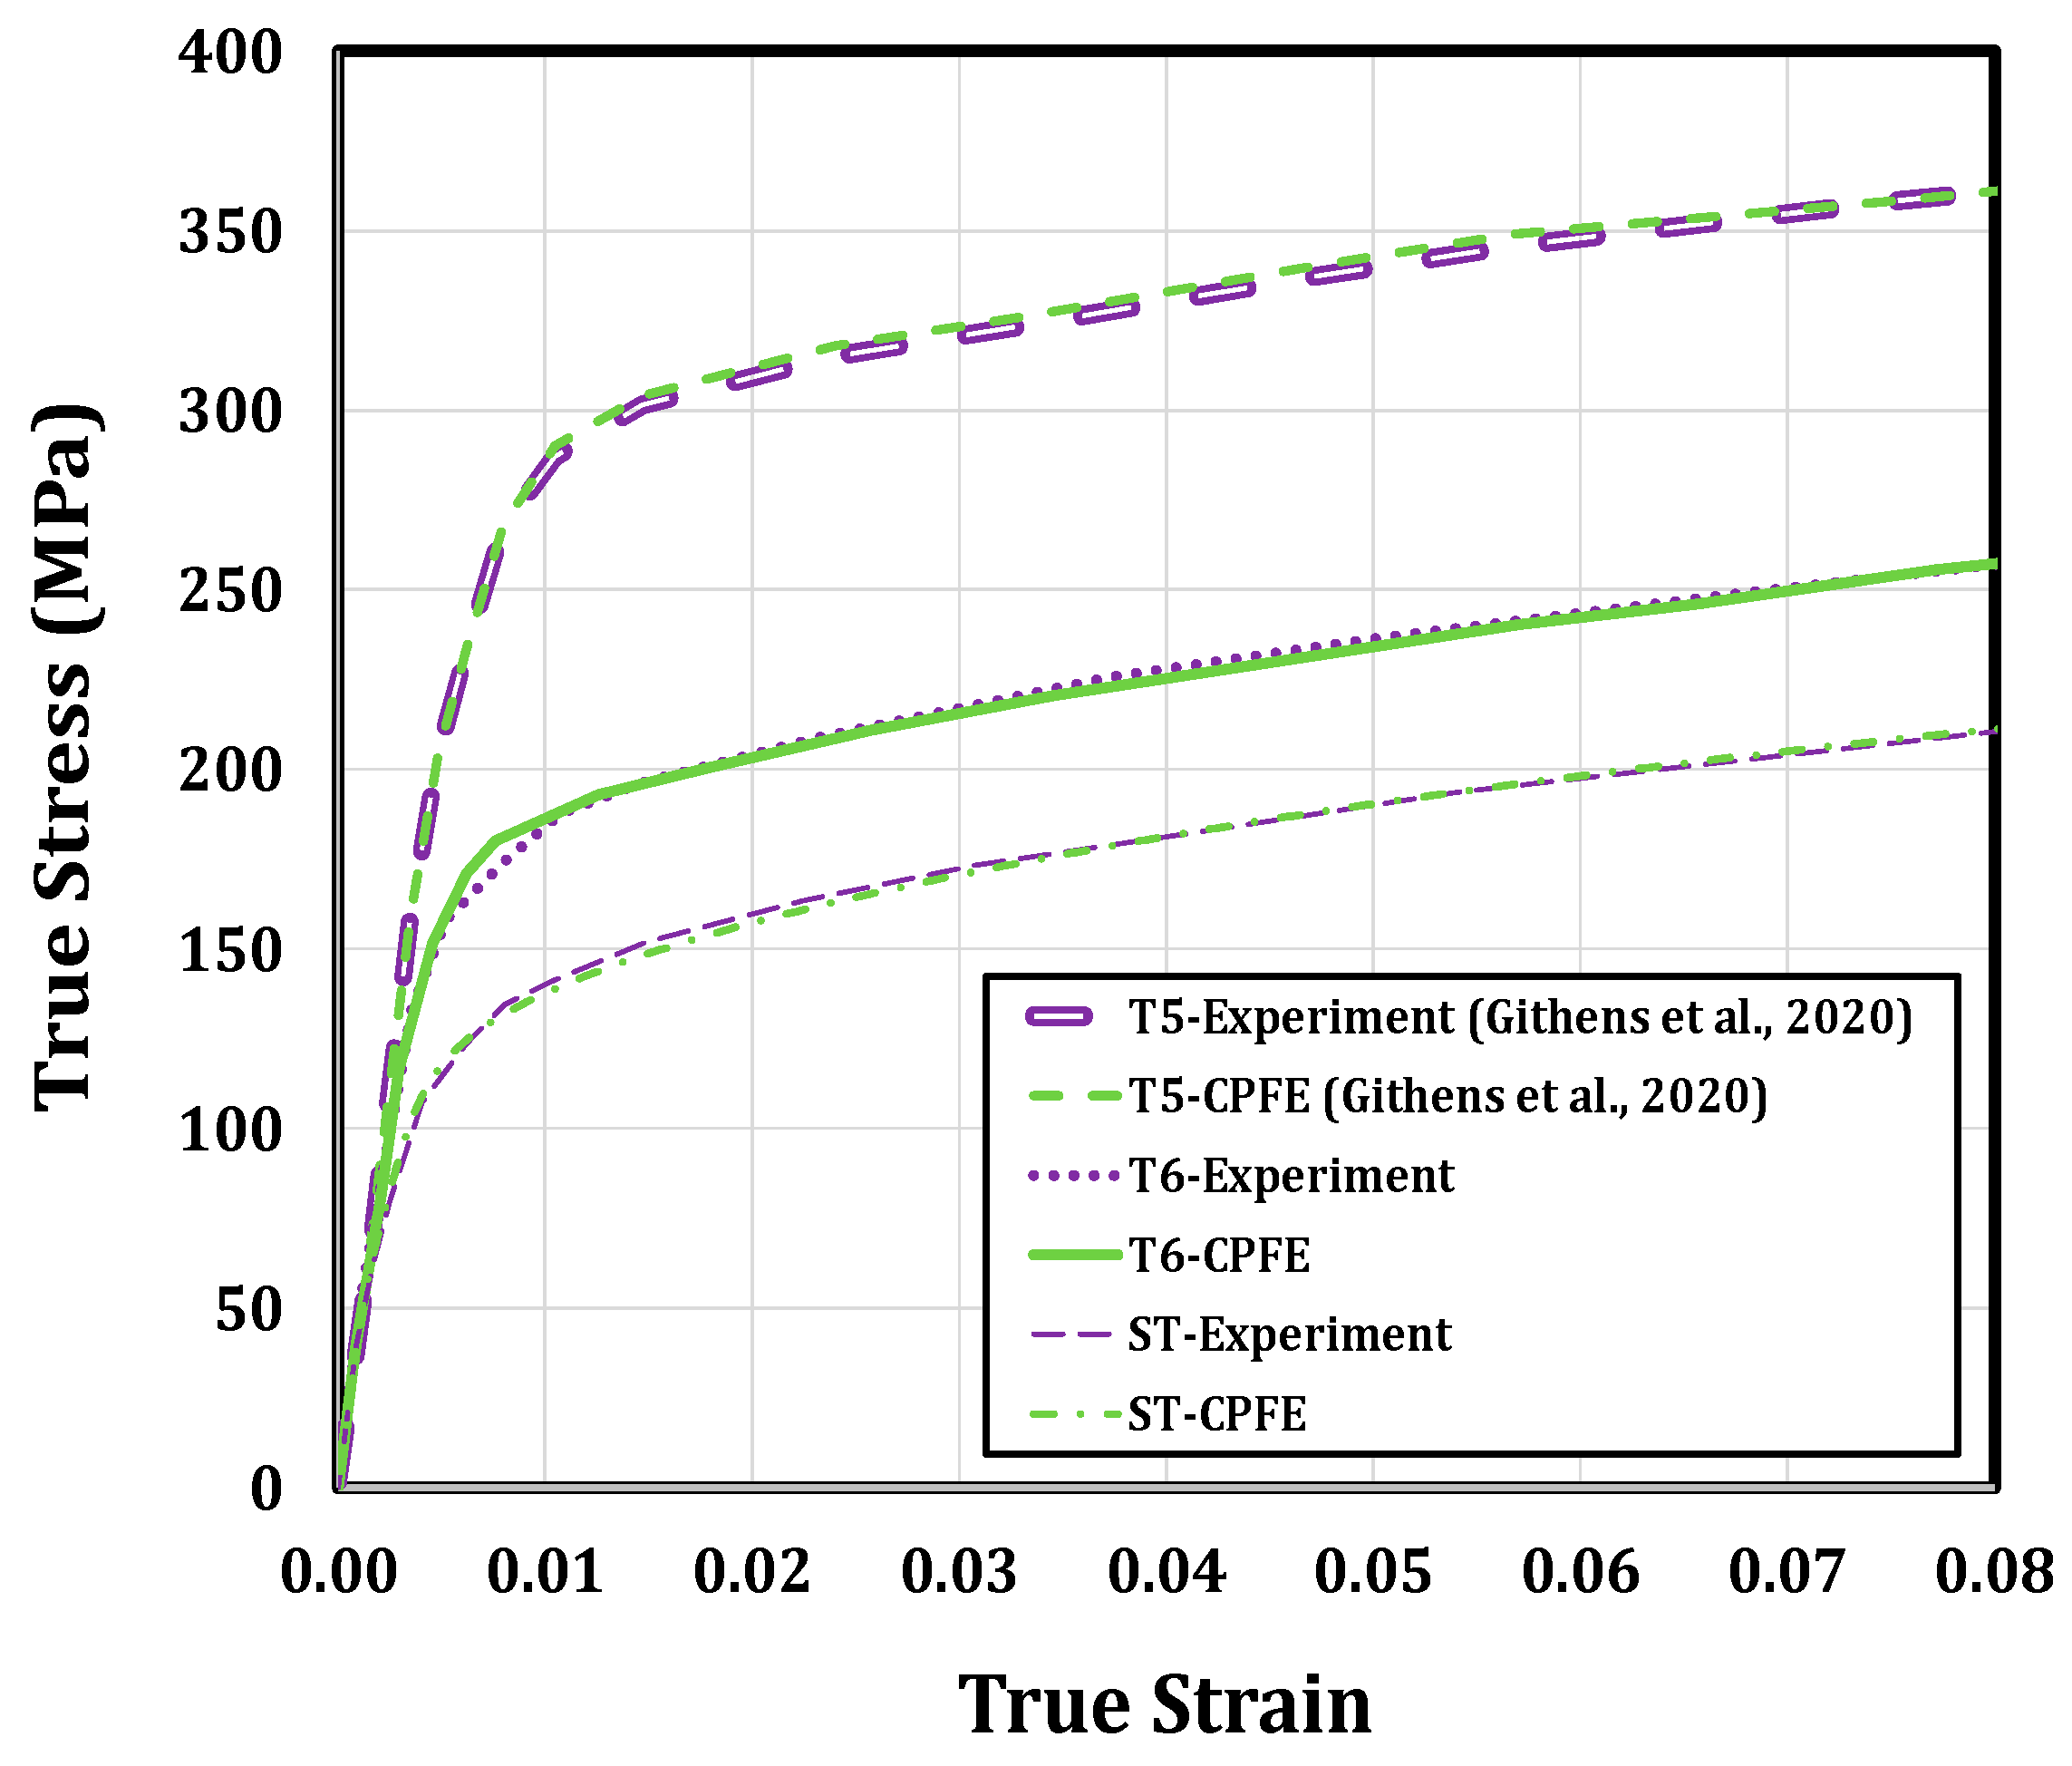
3.1.2. Effects of Heat Treatment
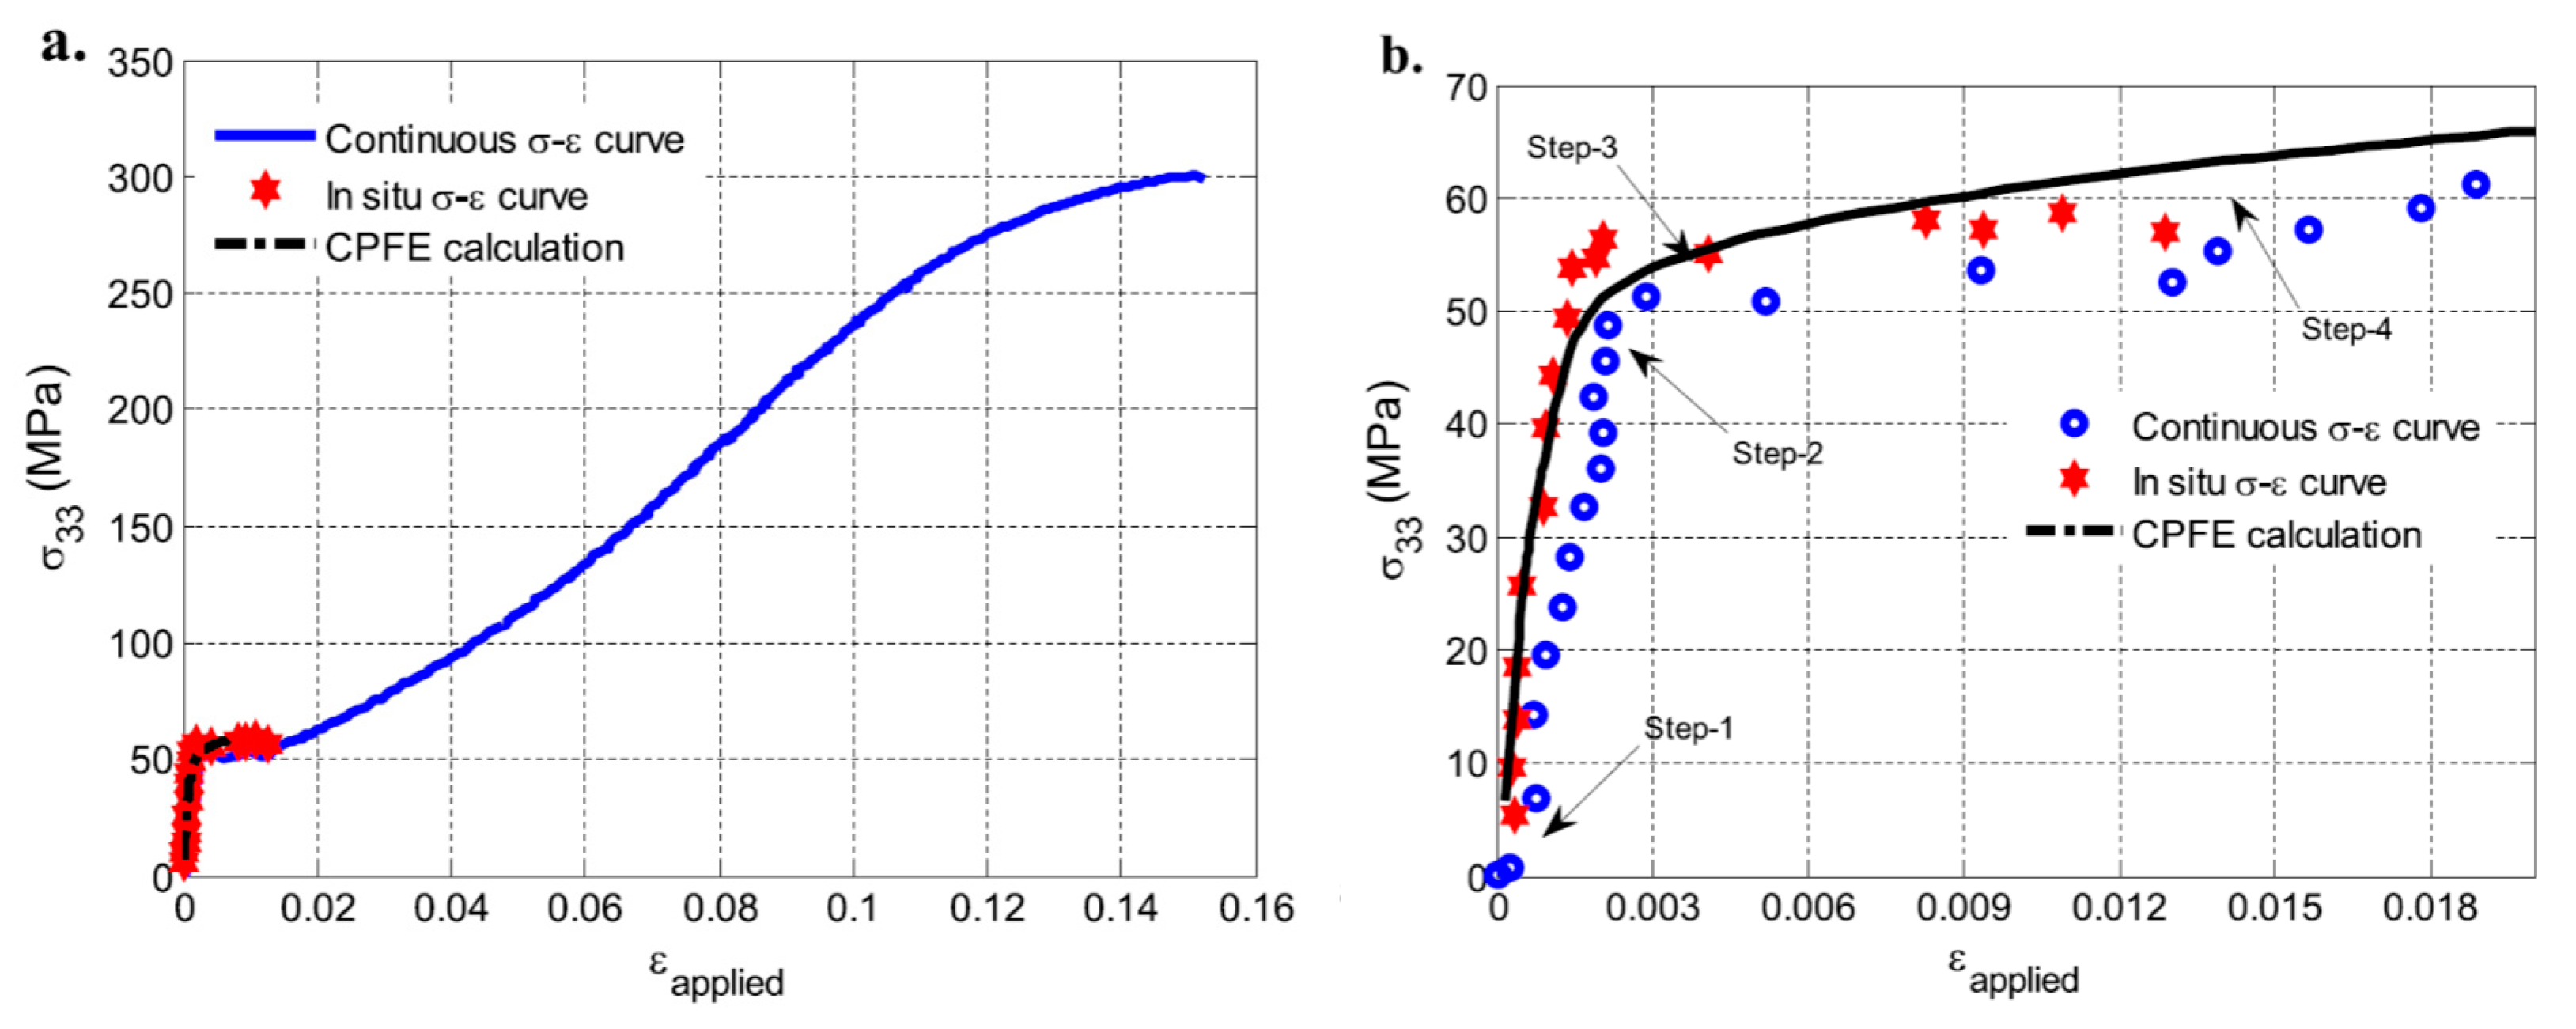
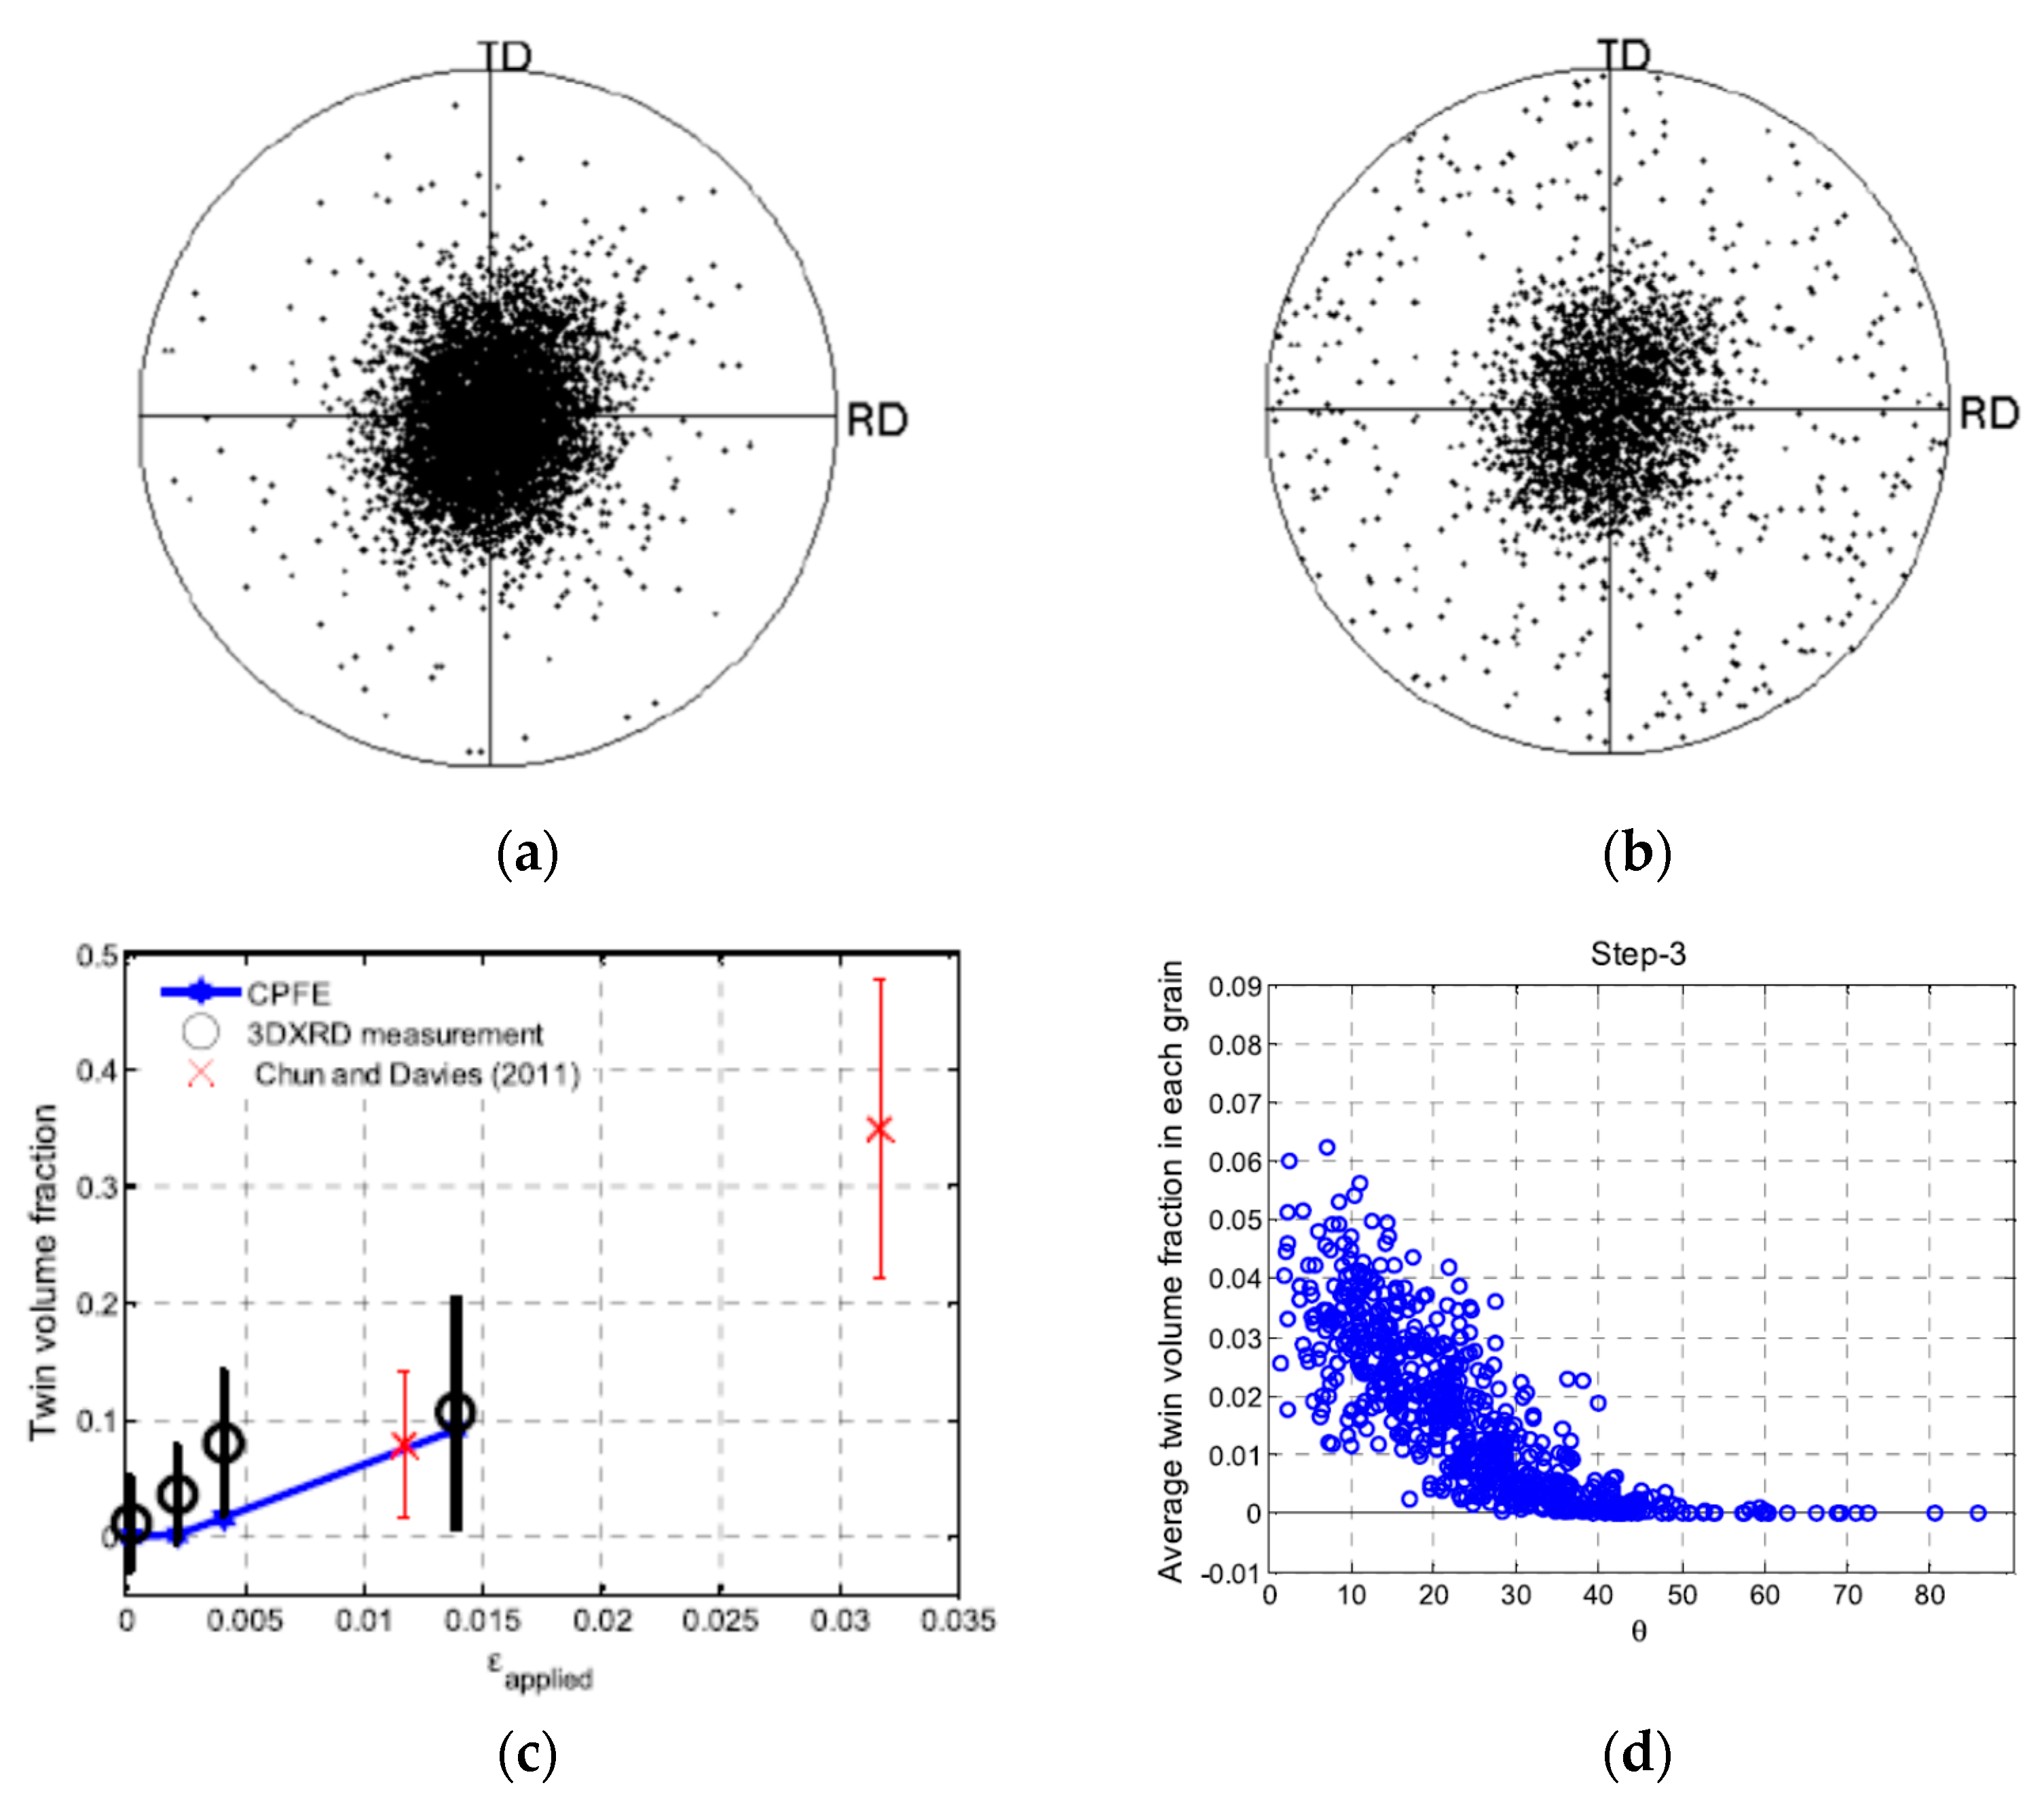
3.2. In-Situ Synchrotron X-ray Techniques
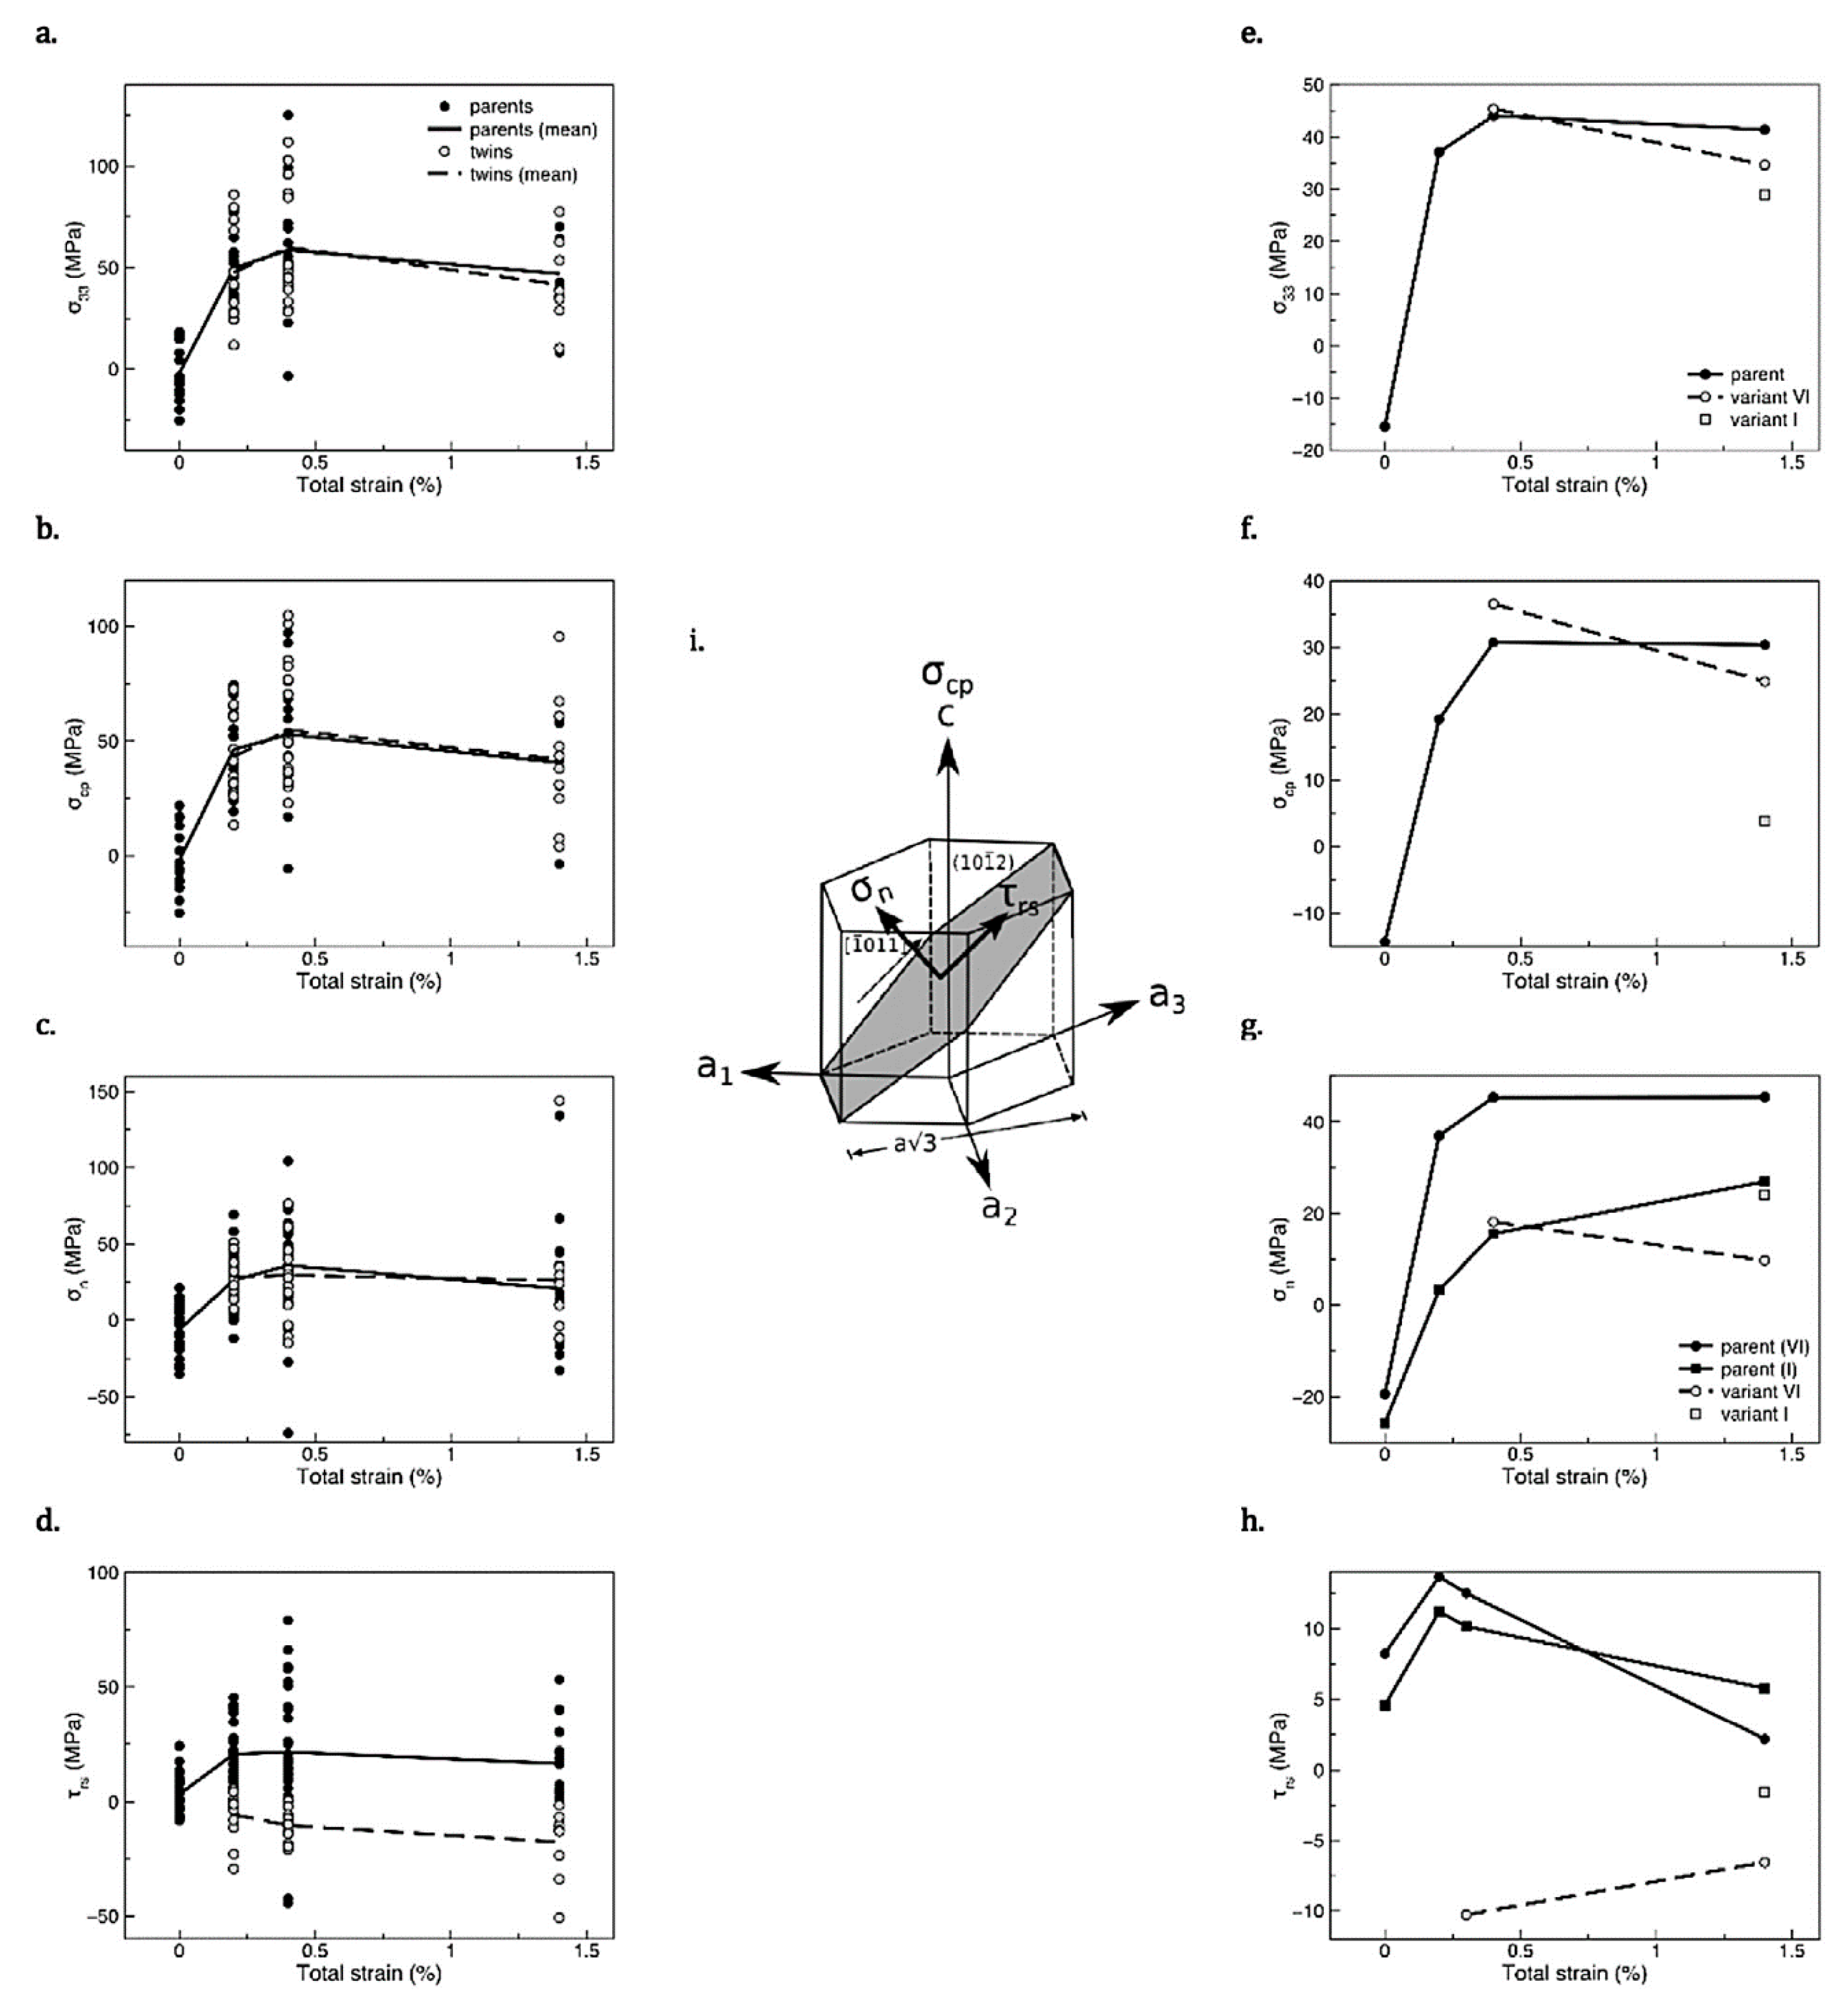
3.2.1. Micromechanics of Twinning
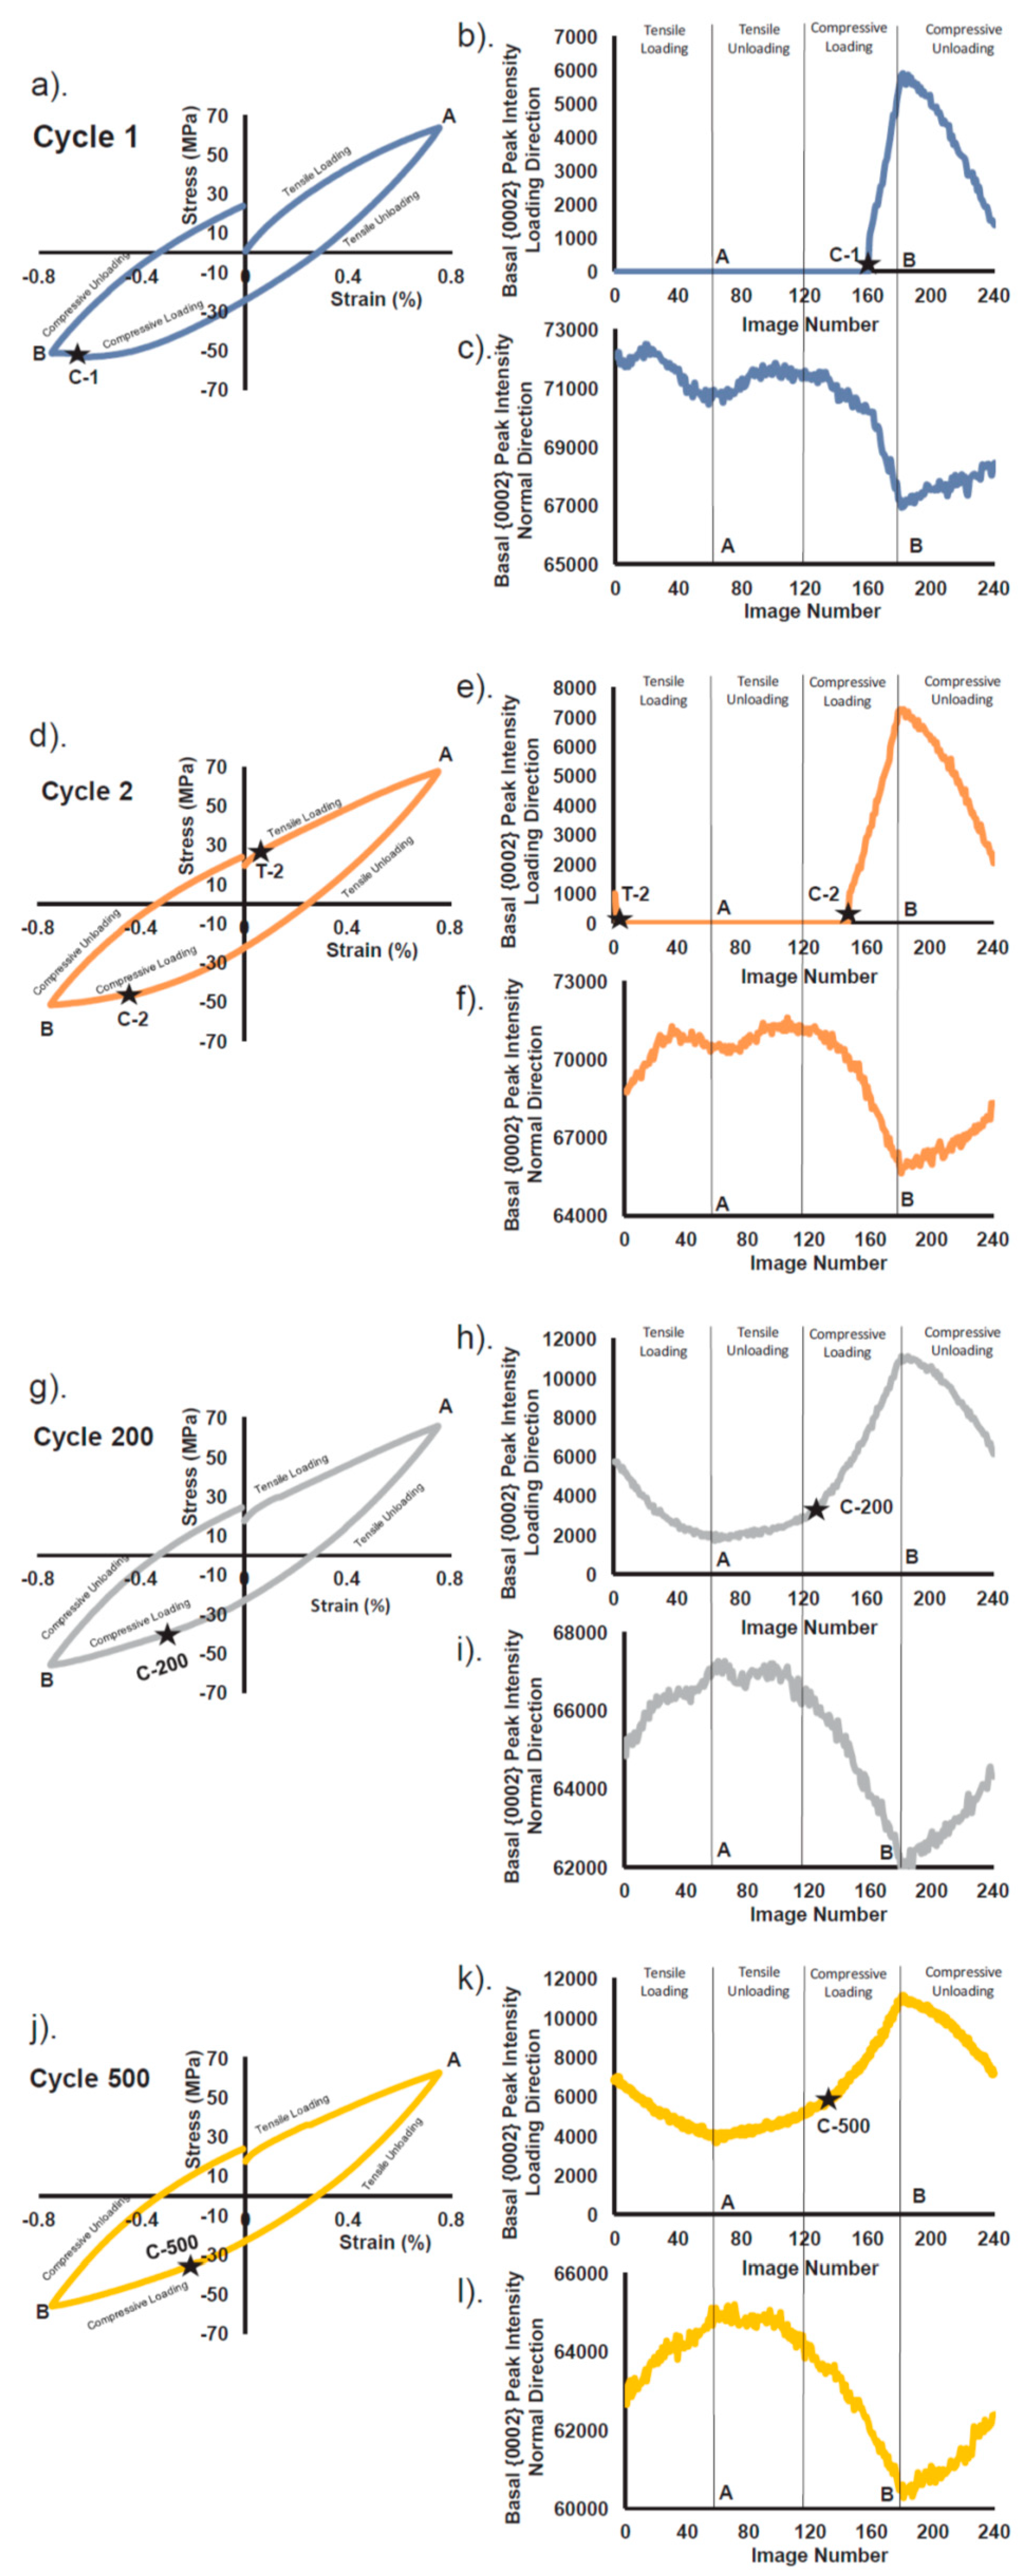
3.2.2. Detwinning
3.3. In-Situ Neutron Diffraction
Micromechanics of Twinning
4. Conclusions and Future Works
- Real-time crystal plasticity simulation coupled to in-situ experiments to guide identification of outliers that can in-turn improve crystal plasticity theories.
- A general map to include the effect of alloying for a variety of Mg alloys using crystal plasticity models along with synchrotron X-ray techniques in a consistent framework.
- Using machine learning techniques to learn the crystal plasticity models and generate surrogate models which can be used to design specific Mg alloy loading paths to achieve target properties.
- Developing a crystal plasticity model with a physically based twinning and detwinning model, which include the correct isotropic and kinematic hardenings to capture the appropriate cyclic response of Mg alloy. This is extremely important in the prediction of fatigue simulation using crystal plasticity simulation.
- Developing an integrated framework of crystal plasticity models and phase field simulation to better capture the twin morphology in Mg alloys.
- The interaction of slip modes and twinning and detwinning mechanisms, which is typically reflected as latent hardening in crystal plasticity models.
- Improved modeling of slip/twin and grain boundary interactions: Effects of grain size in different Mg alloys using crystal plasticity models, specifically via micro-Hall Petch models whose parameters can be inferred through experiments [98,102] and including the effect of grain boundary on twin nucleation and growth in crystal plasticity models.
- Integrating the crystal plasticity models of Mg and its alloys with the PRISMS-Fatigue framework [109] to investigate the effects of texture, grain morphology, sample size, multiaxial strain, and strain amplitude on their fatigue response.
- Coupling the crystal plasticity models with phase-field simulations to address the effect of deformation mechanisms such as plastic slip and twinning on the dynamic recrystallization of Mg alloys.
Author Contributions
Funding
Acknowledgments
Conflicts of Interest
References
- Cole, G.S. Summary of “Magnesium vision 2020: A North American automotive strategic vision for magnesium”. In Essential Readings in Magnesium Technology; Springer: Cham, Switzerland, 2016; pp. 35–40. [Google Scholar]
- Begum, S.; Chen, D.; Xu, S.; Luo, A.A. Low cycle fatigue properties of an extruded AZ31 magnesium alloy. Int. J. Fatigue 2009, 31, 726–735. [Google Scholar] [CrossRef]
- Beyerlein, I.J.; Capolungo, L.; Marshall, P.E.; McCabe, R.J.; Tome, C.N. Statistical analyses of deformation twinning in magnesium. Philos. Mag. 2010, 90, 2161–2190. [Google Scholar] [CrossRef]
- Mirza, F.A.; Chen, D.; Li, D.; Zeng, X. Low cycle fatigue of a rare-earth containing extruded magnesium alloy. Mater. Sci. Eng. A 2013, 575, 65–73. [Google Scholar] [CrossRef]
- Mokdad, F.; Chen, D. Strain-controlled low cycle fatigue properties of a rare-earth containing ZEK100 magnesium alloy. Mater. Des. 2015, 67, 436–447. [Google Scholar] [CrossRef]
- Yu, Q.; Jiang, Y.; Wang, J. Cyclic deformation and fatigue damage in single-crystal magnesium under fully reversed strain-controlled tension–compression in the [1 01¯0] direction. Scr. Mater. 2015, 96, 41–44. [Google Scholar] [CrossRef] [Green Version]
- Murphy-Leonard, A.D.; Pagan, D.C.; Beaudoin, A.; Miller, M.P.; Allison, J.E. Quantification of cyclic twinning-detwinning behavior during low-cycle fatigue of pure magnesium using high energy X-ray diffraction. Int. J. Fatigue 2019, 125, 314–323. [Google Scholar] [CrossRef] [Green Version]
- Ganesan, S.; Yaghoobi, M.; Githens, A.; Chen, Z.; Daly, S.; Allison, J.E.; Sundararaghavan, V. The effects of heat treatment on the response of WE43 Mg alloy: Crystal plasticity finite element simulation and SEM-DIC experiment. Int. J. Plast. 2021, 137, 102917. [Google Scholar] [CrossRef]
- Yaghoobi, M.; Allison, J.E.; Sundararaghavan, V. Multiscale modeling of twinning and detwinning behavior of HCP polycrystals. Int. J. Plast. 2020, 127, 102653. [Google Scholar] [CrossRef]
- Capolungo, L.; Beyerlein, I.J. Nucleation and stability of twins in hcp metals. Phys. Rev. B 2008, 78, 024117. [Google Scholar] [CrossRef]
- Wang, J.; Hirth, J.; Tomé, C. (1¯012) Twinning nucleation mechanisms in hexagonal-close-packed crystals. Acta Mater. 2009, 57, 5521–5530. [Google Scholar] [CrossRef]
- Beyerlein, I.J.; Tomé, C.N. A probabilistic twin nucleation model for HCP polycrystalline metals. Proc. R. Soc. A Math. Phys. Eng. Sci. 2010, 466, 2517–2544. [Google Scholar] [CrossRef] [Green Version]
- Beyerlein, I.J.; McCabe, R.J.; Tomé, C.N. Effect of microstructure on the nucleation of deformation twins in polycrys-talline high-purity magnesium: A multi-scale modeling study. J. Mech. Phys. Solids 2011, 59, 988–1003. [Google Scholar] [CrossRef]
- Zheng, S.; Beyerlein, I.; Wang, J.; Carpenter, J.; Han, W.; Mara, N. Deformation twinning mechanisms from bimetal interfaces as revealed by in situ straining in the TEM. Acta Mater. 2012, 60, 5858–5866. [Google Scholar] [CrossRef]
- Barrett, C.D.; el Kadiri, H. The roles of grain boundary dislocations and disclinations in the nucleation of {1 0 1 2} twinning. Acta Mater. 2014, 63, 1–15. [Google Scholar] [CrossRef]
- Beyerlein, I.J.; Kumar, M.A. The Stochastic Nature of Deformation Twinning: Application to HCP Materials. In Handbook of Materials Modeling: Methods: Theory and Modeling; Andreoni, W., Yip, S., Eds.; Springer International Publishing: Cham, Switzerland, 2018; pp. 1–39. [Google Scholar]
- Wu, L.; Jain, A.; Brown, D.; Stoica, G.; Agnew, S.; Clausen, B.; Fielden, D.; Liaw, P. Twinning–detwinning behavior during the strain-controlled low-cycle fatigue testing of a wrought magnesium alloy, ZK60A. Acta Mater. 2008, 56, 688–695. [Google Scholar] [CrossRef]
- Koike, J.; Fujiyama, N.; Ando, D.; Sutou, Y. Roles of deformation twinning and dislocation slip in the fatigue failure mechanism of AZ31 Mg alloys. Scr. Mater. 2010, 63, 747–750. [Google Scholar] [CrossRef]
- Yu, Q.; Zhang, J.; Jiang, Y. Fatigue damage development in pure polycrystalline magnesium under cyclic tension-compression loading. Mater. Sci. Eng. A 2011, 528, 7816–7826. [Google Scholar] [CrossRef]
- Zhang, J.; Yu, Q.; Jiang, Y.; Li, Q. An experimental study of cyclic deformation of extruded AZ61A magnesium alloy. Int. J. Plast. 2011, 27, 768–787. [Google Scholar] [CrossRef]
- Wu, W.; Lee, S.Y.; Paradowska, A.M.; Gao, Y.; Liaw, P.K. Twinning–detwinning behavior during fatigue-crack propagation in a wrought magnesium alloy AZ31B. Mater. Sci. Eng. A 2012, 556, 278–286. [Google Scholar] [CrossRef]
- Zhang, H.; Jérusalem, A.; Salvati, E.; Papadaki, C.; Fong, K.S.; Song, X.; Korsunsky, A.M. Multi-scale mechanisms of twinning-detwinning in magnesium alloy AZ31B simulated by crystal plasticity modeling and validated via in situ synchrotron XRD and in situ SEM-EBSD. Int. J. Plast. 2019, 119, 43–56. [Google Scholar] [CrossRef]
- Aydıner, C.C.; Telemez, M.A. Multiscale deformation heterogeneity in twinning magnesium investigated with in situ image correlation. Int. J. Plast. 2014, 56, 203–218. [Google Scholar] [CrossRef]
- Paudel, Y.; Indeck, J.; Hazeli, K.; Priddy, M.W.; Inal, K.; Rhee, H.; Barrett, C.D.; Whittington, W.R.; Limmer, K.R.; el Kadiri, H.; et al. Characterization and modeling of {101¯ 2} twin banding in magnesium. Acta Mater. 2020, 183, 438–451. [Google Scholar] [CrossRef]
- Githens, A.; Ganesan, S.; Chen, Z.; Allison, J.; Sundararaghavan, V.; Daly, S. Characterizing microscale deformation mechanisms and macroscopic tensile properties of a high strength magnesium rare-earth alloy: A combined experimental and crystal plasticity approach. Acta Mater. 2020, 186, 77–94. [Google Scholar] [CrossRef]
- Aydıner, C.C.; Bernier, J.V.; Clausen, B.; Lienert, U.; Tomé, C.N.; Brown, D.W. Evolution of stress in individual grains and twins in a magnesium alloy aggregate. Phys. Rev. B 2009, 80, 024113. [Google Scholar] [CrossRef] [Green Version]
- Abdolvand, H.; Majkut, M.; Oddershede, J.; Schmidt, S.; Lienert, U.; Diak, B.J.; Withers, P.J.; Daymondd, M.R. On the deformation twinning of Mg AZ31B: A three-dimensional synchrotron X-ray diffraction experiment and crystal plasticity finite element model. Int. J. Plast. 2015, 70, 77–97. [Google Scholar] [CrossRef] [Green Version]
- Lentz, M.; Klaus, M.; Wagner, M.; Fahrenson, C.; Beyerlein, I.J.; Zecevic, M.; Reimers, W.; Knezevic, M. Effect of age hardening on the deformation behavior of an Mg–Y–Nd alloy: In-situ X-ray diffraction and crystal plasticity modeling. Mater. Sci. Eng. A 2015, 628, 396–409. [Google Scholar] [CrossRef]
- Kada, S.R.; Lynch, P.A.; Kimpton, J.A.; Barnett, M.R. In-situ X-ray diffraction studies of slip and twinning in the presence of precipitates in AZ91 alloy. Acta Mater. 2016, 119, 145–156. [Google Scholar] [CrossRef]
- Greeley, D.; Yaghoobi, M.; Pagan, D.; Sundararaghavan, V.; Allison, J. Using synchrotron radiation to improve under-standing of deformation of polycrystalline metals by measuring, modelling and publishing 4D information. Iop Conf. Ser. Mater. Sci. Eng. 2019, 580, 012017. [Google Scholar] [CrossRef]
- Li, L.; Yuanzhi, W.; Jie, W.; Xiao, L.C. In situ analysis of deformation twins within a magnesium polycrystal: (II) twin growth. Micron 2019, 119, 8–16. [Google Scholar] [CrossRef] [PubMed]
- Zhang, N.; Zhang, Y.; Chen, S.; Li, Z.; Xie, H.; Lu, L.; Yao, X.; Luo, S. Onset of detwinning in Mg-3Al-1Zn alloy: A synchrotron-based X-ray diffraction study. Scr. Mater. 2021, 190, 113–117. [Google Scholar] [CrossRef]
- Gharghouri, G.C.W.M.A.; Gharghouri, M.A.; Weatherly, G.C.; Embury, J.D.; Root, J. Study of the mechanical properties of Mg-7.7at.% Al by in-situ neutron diffraction. Philos. Mag. A 1999, 79, 1671–1695. [Google Scholar] [CrossRef]
- Brown, D.; Agnew, S.; Bourke, M.; Holden, T.; Vogel, S.; Tomé, C. Internal strain and texture evolution during deformation twinning in magnesium. Mater. Sci. Eng. A 2005, 399, 1–12. [Google Scholar] [CrossRef]
- Wu, L.; Agnew, S.; Brown, D.; Stoica, G.; Clausen, B.; Jain, A.; Fielden, D.; Liaw, P. Internal stress relaxation and load redistribution during the twinning–detwinning-dominated cyclic deformation of a wrought magnesium alloy, ZK60A. Acta Mater. 2008, 56, 3699–3707. [Google Scholar] [CrossRef]
- Muránsky, O.; Carr, D.; Šittner, P.; Oliver, E. In situ neutron diffraction investigation of deformation twinning and pseudoelastic-like behaviour of extruded AZ31 magnesium alloy. Int. J. Plast. 2009, 25, 1107–1127. [Google Scholar] [CrossRef]
- Wu, L.; Agnew, S.; Ren, Y.; Brown, D.; Clausen, B.; Stoica, G.; Wenk, H.; Liaw, P. The effects of texture and extension twinning on the low-cycle fatigue behavior of a rolled magnesium alloy, AZ31B. Mater. Sci. Eng. A 2010, 527, 7057–7067. [Google Scholar] [CrossRef]
- Wu, W.; Qiao, H.; An, K.; Guo, X.; Wu, P.; Liaw, P.K. Investigation of deformation dynamics in a wrought magnesium alloy. Int. J. Plast. 2014, 62, 105–120. [Google Scholar] [CrossRef] [Green Version]
- Wu, W.; Liaw, P.K.; An, K. Unraveling cyclic deformation mechanisms of a rolled magnesium alloy using in situ neutron diffraction. Acta Mater. 2015, 85, 343–353. [Google Scholar] [CrossRef] [Green Version]
- Namakian, R.; Voyiadjis, G.Z. An atomic displacive model for 101¯21¯011 twinning in hexagonal close packed metals with the emphasis on the role of partial stacking faults in formation of {101¯2} twins. Acta Mater. 2018, 150, 381–393. [Google Scholar] [CrossRef]
- Namakian, R.; Voyiadjis, G.Z.; Kwaśniak, P. On the slip and twinning mechanisms on first order pyramidal plane of magnesium: Molecular dynamics simulations and first principal studies. Mater. Des. 2020, 191, 108648. [Google Scholar] [CrossRef]
- Liu, X.-Y.; Ohotnicky, P.P.; Adams, J.B.; Rohrer, C.L.; Hyland, R.W., Jr. Anisotropic surface segregation in Al − Mg alloys. Surf. Sci. 1997, 373, 357–370. [Google Scholar] [CrossRef]
- Wu, Z.; Francis, M.F.; Curtin, W.A. Magnesium interatomic potential for simulating plasticity and fracture phenomena. Model. Simul. Mater. Sci. Eng. 2015, 23, 015004. [Google Scholar] [CrossRef] [Green Version]
- Yasi, J.A.; Hector, L.G.; Trinkle, D.R. First-principles data for solid-solution strengthening of magnesium: From geometry and chemistry to properties. Acta Mater. 2010, 58, 5704–5713. [Google Scholar] [CrossRef] [Green Version]
- Ghazisaeidi, M.; Hector, L.; Curtin, W. Solute strengthening of twinning dislocations in Mg alloys. Acta Mater. 2014, 80, 278–287. [Google Scholar] [CrossRef] [Green Version]
- Olmsted, D.L.; HectorJr, L.G.; A Curtin, W.; Clifton, R.J. Atomistic simulations of dislocation mobility in Al, Ni and Al/Mg alloys. Model. Simul. Mater. Sci. Eng. 2005, 13, 371–388. [Google Scholar] [CrossRef] [Green Version]
- Wang, J.; Hoagland, R.G.; Hirth, J.P.; Misra, A. Atomistic modeling of the interaction of glide dislocations with “weak” interfaces. Acta Mater. 2008, 56, 5685–5693. [Google Scholar] [CrossRef]
- Yaghoobi, M.; Voyiadjis, G.Z. Effect of boundary conditions on the MD simulation of nanoindentation. Comput. Mater. Sci. 2014, 95, 626–636. [Google Scholar] [CrossRef]
- Voyiadjis, G.Z.; Yaghoobi, M. Large scale atomistic simulation of size effects during nanoindentation: Dislocation length and hardness. Mater. Sci. Eng. A 2015, 634, 20–31. [Google Scholar] [CrossRef]
- Yaghoobi, M.; Voyiadjis, G.Z. Atomistic simulation of size effects in single-crystalline metals of confined volumes during nanoindentation. Comput. Mater. Sci. 2016, 111, 64–73. [Google Scholar] [CrossRef]
- Yaghoobi, M.; Voyiadjis, G.Z. Size effects in fcc crystals during the high rate compression test. Acta Mater. 2016, 121, 190–201. [Google Scholar] [CrossRef]
- Voyiadjis, G.Z.; Yaghoobi, M. Size and strain rate effects in metallic samples of confined volumes: Dislocation length distribution. Scr. Mater. 2017, 130, 182–186. [Google Scholar] [CrossRef]
- Yaghoobi, M.; Voyiadjis, G.Z. Microstructural investigation of the hardening mechanism in fcc crystals during high rate deformations. Comput. Mater. Sci. 2017, 138, 10–15. [Google Scholar] [CrossRef]
- Yaghoobi, M.; Voyiadjis, G.Z. The effects of temperature and strain rate in fcc and bcc metals during extreme defor-mation rates. Acta Mater. 2018, 151, 1–10. [Google Scholar] [CrossRef]
- Shahbeyk, S.; Voyiadjis, G.Z.; Habibi, V.; Astaneh, S.H.; Yaghoobi, M. Review of Size Effects during Micropillar Com-pression Test: Experiments and Atomistic Simulations. Crystals 2019, 9, 591. [Google Scholar] [CrossRef] [Green Version]
- Saffarini, M.H.; Voyiadjis, G.Z.; Ruestes, C.J.; Yaghoobi, M. Ligament size dependency of strain hardening and ductil-ity in nanoporous gold. Comput. Mater. Sci. 2021, 186, 109920. [Google Scholar] [CrossRef]
- Fan, H.; Aubry, S.; Arsenlis, A.; El-Awady, J.A. The role of twinning deformation on the hardening response of poly-crystalline magnesium from discrete dislocation dynamics simulations. Acta Mater. 2015, 92, 126–139. [Google Scholar] [CrossRef] [Green Version]
- Wei, D.; Zaiser, M.; Feng, Z.; Kang, G.; Fan, H.; Zhang, X. Effects of twin boundary orientation on plasticity of bicrystalline copper micropillars: A discrete dislocation dynamics simulation study. Acta Mater. 2019, 176, 289–296. [Google Scholar] [CrossRef]
- Voyiadjis, G.Z.; Yaghoobi, M. Size Effects in Plasticity: From Macro to Nano; Academic Press: Cambridge, MA, USA, 2019. [Google Scholar]
- Houtte, P. Simulation of the rolling and shear texture of brass by the Taylor theory adapted for mechanical twinning. Acta Met. 1978, 26, 591–604. [Google Scholar] [CrossRef]
- Tomé, C.; Lebensohn, R.; Kocks, U. A model for texture development dominated by deformation twinning: Application to zirconium alloys. Acta Met. Mater. 1991, 39, 2667–2680. [Google Scholar] [CrossRef] [Green Version]
- Kalidindi, S.R. Incorporation of deformation twinning in crystal plasticity models. J. Mech. Phys. Solids 1998, 46, 267–290. [Google Scholar] [CrossRef]
- Staroselsky, A.; Anand, L. Inelastic deformation of polycrystalline face centered cubic materials by slip and twinning. J. Mech. Phys. Solids 1998, 46, 671–673. [Google Scholar] [CrossRef]
- Staroselsky, A.; Anand, L. A constitutive model for hcp materials deforming by slip and twinning: Application to magnesium alloy AZ31B. Int. J. Plast. 2003, 19, 1843–1864. [Google Scholar] [CrossRef]
- Abdolvand, H.; Daymond, M.R.; Mareau, C. Incorporation of twinning into a crystal plasticity finite element model: Evolution of lattice strains and texture in Zircaloy-2. Int. J. Plast. 2011, 27, 1721–1738. [Google Scholar] [CrossRef]
- Fernández, A.; Prado, M.T.P.; Wei, Y.; Jérusalem, A. Continuum modeling of the response of a Mg alloy AZ31 rolled sheet during uniaxial deformation. Int. J. Plast. 2011, 27, 1739–1757. [Google Scholar] [CrossRef] [Green Version]
- Zhang, J.; Joshi, S.P. Phenomenological crystal plasticity modeling and detailed micromechanical investigations of pure magnesium. J. Mech. Phys. Solids 2012, 60, 945–972. [Google Scholar] [CrossRef]
- Fernández, A.; Jérusalem, A.; Gutiérrez-Urrutia, I.; Pérez-Prado, M.T. Three-dimensional investigation of grain boundary-twin interactions in a Mg AZ31 alloy by electron backscatter diffraction and continuum modeling. Acta Mater. 2013, 61, 7679–7692. [Google Scholar] [CrossRef]
- Liu, Y.; Wei, Y. A polycrystal based numerical investigation on the temperature dependence of slip resistance and texture evolution in magnesium alloy AZ31B. Int. J. Plast. 2014, 55, 80–93. [Google Scholar] [CrossRef] [Green Version]
- Abdolvand, H.; Daymond, M.R. Internal strain and texture development during twinning: Comparing neutron dif-fraction measurements with crystal plasticity finite-element approaches. Acta Mater. 2012, 60, 2240–2248. [Google Scholar] [CrossRef]
- Abdolvand, H.; Daymond, M.R. Multi-scale modeling and experimental study of twin inception and propagation in hexagonal close-packed materials using a crystal plasticity finite element approach; part II: Local behavior. J. Mech. Phys. Solids 2013, 61, 803–818. [Google Scholar] [CrossRef]
- Abdolvand, H.; Majkut, M.; Oddershede, J.; Wright, J.P.; Daymond, M.R. Study of 3-D stress development in parent and twin pairs of a hexagonal close-packed polycrystal: Part II—Crystal plasticity finite element modeling. Acta Mater. 2015, 93, 235–245. [Google Scholar] [CrossRef]
- Qiao, H.; Barnett, M.; Wu, P. Modeling of twin formation, propagation and growth in a Mg single crystal based on crystal plasticity finite element method. Int. J. Plast. 2016, 86, 70–92. [Google Scholar] [CrossRef]
- Hama, T.; Tanaka, Y.; Uratani, M.; Takuda, H. Deformation behavior upon two-step loading in a magnesium alloy sheet. Int. J. Plast. 2016, 82, 283–304. [Google Scholar] [CrossRef] [Green Version]
- Prasad, N.S.; Narasimhan, R.; Suwas, S. Effects of lattice orientation and crack tip constraint on ductile fracture initiation in Mg single crystals. Int. J. Plast. 2017, 97, 222–245. [Google Scholar] [CrossRef]
- Lebensohn, R.; Tomé, C. A self-consistent anisotropic approach for the simulation of plastic deformation and texture development of polycrystals: Application to zirconium alloys. Acta Met. Mater. 1993, 41, 2611–2624. [Google Scholar] [CrossRef]
- Agnew, S.; Yoo, M.; Tomé, C. Application of texture simulation to understanding mechanical behavior of Mg and solid solution alloys containing Li or Y. Acta Mater. 2001, 49, 4277–4289. [Google Scholar] [CrossRef]
- Kumar, M.A.; Kanjarla, A.K.; Niezgoda, S.R.; Lebensohn, R.A.; Tomé, C.N. Numerical study of the stress state of a deformation twin in magnesium. Acta Mater. 2015, 84, 349–358. [Google Scholar] [CrossRef]
- Lévesque, J.; Mohammadi, M.; Mishra, R.K.; Inal, K. An extended Taylor model to simulate localized deformation phenomena in magnesium alloys. Int. J. Plast. 2016, 78, 203–222. [Google Scholar] [CrossRef]
- Segurado, J.; Lebensohn, R.A.; Llorca, J.; Tomé, C.N. Multiscale modeling of plasticity based on embedding the viscoplastic selfconsistent formulation in implicit finite elements. Int. J. Plast. 2012, 28, 124–140. [Google Scholar] [CrossRef]
- Knezevic, M.; McCabe, R.J.; Lebensohn, R.A.; Tomé, C.N.; Liu, C.; Lovato, M.L.; Mihaila, B. Integration of self-consistent polycrystal plasticity with dislocation density based hardening laws within an implicit finite element framework: Application to low-symmetry metals. J. Mech. Phys. Solids 2013, 61, 2034–2046. [Google Scholar] [CrossRef]
- Prakash, A.; Nöhring, W.G.; Lebensohn, R.A.; Höppel, H.W.; Bitzek, E. A multiscale simulation framework of the accumulative roll bonding process accounting for texture evolution. Mater. Sci. Eng. A 2015, 631, 104–119. [Google Scholar] [CrossRef]
- Ardeljan, M.; Beyerlein, I.J.; McWilliams, B.A.; Knezevic, M. Strain rate and temperature sensitive multi-level crystal plasticity model for large plastic deformation behavior: Application to AZ31 magnesium alloy. Int. J. Plast. 2016, 83, 90–109. [Google Scholar] [CrossRef]
- Feather, W.G.; Ghorbanpour, S.; Savage, D.J.; Ardeljan, M.; Jahedi, M.; McWilliams, B.A.; Gupta, N.; Xiang, C.; Vogel, S.C.; Knezevic, M. Mechanical response, twinning, and texture evolution of WE43 magnesium-rare earth alloy as a function of strain rate: Experiments and multi-level crystal plasticity modeling. Int. J. Plast. 2019, 120, 180–204. [Google Scholar] [CrossRef]
- Kondo, R.; Tadano, Y.; Shizawa, K. A phase-field model of twinning and detwinning coupled with dislocation-based crystal plasticity for HCP metals. Comput. Mater. Sci. 2014, 95, 672–683. [Google Scholar] [CrossRef]
- Liu, C.; Shanthraj, P.; Diehl, M.; Roters, F.; Dong, S.; Dong, J.; Ding, W.; Raabe, D. An integrated crystal plasticity–phase field model for spatially resolved twin nucleation, propagation, and growth in hexagonal materials. Int. J. Plast. 2018, 106, 203–227. [Google Scholar] [CrossRef]
- Proust, G.; Tomé, C.; Kaschner, G. Modeling texture, twinning and hardening evolution during deformation of hexagonal materials. Acta Mater. 2007, 55, 2137–2148. [Google Scholar] [CrossRef]
- Proust, G.; Tomé, C.N.; Jain, A.; Agnew, S.R. Modeling the effect of twinning and detwinning during strain-path changes of magnesium alloy AZ31. Int. J. Plast. 2009, 25, 861–880. [Google Scholar] [CrossRef]
- Guillemer, C.; Clavel, M.; Cailletaud, G. Cyclic behavior of extruded magnesium: Experimental, microstructural and numerical approach. Int. J. Plast. 2011, 27, 2068–2084. [Google Scholar] [CrossRef]
- Wang, H.; Wu, P.; Tomé, C.; Wang, J. A constitutive model of twinning and detwinning for hexagonal close packed polycrystals. Mater. Sci. Eng. A 2012, 555, 93–98. [Google Scholar] [CrossRef]
- Wang, H.; Wu, P.; Wang, J. Modeling inelastic behavior of magnesium alloys during cyclic loading–unloading. Int. J. Plast. 2013, 47, 49–64. [Google Scholar] [CrossRef]
- Wang, H.; Wu, P.D.; Wang, J.; Tomé, C.N. A crystal plasticity model for hexagonal close packed (HCP) crystals including twinning and de-twinning mechanisms. Int. J. Plast. 2013, 49, 36–52. [Google Scholar] [CrossRef]
- Qiao, H.; Agnew, S.; Wu, P. Modeling twinning and detwinning behavior of Mg alloy ZK60A during monotonic and cyclic loading. Int. J. Plast. 2015, 65, 61–84. [Google Scholar] [CrossRef]
- Hama, T.; Takuda, H. Crystal plasticity finite-element simulation of deformation behavior in a magnesium alloy sheet considering detwinning. Steel Res. Int. 2012, 1115–1118. [Google Scholar]
- Hama, T.; Kitamura, N.; Takuda, H. Effect of twinning and detwinning on inelastic behavior during unloading in a magnesium alloy sheet. Mater. Sci. Eng. A 2013, 583, 232–241. [Google Scholar] [CrossRef] [Green Version]
- Hama, T.; Kobuki, A.; Takuda, H. Crystal-plasticity finite-element analysis of anisotropic deformation behavior in a commercially pure titanium Grade 1 sheet. Int. J. Plast. 2017, 91, 77–108. [Google Scholar] [CrossRef] [Green Version]
- Briffod, F.; Shiraiwa, T.; Enoki, M. Numerical investigation of the influence of twinning/detwinning on fatigue crack initiation in AZ31 magnesium alloy. Mater. Sci. Eng. A 2019, 753, 79–90. [Google Scholar] [CrossRef]
- Andani, M.T.; Lakshmanan, A.; Karamooz-Ravari, M.; Sundararaghavan, V.; Allison, J.; Misra, A. A quantitative study of stress fields ahead of a slip band blocked by a grain boundary in unalloyed magnesium. Sci. Rep. 2020, 10, 1–8. [Google Scholar] [CrossRef] [PubMed] [Green Version]
- Armstrong, R.; Codd, I.; Douthwaite, R.M.; Petch, N.J. The plastic deformation of polycrystalline aggregates. Philos. Mag. 1962, 7, 45–58. [Google Scholar] [CrossRef]
- Weng, G. A micromechanical theory of grain-size dependence in metal plasticity. J. Mech. Phys. Solids 1983, 31, 193–203. [Google Scholar] [CrossRef]
- Sun, S.; Sundararaghavan, V. A probabilistic crystal plasticity model for modeling grain shape effects based on slip geometry. Acta Mater. 2012, 60, 5233–5244. [Google Scholar] [CrossRef]
- Andani, M.T.; Lakshmanan, A.; Sundararaghavan, V.; Allison, J.; Misra, A. Quantitative study of the effect of grain boundary parameters on the slip system level Hall-Petch slope for basal slip system in Mg-4Al. Acta Mater. 2020, 200, 148–161. [Google Scholar] [CrossRef]
- Yaghoobi, M.; Ganesan, S.; Sundar, S.; Lakshmanan, A.; Rudraraju, S.; Allison, J.E.; Sundararaghavan, V. PRISMS-Plasticity: An open-source crystal plasticity finite element software. Comput. Mater. Sci. 2019, 169, 109078. [Google Scholar] [CrossRef]
- Christian, J.; Mahajan, S. Deformation twinning. Prog. Mater. Sci. 1995, 39, 1–157. [Google Scholar] [CrossRef]
- Wu, P.D.; Guo, X.Q.; Qiao, H.; Lloyd, D.J. A constitutive model of twin nucleation, propagation and growth in magnesium crystals. Mater. Sci. Eng. A 2015, 625, 140–145. [Google Scholar] [CrossRef]
- Lou, X.; Li, M.; Boger, R.; Agnew, S.; Wagoner, R. Hardening evolution of AZ31B Mg sheet. Int. J. Plast. 2007, 23, 44–86. [Google Scholar] [CrossRef]
- Wu, L. Mechanical Behavior and the Role of Deformation Twinning in Wrought Magnesium Alloys Investigated Using Neutron and Synchrotron X-ray Diffraction. Ph.D. Thesis, University of Tennessee, Knoxville, TN, USA, 2009. [Google Scholar]
- Aagesen, L.K.; Adams, J.F.; Allison, J.E.; Andrews, W.B.; Araullo-Peters, V.; Berman, T.; Chen, Z.; Daly, S.; Das, S.; de Wittet, S.; et al. PRISMS: An Integrated, Open-Source Framework for Accelerating Predictive Structural Materials Science. JOM 2018, 70, 2298–2314. [Google Scholar] [CrossRef] [Green Version]
- Yaghoobi, M.; Stopka, K.S.; Lakshmanan, A.; Sundararaghavan, V.; Allison, J.E.; McDowell, D.L. PRISMS-Fatigue computational framework for fatigue analysis in polycrystalline metals and alloys. Npj Comput. Mater. 2021, 7, 1–12. [Google Scholar] [CrossRef]


Publisher’s Note: MDPI stays neutral with regard to jurisdictional claims in published maps and institutional affiliations. |
© 2021 by the authors. Licensee MDPI, Basel, Switzerland. This article is an open access article distributed under the terms and conditions of the Creative Commons Attribution (CC BY) license (https://creativecommons.org/licenses/by/4.0/).
Share and Cite
Yaghoobi, M.; Voyiadjis, G.Z.; Sundararaghavan, V. Crystal Plasticity Simulation of Magnesium and Its Alloys: A Review of Recent Advances. Crystals 2021, 11, 435. https://doi.org/10.3390/cryst11040435
Yaghoobi M, Voyiadjis GZ, Sundararaghavan V. Crystal Plasticity Simulation of Magnesium and Its Alloys: A Review of Recent Advances. Crystals. 2021; 11(4):435. https://doi.org/10.3390/cryst11040435
Chicago/Turabian StyleYaghoobi, Mohammadreza, George Z. Voyiadjis, and Veera Sundararaghavan. 2021. "Crystal Plasticity Simulation of Magnesium and Its Alloys: A Review of Recent Advances" Crystals 11, no. 4: 435. https://doi.org/10.3390/cryst11040435