Article

Improving the Ionic Conductivity of the LLZO–LZO Thin Film through Indium Doping

1
School of Materials and Energy, University of Electronic Science and Technology of China, Chengdu 611731, China
2
Hunan Aerospace Huanyu Communication Technology Co., LTD., Changsha 410006, China
3
State Key Laboratory of Space Power-Sources Technology, Shanghai Institute of Space Power-Sources, Shanghai 200245, China
4
Shenzhen Clean Energy Research Institute, Shenzhen 518045, China
*
Author to whom correspondence should be addressed.
Crystals 2021, 11(4), 426; https://doi.org/10.3390/cryst11040426
Submission received: 2 March 2021 / Revised: 11 April 2021 / Accepted: 13 April 2021 / Published: 15 April 2021
(This article belongs to the Special Issue Synthesis, Structure and Property Analysis of Crystalline Layers)

Abstract

:
A solid-state electrolyte with an ionic conductivity comparable to that of a liquid electrolyte is demanded of all-solid-state lithium-ion batteries. Li7La3Zr2O12 (LLZO) is considered to be a promising candidate due to its good thermal stability, high ionic conductivity, and wide electrochemical window. However, the synthesis of a stable cubic-phase LLZO thin film with enhanced densification at a relatively low thermal treatment temperature is yet to be developed. Indium is predicted to be a possible dopant to stabilize the cubic-phase LLZO (c-LLZO). Herein, via a nanolayer stacking process, a LLZO–Li2CO3–In2O3 multilayer solid electrolyte precursor was obtained. After thermal annealing at different temperatures, the effects of indium doping on the formation of c-LLZO and the ionic conductivities of the prepared LLZO–LZO thin film were systematically investigated. The highest ionic conductivity of 9.6 × 10⁻⁶ S·cm–1 was obtained at an annealing temperature of 800 °C because the incorporation of indium promoted the formation of c-LLZO and the highly conductive LLZO–LZO interfaces. At the end, a model of LLZO–LZO interface-enhancing ionic conductivity was proposed. This work provides a new approach for the development of low-temperature LLZO-based, solid-state thin-film batteries.

1. Introduction

Recent developments in the field of electrical vehicles and wearable devices have generated great interest in all-solid-state lithium-ion batteries because of their promising high-energy density and safety. A critical component of this type of battery is a solid electrolyte with an ionic conductivity comparable to that of a liquid, but finding one is still challenging [1].
Among the various solid electrolytes, cubic-phase garnet-type Li7La3Zr2O12 (LLZO) is considered to be a potential candidate for its good thermal stability, high ionic conductivity (10−3–10−4 S·cm−1), and wide electrochemical window [2,3,4]. Previous studies have shown that the cubic-phase LLZO is easily transformed into a tetragonal phase at room temperature, leading to a decrease in ionic conductivity by two orders of magnitude [5]. It has been demonstrated that high-valent cation doping can stabilize the cubic phase at room temperature while creating additional Li+ vacancies and therefore improving ionic conductivity [6,7]. Based on this principle, Al3+, Ga3+, Cr3+, Fe3+, Sc3+, Ta5+, and Nb5+, have been introduced to substitute for the cations at the Li or Zr site [8,9,10,11,12,13,14] with significantly improved conductivities. Lincoln et al. calculated the defect energy and site preference of all possible dopants into LLZO by the density functional theory (DFT), which indicated that indium would be a possible dopant [15]. However, systematic investigations of indium doping into LLZO are still rare [16].
Moreover, generating a LLZO electrolyte with a dense structure and high Li concentration can also effectively improve ionic conductivity. For bulk pellets, the high density and high Li concentration are typically obtained by a rigorous fabrication process and excess Li supplement during thermal treatment, respectively [17,18]. However, unlike its bulk counterpart, the ionic conductivity in LLZO thin film is generally reported below 10−5 S cm−1 [19]. This is usually caused by serious Li evaporation during the physical vapor deposition (PVD) preparation and post-annealing process, which may result in the formation of the La2Zr2O7 (LZO) phase and not a dense grain boundary with lower ionic conductivities [20,21]. Thus, improving the crystallization and densification in LLZO thin film at a relatively low thermal treatment temperature has received considerable attention.
Several attempts have been made to eliminate the loss of lithium, so as to improve the ionic conductivities in the grains and grain boundary during deposition. Lithium compounds are reported to have been recently introduced into LLZO by a co-deposition process to produce a Li-stuffed thin film. Rawlence et al. used the RF magnetron sputtering approach to prepare Ga3+ doped LLZO films by the simultaneous sputtering of Ga2O3 and Li2O to give rise to a thin film with an ionic conductivity of 1.6 × 10⁻⁵ S cm−1 [22]. Pfenninger et al. proposed a physical vapor deposition (PLD) method using Li3N as Li source to prepare a Li3N–LLZO multilayer precursor film [23]. After the post-annealing process, a garnet-type LLZO thin film with an ion conductivity of 2.9 × 10⁻⁵ S cm−1 was obtained. Considering that Li2CO3 is less affected by water and oxygen than Li2O is and that no additional elements were introduced during the preparation process, Zhu et al. designed a synthesis strategy of preparation and annealing the LLZO–Li2CO3–Ga2O3 multilayered precursor [24]. In their proposed process, an amorphous domain between LLZO grains was constructed as the grain boundary, thus reducing the space-charge layer and releasing the trapped Li+ in the grain boundary. The origin of the pores in the grain boundaries may limit the electrochemical stability of the LLZO thin film, but this is yet to be investigated. As the above research shows, Ga3+ doping or an excessive lithium supplement could promote the formation of the highly conductive cubic-LLZO phase. However, the Li-deficient LZO phase still inevitably exists in the proposed LLZO–LZO thin films prepared by the multilayer precursor preparation process [23,24], which could be attributed to the relatively low annealing temperature and adopted in the present study as well.
In this work, the indium-doped LLZO–LZO thin film was prepared via a nanolayer-stacking process followed by annealing at various temperatures. In order to facilitate the interdiffusion between the layers, the thickness of the films should be controlled to the nanometer level according to Johnson et al. [25]. Therefore, the precursors were obtained by repeatedly depositing the LLZO–Li2CO3–In2O3 multilayer on the substrate. By comparing the morphology and phase structure of the indium-doped LLZO–LZO thin film under different annealing temperatures, the effects of indium doping on the formation and stability of cubic-phase LLZO were investigated. In addition, there was discussion of the origin of the pores between the grain boundaries, which could be attributed to the decomposition of Li2CO3. Finally, the effect of annealing temperature on ionic conductivity for the In-doped LLZO–LZO thin film was explored by impedance spectroscopy measurement, while the highest ionic conductivity of 9.6 × 10⁻⁶ S·cm–1 was obtained. This work also provided a preferred preparation and heat treatment process for future development of LLZO-based thin-film batteries.

2. Materials and Methods

2.1. Preparation of the In-Doped LLZO Thin Film

A combinatorial RF magnetron sputter system [26] was used for the growth of the indium-doped LLZO–LZO thin film. As shown in Figure 1, the In-doped LLZO–LZO thin film precursor was prepared by the sequential and repeated deposition of the LLZO, Li2CO3, and In2O3 thin film on a 650 μm-thick 24 × 14 mm2 conductive p-type silicon substrate (100) with a native 400 nm amorphous Si3N4 insulating layer on the surface. From the viewpoint of the solid-state batteries, one of its important applications is to serve as the capacity storage unit of a micro-electronic system, which is mostly prepared on silicon wafers. In this work, the wafers were chosen for the substrate instead of the expensive MgO that was used in the previous work [24]. The LLZO, Li2CO3, and In2O3 thin film was deposited from the Li7La3Zr2O12 (99.9%, JiangYin DianYu New Materials Technology Co., China.), Li2CO3 (99.9%, JiangYin DianYu New Materials Technology Co., Jiangyin, China), and In2O3 (99.99%, Zhongnuo New Materials Manufacturing Co., Beijing, China) targets, respectively. The working pressure for the deposition is 1 Pa, while the power density for LLZO was 2.38 W cm−2, and 1.90 W cm−2 for the others. Each thickness of the thin film was controlled to be 7 nm, 0.8 nm, and 6 nm for LLZO, Li2CO3, and In2O3 respectively, while the whole thickness was 1550 nm because the stacked LLZO–Li2CO3–In2O3 multilayer structure was repeated 80 times. After annealing at 600 °C, 700 °C, 800 °C for 2 h with a heating rate of 5 °C/min from room temperature to 500 °C and 1 °C/min above 500 °C, the indium doped LLZO–LZO thin films with different annealing temperatures were prepared. The detailed preparation parameters of the LLZO–LZO thin films are listed in the Table 1.

2.2. Characterization

The thickness of the In2O3, LLZO, and Li2CO3 thin film was measured by a surface profiler (Dektak, XT) as shown in Tables S1–S3, respectively. The crystallization of the indium doped LLZO–LZO thin film was examined via an X-ray diffraction (XRD, Bruker D8 advance) using a Cu-Kα wavelength with 2θ in the range from 20 to 70°. A time-of-flight secondary ion mass spectrometry (TOF-SIMS) is used to measure the chemical composition of the LLZO–LZO thin film in-depth after the multilayer interdiffusion process. The microstructure of the prepared thin films was performed by a scanning electron microscope (SEM, JSM-7600F). After depositing the two 4 × 8 mm2, 200 nm-thick square Au top contacts with 3 mm electrode spacing (the same pattern as shown in the previous work [24]) on the surface of the thin films by the sputter technique, in-plane electrochemical impedance spectroscopy (EIS) was obtained using an electrochemical workstation (Ametek VersaSTAT 3F) with a frequency range from 1 × 10⁶ and 1 Hz at room temperature (25 °C). Zview software was used to process the data of EIS so that the ionic conductivity could be calculated.

3. Results and Discussion

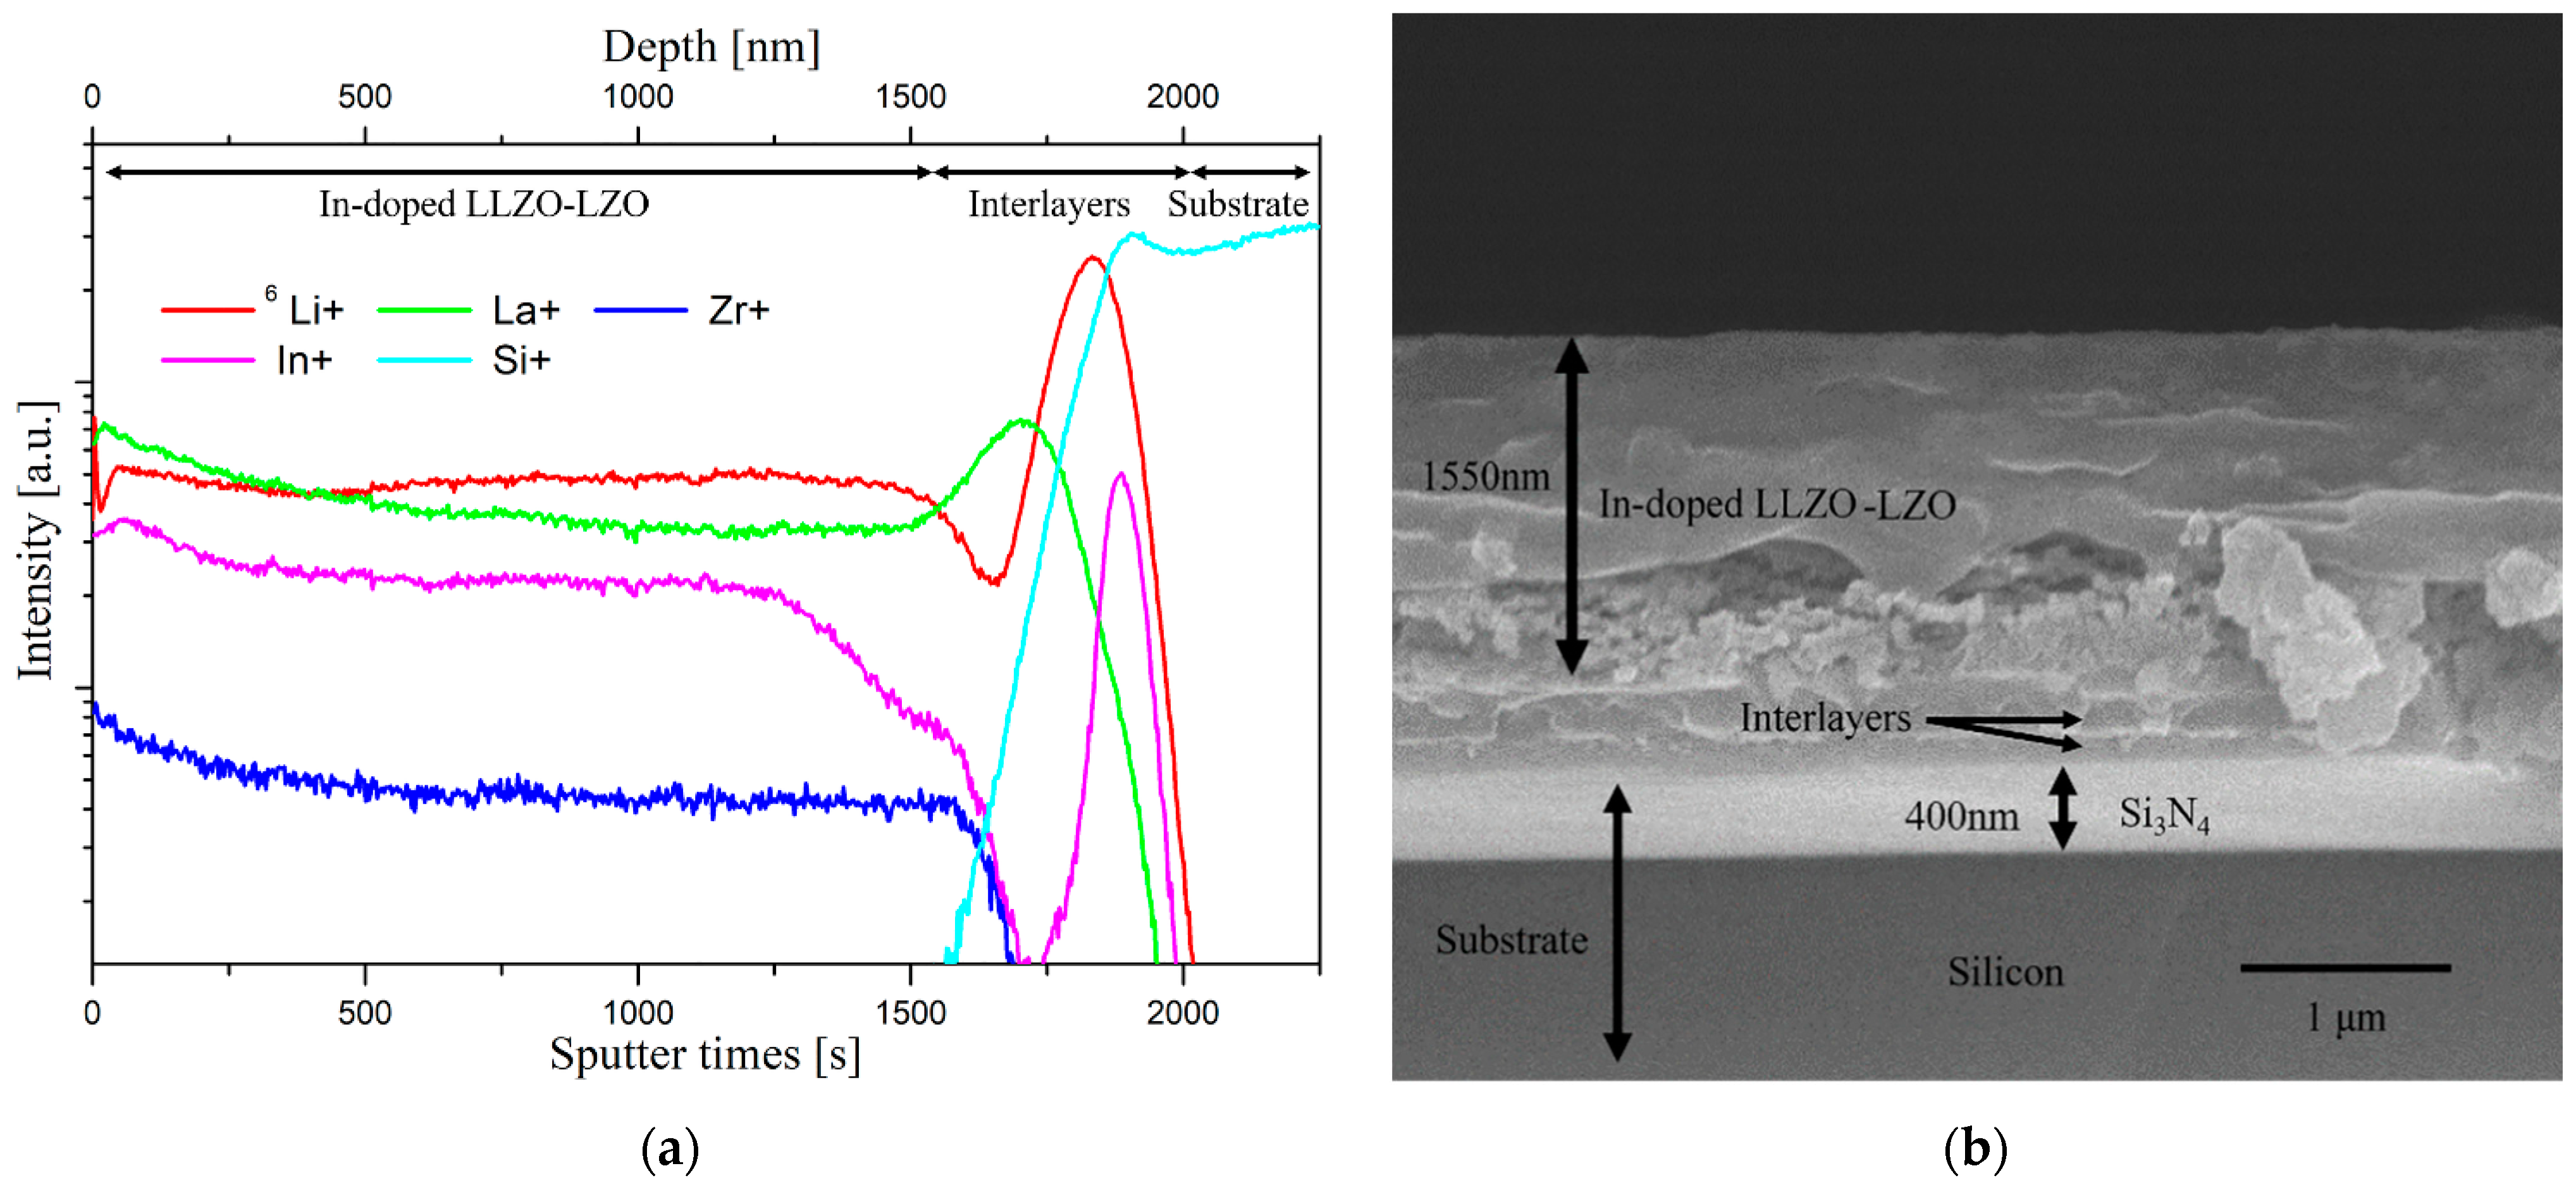
3.1. Synthesis of the Indium Doped LLZO–LZO Thin Film

In this work, the nanolayer stacking process was used to prepare the indium-doped LLZO–LZO thin film precursor [26]. It revealed a repeated LLZO–Li2CO3–In2O3 multilayer structure and that the thickness of the Li2CO3 layers could be adjusted to ensure the introduction of extra Li according to the extent of Li-loss. To obtain a uniform composition along the stacking direction of the sample, the precursor was annealed at different temperatures from 600 to 800 °C for 2 h to facilitate the interdiffusion between the different layers. A TOF-SIMS characterization was performed to reveal the compositional depth profiles of the In-doped LLZO–LZO thin film until the silicon substrate was reached. As shown in Figure 2a, the compositional depth profile of #600-IL indicated that a uniform distribution of Li, La, Zr, and In elements as a function of the sputter time was obtained for about 1500 nm below the surface. It confirmed that the interdiffusion had successfully created a uniform element distribution during the annealing process. The Si+ signal intensity started to increase when the etching time was more than the 1500 s, while the intensities of the Li+, La+, Zr+, and In+ signals first decreased and then increased. The result was also in good accordance with the cross-section microstructure of the prepared sample as depicted in Figure 2b, which showed a LLZO–LZO thin film with a thickness of 1550 nm, while two interlayers could be observed between the substrate and the homogenous LLZO–LZO layer [27]. Combined with the compositional depth profiles, the two interlayers might be ascribed to the formation of La–In–Si–O and Li–In–Si–O, while the detailed compositions need further analysis.

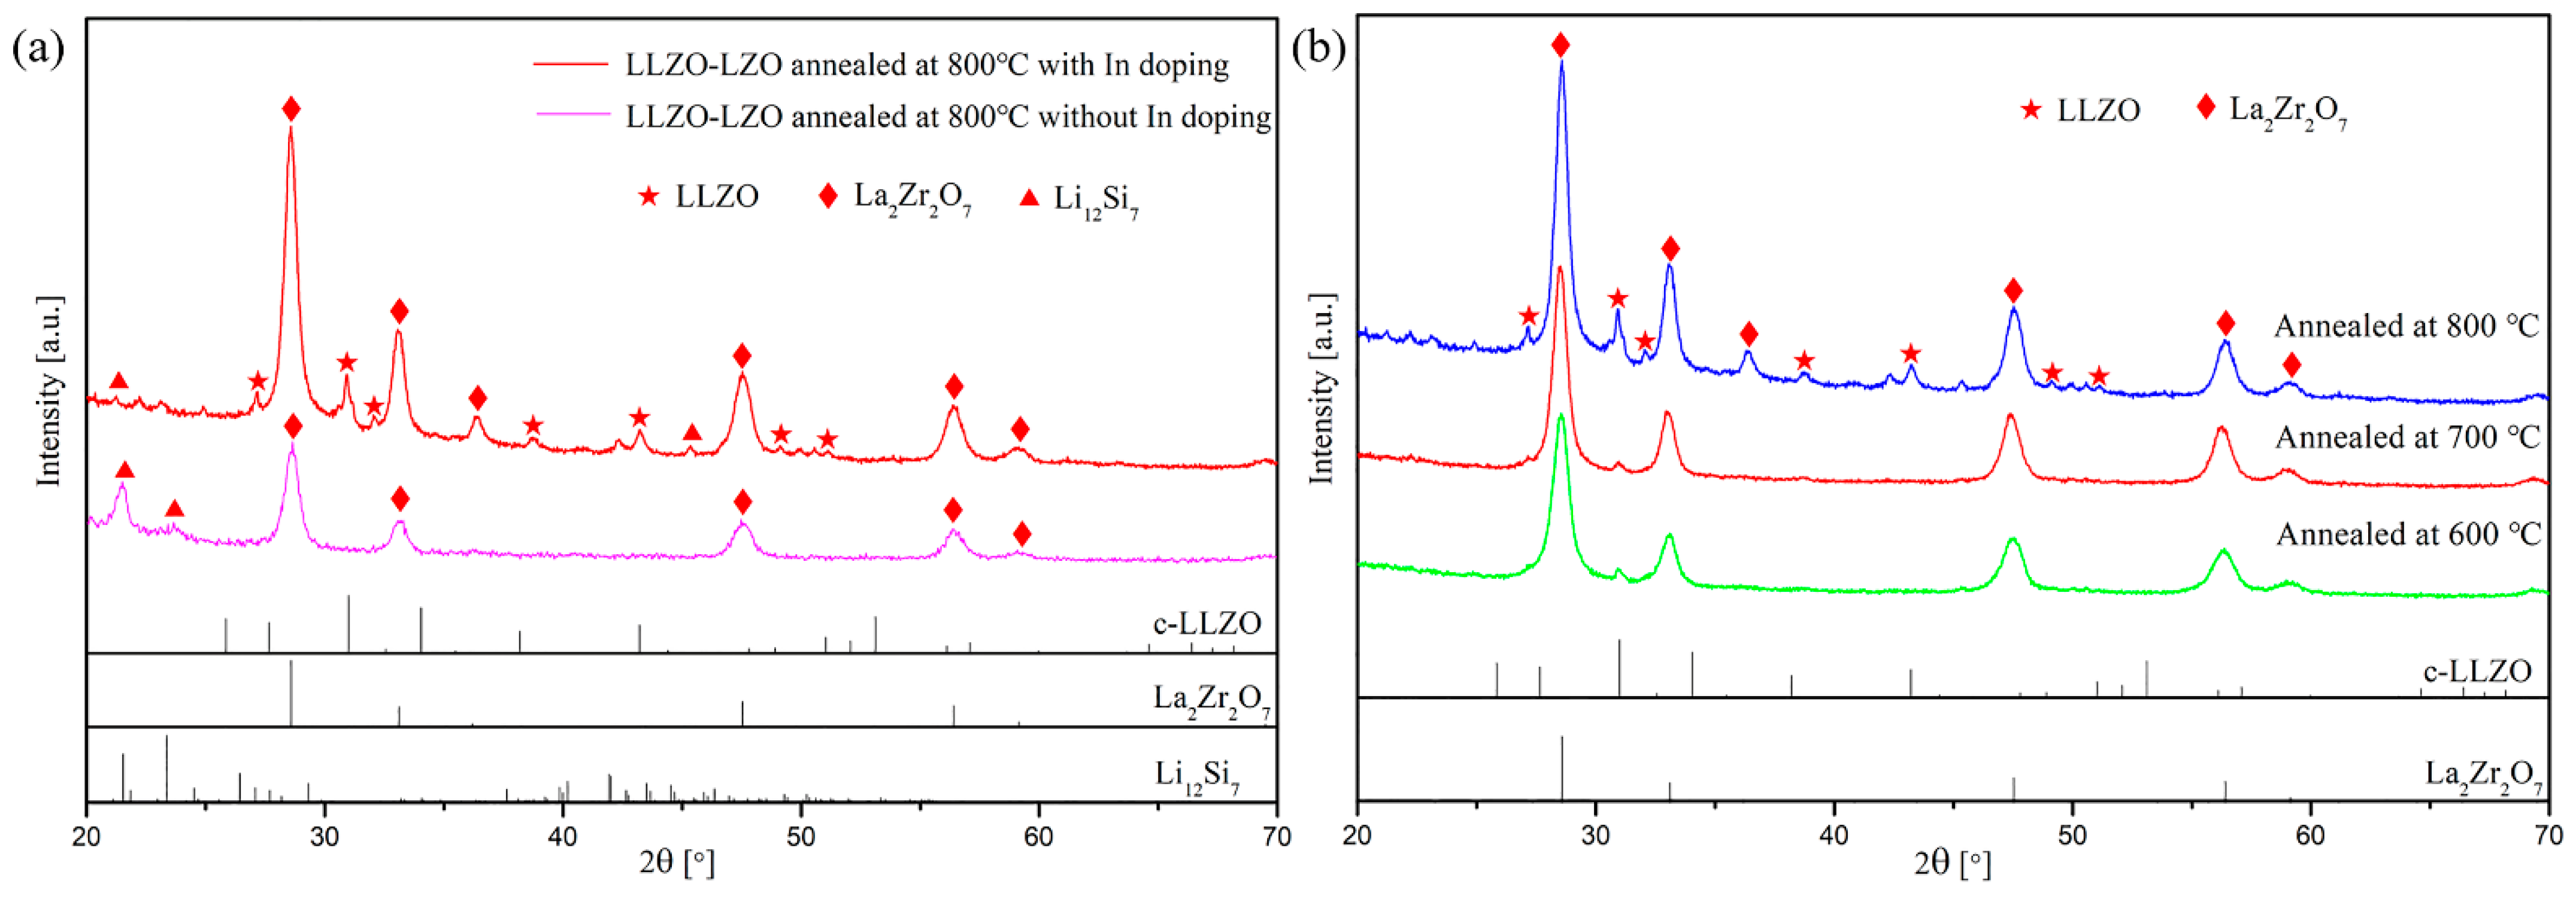
3.2. The Effect of Indium Doping on the Formation of Cubic-Phase LLZO

The XRD patterns for the LLZO–LZO thin films with and without indium doping that were annealed at 800 °C are displayed in Figure 3a. Significant differences were observed between the two diffraction patterns. Both LLZO–LZO thin films exhibited main diffraction peaks at 28.6°, 33.1°, 36.2°, 47.5°, 56.4°, and 59.2°, which can be attributed to the La2Zr2O7 phase (PDF#73-0444). In addition, the In-doped sample also showed diffraction peaks at 27.7°, 31°, 32.5°, 38.2°, 43.2°, 48.9°, and 51.1°, which fit well with the cubic-phase LLZO (c-LLZO; PDF#80-0457) and was not observed in the LLZO thin film without indium doping. Moreover, the peaks at 21.5° and 23.4° in both samples could be assigned to the Li12Si7 phase (PDF#89-0008), which was consistent with the SEM results mentioned above and most likely appeared near the substrate. A comparison between the two XRD patterns showed that the main constituent of the film was a pyrochlore La2Zr2O7 phase, and the In-doped LLZO–LZO thin film demonstrated much higher cubic-phase LLZO peak intensities, implying that indium doping promoted the formation of the cubic phase at 800 °C.

3.3. The Microstructure and Preferred Crystal Phases under Various Annealing Temperatures

As shown in Figure 3b, all In-doped samples annealed at different temperatures contained the La2Zr2O7 phase, while the characteristic peak of c-LLZO could also be observed at 31° for all samples. It was also apparent that with the increasing annealing temperature, the intensity of the characteristic peak at 2θ = 31° corresponding to the c-LLZO phase was gradually enhanced. It was consistent with the former literature reported by Joong et al. [28] that a higher temperature promotes the formation of LLZO phase starting at about 600 °C. However, all peaks corresponding to La2Zr2O7 follow the same trend as LLZO, indicating the grain growth of the La2Zr2O7 crystal structure.
The microstructures of the In-doped LLZO–LZO thin films annealed at different temperatures are shown in Figure 4. For all the samples, the porous and uniformly distributed surfaces were clearly observed with an average grain size of 50 nm. However, the porosity gradually increased as the annealing temperature increased. The relatively dense thin film was obtained at the annealing temperature of 600 °C. The possible reason for the pore generation could be attributed to the decomposition of Li2CO3 during the annealing process, which was confirmed by the comparation between the morphologies of the lithium-supplemented and unsupplemented LLZO–LZO thin film under a thermal treatment at 700 °C. As shown in Figure 5a,b, no obvious porous microstructure was observed on the surface of the film prepared without the Li2CO3 layer, while large pores appeared in the Li-supplemented sample. In addition, as shown in Figure 5c, the cross-section of sample #700-IL showed that a large number of pores was also generated inside the film. This may have been attributed to the decomposition of Li2CO3 during the thermal treatment of which the decomposition temperature was near 700 °C, and therefore caused the evaporation of CO2 gas from the film. This led to the generation of the pores that interfered with the formation of the local dense structure. Such a process is aggravated at higher temperatures, thus giving rise to a more porous structure. Considering that dense structure plays an important role in providing the high ionic conductivity of LLZO–LZO thin films, the sample that was annealed at 600 °C would probably be a better candidate for film densification compared to the other two if they had the same content of the conductive c-LLZO.

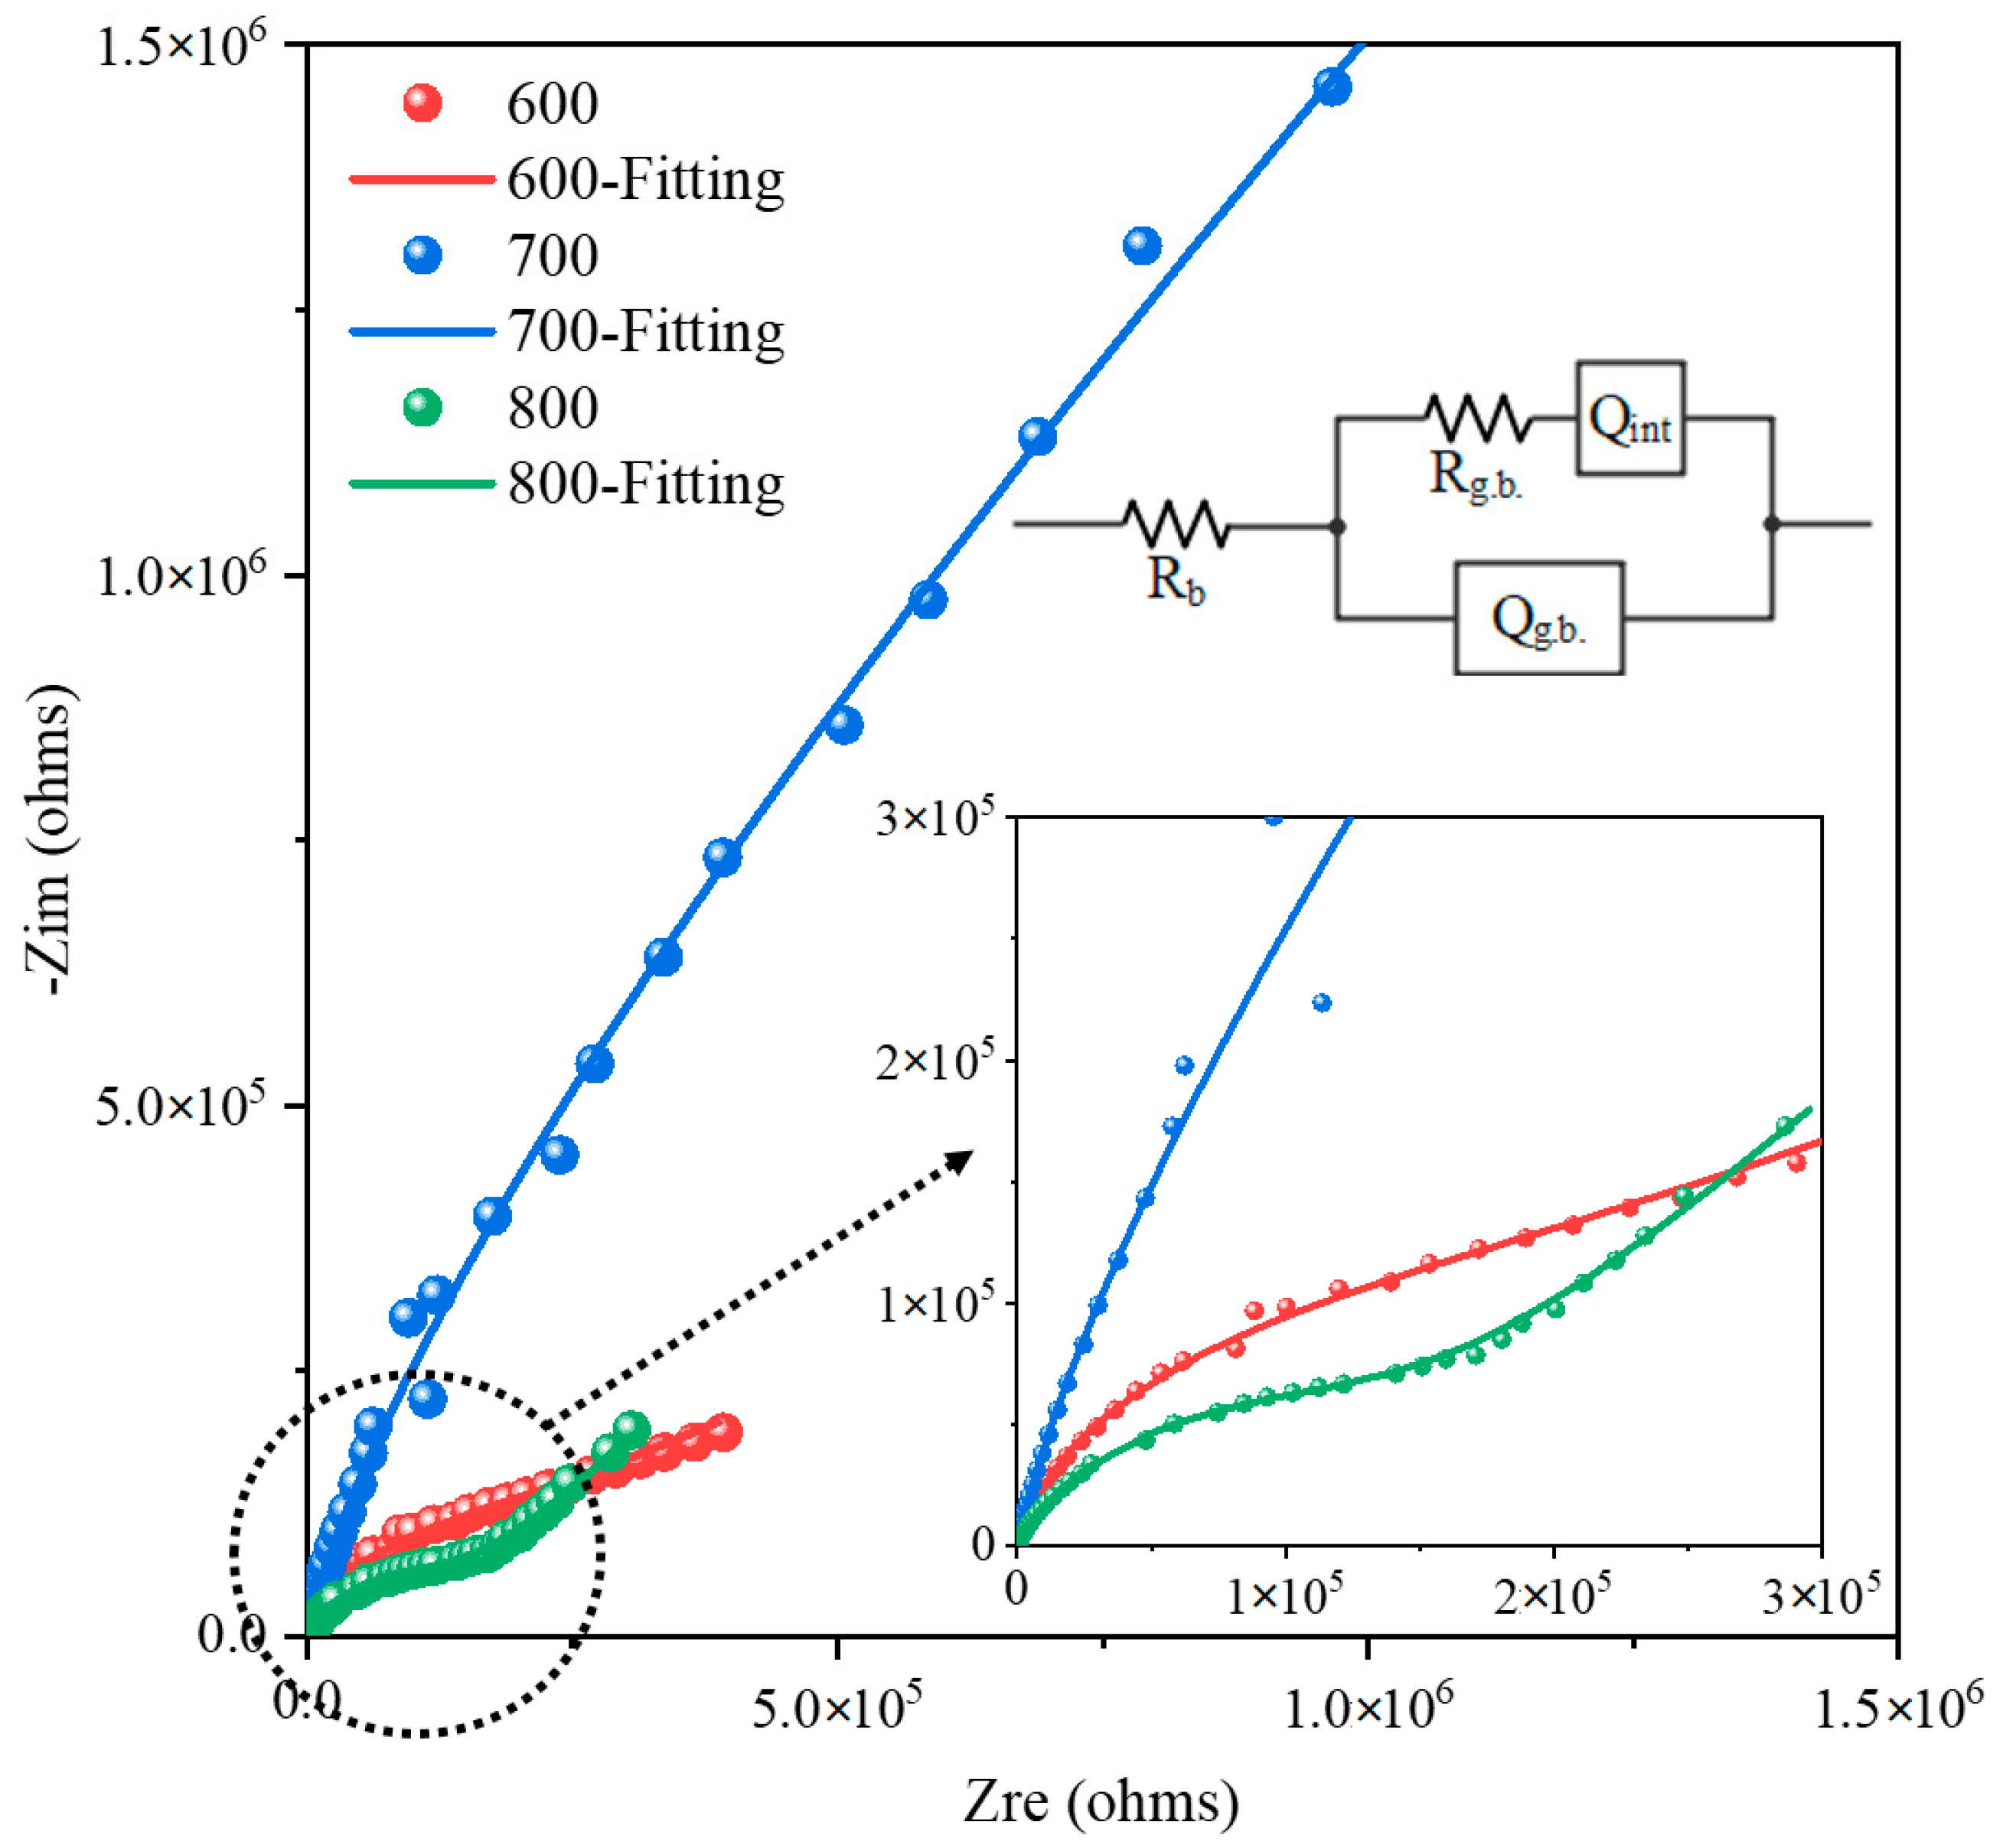
3.4. Electrochemical Impedance Spectroscopy Analysis of In-Doped LLZO–LZO Thin Films

Figure 6 shows the Nyquist plots of the In-doped LLZO samples annealing at 600 °C, 700 °C and 800 °C, measured with an in-plane (Au–LLZO–Au) technique at room temperature [24], while the contact structure was prepared by the sputter technique with the same pattern as shown in the previous work [24]. In addition, the inset in Figure 6 illustrated the equivalent circuit for data fitting, which contains the bulk conductance (Rbulk), grain boundary conductance (Rg.b. and Cg.b.), and charge polarization at the electrode–electrolyte interface (Qint). The calculated σb, σg.b., and σtotal at room temperature of the samples are summarized in Table 2 and were calculated using the same method as in the literature [27]. However, the LLZO–Li2CO3–In2O3 thin film annealed at 800 °C gave the lowest grain boundary impendence resulting in the highest ionic conductivity of 9.6×10⁻⁶ S·cm–1, which produced a higher ionic conductivity than that of the LLZO thin film as shown in Table 3 [29,30]. This may be mainly attributable to the indium incorporation, which promoted the formation of c-LLZO and therefore lowered the total resistance. The sample that was annealed at 600 °C had a higher ionic conductivity than that of the sample annealed at 700 °C as a result of the higher density of the thin film. In summary, this work provides a preferred heat treatment with an annealing temperature of 800 °C, which gives the highest ionic conductivity.
In summary, there are two major factors that contributed to the high conductivity of the film in this work: a densified film structure and a high content of the conductive c-LLZO; therefore, a model of the LLZO–LZO interface to enhance ionic conductivity was proposed as shown in Figure 7. In the model, the orange, blue and gray spheres represent the LLZO grain, and the LZO grain and pore, respectively. More pores were observed in the sample that was annealed at 700 °C and 800 °C, while the dense film was prepared by annealing at 600 °C. The formation of the c-LLZO phase was promoted at a higher annealing temperature, thus giving rise to the LLZO–LZO interface. In addition, the formation of the c-LLZO resulted in the relatively higher grain ionic conductivity. According to the grain boundary ionic conductivities extracted from the equivalent circuit of the impedance spectra, the highest σg.b. of 9.62 × 10⁻⁶ S·cm–1 was obtained at the annealing temperature of 800 °C. It could be attributed to the presence of the LLZO–LZO interface, which may have a lower interface impedance. Overall, the annealing temperature of 800 °C promoted the crystallization of c-LLZO and the formation of the highly conductive LLZO–LZO interface, resulting in the highest ionic conductivity.

4. Conclusions

Herein, a LLZO–Li2CO3–In2O3 nanolayer stacking process followed by thermal annealing was proposed to synthesize the indium-doped LLZO–LZO thin film solid electrolytes. In addition, a new approach to depositing Li2CO3 as the lithium supplement source was explored to overcome the issue of lithium loss during the deposition and heat-treatment process. Importantly, the incorporation of indium promoted the crystallization of cubic LLZO, and such a phase became more stable as the annealing temperature increased. However, the decomposition of Li2CO3 was also intensified at higher temperatures, which led to the generation of more pores at the grain boundary and more severe structural damage that caused the densification of the LLZO–LZO thin film to deteriorate. Finally, the effect of the annealing temperature on ionic conductivity for the In-doped LLZO–LZO thin film was explored by impedance spectroscopy. Thus, by considering both the formation of c-LLZO and the integrity of the thin-film structure, the highest ionic conductivity of 9.6 × 10⁻⁶ S·cm–1 was obtained at the annealing temperature of 800 °C. The result could be attributable to the indium incorporation, which promoted the formation of c-LLZO and of the highly conductive LLZO–LZO interface, which lowered the total resistance. This work provides a preferred preparation and heat-treatment process for future LLZO-based solid electrolytes, which may facilitate the development of solid-state batteries.

Supplementary Materials

The following are available online at https://www.mdpi.com/article/10.3390/cryst11040426/s1, Table S1: The thickness of In2O3 thin film after repeating depositing 120 layers, Table S2: The thickness of LLZO thin film after repeating depositing 80 layers, Table S3: The thickness of Li2CO3 thin film after repeating depositing 400 layers.

Author Contributions

Conceptualization, Z.Y. and Y.X.; methodology, S.W.; investigation, Y.S., Y.Z. and S.W.; data curation, S.W. and R.G.; writing—original draft preparation, Z.Y.; writing—review and editing, X.W. and J.C.; visualization, S.S.; supervision, Y.X.; funding acquisition, Y.X. and Y.W. All authors have read and agreed to the published version of the manuscript.

Funding

This research was funded by the National Key Research and Development Program of China (No. 2016YFB0700201, No. 2017YFB0702802 and 2018YFB0905400), Shanghai Venus Project (No. 18QB1402600) and the startup funds from the University of Electronic Science and Technology of China.

Institutional Review Board Statement

Not applicable.

Informed Consent Statement

Not applicable.

Data Availability Statement

The data presented in this study are available in this article.

Conflicts of Interest

The authors declare no conflict of interest.

References

  1. Wang, Y.; Richards, W.D.; Ong, S.P.; Miara, L.J.; Kim, J.C.; Mo, Y.; Ceder, G. Design principles for solid-state lithium superionic conductors. Nat. Mater. 2015, 14, 1026–1031. [Google Scholar] [CrossRef] [PubMed]
  2. Murugan, R.; Thangadurai, V.; Weppner, W. Fast lithium ion conduction in garnet-type Li7La3Zr2O12. Angew. Chem. Int. Ed. 2007, 46, 7778–7781. [Google Scholar] [CrossRef] [PubMed]
  3. Albertus, P.; Babinec, S.; Litzelman, S.; Newman, A. Status and challenges in enabling the lithium metal electrode for high-energy and low-cost rechargeable batteries. Nat. Energy 2017, 3, 16–21. [Google Scholar] [CrossRef]
  4. Gao, Z.; Sun, H.; Fu, L.; Ye, F.; Zhang, Y.; Luo, W.; Huang, Y. Promises, challenges, and recent progress of inorganic solid-state electrolytes for allsolid-state lithium batteries. Adv. Mater. 2018, 30, e1705702. [Google Scholar] [CrossRef]
  5. Larraz, G.; Orera, A.; Sanz, J.; Sobrados, I.; Diez-Gomez, V.; Sanjuan, M.L. NMR study of Li distribution in Li7-xHxLa3Zr2O12 garnets. J. Mater. Chem. A 2015, 3, 5683–5691. [Google Scholar] [CrossRef] [Green Version]
  6. Orera, A.; Larraz, G.; Alberto, R.J.; Campo, J.; Sanjuán, M.L. Influence of Li+ and H+ Distribution on the Crystal Structure of Li7-xHxLa3Zr2O12 (0 ≤ x ≤ 5) Garnets. Inorg. Chem. 2016, 55, 1324–1332. [Google Scholar] [CrossRef] [PubMed] [Green Version]
  7. Thompson, T.; Wolfenstine, J.; Allen, J.L.; Johannes, M.; Huq, A.; David, I.N.; Sakamoto, J. Tetragonal vs. cubic phase stability in Al-free Ta doped Li7La3Zr2O12 (LLZO). J. Mater. Chem. A 2014, 2, 13431–13436. [Google Scholar] [CrossRef]
  8. Ahn, J.H.; Park, S.Y.; Lee, J.M.; Park, Y.; Lee, J. Local impedance spectroscopic and microstructural analyses of Al-in-diffused Li7La3Zr2O12. J. Power Sources 2014, 254, 287–292. [Google Scholar] [CrossRef]
  9. Rettenwander, D.; Redhammer, G.; Preishuberpflugl, F.; Cheng, L.; Amthauer, G. Structural and Electrochemical Consequences of Al and Ga Cosubstitution in Li7La3Zr2O12 Solid Electrolytes. Chem. Mater. 2016, 28, 2384–2392. [Google Scholar] [CrossRef] [Green Version]
  10. Li, Y.T.; Wang, C.A.; Xie, H.; Cheng, J.; Goodenough, J.B. High lithium ion conduction in garnet-type Li6La3ZrTaO12. Electrochem. Commun. 2011, 13, 1289–1292. [Google Scholar] [CrossRef]
  11. Song, S.F.; Yan, B.G.; Zheng, F.; Duong, H.M.; Lu, L. Crystal structure, migration mechanism and electrochemical performance of Crstabilized garnet. Solid State Ion. 2014, 268, 135–139. [Google Scholar] [CrossRef]
  12. Wagner, R.; Redhammer, G.J.; Rettenwander, D.; Tippelt, G.; Welzl, A.; Taibl, S.; Fleig, J.; Franz, A.; Lottermoser, W.; Amthauer, G. Fast Li-Ion-Conducting Garnet-Related Li7-3xFexLa3Zr2O12 with Uncommon I43d Structure. Chem. Mater. 2016, 28, 5943–5951. [Google Scholar] [CrossRef] [PubMed] [Green Version]
  13. Wu, J.F.; Chen, E.Y.; Yu, Y.; Liu, L.; Wu, Y.; Pang, W.K.; Peterson, V.K.; Guo, X. Gallium-Doped Li7La3Zr2O12 Garnet-Type Electrolytes with High Lithium-Ion Conductivity. ACS Appl. Mater. Interfaces 2017, 9, 1542–1552. [Google Scholar] [CrossRef] [PubMed] [Green Version]
  14. Huang, M.A.; Shoji, M.; Shen, Y.; Nan, C.; Munakata, H.; Kanamura, K. Preparation and electrochemical properties of Zr-site substituted Li7La3(Zr2-xMx)O12 (M = Ta, Nb) solid electrolytes. J. Power Sources 2014, 261, 206–211. [Google Scholar] [CrossRef]
  15. Miara, L.J.; Richards, W.D.; Wang, Y.E.; Ceder, G. First Principles Studies on Cation Dopants and Electrolyte/Cathode Interphases for Lithium Garnets. Chem. Mater. 2015, 27, 4040–4047. [Google Scholar] [CrossRef]
  16. Huang, M.; Dumon, A.; Nan, C.-W. Effect of Si, In and Ge doping on high ionic conductivity of Li7La3Zr2O12. Electrochem. Commun. 2012, 21, 62–64. [Google Scholar] [CrossRef]
  17. Kotobuki, M.; Munakata, H.; Kanamura, K.; Sato, Y.; Yoshida, T. Compatibility of Li7La3Zr2O12 solid electrolyte to all-solid-state battery using Li metal anode. J. Electrochem. Soc. 2010, 157, A1076–A1079. [Google Scholar] [CrossRef]
  18. Ohta, S.; Kobayashi, T.; Asaoka, T. High lithium ionic conductivity in the garnet-type oxide Li7−xLa3(Zr2−x, Nbx)O12 (x = 0–2). J. Power Sources 2011, 196, 3342–3345. [Google Scholar] [CrossRef]
  19. Van den Broek, J.; Afyon, S.; Rupp, J.L.M. Interface-Engineered All-Solid-State Li-Ion Batteries Based on Garnet-Type Fast Li+ Conductors. Adv. Energy Mater. 2016, 6, 1600736. [Google Scholar] [CrossRef] [Green Version]
  20. Langer, F.; Glenneberg, J.; Bardenhagen, I.; Kun, R. Synthesis of Single Phase Cubic Al-Substituted Li7La3Zr2O12 by Solid State Lithiation of Mixed Hydroxides. J. Alloy. Compd. 2015, 645, 64–69. [Google Scholar] [CrossRef]
  21. Chen, R.-J.; Huang, M.; Huang, W.-Z.; Shen, Y.; Lin, Y.-H.; Nan, C.-W. Effect of Calcining and Al Doping on Structure and Conductivity of Li7La3Zr2O12. Solid State Ion. 2014, 265, 7–12. [Google Scholar] [CrossRef]
  22. Rawlence, M.; Filippin, A.N.; Wackerlin, A.; Lin, T.; Cuervo-Reyes, E.; Remhof, A.; Battaglia, C.; Rupp, J.L.M.; Buecheler, S. Effect of Gallium substitution on Lithium-ion conductivity and phase evolution in sputtered Li7–3xGaxLa3Zr2O12 thin films. ACS Appl. Mater. Interfaces 2018, 10, 13720–13728. [Google Scholar] [CrossRef]
  23. Pfenninger, R.; Struzik, M.; Garbayo, I.; Stilp, E.; Rupp, J. A low ride on processing temperature for fast lithium conduction in garnet solid-state battery films. Nat. Energy 2019, 4, 475–483. [Google Scholar] [CrossRef]
  24. Zhu, Y.; Wu, S.; Pan, Y.; Zhang, X.; Yan, Z.; Xiang, Y. Reduced Energy Barrier for Li+ Transport Across Grain Boundaries with Amorphous Domains in LLZO Thin Films. Nanoscale Res. Lett. 2020, 15, 153. [Google Scholar] [CrossRef]
  25. Fister, L.; Johnson, D. Controlling solid-state reaction mechanisms using diffusion length in ultrathin-film superlattice composites. J. Am. Chem. Soc. 1992, 114, 4639–4644. [Google Scholar] [CrossRef]
  26. Yan, Z.; Wu, S.; Song, Y.; Xiang, Y.; Zhu, J. A novel gradient composition spreading and nanolayer stacking process for combinatorial thin-film materials library fabrication. Rev. Sci. Instrum. 2020, 91, 065107. [Google Scholar] [CrossRef]
  27. Lobe, S.; Dellen, C.; Finsterbusch, M.; Gehrke, H.-G.; Sebold, D.; Tsai, C.-L.; Uhlenbruck, S.; Guillon, O. Radio frequency magnetron sputtering of Li7La3Zr2O12 thin films for solid-state batteries. J. Power Sources 2016, 307, 684–689. [Google Scholar] [CrossRef] [Green Version]
  28. Park, J.S.; Cheng, L.; Zorba, V.; Mehta, A.; Cabana, J.; Chen, G.; Doeff, M.M.; Richardson, T.J.; Park, J.H.; Son, J.; et al. Effects of crystallinity and impurities on the electrical conductivity of Li-La-Zr-O thin films. Thin Solid Films 2015, 576, 55–60. [Google Scholar] [CrossRef] [Green Version]
  29. Nong, J.; Xu, H.; Yu, Z.; Zhu, G.; Yu, A. Properties and preparation of Li-La-Ti-Zr-O thin film electrolyte. Mater. Lett. 2015, 154, 167–169. [Google Scholar] [CrossRef]
  30. Sastre, J.; Lin, T.; Filippin, A.N.; Priebe, A.; Avancini, E.; Michler, J.; Tiwari, A.N.; Romanyuk, Y.E.; Buecheler, S. Aluminum-assisted densification of cosputtered lithium garnet electrolyte films for solid-state batteries. ACS Appl. Energy Mater. 2019, 2, 8511–8524. [Google Scholar] [CrossRef] [Green Version]
Figure 1. The preparation process of the In-doped LLZO–LZO thin film, which contains sequential and repeated deposition of the LLZO, Li2CO3, and In2O3 thin film and heat-treatment at various temperatures.
Crystals 11 00426 g001
Figure 2. (a) TOF-SIMS depth profiles of the sample #600-IL: Si+ (wathet blue), In+ (purple), 6Ll+ (red), La+ (green), and Zr+ (dark blue); (b) the cross-section microstructure of the prepared sample #600-IL.
Crystals 11 00426 g002
Figure 3. (a) The X-ray diffraction patterns for the samples with and without In-doped LLZO–LZO thin films annealed at 800 °C, and (b) the XRD patterns of In-doped thin films annealed at 600 °C (green), 700 °C (red), and 800 °C (blue), respectively.
Crystals 11 00426 g003
Figure 4. The microstructures of the In-doped LLZO–LZO samples annealed at (a,d) 600 °C, (b,e) 700 °C, as well as (c,f) 800 °C (sample #600-IL, #700-IL, and #800-IL, respectively).
Crystals 11 00426 g004
Figure 5. The microstructures of (a) the lithium-supplemented (#700-IL) and (b) unsupplemented (#700-I) In-doped LLZO–LZO samples annealed at 700 °C, and (c) the SEM cross-sectional photo of sample #700-IL.
Crystals 11 00426 g005
Figure 6. The Nyquist diagrams of impedance spectrum of In doped LLZO–LZO samples #800-IL (green line), #700-IL (blue line), and #600-IL (red line) measured at room temperature, insert shows the equivalent circuit
Crystals 11 00426 g006
Figure 7. The model of LLZO–LZO interface enhancing the ionic conductivity.
Crystals 11 00426 g007
Table 1. Samples of LLZO–LZO thin film solid electrolyte and their preparation parameters
SamplesPrecursor StructureAnnealing Temperature (°C)In DopingExtra Lithium
#800-ILLLZO–Li2CO3–In2O3800YY
#800-LLLZO–Li2CO3800NY
#700-ILLLZO–Li2CO3–In2O3700YY
#700-ILLZO–In2O3700YN
#600-ILLLZO–Li2CO3–In2O3600YY
Table 2. Bulk ionic conductivities (σbulk), grain boundary conductivities (σgb), and total ionic conductivities (σtotal) of the In-doped LLZO–LZO thin film with different annealing temperature at room temperature
Samplesσb (S·cm–1)σg.b. (S·cm–1)σtotal (S·cm–1)
#800-IL4.20 × 10−39.62 × 10−69.60 × 10−6
#700-IL2.56 × 10−37.68 × 10−77.68 × 10−7
#600-IL3.83 × 10−35.36 × 10−65.35 × 10−6
Table 3. The comparation of the ionic conductivity between this result with others.
Samplesσtotal (S·cm–1)Prepared MethodReference
In-doped LLZO–LZO9.60 × 10−6RF SputterThis work (#800-IL)
Li7La3Zr2O126.18 × 10−7 RF SputterReference [29]
Li7La3Zr2O122.47 × 10−6RF SputterReference [30]
Publisher’s Note: MDPI stays neutral with regard to jurisdictional claims in published maps and institutional affiliations.

