Article

Processability and Optimization of Laser Parameters for Densification of Hypereutectic Al–Fe Binary Alloy Manufactured by Laser Powder Bed Fusion

1
Department of Materials Process Engineering, Graduate School of Engineering, Nagoya University, Furo-cho, Chikusa-ku, Nagoya 464-8603, Japan
2
Aichi Center for Industry and Science Technology, 1267-1 Akiai, Yakusa-cho, Toyota 470-0356, Japan
*
Authors to whom correspondence should be addressed.
Crystals 2021, 11(3), 320; https://doi.org/10.3390/cryst11030320
Submission received: 5 March 2021 / Revised: 20 March 2021 / Accepted: 22 March 2021 / Published: 23 March 2021

Abstract

:
Centimeter-sized samples of hypereutectic Al–15 mass% Fe alloy were manufactured by a laser powder bed fusion (L-PBF) process while systematically varying laser power (P) and scan speed (v). The effects on relative density and melt pool depth of L-PBF-manufactured samples were investigated. In comparison with other Al alloys, a small laser process window of P = 77–128 W and v = 0.4–0.8 ms−1 was found for manufacturing macroscopically crack-free samples. A higher v and P led to the creation of macroscopic cracks propagating parallel to the powder-bed plane. These cracks preferentially propagated along the melt pool boundaries decorated with brittle θ-Al13Fe4 phase, resulting in low L-PBF processability of Al–15%Fe alloy. The deposited energy density model (using P·v−1/2) would be useful for identifying the optimum L-PBF process conditions towards densification of Al–15%Fe alloy samples, in comparison with the volumetric energy density (using P·v−1), however, the validity of the model was reduced for this alloy in comparison with other alloys with high thermal conductivities. This is likely due to inhomogeneous microstructures having numerous coarsened θ–Al13Fe4 phases localized at melt pool boundaries. These results provide insights into achieving sufficient L-PBF processability for manufacturing dense Al–Fe binary alloy samples.

1. Introduction

Aluminum–iron alloys exhibit low density, superior thermal conductivity, and high recyclability. Al–Fe alloys are candidate materials for heat exchangers in air conditioning or refrigeration systems [1]. When added with refractory metal elements, this alloy system is also used for designing heat-resistant lightweight alloys in high-temperature applications [2,3,4,5,6]. Al–Fe-based alloys are often designed for the strengthening by Al–Fe intermetallic phases at ambient and elevated temperatures. A high content of Fe alloy enhances the formation of Al–Fe intermetallic phases. However, the formed stable θ-Al13Fe4 phase [7] (in equilibrium with the α-Al (fcc) phase) often exhibits coarsened morphologies and very brittle properties at ambient temperature [8]. Thus, the θ intermetallic phase significantly reduces the ductility of Al–Fe alloys, contributing to a low formability and limiting the fabrication of mechanical components with complex geometries by conventional forming processes.
Recently, metal additive manufacturing (AM) technologies have emerged as a promising process route to produce complex geometrical parts using various metal/alloy powders. Laser powder bed fusion (L-PBF) is a representative metal AM technology that employs a high-energy laser beam to selectively melt and fuse metal/alloy particles in successive powder layers using computer-aided design (CAD) data [9]. When applied to Al alloys, the L-PBF process produces characteristic microstructures [10,11,12] due to the local melting and rapid solidification by scanning laser irradiation. The rapid solidification can be employed for significant refinement of the microstructure containing Al–Fe intermetallic phases [13], resulting in the improved ductility of Al–Fe alloys without a loss of strength. Based on the concept of microstructure control in Al–Fe alloys by the L-PBF process, one study attempted to fabricate centimeter-sized samples using an Al–Fe alloy powder of a hypereutectic composition (15 mass% Fe in the Al–Fe binary system) [14]. In this paper, all compositions are given in mass percent (mass%), unless otherwise noted. The manufactured Al–15%Fe alloy samples exhibited a remarkably refined microstructure containing a fine θ-Al13Fe4 phase and numerous nano-sized particles of the metastable Al6Fe phase. The refined Al–Fe intermetallic phases contributed to a high hardness of approximately 200 HV. The refined microstructure was also found to be stable at an elevated temperature of 300 °C. This high microstructural stability demonstrated the Al–15%Fe alloy parts can sustain sufficient strength in a hostile environment for long periods of service at elevated temperatures. That work indicates the feasibility of applying L-PBF process to Al–Fe alloys to manufacture lightweight mechanical components for use at elevated service temperatures.
In order to additively manufacture geometrically complex mechanical components (e.g., radial compressor impellers used in vehicle turbochargers [15]) of Al–Fe alloys with reliable mechanical properties, it is essential to determine the suitable L-PBF processing conditions for producing defect-free parts. Optimization of the laser process parameters, in particular the laser power and scan speed, is required for the densification of Al–Fe alloy samples. In fact, the influence of L-PBF process parameters on porosity and cracking (L-PBF processability) had been extensively studied in the cases of Al–Si-based alloys [10,16,17,18] and age-hardenable wrought-type alloys (the 2xxx, 6xxx, and 7xxx series) [19,20,21,22,23,24,25,26,27,28,29]. In comparison, similar research for the Al–Fe alloys remains limited [30], although a few reports considered application of the L-PBF process to the Al–Fe-based alloys [31,32].
The present study aimed to optimize the L-PBF processing conditions for the densification of Al–Fe binary alloys.
To this end, the relative density, melt pool morphology, and hardness of L-PBF-built Al–15%Fe alloy samples under different laser power (P) and scan speed (v) conditions were systematically examined. Based on the results, the process window of laser parameters for building the Al–15%Fe alloy samples was identified and compared with that for other Al alloys.
The optimization of laser parameters for densification was discussed in terms of two different approaches: the volumetric energy density and the deposited energy density.

2. Materials and Methods

2.1. Materials

Al–15%Fe alloy powder was produced by gas atomization. The scanning electron microscopy (SEM) image in Figure 1 shows its particle morphology. The particles are somewhat irregular in shape, and there are often a number of asymmetric particles together with fine satellite particles. The measured average particle diameter was approximately 31 μm. Table 1 provides the chemical composition of the alloy powder measured using inductively coupled plasma-atomic emission spectrometry or inert gas fusion-infrared absorption spectrometry. The powder contains approximately 15%Fe as an alloy element, as well as trace amounts of Si and O as impurities. Note that the proportions of the major elements (Fe, Si, and O) in the L-PBF built sample (Fe: 15.2, Si: 0.09, and O: 0.29 wt.%) were almost the same as those in the initial powder (Fe: 15.1, Si: 0.09, and O: 0.25 wt.%), as described in our previous article [14].

2.2. Methods

Rectangular alloy samples with dimensions of 15 × 15 × 6 mm were built via the L-PBF process using a 3D Systems ProX 200 (3D SYSTEMS, Rock Hill, SC, USA) equipped with a Yb-fiber laser (wavelength: 1070 nm). In the process chamber, a counter-rotating roller compacted the bedded alloy powder to control the thickness of the powder layer. The studied Al–15%Fe alloy powder exhibited sufficient flowability for uniform spreading on the aluminum base plate. In order to determine the best process conditions for fabricating the rectangular samples when using this alloy powder, a number of samples were fabricated using different laser powers (P) ranging from 50 to 170 W and laser scan speeds (v) of 0.4–1.4 m·s−1. The other process parameters were fixed as follows: bedded powder thickness (t) = 30 μm, hatch distance between adjacent scanning tracks (h) = 100 μm, and beam spot diameter (2σ) = approximately 100 μm. In addition, a hexagonal grid laser scanning pattern [33] (grid size: 10 mm) was applied to fabricate all samples. The L-PBF process was performed in a high-purity Ar atmosphere. In particular, the oxygen concentration inside the process chamber was monitored and controlled below 550 ppm for all samples.
The density (g·cm−3) of L-PBF-built sample was measured at ambient temperature using the Archimedes method [34]. Its relative density was determined against the measured density of Al–15%Fe alloy ingot as a reference. The alloy ingot was prepared by melting the studied powder by high-frequency induction, followed by solidification at a cooling rate of approximately 0.3 °C·s−1 [35].
To observe the microstructures, the middle portion of the L-PBF-built sample was cut into several pieces to reveal the cross section parallel to the building direction (Z-direction). The cut surface was mechanically polished, and then colloidal silica was used for finishing. Microstructure of the polished surface was observed using an optical microscope (OM, NIKON ECLIPSE LV150N) and SEM (JEOL JSM-IT500 and JEOL JSM-7401). The depth of the melt pools was measured using the optical micrographs or SEM images. The Vickers hardness of the sample surface was measured using a Vickers indenter (FUTURE-TECH CORP., Kawasaki, Japan, FM-300e) at ambient temperature under two constant loads of 9.8 and 1.96 N. For each sample, the reported hardness is the average of more than seven tests.

3. Results

The applied laser power (P), laser scan speed (v), and representative appearance of the fabricated Al–15%Fe alloy samples are presented in Figure 2. In Figure 2a, the circle symbols indicate laser conditions to enable the manufacturing of macroscopically crack-free centimeter-sized rectangular samples, which was designated as a “crack-free sample”. The representative appearance of the crack-free sample is shown in Figure 2b. Within the limited laser conditions of v = 0.4–0.8 m·s−1 and P = 77–128 W, macroscopically crack-free Al–15%Fe alloy samples could be successfully constructed. At higher scan speeds (v ≥ 1.0 m·s−1), macroscopic cracks often propagated parallel to the powder bed plane (Figure 2c). This trend was also found in the samples built under higher laser power (P ≥ 130 W), as indicated by the triangular symbols in Figure 2a. A further higher P value of 170 W facilitated melt flow on the sample surface locally heated by the scanning laser beam (cross symbols in Figure 2a), which makes it more difficult to form the rectangular samples (Figure 2e). By comparison, a low P below 50 W could not provide sufficient energy to melt and fuse the alloy powder particles (“×” symbols in Figure 2a), resulting in uncondensed samples (Figure 2d). Table 2 lists the P and v values applied in this study.
Figure 3 presents low-and high-magnification backscattered electron images of the cross section (parallel to the building direction) of two samples, one built at 128 W and 0.4 m·s−1 and another at 77 W and 0.8 m·s−1 (both indicated by closed circles in Figure 2a). The relative densities of these samples were 96% and 78%, respectively. The sample built at 128 W and 0.4 m·s−1 contained only a few small pores (Figure 3a), corresponding to its high relative density. This built sample exhibited a number of melt pools in its microstructure [10,11,12,36], corresponding to the locally melted and rapidly solidified regions after exposure to the laser beam scanning (Figure 3a). Al–Fe intermetallic phases (bright contrast) with a size of several micrometers were often observed in this samples (Figure 3b), in particular localized along the melt pool boundaries. Conversely, relatively large cracks (a few hundred microns in length) were observed in the other sample built under 77 W and 0.8 m·s−1 (Figure 3c), corresponding to the low relative density of 78%. These cracks would correspond to the “process-introduced porosity” [37] caused by incomplete melting of powder particles under insufficient supplied energy (indicated by arrowheads in Figure 3c). In addition, a number of coarsened Al–Fe intermetallic phases were present in specific melted regions and adjacent to the pores and their associated cracks. The coarsened intermetallic phases may be formed during solidification at low cooling rates, a condition that occurs locally when the heat flow is cut off by adjacent pores and cracks [38]. The same microstructural features were found in pore-free regions in the sample built under 77 W and 0.8 m·s−1 (Figure 3d). Figure 4 is a magnified view of the microstructure around the melt pool boundaries. The SEM images show a number of coarsened Al–Fe intermetallic phases with a leaf-shaped morphology localized at the melt pool boundaries (Figure 4b). Detailed electron backscattered diffraction (EBSD) analysis [14] revealed the formation of θ-Al13Fe4 phase with a monoclinic structure (mS102 [7]). In addition, numerous spherical Al6Fe metastable phases (orthorhombic structure: oC28 [39]) with diameters below 500 nm were distributed in the melt pools (Figure 4a). In the locally melted region (melt pool) by laser irradiation during the L-PBF process, the stable θ-Al13Fe4 phase initially formed and grew at the interface between the solid and liquid phases (corresponding to melt pool boundaries) at higher temperature gradient and lower solidification rate [40], followed by the formation of metastable Al6Fe phases at higher growth rate in solidification (located inside melt pools) [41]. The detailed microstructural characterization and phase determination in the built samples were described in another article [14].
Figure 5 presents the relative density of L-PBF-built Al–15%Fe alloy samples (the “crack-free samples” indicated in Figure 2a) depending on the laser conditions. A trend can be observed in which the relative density becomes higher at higher laser power (P), whereas the laser power dependence of relative density appears varied depending on scan speed (v). At lower scan speed (v = 0.4 and 0.5 m·s−1), relative density was approximately 90% at lower P values of 77 and 89 W and slightly increased to above 95% at higher P values above 102 W. At high v values above 0.6 m‧s−1, the relative density continuously increased with an increase in P and then reached approximately 95%. The maximum relative density was 96% in the sample built under P = 128 W and v = 0.4 m·s−1 (for the sample appearance see Figure 2b). This corresponds to the maximum P and minimum v among all of the studied laser conditions that successfully produced the crack-free samples.
Figure 6 shows the melt pool depth observed in L-PBF-manufactured Al–15%Fe alloy samples depending on the laser condition. For all crack-free samples in Figure 2a, the depth of melt-pools observed on the sample surface was quantified, as shown in Figure 6b,c. The largest melt pool depth was 139 μm in the sample built under 128 W–0.4 m·s−1 (Figure 6b), and the lowest value was 78 μm at 77 W–0.4 m·s−1 (Figure 6c). The relatively large variation in this value suggests an inhomogeneous microstructure for the melt pools. The melt pool depth increased with increasing laser power (P). It also generally became larger at lower scan speeds (v), although a more specific trend was not found under the applied conditions. Note that no keyhole-shaped melt pool (formed when peak temperature in the melt pool exceeds the boiling temperature of the materials [42]) was observed in any of the crack-free samples in Figure 2a.
Figure 7 presents the Vickers hardness of Al–15%Fe alloy samples built under different laser conditions. The HV1 and HV0.2 values were measured at two different loads: 9.8 N (Figure 7a) and 1.96 N (Figure 7b). Representative SEM images of the corresponding in-dents are shown in Figure 7c and Figure 7d, respectively. A load of 9.8 N was used in regions containing pores (Figure 7c), whereas a lower load of 1.96 N was used on the defect-free surface (Figure 7d). The HV1 values tended to be higher at higher P for all constant v values used in this study, and the exact dependence on P varies with v (Figure 7a). As pores or defects were often observed on the indent surface (Figure 7c), HV1 could be influenced by porosities of the built samples. However, a clear correlation between the HV1 value (Figure 7a) and the relative density (Figure 5) was not found. This result suggests that the pores would not be distributed uniformly in the Al–15%Fe alloy samples built in this study. The measured HV0.2 values (indented on the defect-free surface) range from 160 to 250 HV (Figure 7b), and most of them are approximately 210 HV independent of the laser conditions. The scattered values suggest a heterogeneous microstructure consisting of multiple fine Al–Fe intermetallic phases in the α-Al matrix (Figure 4). The locally coarsened microstructure was more pronounced in the built samples with low densities (Figure 3c). Development of heterogeneous microstructures might contribute to the inconsistency between the HV1 value and relative density of the L-PBF-manufactured Al–15%Fe alloy samples.

4. Discussion

4.1. Process Window of Laser Parameters for Manufacturing Samples

The present work seeks to systematically investigate the effects of two laser parameters (P and v) on the relative density of Al–15%Fe alloy samples manufactured by the L-PBF process. The results provided a process window for manufacturing Al–15%Fe alloy samples (Figure 2a). Centimeter-sized samples were successfully built using P = 77–128 W and v = 0.4–0.8 m·s−1 (Figure 2b). The relative density increased at higher P values (Figure 5), whereas cracks (macroscopically propagating parallel to the powder bed plane) occurred in the built samples when P > 140 W and v > 1.0 m·s−1 (Figure 2a,c). The suitable ranges of P and v for manufacturing dense Al–15%Fe alloy samples are different from the optimized parameters reported for other Al alloys [16,17,18,20,24,27,30]. Figure 8 presents the laser parameter ranges for manufacturing Al–15%Fe alloy samples with high relative densities above 95%, together with the process windows for other types of alloys in the literature [16,17,18,20,24,27,30]. In general, the optimized P and v should depend on other process parameters (e.g., laser spot size, hatch distance, and powder layer thickness) and could not be compared between different L-PBF machines and materials [43]. However, it is obvious that the window for Al–15%Fe alloy samples is much smaller compared to not only commonly used Al–Si alloys (AlSi10Mg, A356 and A357) [17,18,19] but also high-strength Al alloys [19,20,21,22,44]. One of these studies produced Al–2.5%Fe binary alloy samples under the same conditions (same scan strategy, spot size of approximately 100 μm, hatch distance of 100 μm, powder layer thickness of 30 μm) [42]. A comparison with the current data reveals that increasing the Fe content results in a more limited process window for manufacturing dense samples. This more limited process window could be attributed to macroscopic cracking when the Al–15%Fe alloy powder is subjected to high laser powers and scan speeds (Figure 2a,c). Similarly, it is known to be difficult to process heat-treatable wrought-type Al alloys (Al–Cu, Al–Mg–Si, and Al–Zn–Mg systems) using L-PBF, because those materials are highly sensitive to cracking during solidification [19,20,21,22,23,24,25,26,27,28,29]. The solidification cracks often propagate along the building direction (which likely coincides with the solidification direction) in a process called “hot cracking” [24,45], resulting in poor processability of high-strength Al alloys. The hot cracking phenomenon has been discussed in the welding of Al alloys [46], and the obtained insights can be applied to identify factors that affect the formation of solidification cracks during the L-PBF process, in terms of the solidification shrinkage and thermal contraction of the semi-solid [47]. It should be noted that macroscopic cracks propagated parallel to the powder bed plane, and they could contribute to the poor processability of Al–15%Fe alloy samples produced using L-PBF (Figure 2). Hot cracking may also occur during solidification of the Al–15%Fe alloy, whereas the different morphology of macroscopic cracking in these samples indicates other dominant contributors to the limit process window. Lateral cracks (macroscopically propagating parallel to the powder bed plane) were observed in some materials that are difficult to process using L-PBF, such as high-carbon tool steels [37]. These cracks result in delamination of powder layers in the processed samples. The separation of adjacent powder layers is due to incomplete melting or insufficient re-melting of the underlying solid part [37]. Incomplete melting could occur under a low P and a high v. Such delamination appeared in the uncondensed Al–15%Fe alloy sample, as shown in Figure 2d. Nevertheless, it was also prominent in samples manufactured using high P (and high v), as shown in Figure 2c. To understand the anomalous crack propagation macroscopically parallel to the powder bed plane, careful SEM observations were carried out for the sample built under 128 W and 0.5 m·s−1.
Figure 9 summarizes the laser conditions separating the “crack-free samples” from the “cracked samples” in Figure 2a. SEM observation revealed preferential crack propagation along the melt pool boundaries in the manufactured sample (Figure 9a). It is noteworthy that the relatively coarsened θ-Al13Fe4 phases localized at the melt pool boundaries (Figure 4) appeared to fracture, resulting in separation in those regions. A previous study reported on the brittle nature of the θ-Al13Fe4 intermetallic phase with a low fracture toughness of 1.3 MPa·m1/2 [8]. The crack propagation could be responsible for the brittle θ phase localized along the melt pool boundaries, resulting in macroscopic cracks propagating parallel to the powder bed plane in the Al–15%Fe alloy samples. The propagated cracks (and the local uncondensed regions) significantly reduce the efficiency of heat flow towards the solidified part underneath, resulting in local change in the cooling rate and additional heat [38]. The resultant slow cooling enhances the formation of locally coarsened Al–Fe intermetallic phases (Figure 9b). The coarse brittle phase could facilitate further crack initiation and propagation during the L-PBF process. Furthermore, a higher scan speed causes a higher thermal gradient at the liquid-solid interface during solidification [48]. The effect of solidification shrinkage and thermal contrast of the constituent phases (contributing to hot cracking) would become pronounced under high thermal gradients [40]. Thus, a higher laser scan speed would enhance the formation of microscale solidification cracks in the L-PBF process, assisting the process to form macroscopic lateral cracks in the built Al–15%Fe alloy samples, as presented in Figure 2c.

4.2. Optimization of Laser Parameters for Densification

The relative density is one of the most important factors for samples manufactured by L-PBF, because a higher relative density implies minimal/zero porosity and lack of fusion voids. It was found that the relative density became higher in the samples manufactured under higher laser power using the employed constant scan speeds (Figure 5), suggesting the suitable laser parameters for manufacturing dense samples of Al–15%Fe alloy. However, the highest achieved relative density was only approximately 96%, and the sample still contained local defects (micron-size pores) as represented in Figure 3a. Thus, further optimization of the processing parameters is required to reduce defects in the L-PBF-manufactured samples. The detailed optimization strategy is discussed below.
An extensive body of literature exists regarding the effect of L-PBF process parameters on the relative density of manufactured metal and alloy samples [16,17,18,20,24,27,30,34,49]. The volumetric energy density (E) [34,50] has been widely used to integrate various L-PBF processing parameters of P, v, hatch distance between adjacent laser scanning tracks (h), and powder layer thickness (t):
E = P v · h · t  
E can function as an applicable design parameter for manufacturing fully dense (defect-free) samples using various alloy powders via the L-PBF process [51]. The associated physical model assumes that the applied heat is completely transferred through the thickness of the bedded powder layer.
In addition, v also affects the energy density irradiated on the bedded powder layer and causes variation in the effective distance of heat transfer into the powder layer. It has been demonstrated that the deposited energy density model [52] considering thermal diffusivity was appropriate for optimizing the laser parameter to manufacture fully dense samples using powders of Al–2.5%Fe alloy [30] and maraging steel [34]. The deposited energy density (ΔH) is defined by the enthalpy at melting (hs), laser absorptivity (A), thermal diffusivity (D), and laser spot size (σ) as follows:
Δ H h s = A P π h s D v σ 3
This model allows approximate calculation of the effective time (τ) of laser beam irradiation on the bedded powder layer as σ/v. The distance of heat transfer into the bedded powder layer can vary, and it can be characterized by a heat-transfer length of ()1/2 [34]. This model has been used to study the correlation between the transition from conduction to keyhole melting modes and the applied laser conditions, for the L-PBF process [34,42] and the laser welding process [52]. To address the feasibility of the deposited energy density model for optimizing laser parameters to build dense samples, both E and ΔH were used to describe the effects of P and v on the relativity density of Al–15%Fe alloy samples.
The melt pool depth (as shown in Figure 6) is re-plotted as a function of E or ΔH in Figure 10. In the present study, the values of t, h, and σ were fixed, and the Al–15%Fe alloy had constant A and D values. According to Equations (1) and (2), the two models only differ in the power index of the scan speed (v−1 and v−1/2). Therefore, P·v−1 and P·v−1/2 were used to summarize the L-PBF process by removing constant parameters. From the data, the melt pool depth obviously increases with increasing E (variable parameter: P·v−1 based on the volumetric energy-density model) and P·v−1/2 (based on the deposited energy density model) (Figure 10a,b). The measured melt pool depth appears to be linear with both of E and P·v−1/2, whereas somewhat scattered values are found at E ~80–100 Jmm−3. Linear regression analyses of P·v−1/2 and melt pool depth provided a coefficient of determination of R = 0.696 (Figure 10b), which is similar to that when using the E value (Figure 10a). This result suggests the heat-transferred length of ()1/2 in the bedded powder layer and the underlying solidified part (based on the deposited energy density model) would slightly contribute to the local melting in the Al–15%Fe alloy samples under scanning laser irradiation. It has been found that the calculated coefficient of determination (R) for the Al–15%Fe alloy samples was much smaller than those for Al–2.5%Fe alloy (0.918) [30] and maraging steel (0.934) [34]. The larger deviation from linearity suggests non-uniform heat transfer inside the present Al–15%Fe alloy samples, which is supported by the inhomogeneous microstructure observed in them (Figure 4). Numerous fine Al–Fe intermetallic particles are homogeneously distributed inside the melt pools (Figure 4a), whereas a number of relatively coarsened θ-Al13Fe4 phases with a leaf-shaped morphology are localized at the melt pool boundaries (Figure 4b). The θ-Al13Fe4 phase has a much lower thermal conductivity (approximately 10 W·m−1·K−1 [53]) than the α-Al (fcc) matrix (approximate values ranging from 100 to 200 W·m−1·K−1), whereby a non-uniformly distributed θ phase would hinder even heat transfer inside the Al–15%Fe alloy samples. Accordingly, the formation of the primary solidified θ phase could hinder a fundamental understanding of the heat flow and the associated local melting inside the Al–15%Fe alloy samples during the L-PBF process.
Figure 11 shows the relative density of the L-PBF-built Al–15%Fe alloy samples as functions of E and P·v−1/2. The relative density becomes higher at higher E, where a lower E (50–70 J·mm−3) results in scattered relative densities with a deviation of approximately 10% (Figure 11a). A more obvious trend for the relative density was observed when using P·v−1/2. The relative density increased continuously with increasing P·v−1/2, to above 90% at P·v−1/2 = 140 W·m−1/2·s1/2, and then became saturated at approximately 95% (Figure 11b). This result indicates that examining the dependence of relative density on P·v−1/2 appears effective to determine the threshold laser condition required to reach a relative density of approximately 95%. Nevertheless, further research on the relationship between relative density and P·v−1/2 could be required to understand the densification mechanism associated with the deposited energy density model. Note that the threshold value of P·v−1/2 = 140 W·s1/2·m−1/2 was located at a melt pool depth of approximately 100 μm, in comparison with the change in melt pool depth depending on P·v−1/2 (Figure 10b). Thus, a melt pool depth more than three times the thickness of the bedded-powder layer (30 μm) would be required to manufacture relatively dense Al–15%Fe alloy samples.
The Vickers hardness values (HV0.2 and HV1, which were measured at 1.96 and 9.8 N, respectively, Figure 7) are also re-plotted as a function of P·v−1/2 in Figure 12. The value of HV0.2 show some scattering but are mostly located near 210 HV independent of P·v−1/2 (Figure 12a). The constant HV0.2 indicates only a slight effect of the laser parameters on the microstructure of L-PBF-built Al–15%Fe alloy samples. By comparison, the values of HV1 increase to approximately 210 HV when P·v−1/2 increases up to 140 W·s1/2·m−1/2 (Figure 12b). The latter value corresponds well to the threshold condition for manufacturing the present samples with relative densities above 95% (Figure 11b). Therefore, the threshold laser parameters for relatively dense samples can be estimated by Vickers hardness tests, in terms of the deposited energy density model using P·v−1/2. Note that HV1 appears slightly lower at high P·v−1/2 values above 140 W·s1/2·m−1/2, suggesting the formation of micron-scale cracks inside the samples. This might correspond to the cracked samples or melting samples when P > 140 W (shown in Figure 2a).
From the above results, formation of the primary solidified θ-Al13Fe4 intermetallic phase is a dominant cause for reduced processability of L-PBF when using the Al–Fe alloy powder with a hypereutectic composition. The formation mechanism of the coarsened θ phase during solidification has been described in detail elsewhere [14]. The brittle θ phase localized at melt pool boundaries facilitates preferential crack propagation along these boundaries during the L-PBF process, and inhibits uniform heat transfer for local melting (to form a homogenous morphology of melt pools) inside the Al–15%Fe alloy samples. It has been reported that fine particles of primary solids would act as nucleation sites for the solidification of the α-Al phase, resulting in refined grain size of Al alloys built by the L-PBF process [54,55]. Nevertheless, a high fraction of the primary solidified intermetallic phase could have a detrimental effect on the L-PBF processability. To achieve sufficient processability for manufacturing dense Al–Fe binary alloys, it is necessary to control not only the Fe alloy content (for controlling the fraction of primary solidified θ phase), but also the other processing parameters, such as the heating temperature of the base plate (for controlling the cooling rate during solidification).

5. Conclusions

In the present study, the relative density, melt pool depth, and Vickers hardness of L-PBF-built Al–15%Fe alloy (with a hypereutectic composition in the Al–Fe binary system) were systematically investigated with various different processing parameters (laser power (P) and scan speed (v)). The data were used to discuss optimization of the L-PBF process condition for the densification of Al–Fe binary alloys. The key results are summarized as follows:
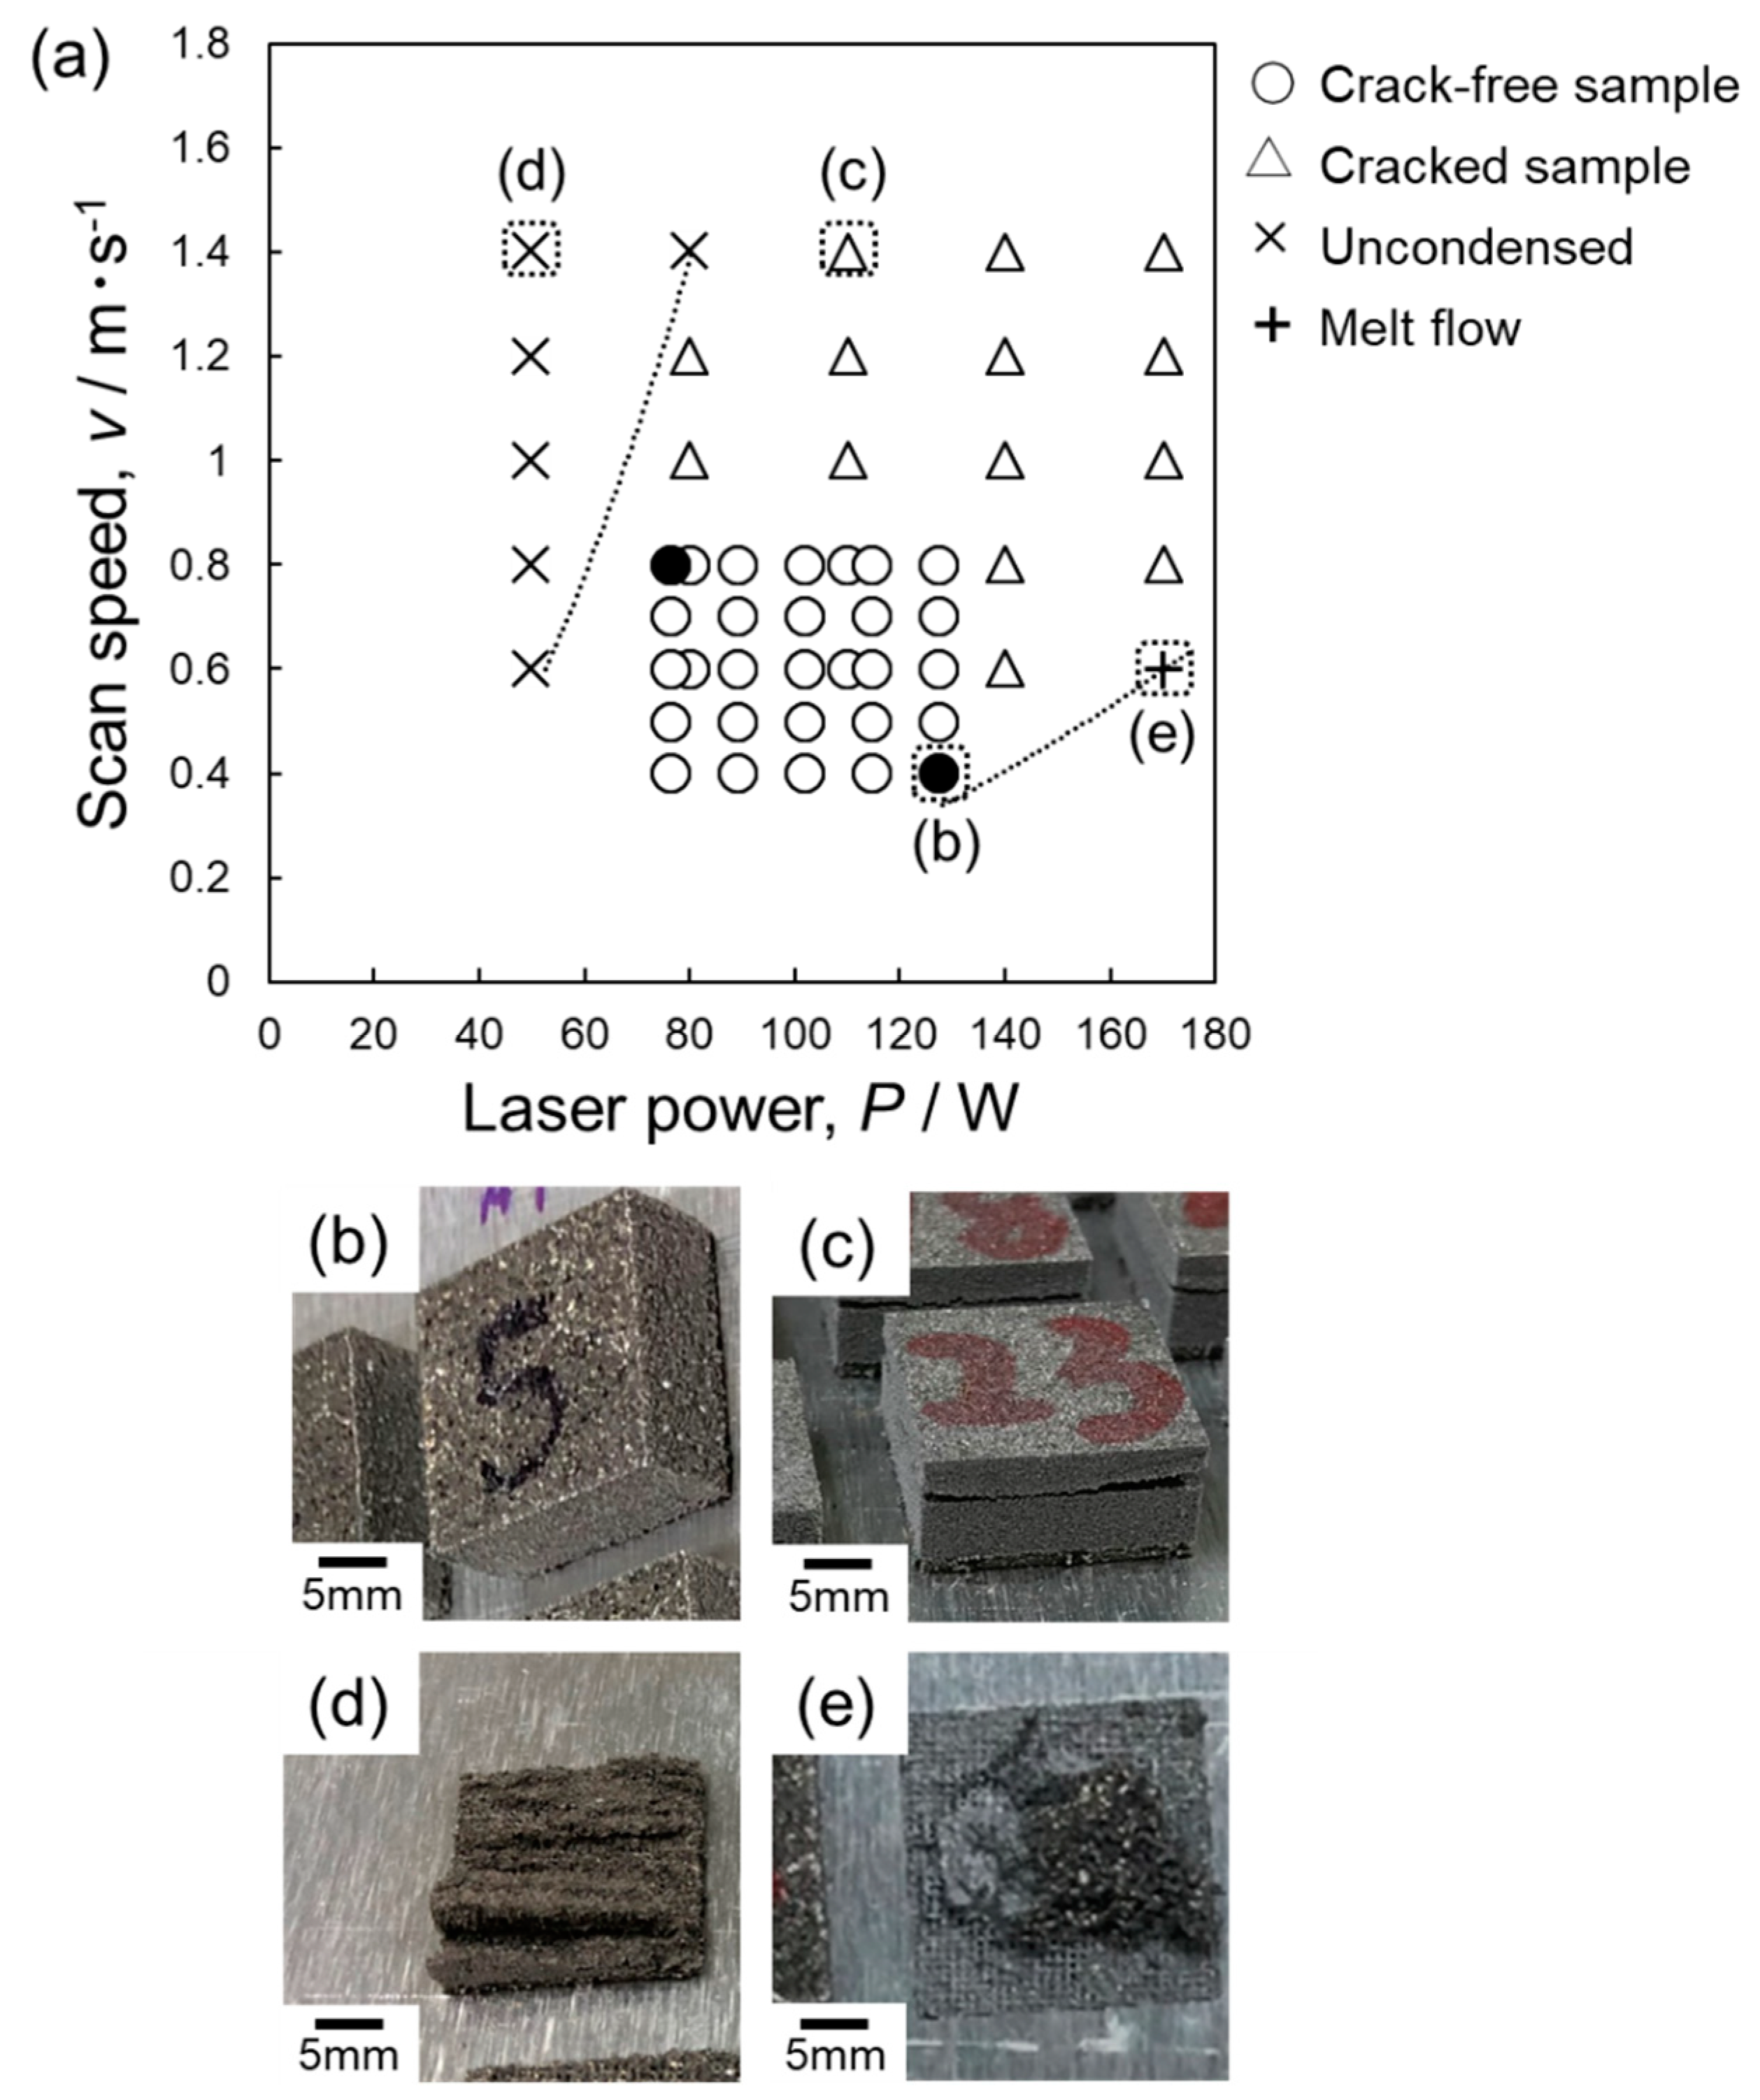
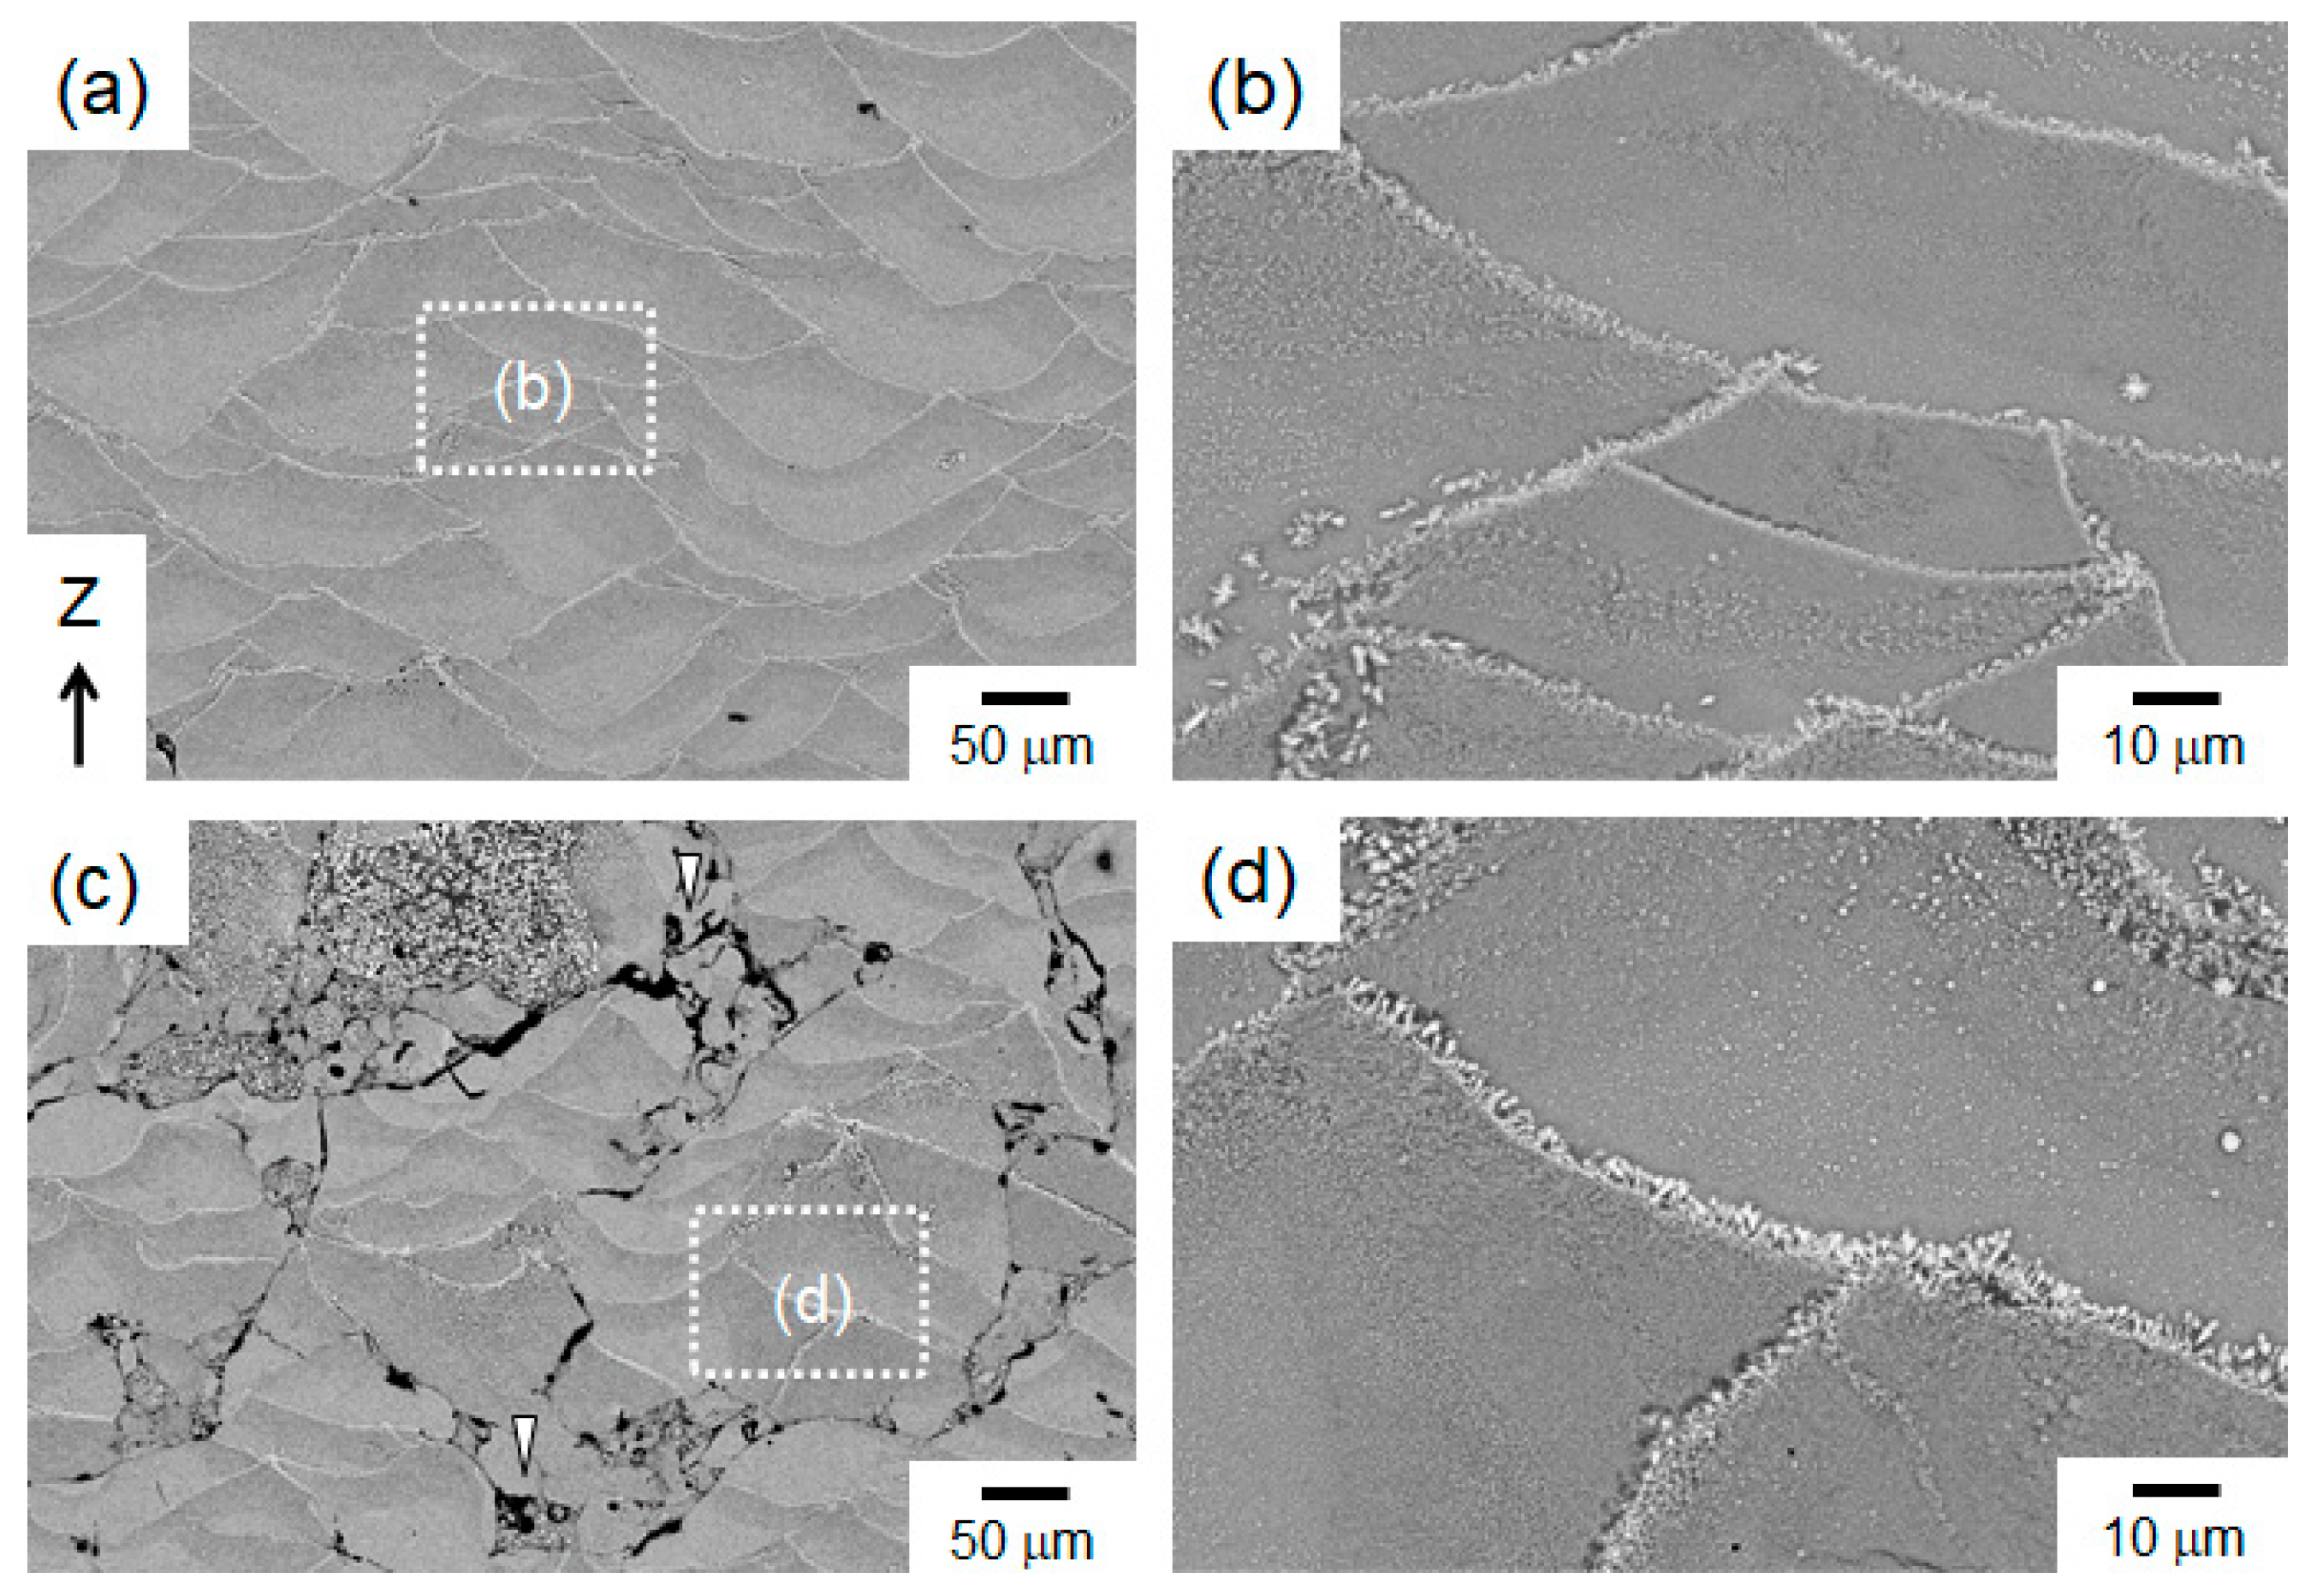
  • A laser process window of P = 77–128 W and v = 0.4–0.8 m·s−1 was identified that can ensure the fabrication of macroscopically crack-free Al–15%Fe alloy samples. This process window is much smaller than those of other Al alloys. When a higher scan speed (v ≥ 1.0 m·s−1) or a higher laser power (P ≥ 140 W) is used, the samples tend to include a number of macroscopic cracks propagating parallel to the powder bed plane. These cracks appear to preferentially propagate along the melt pool boundaries decorated with the brittle θ-Al13Fe4 phase (primary solidified phase), resulting in a low L-PBF processability for manufacturing Al–15%Fe alloy samples.
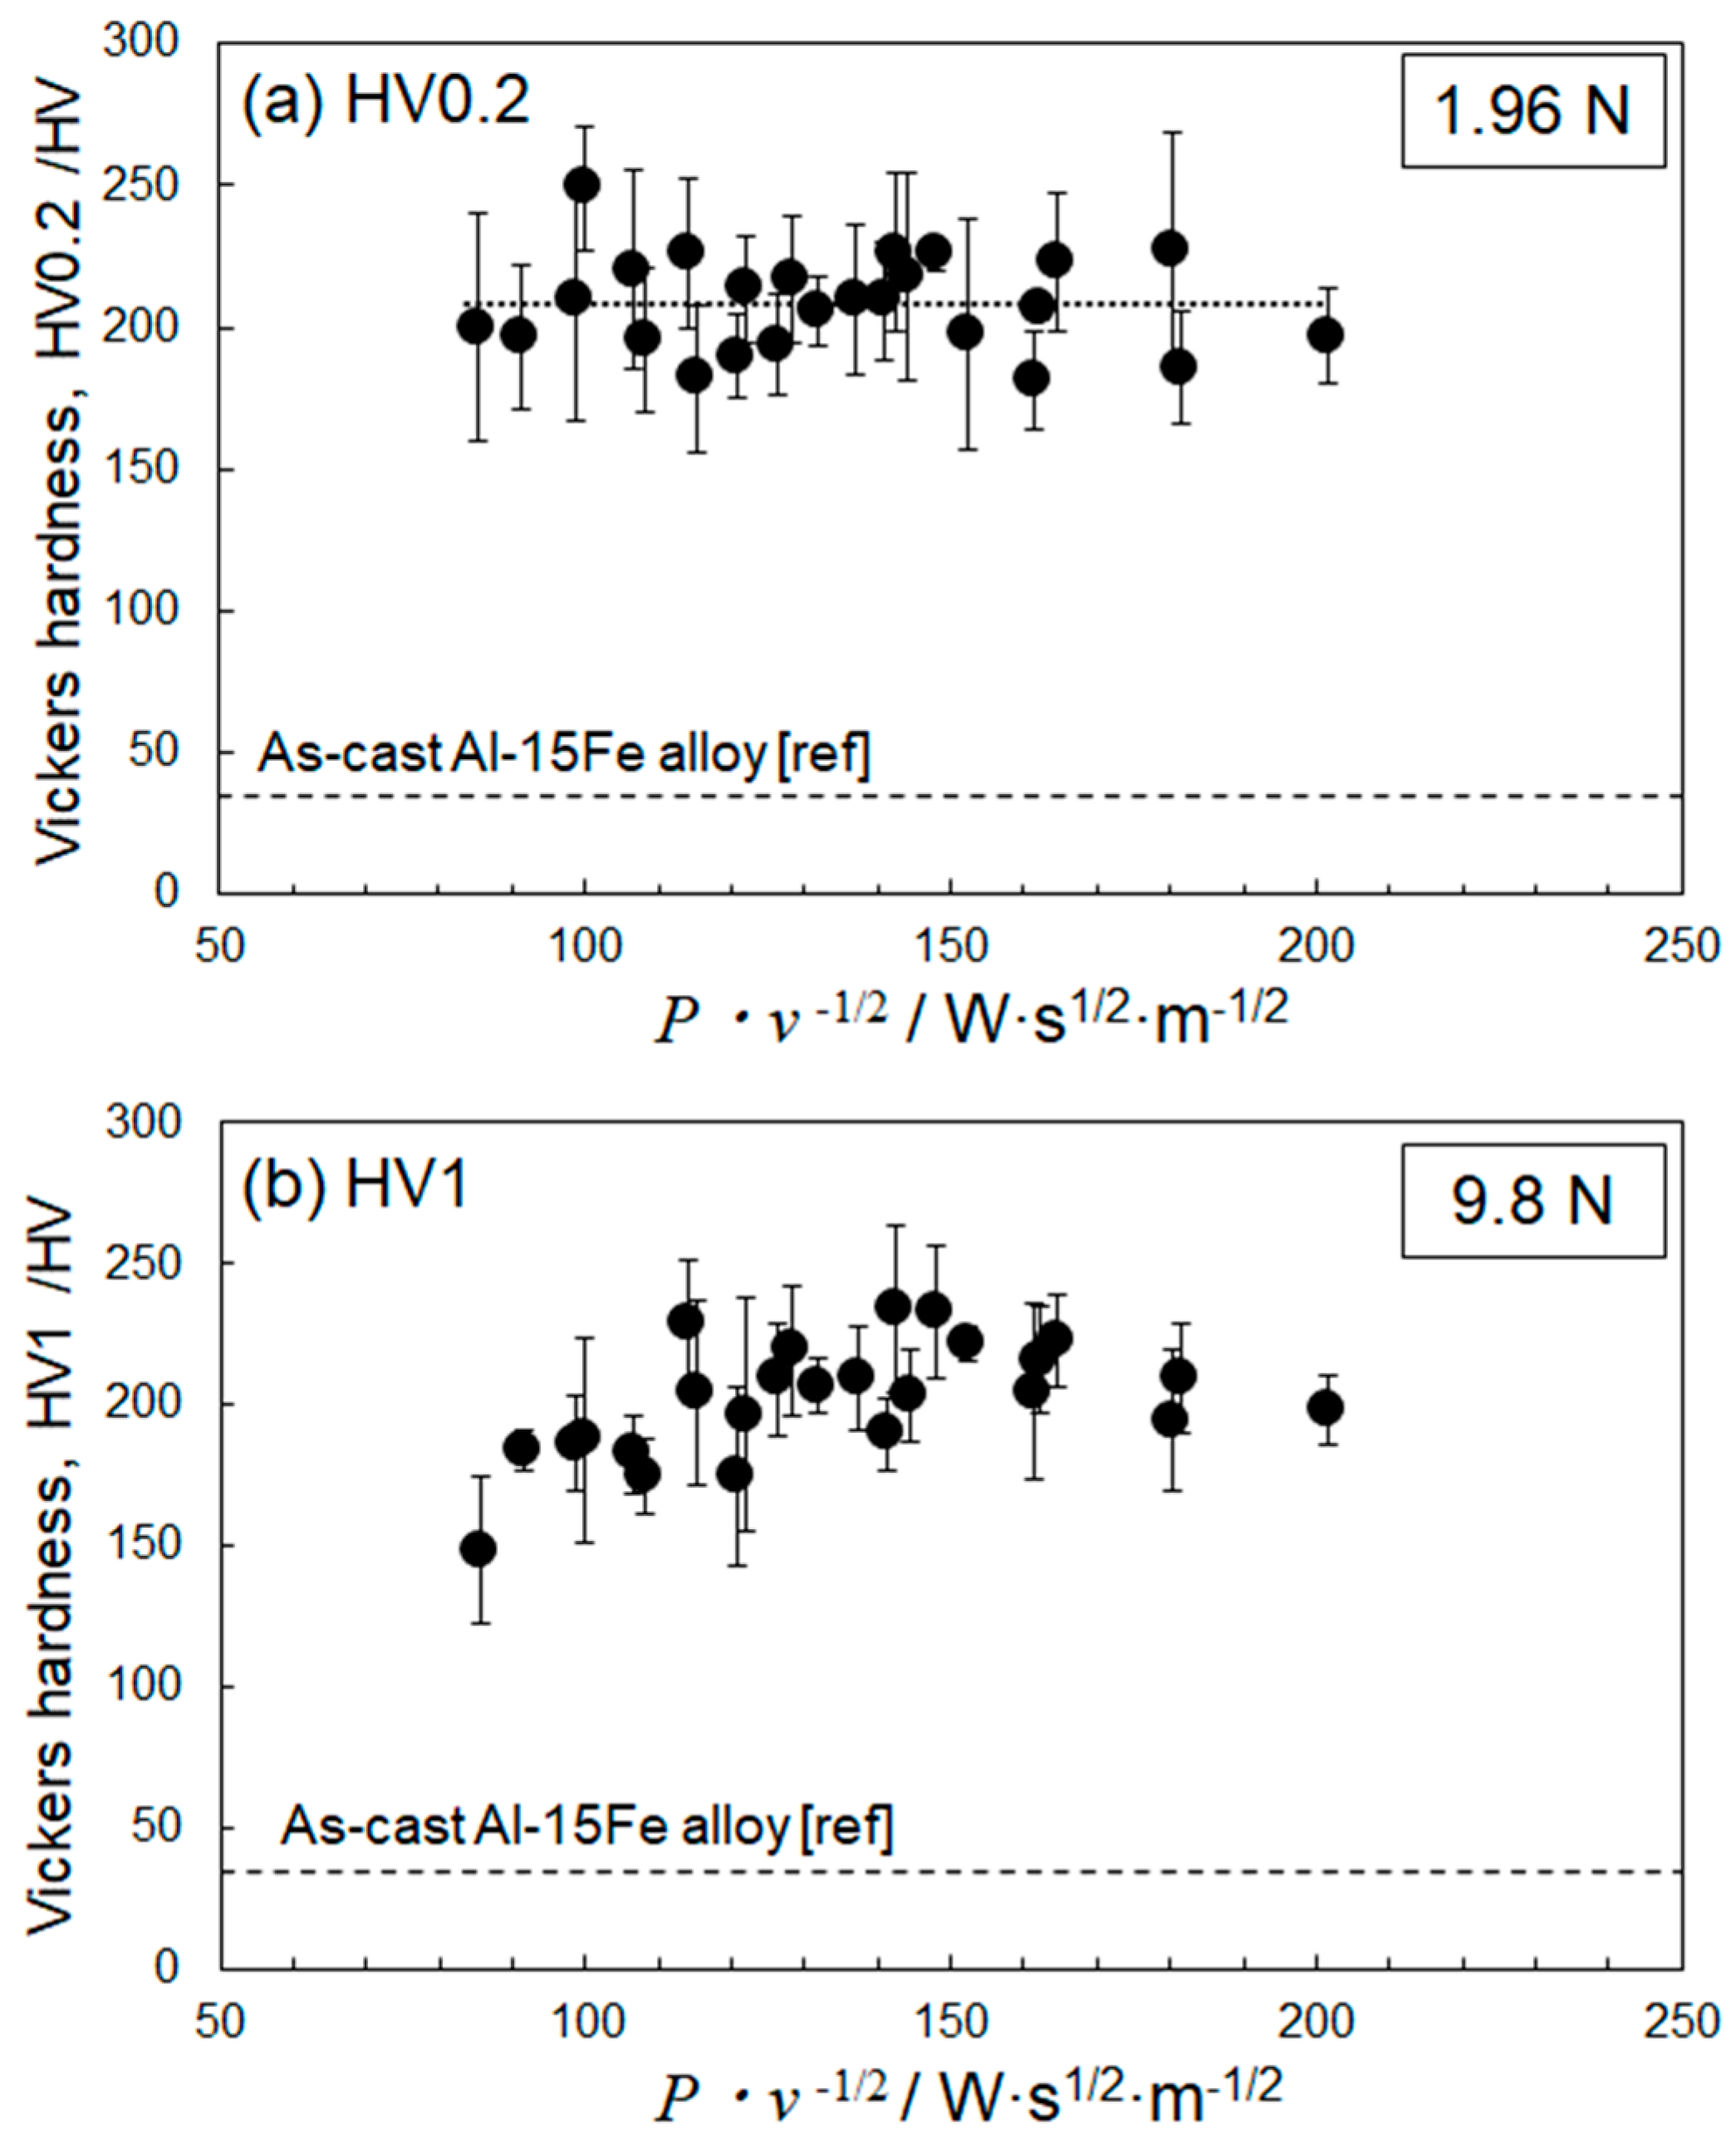
  • The deposited energy density model (parametrized by P·v−1/2) appeared useful for identifying the optimum L-PBF process conditions towards densification of Al–15%Fe alloy samples, in comparison with the volumetric energy density (parametrized by P·v−1). However, the correlation with P·v−1/2 for the Al–15%Fe alloy was modest compared to the cases of Al–2.5%Fe alloy and maraging steel with high thermal conductivities. The possible reason was that the L-PBF-built Al–15%Fe alloy samples contained inhomogeneous microstructures having a number of coarsened θ-Al13Fe4 phases with low thermal conductivity.

Author Contributions

Conceptualization, N.T.; methodology, N.T. and W.W.; software, M.K. (Masaki Kato); validation, N.T., M.K. (Makoto Kobashi) and A.S.; formal analysis, W.W.; investigation, W.W. and N.T.; data curation, W.W. and N.T.; writing—original draft preparation, W.W.; writing—review and editing, N.T., A.S. and M.K. (Makoto Kobashi); visualization, W.W.; supervision, N.T.; project administration, N.T. and M.K. (Makoto Kobashi); funding acquisition, N.T. and M.K. (Makoto Kobashi). All authors have read and agreed to the published version of the manuscript.

Funding

This work was supported by the “Knowledge Hub Aichi”, a Priority Research Project of the Aichi Prefectural Government, Japan, and JSPS KAKENHI (Grant Number 20H02462).

Acknowledgments

The authors would like to thank Isao Murakami (Toyo Aluminum K. K.) for providing the alloy powder.

Conflicts of Interest

The authors declare no conflict of interest.

References

  1. Wang, S.; Cheng, S.; Yu, H.; Rao, Z.; Liu, Z. Experimental investigation of Al–Cu composed tube–fin heat exchangers for air conditioner. Exp. Therm. Fluid Sci. 2013, 51, 264–270. [Google Scholar] [CrossRef]
  2. Choi, S.H.; Sung, S.Y.; Choi, H.J.; Sohn, Y.H.; Han, B.S.; Lee, K.A. High temperature tensile deformation behavior of new heat resistant aluminum alloy. Procedia Eng. 2011, 10, 159–164. [Google Scholar] [CrossRef] [Green Version]
  3. Tiwary, C.S.; Kashyap, S.; Chattopadhyay, K. Development of alloys with high strength at elevated temperatures by tuning the bimodal microstructure in the Al–Cu–Ni eutectic system. Scr. Mater. 2014, 93, 20–23. [Google Scholar] [CrossRef]
  4. Tiwary, C.S.; Kashyap, S.; Kim, D.H.; Chattopadhyay, K. Al based ultra-fine eutectic with high room temperature plasticity and elevated temperature strength. Mater. Sci. Eng. A 2015, 639, 359–369. [Google Scholar] [CrossRef]
  5. Erdeniz, D.; De Luca, A.; Seidman, D.N.; Dunand, D.C. Effects of Nb and Ta additions on the strength and coarsening resistance of precipitation-strengthened Al-Zr-Sc-Er-Si alloys. Mater. Charact. 2018, 141, 260–266. [Google Scholar] [CrossRef]
  6. Michi, R.A.; Toinin, J.; Farkoosh, A.R.; Seidman, D.N.; Dunand, D.C. Effects of Zn and Cr additions on precipitation and creep behavior of a dilute Al–Zr–Er–Si alloy. Acta Mater. 2019, 181, 249–261. [Google Scholar] [CrossRef]
  7. Black, P.J. The structure of FeAl3. I. Acta Cryst. 1955, 8, 43–48. [Google Scholar] [CrossRef]
  8. Tsukahara, T.; Takata, N.; Kobayashi, S.; Takeyama, M. Mechanical properties of Fe2Al5 and FeAl3 intermetallic phases at ambient temperature. Tetsu-To-Hagané 2016, 102, 29–35. [Google Scholar] [CrossRef] [Green Version]
  9. Khorasani, A.; Gibson, I.; Veetil, J.K.; Ghasemi, A.H. A review of technological improvements in laser-based powder bed fusion of metal printers. Int. J. Adv. Manuf. Technol. 2020, 108, 191–209. [Google Scholar] [CrossRef]
  10. Thijs, L.; Kempen, K.; Kruth, J.P.; Van Humbeeck, J. Fine-structured aluminium products with controllable texture by selective laser melting of pre-alloyed AlSi10Mg powder. Acta Mater. 2013, 61, 1809–1819. [Google Scholar] [CrossRef] [Green Version]
  11. Takata, N.; Kodaira, H.; Sekizawa, K.; Suzuki, A.; Kobashi, M. Change in microstructure of selectively laser melted AlSi10Mg alloy with heat treatments. Mater. Sci. Eng. A 2017, 704, 218–228. [Google Scholar] [CrossRef]
  12. Takata, N.; Liu, M.; Kodaira, H.; Suzuki, A.; Kobashi, M. Anomalous strengthening by supersaturated solid solutions of selectively laser melted Al–Si-based alloys. Addit. Manuf. 2020, 33, 101152. [Google Scholar] [CrossRef]
  13. Qi, X.; Takata, N.; Suzuki, A.; Kobashi, M.; Kato, M. Managing both high strength and thermal conductivity of a laser powder bed fused Al–2.5 Fe binary alloy: Effect of annealing on microstructure. Mater. Sci. Eng. A 2020, 805, 140591. [Google Scholar] [CrossRef]
  14. Wang, W.; Takata, N.; Suzuki, A.; Kobashi, M.; Kato, M. Formation of multiple intermetallic phases in a hypereutectic Al-Fe binary alloy additively manufactured by laser powder bed fusion. Intermetallics 2020, 125, 106892. [Google Scholar] [CrossRef]
  15. Wallace, G.; Jackson, A.P.; Midson, S.P. Novel method for casting high quality aluminum turbocharger impellers. Int. J. Mater. Manuf. 2010, 3, 405–412. [Google Scholar] [CrossRef]
  16. Rao, H.; Giet, S.; Yang, K.; Wu, X.; Davies, C.H. The influence of processing parameters on aluminium alloy A357 manufactured by Selective Laser Melting. Mater. Des. 2016, 109, 334–346. [Google Scholar] [CrossRef]
  17. Kimura, T.; Nakamoto, T. Microstructures and mechanical properties of A356 (AlSi7Mg0.3) aluminum alloy fabricated by selective laser melting. Mater. Des. 2016, 89, 1294–1301. [Google Scholar] [CrossRef]
  18. Kimura, T.; Nakamoto, T. Microstructures and mechanical properties of Al-10%Si-0.4%Mg fabricated by selective laser melting. J. Jpn. Soc. Powder Metall. 2014, 61, 531–537. [Google Scholar] [CrossRef] [Green Version]
  19. Koutny, D.; Palousek, D.; Pantelejev, L.; Hoeller, C.; Pichler, R.; Tesicky, L.; Kaiser, J. Influence of scanning strategies on processing of aluminum alloy EN AW 2618 using selective laser melting. Materials 2018, 11, 298. [Google Scholar] [CrossRef] [Green Version]
  20. Tan, Q.; Liu, Y.; Fan, Z.; Zhang, J.; Yin, Y.; Zhang, M.X. Effect of processing parameters on the densification of an additively manufactured 2024 Al alloy. J. Mater. Sci. Technol. 2020, 58, 34–45. [Google Scholar] [CrossRef]
  21. Ahuja, B.; Karg, M.; Nagulin, K.Y.; Schmidt, M. Fabrication and characterization of high strength Al-Cu alloys processed using laser beam melting in metal powder bed. Phys. Procedia 2014, 56, 135–146. [Google Scholar] [CrossRef] [Green Version]
  22. Xu, R.; Li, R.; Yuan, T.; Niu, P.; Wang, M.; Lin, Z. Microstructure, metallurgical defects and hardness of Al–Cu–Mg–Li–Zr alloy additively manufactured by selective laser melting. J. Alloys Compd. 2020, 835, 155372. [Google Scholar] [CrossRef]
  23. Knoop, D.; Lutz, A.; Mais, B.; von Hehl, A. A tailored AlSiMg alloy for laser powder bed fusion. Metals 2020, 10, 514. [Google Scholar] [CrossRef] [Green Version]
  24. Uddin, S.Z.; Murr, L.E.; Terrazas, C.A.; Morton, P.; Roberson, D.A.; Wicker, R.B. Processing and characterization of crack-free aluminum 6061 using high-temperature heating in laser powder bed fusion additive manufacturing. Addit. Manuf. 2018, 22, 405–415. [Google Scholar] [CrossRef]
  25. Rutherford, B.A.; Avery, D.Z.; Phillips, B.J.; Rao, H.M.; Doherty, K.J.; Allison, P.G.; Brewer, L.N.; Jordon, J.B. Effect of Thermomechanical Processing on Fatigue Behavior in Solid-State Additive Manufacturing of Al-Mg-Si Alloy. Metals 2020, 10, 947. [Google Scholar] [CrossRef]
  26. Stopyra, W.; Gruber, K.; Smolina, I.; Kurzynowski, T.; Kuźnicka, B. Laser powder bed fusion of AA7075 alloy: Influence of process parameters on porosity and hot cracking. Addit. Manuf. 2020, 35, 101270. [Google Scholar]
  27. Otani, Y.; Kusaki, Y.; Itagaki, K.; Sasaki, S. Microstructure and mechanical properties of A7075 alloy with additional Si objects fabricated by selective laser melting. Mater. Trans. 2019, 60, 2143–2150. [Google Scholar] [CrossRef] [Green Version]
  28. Zhou, S.Y.; Su, Y.; Wang, H.; Enz, J.; Ebel, T.; Yan, M. Selective laser melting additive manufacturing of 7xxx series Al-Zn-Mg-Cu alloy: Cracking elimination by co-incorporation of Si and TiB2. Addit. Manuf. 2020, 36, 101458. [Google Scholar] [CrossRef]
  29. Qi, T.; Zhu, H.; Zhang, H.; Yin, J.; Ke, L.; Zeng, X. Selective laser melting of Al7050 powder: Melting mode transition and comparison of the characteristics between the keyhole and conduction mode. Mater. Des. 2017, 135, 257–266. [Google Scholar] [CrossRef]
  30. Qi, X.; Takata, N.; Suzuki, A.; Kobashi, M.; Kato, M. Laser powder bed fusion of a near-eutectic Al–Fe binary alloy: Processing and microstructure. Addit. Manuf. 2020, 35, 101308. [Google Scholar]
  31. Sun, S.B.; Zheng, L.J.; Liu, J.H.; Zhang, H. Selective laser melting of an Al–Fe–V–Si alloy: Microstructural evolution and thermal stability. J. Mater. Sci. Technol. 2017, 33, 389–396. [Google Scholar] [CrossRef]
  32. Yamasaki, S.; Okuhira, T.; Mitsuhara, M.; Nakashima, H.; Kusui, J.; Adachi, M. Effect of Fe addition on heat-resistant aluminum alloys produced by selective laser melting. Metals 2019, 9, 468. [Google Scholar] [CrossRef] [Green Version]
  33. Takata, N.; Nishida, R.; Suzuki, A.; Kobashi, M.; Kato, M. Crystallographic features of microstructure in maraging steel fabricated by selective laser melting. Metals 2018, 8, 440. [Google Scholar] [CrossRef] [Green Version]
  34. Suzuki, A.; Nishida, R.; Takata, N.; Kobashi, M.; Kato, M. Design of laser parameters for selectively laser melted maraging steel based on deposited energy density. Addit. Manuf. 2019, 28, 160–168. [Google Scholar] [CrossRef]
  35. Takata, N.; Okano, T.; Suzuki, A.; Kobashi, M. Microstructure of intermetallic-reinforced Al-based alloy composites fabricated using eutectic reactions in Al–Mg–Zn ternary system. Intermetallics 2018, 95, 48–58. [Google Scholar] [CrossRef]
  36. Takata, N.; Kodaira, H.; Suzuki, A.; Kobashi, M. Size dependence of microstructure of AlSi10Mg alloy fabricated by selective laser melting. Mater. Charact. 2018, 143, 18–26. [Google Scholar] [CrossRef]
  37. Sames, W.J.; List, F.A.; Pannala, S.; Dehoff, R.R.; Babu, S.S. The metallurgy and processing science of metal additive manufacturing. Int. Mater. Rev. 2016, 61, 315–360. [Google Scholar] [CrossRef]
  38. Liu, M.; Takata, N.; Suzuki, A.; Kobashi, M. Development of gradient microstructure in the lattice structure of AlSi10Mg alloy fabricated by selective laser melting. J. Mater. Sci. Technol. 2020, 36, 106–117. [Google Scholar] [CrossRef]
  39. Walford, L.K. The structure of the intermetallic phase FeAl6. Acta Cryst. 1965, 18, 287–291. [Google Scholar] [CrossRef]
  40. Ding, X.; Koizumi, Y.; Wei, D.; Chiba, A. Effect of process parameters on melt pool geometry and microstructure development for electron beam melting of IN718: A systematic single bead analysis study. Addit. Manuf. 2019, 26, 215–226. [Google Scholar] [CrossRef]
  41. Zhao, Y.; Koizumi, Y.; Aoyagi, K.; Wei, D.; Yamanaka, K.; Chiba, A. Molten pool behavior and effect of fluid flow on solidification conditions in selective electron beam melting (SEBM) of a biomedical Co-Cr-Mo alloy. Addit. Manuf. 2019, 26, 202–214. [Google Scholar] [CrossRef]
  42. King, W.E.; Barth, H.D.; Castillo, V.M.; Gallegos, G.F.; Gibbs, J.W.; Hahn, D.E.; Kamath, C.; Rubenchik, A.M. Observation of keyhole-mode laser melting in laser powder-bed fusion additive manufacturing. J. Mater. Process. Technol. 2014, 214, 2915–2925. [Google Scholar] [CrossRef]
  43. Aboulkhair, N.T.; Simonelli, M.; Parry, L.; Ashcroft, I.; Tuck, C.; Hague, R. 3D printing of aluminium alloys: Additive manufacturing of aluminium alloys using selective laser melting. Prog. Mater. Sci. 2019, 106, 100578. [Google Scholar] [CrossRef]
  44. Wang, P.; Gammer, C.; Brenne, F.; Prashanth, K.G.; Mendes, R.G.; Rümmeli, M.H.; Gemming, T.; Eckert, J.; Scudino, S. Microstructure and mechanical properties of a heat-treatable Al-3.5 Cu-1.5 Mg-1Si alloy produced by selective laser melting. Mater. Sci. Eng. 2018, 711, 562–570. [Google Scholar] [CrossRef]
  45. Kou, S. A criterion for cracking during solidification. Acta Mater. 2015, 88, 366–374. [Google Scholar] [CrossRef]
  46. Roy, G.G.; Elmer, J.W.; DebRoy, T. Mathematical modeling of heat transfer, fluid flow, and solidification during linear welding with a pulsed laser beam. J. Appl. Phys. 2006, 100, 034903. [Google Scholar] [CrossRef]
  47. Eskin, D.G.; Katgerman, L. Thermal contraction during solidification of aluminium alloys. Mater. Sci. Forum 2006, 519, 1681–1686. [Google Scholar] [CrossRef]
  48. Lee, Y.S.; Kirka, M.M.; Dinwiddie, R.B.; Raghavan, N.; Turner, J.; Dehoff, R.R.; Babu, S.S. Role of scan strategies on thermal gradient and solidification rate in electron beam powder bed fusion. Addit. Manuf. 2018, 22, 516–527. [Google Scholar] [CrossRef]
  49. Hovig, E.W.; Holm, H.D.; Sørby, K. Effect of processing parameters on the relative density of AlSi10Mg processed by laser powder bed fusion. In Advanced Manufacturing and Automation VIII; Springer: Singapore, 2018; pp. 268–276. [Google Scholar]
  50. Bertoli, U.S.; Wolfer, A.J.; Matthews, M.J.; Delplanque, J.P.; Schoenung, J.M. On the limitations of volumetric energy density as a design parameter for selective laser melting. Mater. Des. 2017, 113, 331–340. [Google Scholar] [CrossRef] [Green Version]
  51. Tian, J.; Huang, Z.; Qi, W.; Li, Y.; Liu, J.; Hu, G. Dependence of microstructure, relative density and hardness of 18Ni-300 maraging steel fabricated by selective laser melting on the energy density. In Advances in Materials Processing; Springer: Singapore, 2018; pp. 229–241. [Google Scholar]
  52. Hann, D.B.; Iammi, J.; Folkes, J. A simple methodology for predicting laser-weld properties from material and laser parameters. J. Phys. D Appl. Phys. 2011, 44, 445401. [Google Scholar] [CrossRef]
  53. Popčević, P.; Smontara, A.; Ivkov, J.; Wencka, M.; Komelj, M.; Jeglič, P.; Vrtnik, S.; Bobnar, M.; Jagličić, Z.; Bauer, B.; et al. Anisotropic physical properties of the Al13Fe4 complex intermetallic and its ternary derivative Al13(Fe, Ni)4. Phys. Rev. B 2010, 81, 184203. [Google Scholar] [CrossRef]
  54. Martin, J.H.; Yahata, B.D.; Hundley, J.M.; Mayer, J.A.; Schaedler, T.A.; Pollock, T.M. 3D printing of high-strength aluminium alloys. Nature 2017, 549, 365–369. [Google Scholar] [CrossRef]
  55. Tan, Q.; Yin, Y.; Fan, Z.; Zhang, J.; Liu, Y.; Zhan, M.X. Uncovering the roles of LaB6-nanoparticle inoculant in the AlSi10Mg alloy fabricated via selective laser melting. Mater. Sci. Eng. A 2021, 800, 140365. [Google Scholar] [CrossRef]
Figure 1. SEM image showing particle morphology of the studied Al–15% Fe alloy powder.
Crystals 11 00320 g001
Figure 2. (a) The laser powers (P) and laser scan speeds (v) applied in the present study. (be) Representative photographs of (b) crack-free sample under 128 W–0.4 m·s−1, (c) cracked sample under 110 W–1.4 m·s−1, (d) uncondensed sample under 50 W–1.4 m·s−1, and (e) melt flow sample under 170 W–0.6 m·s−1.
Crystals 11 00320 g002
Figure 3. Backscattered electron images showing microstructures of laser powder bed fusion (L-PBF)-built Al–15%Fe alloy samples built under (a,b) 128 W–0.4 m·s−1 and (c,d) 77 W–0.8 m·s−1.
Crystals 11 00320 g003
Figure 4. (a) Low-magnification and (b) high-magnification SEM images showing the microstructure around melt pool boundaries in an L-PBF-built sample under 128 W–0.4 m·s−1.
Crystals 11 00320 g004
Figure 5. Densities of Al–15%Fe alloy samples built under different laser powers (P) and scan speeds (v).
Crystals 11 00320 g005
Figure 6. (a) Change in the melt pool depth of L-PBF-built Al–15%Fe alloy samples depending on the laser condition. (b,c) Melt pool morphologies observed on the surface of samples built under (b) 128 W–0.4 m·s−1 and (c) 77 W–0.4 m·s−1.
Crystals 11 00320 g006
Figure 7. (a,b) Change in Vickers hardness (HV1 and HV0.2) of the samples measured at two different loads of (a) 9.8 N and (b) 1.96 N. (c,d) Representative SEM images showing indents on the sample surface under (c) 9.8 N and (d) 1.96 N.
Crystals 11 00320 g007
Figure 8. Laser power (P) and scan speed (v) for manufacturing the Al–15%Fe alloy samples with high relative densities above 95%, together with the process windows for manufacturing other alloy samples reported in the literature [16,17,18,20,24,27,30].
Crystals 11 00320 g008
Figure 9. Backscattered electron images showing cracks propagate (a) along melt pool boundaries or around the coarsened Al-Fe intermetallic phases (b) in L-PBF-manufactured Al–15%Fe alloy sample under 128 W-0.7 m·s−1.
Crystals 11 00320 g009
Figure 10. Melt pool depth as functions of (a) the volumetric energy density (E) and (b) P·v−1 based on the deposited energy density.
Crystals 11 00320 g010
Figure 11. Relative density as functions of (a) the volumetric energy density (E) and (b) P·v−1 based on the deposited energy density.
Crystals 11 00320 g011
Figure 12. Vickers hardness values of the L-PBF built Al–15%Fe alloy samples measured at (a) 1.96 N and (b) 9.8 N. The data are plotted as a function of P·v–1/2 based on the deposited energy density.
Crystals 11 00320 g012
Table 1. Composition of raw Al–15%Fe alloy powder.
ElementSiFeCuMnMgZrZnOAl
Content (mass%)0.0915.20.010.020.030.010.040.29Bal.
Table 2. Laser powder and scan speed applied for fabricating Al–15%Fe samples.
ParameterValue
Laser power (P)50, 77, 80, 89, 102, 110, 115, 128, 140, 170 W
Scan speed (v)0.4, 0.5, 0.6, 0.7, 0.8, 1.0, 1.2, 1.4 m·s−1
Publisher’s Note: MDPI stays neutral with regard to jurisdictional claims in published maps and institutional affiliations.

